Abstract
The synergistic pollution of fine particulate matter (PM2.5) and ozone (O3) has become one of the major factors affecting ambient air quality. Due to the unique geographical location of the Sichuan Basin, air pollution is more likely to occur. To assess the synergistic pollution status of PM2.5 and O3 in the Sichuan Basin, this study analyzed time series analysis, correlation analysis, and interaction analysis of PM2.5 and O3 based on hourly data from national monitoring stations in the Sichuan Basin from 2015 to 2024. Additionally, the approximate envelope method (AEM) was used to estimate the secondary PM2.5 concentration. The results showed the following: Chongqing, Zigong, Luzhou, Chengdu, and Deyang experienced severe pollution. From 2015 to 2018, these cities showed high pollution levels. Since 2019, such high levels of pollution have not been observed; during the PM2.5 pollution period (November to January of the following year), PM2.5 and O3-8h exhibited a negative correlation. During the O3-8 pollution period (May to August), PM2.5 and O3-8h showed a positive correlation; secondary PM2.5 increased with the intensity of photochemical reactions, while the concentration of primary PM2.5 showed little change compared to secondary PM2.5. Secondary PM2.5 concentrations peaked around 8:00–12:00 and reached a trough between 16:00 and 20:00 in all five cities; during the PM2.5 pollution period, the trend of O3 in the five cities was consistent. Ozone concentration showed a distinct single-peak daily variation under different PM2.5 pollution levels. As PM2.5 concentration increased, the peak O3 concentration decreased, and the valley concentration became lower. In different seasons, the increase in PM2.5 concentration can both enhance and suppress the concentration of O3. The enhanced atmospheric photochemical activity level promotes the formation of secondary components in particles. This achievement can provide a reference for the coordinated control and improvement of air quality in the Sichuan Basin.
1. Introduction
Since the implementation of the “Air Pollution Prevention and Control Action Plan” in 2013, the concentration of ambient PM2.5 in China has significantly decreased. However, tropospheric O3 has remained on a steady upward trend [1,2,3,4]. To further strengthen air pollution control in the country, the Ministry of Ecology and Environment issued the “Three-Year Action Plan to Win the Blue Sky Defense War” in 2018. During the 2018–2020 period, PM2.5 levels continued to decline [5,6], and O3 saw a nationwide decrease for the first time in 2020. However, an anomaly was observed in the first half of 2022, and the air pollution situation in China remains severe.
In recent years, the issue of synergistic pollution between PM2.5 and O3 has attracted widespread attention. There are complex interactions between the two pollutions, including photochemical reactions and heterogeneous reactions [7,8,9]. O3, due to its strong oxidizing nature, stimulates the formation of secondary components in PM2.5, while PM2.5 affects O3 concentrations by altering photolysis rates, cloud optical thickness, and heterogeneous reaction processes [10,11,12,13]. Many scholars have studied the pollution characteristics and interactions between PM2.5 and O3. Lee et al. [14] found that a high positive correlation between O3 and PM2.5 was observed in summer (June to August), whereas the correlation was negative in winter (January to February and December). Yang et al. [15] also found that in the Xinglong area, O3 and PM2.5 concentrations showed a certain positive correlation in summer. From this, it can be inferred that during the high-temperature period of summer when atmospheric oxidizing capacity increases, PM2.5 in the atmosphere undergoes a series of chemical reactions with O3 and other substances under sunlight during the photoaging process. This generates secondary PM2.5, further increasing the mass concentration and complexity of PM2.5. Zhu et al. [16] showed that in most regions and seasons in China, the concentration of PM2.5 is positively correlated with O3 concentration, but in winter, this correlation is mainly negative in North China. In winter, the solar radiation is weak, and the photolysis rate decreases, which suppresses photochemical reactions, such as the key reactions for O3 formation. Since the photoaging process relies on sunlight-driven chemical reactions, the impact of photoaging on PM2.5 is weaker in winter. This indirectly reduces the generation of O3. Xiao et al. [17] reported that from 2013 to 2019, there were 94 days of PM2.5-O3 compound pollution in Tianjin, showing a yearly declining trend. It was also observed that during the periods of compound pollution days from 2013 to 2019, when the hourly concentration of PM2.5 was between 75 μg/m3 and 85 μg/m3, the peak hourly concentration of O3 appeared within the range of 301–326 μg/m3.
PM2.5 can be categorized into primary PM2.5 and secondary PM2.5. Primary PM2.5 is directly emitted into the atmosphere from various sources, while secondary PM2.5 is not directly emitted but is formed in the atmosphere through chemical reactions. The main processes include the conversion of gases (sulfur dioxide (SO2), nitrogen oxides (NOx), and volatile organic compounds (VOCs) into particulate matter (aerosols), such as sulfates (SO42⁻), nitrates (NO3⁻), and organic aerosols [18]. Chang et al. [19] analyzed the daily variation patterns of PM10 in Taipei City under different daily maximum 8 hr averages (MDA8) from 1994 to 2003. To evaluate the formation of secondary aerosols under different ozone levels, they established the “CO tracer method,” using CO as a tracer for primary aerosols and MDA8 as an indicator of photochemical activity. Jia et al. [20] analyzed the air pollutant measurement data from Nanjing, East China, from 2013 to 2015, and found that the enhancement of atmospheric oxidation could promote the formation of secondary particles, with secondary particles contributing up to 26.76% to the environmental PM2.5 levels. Du et al. [21] analyzed the concentration and variation characteristics of secondary PM2.5 under different PM2.5 pollution levels in Chengdu during the winters of 2015–2018, based on air quality monitoring data. The Approximate Envelope Method (AEM) was used to estimate the secondary PM2.5 concentrations. The results showed that under light pollution, moderate pollution, and heavy pollution conditions, secondary PM2.5 concentrations accounted for 56.3%, 63.6%, and 67.4% of the total PM2.5, respectively. The secondary PM2.5 concentration increased year by year, while the primary PM2.5 concentration showed a significant decreasing trend. Liu et al. [22] utilized AEM to estimate secondary PM2.5 concentrations in the Beijing–Tianjin–Hebei region for varying degrees of composite pollution from 2015 to 2022. The results showed that as the intensity of compound pollution increased, the proportion of secondary PM2.5 also significantly rose. These studies indicate that the “CO tracer method” has become an effective way to estimate secondary PM2.5 concentrations. Although many scholars have calculated secondary PM2.5 in different cities, studies on the entire year and continuous years in some cities of the Sichuan Basin are still limited.
The Sichuan Basin region has unique geographical characteristics, with high mountains surrounding it and a flat central area, which leads to poor air circulation and makes it prone to stable weather conditions. These conditions facilitate the accumulation of pollutants, resulting in severe PM2.5 and O3 pollution and the presence of synergistic pollution [23,24,25]. Therefore, this study utilizes environmental air quality monitoring data from the Sichuan Basin between 2015 and 2024 to analyze the pollution characteristics and interactions of PM2.5 and O3, and to estimate the concentrations and changing trends of primary and secondary PM2.5.
2. Materials and Methods
2.1. Data Sources
This study selected hourly datasets for CO, PM2.5, and O3-8h (daily maximum 8 h average) from 22 cities in the Sichuan Basin from 2015 to 2024. The number of available national control monitoring sites in the Sichuan Basin from 2015 to 2024 is 126, 121, 129, 128, 126, 127, 149, 156, 152, 154, respectively. The data were processed using R programming language. The data were sourced from the National Urban Air Quality Real-time Release Platform (https://air.cnemc.cn:18014/ (accessed on 1 October 2024)). The unit for CO is mg/m3, and the units for PM2.5 and O3-8h are μg/m3. The daily average for PM2.5 and CO refers to the arithmetic mean of the 24 h average concentration of a day, the monthly average refers to the arithmetic mean of daily average concentrations over a month, the seasonal average refers to the arithmetic mean of daily average concentrations over a season, and the annual average refers to the arithmetic mean of daily average concentrations over a year (since there is no annual average in the environmental air quality standard, the O3 daily maximum 8 h average is used to assess O3 pollution status) [26]. The secondary standard concentrations for PM2.5 on a daily and annual basis are 75 μg/m3 and 35 μg/m3, respectively. The O3 daily maximum 8 h average is the maximum of all 8 h rolling average concentrations from 8:00 to 24:00 within a natural day (MDA8) [27], and the seasonal and annual averages are evaluated using the 90th percentile of the O3 daily maximum 8 h average. According to extensive literature review and the selection criteria outlined in the “Environmental Air Quality Standards” (GB 3095-2012) and “Technical Regulation on Ambient Air Quality Assessment (Trial Implementation)” (HJ 663-2013), quality control was conducted as follows: (1) Null values and records with PM2.5 > 900 μg/m3 in the original data were marked as missing. (2) For calculating the daily average at a station, if a station’s data for the entire day contains fewer than 20 data points, that day’s data were considered invalid and removed; for calculating the monthly average, there must be at least 27 daily averages in a month (with at least 25 daily averages in February); for calculating the annual average, there must be at least 324 daily averages within a year. The spatial distribution map of the Sichuan Basin is shown in Figure 1:
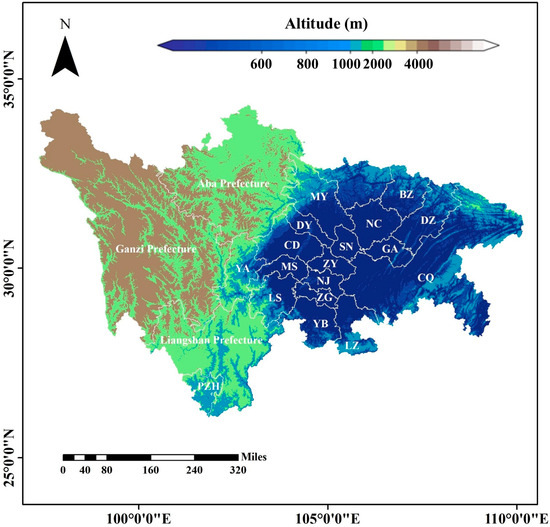
Figure 1.
Spatial distribution map of 22 cities in the Sichuan Basin (CQ-Chongqing, CD-Chengdu, ZG-Zigong, PZH-Panzhihua, LZ-Luzhou, DY-Deyang, MY-Mianyang, GY-Guangyuan, SN-Suining, NJ-Neijiang, LS-Leshan, NC-Nanchong, MS-Meishan, YB-Yibin, GA-Guangan, DZ-Dazhou, YA-Yaan, BZ-Bazhong, ZY-Ziyang, Aba Prefecture–Aba Tibetan and Qiang Autonomous Prefecture, Ganzi Prefecture–Ganzi Tibetan Autonomous Prefecture, Liangshan Prefecture–Liangshan Yi Autonomous Prefecture).
2.2. Pollution Interval Classification
Referring to the “Technical Regulation on Ambient Air Quality Assessment (Trial Implementation) (HJ 663-2013)” and the “Environmental Air Quality Standards (GB 3095-2012)”, the pollution intervals for PM2.5 and O3-8h are classified into 12 intervals, as shown in Table 1. MDA8 is used as an indicator of photochemical activity levels [28], which can be divided into four grades: low photochemical level (MDA8 ≤ 100 µg·m⁻3), light photochemical level (100 µg·m⁻3 < MDA8 ≤ 160 µg·m⁻3), moderate photochemical level (160 µg·m⁻3 < MDA8 ≤ 200 µg·m⁻3), and heavy photochemical level (MDA8 > 200 µg·m⁻3). The annual evaluation of O3 is based on the 90th percentile of MDA8 (MDA8-90).

Table 1.
The PM2.5 and O3-8h pollution intervals are divided into 12 ranges.
2.3. AEM
This study uses MDA8 as an indicator of photochemical activity to estimate the formation of secondary PM2.5 under different photochemical conditions. Meanwhile, CO is used as a tracer for primary PM2.5 emissions, assuming that the structure of these primary emission sources remains largely unchanged [19]. By analyzing these data, we aim to better understand the trends in secondary PM2.5 changes and their relationship with photochemical reactions. Under this assumption, the larger the ratio of PM2.5 concentration to CO concentration, the greater the proportion of secondary components in PM2.5 [29]. When the MDA8 at a monitoring station is ≤ 100 µg·m⁻3 (low photochemical level), the observed PM2.5 concentration is considered to be primary PM2.5. When the MDA8 at a monitoring station is >100 µg·m⁻3 (including light, moderate, and heavy photochemical levels), the CO concentration at that station under such photochemical conditions is multiplied by the PM2.5/CO ratio at the light photochemical level to estimate the primary PM2.5 concentration under those photochemical conditions. Since the emission characteristics may vary at different times, an envelope estimation is performed every 3 h. CO concentrations are grouped into ranges of 0.5–0.7, 0.7–0.9, 0.9–1.1, 1.1–1.3, 1.3–1.5, and 1.5–1.7 mg/m3. For each group, the three smallest PM2.5 concentrations and their corresponding CO concentrations are averaged, and the average ratio is taken as the Rp for that 3 h period [21].
In the equation: h represents the hour, X represents the light, moderate, and heavy chemical reaction levels, is the primary PM2.5 concentration, is the secondary PM2.5 concentration, and is the observed data value.
3. Results and Discussion
3.1. Annual Variation Trends of PM2.5 and O3-8h Pollution
According to the PM2.5 and O3-8h pollution concentrations in five cities in the Sichuan Basin, the pollution is divided into 12 intervals as shown in Figure 2. The figures for the other 17 cities (Figures S1–S17) are provided in the attachment. Among these 22 cities, Chongqing, Zigong, Luzhou, Chengdu, and Deyang experience more severe pollution, which is similar to the findings of Gao et al. [30]. High concentration areas of PM2.5 and O3 in the Sichuan Basin are located in Chengdu, Deyang, Zigong, Dazhou, and the Chengdu Plain, centered around Chengdu. Aba Tibetan and Qiang Autonomous Prefecture and Ganzi Tibetan Autonomous Prefecture have the lightest pollution, with the highest number of days in the concentration range of PM2.5 ≤ 35 μg/m3 and O3 ≤ 100 μg/m3. This is consistent with the findings of Zhao et al. [31]. This is mainly due to the mountainous terrain, forests, and grasslands in these two regions, with relatively low population density, located far from heavy industrial zones and large cities, thus being less affected by pollution caused by industrialization. A common characteristic of Chongqing, Zigong, Luzhou, Chengdu, and Deyang is the higher number of days with pollution in the concentration range of PM2.5 > 75 μg/m3 and 160 < O3 ≤ 200 μg/m3; PM2.5 > 75 μg/m3 and O3 > 200 μg/m3 from 2015 to 2018. Since 2019, such high levels of pollution have not been observed, which is closely related to the “Three-Year Action Plan to Win the Blue Sky Defense War” issued in 2018. In Chengdu, the concentration range of PM2.5 > 75 μg/m3 and O3 ≤ 100 μg/m3 showed a consistent decrease from 2015 to 2024, indicating significant improvement in PM2.5 levels. However, O3 concentrations did not show improvement, which is consistent with the findings of Dun et al. [32].
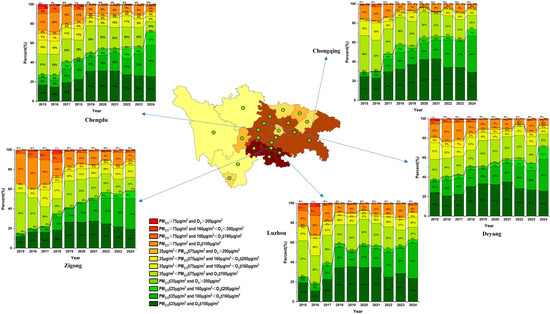
Figure 2.
Changes in the interval ranges of five cities in the Sichuan Basin from 2015 to 2024. (The percentages on the chart represent the ratio of the number of days in each pollution interval to the total number of days). The specific values from the figure have been placed in Table S1 of the attachment.
3.2. Correlation Between PM2.5 and O3-8h
In Figure 3a, the correlation between PM2.5 and O3-8h during PM2.5 pollution periods (November to January) is shown, with a negative correlation (r = −0.18, passing the significance test at the 0.05 level). This finding is consistent with the results of Kang et al. [33]. The primary reasons for this phenomenon relate to two aspects: first, the accumulation of PM2.5 concentrations can absorb solar radiation reaching the Earth’s surface, and the lower temperatures in winter slow down photochemical reactions, leading to reduced O3 formation [34]; on the other hand, in cold winter conditions, if pollution sources release excessive NO, these NO molecules will react with O3 in the air, generating NO2 and other byproducts, which significantly reduces O3 concentrations [35].
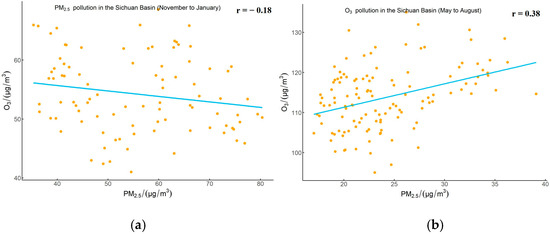
Figure 3.
Correlation between PM2.5 and O3 in the Sichuan Basin during the PM2.5 pollution period (a) and O3 pollution period (b) from 2015 to 2024.
In Figure 3b, the correlation between PM2.5 and O3-8h during O3 pollution periods (May to August) is depicted, showing a positive correlation (r = 0.38, passing the significance test at the 0.05 level). This indicates that during the O3 pollution period (May to August), PM2.5 and O3 co-pollution are in the same increasing and decreasing phase. Compared to the PM2.5 pollution period, the correlation during O3 pollution periods is stronger and is positive, which is consistent with the findings of Zhang et al. [36]. Their study showed that from 2013 to 2017, Xuzhou experienced positive correlations between PM2.5 and O3 during summer monsoon seasons and negative correlations during winter monsoon seasons. Jia et al. [20] also studied the correlation between PM2.5 and O3 in Nanjing and found a positive correlation between PM2.5 and O3 during the summer (R = 0.40 moderate correlation). This is mainly because during the O3 pollution period, high temperatures combined with large-scale emissions of precursor substances such as VOCs and NOx trigger intense photochemical reactions. This not only increases the level of O3 in the air but also enhances the overall oxidative capacity of the atmosphere, creating an environment conducive to the formation of secondary PM2.5 particles, which also helps to increase O3 concentrations, ultimately leading to the synergistic increase in both PM2.5 and O3 concentrations [37].
In winter, the high PM2.5 concentrations in the Sichuan Basin are mainly caused by the following factors: 1. Basin Topography: The Sichuan Basin is surrounded by mountains, forming a relatively closed terrain structure that easily leads to the accumulation of pollutants within the basin, making it difficult for them to disperse. 2. Industrial Emissions: SO2 and NOx emitted from industrial activities chemically react in the atmosphere to form sulfates and nitrates, significantly increasing the concentration of PM2.5. 3. Coal-fired Power Plants and Industrial Boilers: In the southern Sichuan region, coal-fired power plants and industrial boilers make particularly significant contributions to PM2.5 levels. 4. Vehicle Exhaust Emissions: Vehicle exhaust is one of the important sources of PM2.5. Nitrogen oxides (NOx) and volatile organic compounds (VOCs) in exhaust fumes rapidly convert into secondary particles under stable and high-humidity conditions. The main sources of high O3 concentrations in the Sichuan Basin during summer are as follows: 1. High Temperature: In summer, higher temperatures and intense solar radiation promote the occurrence of photochemical reactions, accelerating the formation of ozone. 2. Precursor Emissions: Nitrogen oxides (NOx) and volatile organic compounds (VOCs) serve as precursors that generate ozone through complex photochemical reactions. These precursors are emitted from various sources, such as vehicle exhaust, industrial emissions, and natural emissions. 3. Regional Transport: Pollutants in the Chengdu Plain may spread to surrounding cities, while pollutants from southern Sichuan and northeastern Sichuan regions may also be transported into the Chengdu Plain. Due to the topographical characteristics of the Sichuan Basin, the wind speed in this region is relatively low, with average wind speeds from 2015 to 2024 ranging from 2.0 m/s, 2.0 m/s, 2.0 m/s, 2.2 m/s, 2.2 m/s, 2.0 m/s, 2.1 m/s, 2.2 m/s, 2.3 m/s, 2.3 m/s. Therefore, wind speed has a limited impact on air pollution.
3.3. The Effect of O3 on PM2.5
Figure 4 illustrates the daily variations in primary and secondary PM2.5 in five major polluted cities within the Sichuan Basin from 2015 to 2024 under different photochemical levels. As shown in Figure 4 and Table 2, the concentrations of secondary PM2.5 in all five cities increase with the intensity of photochemical reactions, which is consistent with the findings of Liu et al. [38], indicating that enhanced atmospheric oxidizing capacity can promote the formation of secondary PM2.5. Under four different photochemical conditions, while the concentration of primary PM2.5 does not change significantly relative to secondary PM2.5 as photochemical reaction intensity increases, there is a significant increase in secondary PM2.5 concentration. Specifically, at high photochemical levels compared to low photochemical levels, secondary PM2.5 concentrations are 1.2 times, 1.3 times, 1.5 times, 1.5 times, and 1.6 times higher in Chongqing, Chengdu, Zigong, Luzhou, and Deyang, respectively. However, primary PM2.5 concentrations exhibit more pronounced fluctuations as photochemical reaction intensity increases. Under different photochemical levels, Zigong shows the highest concentrations of both primary and secondary PM2.5, while Chongqing exhibits the lowest concentrations for both. The secondary PM2.5 concentrations in the five cities tend to peak between 8:00 and 12:00 and reach a trough between 16:00 and 20:00, which is consistent with the findings of Du et al. [21], who observed that from 2015 to 2018, the secondary PM2.5 concentration in Chengdu reached its maximum from morning to noon under different PM2.5 pollution conditions. The strong sunlight in the morning to noon promotes photochemical reactions, leading to an increase in secondary PM2.5 concentrations, while the lack of sunlight in the afternoon causes a gradual decrease in secondary PM2.5 concentrations.
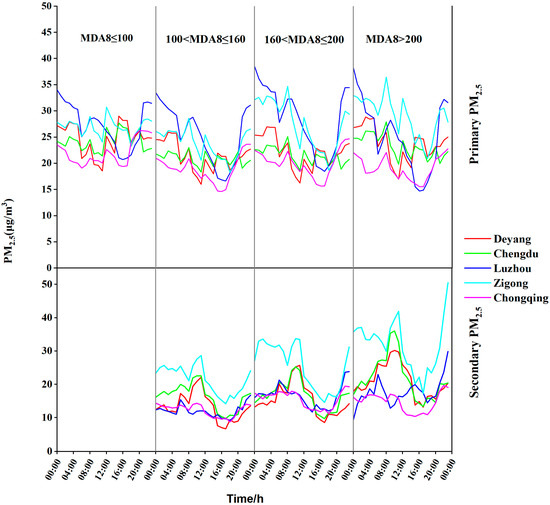
Figure 4.
Daily variations in primary and secondary PM2.5 under different photochemical levels in major polluted cities of the Sichuan Basin.
Table 2.
Primary and secondary PM2.5 concentrations (μg/m3) in five cities from 2015 to 2024 under different photochemical levels.
Figure 5 shows the contribution ratios of primary and secondary PM2.5 in five cities from 2015 to 2024. The general trend observed in these five cities is that the concentration of primary PM2.5 has been increasing year by year, while the concentration of secondary PM2.5 has been decreasing. Moreover, in most years, the concentration of primary PM2.5 is higher than that of secondary PM2.5. This phenomenon is mainly associated with emission sources such as vehicle exhaust, industrial production, construction dust, and coal-fired boilers within urban areas. Between 2015 and 2018, Zigong, Chongqing, Chengdu, and Deyang experienced higher concentrations of secondary PM2.5 compared to primary PM2.5. However, from 2019 to 2024, the concentration of primary PM2.5 surpassed that of secondary PM2.5. This shift can be attributed to China’s later efforts in controlling gaseous precursors in the atmosphere (such as sulfur dioxide, nitrogen oxides, and volatile organic compounds), which has led to a decrease in the formation efficiency of secondary PM2.5 [39].
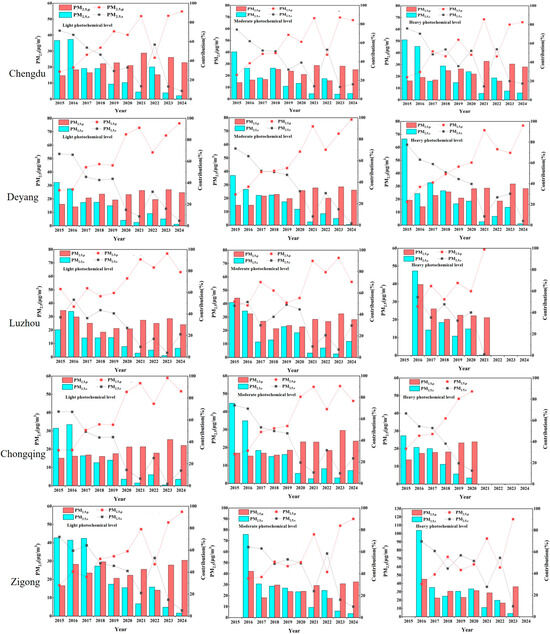
Figure 5.
The concentrations and percentage contributions of primary PM2.5 (PM2.5,p) and secondary PM2.5 (PM2.5,s) in Chengdu, Deyang, Luzhou, Chongqing, and Zigong under different photochemical levels.
3.4. The Effect of PM2.5 on O3
Figure 6 shows the daily variation of O3 concentrations under different PM2.5 pollution levels during PM2.5 pollution periods (November to January of the following year). Under various PM2.5 concentration ranges, the five cities exhibit a clear unimodal structure in O3 concentrations. O3 concentrations are lowest between 8:00 a.m. and 12:00 due to lower sun angles and relatively cooler temperatures, which slow down the rate of ozone formation. As solar radiation intensity increases and temperatures rise, coupled with increased vehicle exhaust emissions during evening rush hours, O3 concentrations begin to increase, peaking between 16:00 p.m. and 20:00 p.m. before gradually decreasing. This observation is similar to the findings of Liu et al. [38]. Among the five cities, as PM2.5 concentrations increase, peak O3 concentrations decrease, and trough concentrations become even lower. This phenomenon is attributed to high PM2.5 concentrations inhibiting the production of O3 [34].
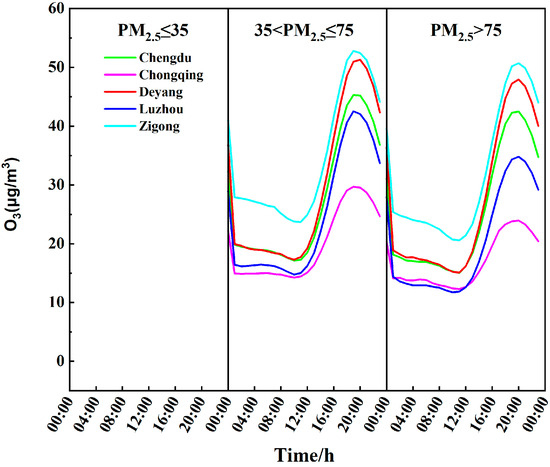
Figure 6.
Daily variation of O3 concentrations in five cities during PM2.5 pollution periods from 2015 to 2024.
4. Conclusions
This study mainly analyzes the pollution characteristics and interactions of PM2.5 and O3 in the Sichuan Basin from 2015 to 2024 and estimates the primary and secondary PM2.5 concentrations. The main conclusions are as follows: (1) According to the PM2.5 and O3-8h pollution concentrations in 22 cities of the Sichuan Basin, the pollution is divided into 12 intervals. Among these cities, Chongqing, Zigong, Luzhou, Chengdu, and Deyang experience more severe pollution. From 2015 to 2018, these cities showed higher pollution levels (PM2.5 > 75 μg/m3 and 160 < O3 ≤ 200 μg/m3; PM2.5 > 75 μg/m3 and O3 > 200 μg/m3), and such high pollution levels have not occurred since 2019. In Chengdu, the concentration range of PM2.5 > 75 μg/m3 and O3 ≤ 100 μg/m3 showed a consistent decrease from 2015 to 2024. (2) During the PM2.5 pollution period (November to January), PM2.5 and O3-8h exhibited a negative correlation. During the O3-8h pollution period (May to August), PM2.5 and O3-8h showed a positive correlation. (3) The secondary PM2.5 concentration increases with the intensity of photochemical reactions, while the primary PM2.5 concentration shows little change compared to the secondary PM2.5 concentration, only exhibiting more pronounced fluctuations as the intensity of photochemical reactions increases. Under different photochemical levels, Zigong has the highest concentrations of both primary and secondary PM2.5, while Chongqing has the lowest concentrations for both. In all five cities, the secondary PM2.5 concentration peaks around 8:00–12:00 and reaches a trough between 16:00 and 20:00. The general trend of the contribution ratio of primary to secondary PM2.5 in the five cities is that the contribution ratio of primary PM2.5 increases year by year, while the contribution ratio of secondary PM2.5 decreases year by year. In most years, the concentration of primary PM2.5 is higher than that of secondary PM2.5. From 2015 to 2018, in Zigong, Chongqing, Chengdu, and Deyang, the secondary PM2.5 concentration was higher than the primary PM2.5 concentration, but from 2019 to 2024, the primary PM2.5 concentration was higher than the secondary PM2.5 concentration. (4) During the PM2.5 pollution period (November to January), the trend in the five cities is consistent. Under different PM2.5 pollution levels, the daily variation of O3 concentration shows a distinct unimodal pattern, with the lowest O3 concentration occurring between 8:00 and 12:00 and the peak occurring between 16:00 and 20:00, after which it gradually decreases. As the PM2.5 concentration increases, the peak O3 concentration decreases, and the valley concentration becomes lower.
This study investigated the long-term synergistic pollution of PM2.5 and O3 and their interaction effects in the Sichuan Basin, achieving certain results. However, there are still areas for improvement. This study only used the CO tracer method to estimate the primary and secondary PM2.5 concentrations, which is not comprehensive enough. In the future, relevant instruments can be used to monitor the concentration and component analysis of secondary PM2.5, and the estimated secondary PM2.5 can be compared with the monitored secondary PM2.5 concentrations.
Supplementary Materials
The following supporting information can be downloaded at: https://www.mdpi.com/article/10.3390/atmos16030329/s1. Figure S1: The proportion of days in 12 intervals for Ziyang City from 2015 to 2024; Figure S2: The proportion of days in 12 intervals for Yibin City from 2015 to 2024; Figure S3: The proportion of days in 12 intervals for Yaan City from 2015 to 2024; Figure S4: The proportion of days in 12 intervals for Suining City from 2015 to 2024. Figure S5: The proportion of days in 12 intervals for Panzhihua City from 2015 to 2024. Figure S6: The proportion of days in 12 intervals for Neijiang City from 2015 to 2024; Figure S7: The proportion of days in 12 intervals for Nanchong City from 2015 to 2024; Figure S8: The proportion of days in 12 intervals for Mianyang City from 2015 to 2024; Figure S9: The proportion of days in 12 intervals for Meishan City from 2015 to 2024; Figure S10: The proportion of days in 12 intervals for Liangshan Yi Autonomous Prefecture from 2015 to 2024; Figure S11: The proportion of days in 12 intervals for Leshan from 2015 to 2024; Figure S12: The proportion of days in 12 intervals for Guangyuan from 2015 to 2024; Figure S13: The proportion of days in 12 intervals for Guangan from 2015 to 2024; Figure S14: The proportion of days in 12 intervals for Tibetan Autonomous Prefecture of Garzê from 2015 to 2024; Figure S15: The proportion of days in 12 intervals for Dazhou from 2015 to 2024; Figure S16: The proportion of days in 12 intervals for Bazhong from 2015 to 2024; Figure S17: The proportion of days in 12 intervals for Aba Tibetan and Qiang Autonomous Prefecture from 2015 to 2024. Table S1: The percentage of polluted days in each of the 12 intervals across the 5 major cities relative to the total number of days.
Author Contributions
Conceptualization, S.L. and J.L.; methodology, S.L. and J.L.; software, S.L., J.G., Y.W. and X.L.; validation, S.L.; formal analysis, S.L.; investigation, Y.W.; resources, J.L.; data curation, S.L.; writing—Original draft preparation, S.L.; writing—review and editing, J.L. and S.L.; visualization, S.L. and Y.W.; supervision, J.L.; project administration, J.L.; funding acquisition, J.L. All authors have read and agreed to the published version of the manuscript.
Funding
This work was supported by the National Key Research and Development Program of China (2023YFC3709302, 2022YFC3703502) and the National Natural Science Foundation of China (No. 42307133).
Institutional Review Board Statement
Not applicable.
Informed Consent Statement
Not applicable.
Data Availability Statement
The air pollutant data for this study were obtained from the National Urban Air Quality Real-time Release Platform (https://air.cnemc.cn:18014/ (accessed on 1 October 2024)).
Conflicts of Interest
The authors declare no conflicts of interest.
Abbreviations
The following abbreviations are used in this manuscript:
| AEM | Approximate Envelope Method |
| MDA8 | Maximum Daily 8-Hour Average |
References
- Xiao, Q.; Geng, G.; Liang, F.; Wang, X.; Lv, Z.; Lei, Y.; Huang, X.; Zhang, Q.; Liu, Y.; He, K. Changes in spatial patterns of PM2.5 pollution in China 2000–2018: Impact of clean air policies. Environ. Int. 2020, 141, 105776. [Google Scholar] [CrossRef] [PubMed]
- Lu, X.; Hong, J.; Zhang, L.; Cooper, O.R.; Schultz, M.G.; Xu, X.; Wang, T.; Gao, M.; Zhao, Y.; Zhang, Y. Severe Surface Ozone Pollution in China: A Global Perspective. Environ. Sci. Technol. Lett. 2018, 5, 487–494. [Google Scholar] [CrossRef]
- Wang, T.; Xue, L.; Brimblecombe, P.; Lam, Y.F.; Li, L.; Zhang, L. Ozone pollution in China: A review of concentrations, meteorological influences, chemical precursors, and effects. Sci. Total Environ. 2017, 575, 1582–1596. [Google Scholar] [CrossRef]
- Zhang, Q.; Zheng, Y.; Tong, D.; Shao, M.; Wang, S.; Zhang, Y.; Xu, X.; Wang, J.; He, H.; Liu, W.; et al. Drivers of improved PM2.5 air quality in China from 2013 to 2017. Proc. Natl. Acad. Sci. USA 2019, 116, 24463–24469. [Google Scholar] [CrossRef]
- Liu, H.; Liu, J.; Li, M.; Gou, P.; Cheng, Y. Assessing the evolution of PM2.5 and related health impacts resulting from air quality policies in China. Environ. Impact Assess. Rev. 2022, 93, 106727. [Google Scholar] [CrossRef]
- Du, L.; Wang, H.; Xu, H. Analysis of spatial-temporal association and factors influencing environmental pollution incidents in China. Environ. Impact Assess. Rev. 2020, 82, 106384. [Google Scholar] [CrossRef]
- Meng, Z.; Dabdub, D.; Seinfeld, J.H. Chemical Coupling Between Atmospheric Ozone and Particulate Matter. Science 1997, 277, 116–119. [Google Scholar] [CrossRef]
- Ravishankara, A.R. Heterogeneous and Multiphase Chemistry in the Troposphere. Science 1997, 276, 1058–1065. [Google Scholar] [CrossRef]
- Dickerson, R.R.; Kondragunta, S.; Stenchikov, G.; Civerolo, K.L.; Doddridge, B.G.; Holben, B.N. The Impact of Aerosols on Solar Ultraviolet Radiation and Photochemical Smog. Science 1997, 278, 827–830. [Google Scholar] [CrossRef]
- Liu, Z.; Wang, H.; Peng, Y.; Zhang, W.; Che, H.; Zhang, Y.; Liu, H.; Wang, Y.; Zhao, M.; Zhang, X. The combined effects of heterogeneous chemistry and aerosol-radiation interaction on severe haze simulation by atmospheric chemistry model in Middle-Eastern China. Atmos. Environ. 2023, 302, 119729. [Google Scholar] [CrossRef]
- Li, M.; Wang, T.; Xie, M.; Li, S.; Zhuang, B.; Huang, X.; Chen, P.; Zhao, M.; Liu, J. Formation and Evolution Mechanisms for Two Extreme Haze Episodes in the Yangtze River Delta Region of China During Winter 2016. J. Geophys. Res. Atmos. 2019, 124, 3607–3623. [Google Scholar] [CrossRef]
- Xing, J.; Wang, J.; Mathur, R.; Wang, S.; Sarwar, G.; Pleim, J.; Hogrefe, C.; Zhang, Y.; Jiang, J.; Wong, D.C.; et al. Impacts of aerosol direct effects on tropospheric ozone through changes in atmospheric dynamics and photolysis rates. Atmos. Chem. Phys. 2017, 17, 9869–9883. [Google Scholar] [CrossRef] [PubMed]
- Huang, X.; Wang, Z.; Ding, A. Impact of Aerosol-PBL Interaction on Haze Pollution: Multiyear Observational Evidences in North China. Geophys. Res. Lett. 2018, 45, 8596–8603. [Google Scholar] [CrossRef]
- Lee, H.K.; Choi, E.L.; Lee, H.J.; Lee, S.Y.; Lee, J.Y. A Study on the Seasonal Correlation between O3 and PM2.5 in Seoul in 2017. J. Korean Soc. Atmos. Environ. 2020, 36, 533–542. [Google Scholar] [CrossRef]
- Yang, J. Study on the Variation of Background Concentration of Atmospheric Pollutants in North China. Master’s Thesis, Nanjing University of Information Science & Technology, Nanjing, China, 2012. [Google Scholar]
- Zhu, J.; Chen, L.; Liao, H.; Dang, R. Correlations between PM2.5 and Ozone over China and Associated Underlying Reasons. Atmosphere 2019, 10, 352. [Google Scholar] [CrossRef]
- Xiao, Z.; Li, Y.; Kong, J.; Li, P.; Cai, Z.; Gao, J.; Xu, H.; Ji, Y.; Deng, X. Characteristics and Meteorological Factors of PM2.5-O3 Compound Pollution in Tianjin. Environ.Sci. 2022, 43, 2928–2936. [Google Scholar] [CrossRef]
- Shi, J.; Liu, S.; Qu, Y.; Zhang, T.; Dai, W.; Zhang, P.; Li, R.; Zhu, C.; Cao, J. Variations of the urban PM2.5 chemical components and corresponding light extinction for three heating seasons in the Guanzhong Plain, China. J. Environ. Manag. 2023, 327, 116821. [Google Scholar] [CrossRef]
- Chang, S.-C.; Lee, C.-T. Secondary aerosol formation through photochemical reactions estimated by using air quality monitoring data in Taipei City from 1994 to 2003. Atmos. Environ. 2007, 41, 4002–4017. [Google Scholar] [CrossRef]
- Jia, M.; Zhao, T.; Cheng, X.; Gong, S.; Zhang, X.; Tang, L.; Liu, D.; Wu, X.; Wang, L.; Chen, Y. Inverse Relations of PM2.5 and O3 in Air Compound Pollution Between Cold and Hot Seasons over an Urban Area of East China. Atmosphere 2017, 8, 59. [Google Scholar] [CrossRef]
- Du, X.X.; Shi, G.M.; Zhao, T.L.; Yang, F.M.; Zheng, X.B.; Zhang, Y.J.; Tan, Q.W. Contribution of Secondary Particles to Wintertime PM2.5 During 2015–2018 in a Major Urban Area of the Sichuan Basin, Southwest China. Earth Space Sci. 2020, 7, e2020EA001194. [Google Scholar] [CrossRef]
- Liu, J.; Xu, Y.; Huang, C.; Liu, R. Characterization of PM2.5-O3 Complex Pollution and Influencing Factors in Beijing-Tianjin-Hebei Region from 2015 to 2022. Environ. Sci. 2024. [Google Scholar] [CrossRef]
- Ning, G.; Yim, S.H.L.; Wang, S.; Duan, B.; Nie, C.; Yang, X.; Wang, J.; Shang, K. Synergistic effects of synoptic weather patterns and topography on air quality: A case of the Sichuan Basin of China. Clim. Dyn. 2019, 53, 6729–6744. [Google Scholar] [CrossRef]
- Yang, J.; Zhao, X.; Tao, Y.; Cheng, X.; Xiao, D.; Zhang, C.; Geng, W. Characteristics of Ozone Weather in Chengdu during Summer of 2016–2019. Res. Environ. Sci 2021, 34, 254–262. [Google Scholar] [CrossRef]
- Lu, N.; Zhang, X.; Kang, P.; Hua, M.; Du, Y.; Chen, J.; Xiang, W.; Lei, Y.; Ou, Y. Objective weather classification and typical process analysis of ozone pollution during spring in Chengdu Plain urban agglomeration. Acta Sci. Circumstantiae 2021, 41, 1610–1627. [Google Scholar] [CrossRef]
- Duan, X.; Cao, N.; Wang, X.; Zhang, Y.; Liang, J.; Yang, S.; Song, X. Characteristics Analysis of the Surface Ozone Concentration of China in 2015. Environ. Sci. 2017, 38, 4976–4982. [Google Scholar] [CrossRef]
- Liu, Y. Research on the Spatiotemporal Distribution Characteristics andInfluencing Factors of Ozone Pollution in China. Master’s Thesis, Dalian University of Technology, Dalian, China, 2021. [Google Scholar]
- Yao, Q.; Yang, X.; Kang, Y.; Fan, W.; Cai, Z.; Han, S. Spatio-temporal Distribution Characteristics of Secondary Aerosol in Beijing-Tianjin-Hebei Urban Agglomeration in Winter. Environ. Sci. Technol. 2023, 44, 2421–2429. [Google Scholar] [CrossRef]
- Li, Q.; Deng, J.; Li, G.; Abula, T.; LIU, J.; Deng, S. Analysis of synergistic effects of secondary PM2.5 and O3 in Guanzhong urban cluster. Acta Sci. Circumstantiae 2024, 44, 62–73. [Google Scholar] [CrossRef]
- Gao, Y.; Luo, J.; Wang, X.; Hou, T.; Yu, H.; Tang, D. Spatial and Temporal Evolution and Distribution Characteristics of Air Quality in Sichuan Basin in recent years. Environ. Sci. Surv. 2023, 42, 48–52. [Google Scholar] [CrossRef]
- Zhao, S.; Yu, Y.; Yin, D.; Qin, D.; He, J.; Dong, L. Spatial patterns and temporal variations of six criteria air pollutants during 2015 to 2017 in the city clusters of Sichuan Basin, China. Sci. Total Environ. 2018, 624, 540–557. [Google Scholar] [CrossRef]
- Meng, D.; Zhicun, X.; Wu, L.; Yang, Y. Predict the particulate matter concentrations in 128 cities of China. Air Qual. Atmos. Health 2020, 13, 399–407. [Google Scholar] [CrossRef]
- Kang, P.; Hou, J.; Feng, H.; Zhang, X.; Zeng, S.; Zheng, G. Study on the characteristics and interaction of PM2.5 and O3 combined pollution in Chengdu. Acta Sci. Circumstantiae 2022, 42, 80–90. [Google Scholar] [CrossRef]
- Shao, P.; Xin, J.; An, J.; Wang, J.; Wu, F.; Ji, D.; Wang, Y. An Analysis on the Relationship between Ground-Level Ozone and Particulate Matter in an Industrial Area in the Yangtze River Delta during Summer Time. Chin. J. Atmos. Sci. 2017, 41, 618–628. [Google Scholar] [CrossRef]
- Tie, X.; Madronich, S.; Walters, S.; Edwards, D.P.; Ginoux, P.; Mahowald, N.; Zhang, R.; Lou, C.; Brasseur, G. Assessment of the global impact of aerosols on tropospheric oxidants. J. Geophys. Res. Atmos. 2005, 110, D03204. [Google Scholar] [CrossRef]
- Zhang, Y.; Zhao, T.; Ying, C.; Wang, Z.; Ge, B.; Liu, D.; Du, X. Seasonal variation of the relationship between surface PM2.5 and O3 concentrations in Xuzhou. China Environ. Sci. 2019, 39, 2267–2272. [Google Scholar] [CrossRef]
- Wu, M.; Cheng, C.; Huang, B.; Li, M.; Chen, D. Impact of Differents in the Concentrations of Ozone on the Chemical Composition of Single Particles. Environ. Sci. 2020, 41, 2006–2016. [Google Scholar] [CrossRef]
- Liu, Y.; Hou, J.; Kang, P.; Xiu, M.; Jian, J.; Chen, J.; Wu, Q. Characteristics and interaction of PM2.5 and O3 complex pollution in Sichuan Basin. Acta Sci. Circumstantiae 2024, 44, 42–53. [Google Scholar] [CrossRef]
- Li, C.; Feng, C.; Sun, R. Analysis on Compound Pollutant Characteristics of PM2.5 and O3 in Xuzhou from 2019 to 2023. Sichuan Environ. 2024, 43, 7–14. [Google Scholar] [CrossRef]
Disclaimer/Publisher’s Note: The statements, opinions and data contained in all publications are solely those of the individual author(s) and contributor(s) and not of MDPI and/or the editor(s). MDPI and/or the editor(s) disclaim responsibility for any injury to people or property resulting from any ideas, methods, instructions or products referred to in the content. |
© 2025 by the authors. Licensee MDPI, Basel, Switzerland. This article is an open access article distributed under the terms and conditions of the Creative Commons Attribution (CC BY) license (https://creativecommons.org/licenses/by/4.0/).