Article

Cross-Examination of Reanalysis Datasets on Elevation-Dependent Climate Change in the Third Pole Region

Institute for Atmospheric and Environmental Sciences, Goethe University Frankfurt, 60438 Frankfurt, Germany
*
Author to whom correspondence should be addressed.
Atmosphere 2025, 16(3), 327; https://doi.org/10.3390/atmos16030327
Submission received: 20 February 2025 / Revised: 10 March 2025 / Accepted: 11 March 2025 / Published: 13 March 2025
(This article belongs to the Section Climatology)

Abstract

:
The scarcity of in situ observation stations and the unreliability of long-term satellite data necessitate the use of reanalysis datasets to study elevation-dependent climate change (EDCC) in the third pole (TP) region. We analyzed elevation-dependent temperature and precipitation patterns over TP using the ECMWF Atmospheric Reanalysis Fifth Generation (ERA5), a global reanalysis product with coarse resolution, along with three high-resolution regional reanalysis datasets that cover our study domain: Indian Monsoon Data Assimilation and Analysis (IMDAA), High Asia Refined Analysis—Version 2 (HAR-v2), and Tibetan Plateau Regional Reanalysis (TPRR). Comparing the performance of the four reanalysis datasets in capturing EDCC over TP is crucial, as these datasets provide spatially and temporally consistent data at an optimum resolution that greatly aids EDCC research. Our study results reveal the following: (1) A positive elevation-dependent warming trend is observed across all four datasets in winter and autumn, with varying magnitudes of warming across the datasets. (2) All four datasets exhibit positive elevation-dependent wetting trends in all seasons, except autumn. These are primarily driven by pronounced drying trends at lower elevations and relatively minimal changes in precipitation trends at higher elevations. (3) ERA5 and IMDAA exhibit similar results in capturing elevation-dependent climate change, whereas the TPRR dataset reveals more extreme and unique features in temperature trends compared to the other three datasets. HAR-v2 shows smaller variations in temperature and precipitation trends across different elevations and seasons, in contrast to the other three datasets. While all reanalysis datasets indicate EDCC in the TP, their varying degrees of seasonal and spatial differences underscore the need for a careful evaluation before using them as reference data. Comparison of reanalysis datasets with available observational records, such as in situ measurements and satellite data, over overlapping spatial and temporal domains is essential to assess their quality. This evaluation can help identify the most suitable reanalysis dataset, or combination of datasets, to serve as reliable a reference even in regions or periods without observational data.

1. Introduction

Mountains are considered climate change hotspots due to their enhanced sensitivity towards the changing climate and their effect on the cryosphere, biosphere, atmosphere, and hydrosphere [1]. A study by Byrne et al. [2] from 1959 to 2014 over tropical and subtropical regions, utilizing the HadCRUT-observational dataset, reanalysis datasets (ERA5), and numerical models (CMIP6), showed that elevated land surfaces warm faster than non-elevated ones. The systematic difference in warming rate with elevation is known as elevation-dependent warming (EDW), and it does not imply that the warming rate will always be higher in the mountains than in the lowlands [3,4]. EDW and potential outcomes of the process, such as rapid upward shifts in freezing level height (FLH) causing changes in the snow line, increasing intensity of extreme precipitation, and mountains causing floods, landslides, and lake outbursts in mountain areas, decline in low-elevation snow-depth and the seasonal extent in mountains is discussed in the most recent assessment report (AR-6) of the Intergovernmental Panel on Climate Change (IPCC) [5]. The future changes in mountain temperature with respect to atmospheric carbon diaxoide ( CO 2 ) perturbation suggest that there is a higher temperature response under higher CO 2 concentration levels [6].
Rangwala and Miller [3] analysed studies on the seasonal and annual average temperature of the four high mountain ranges of the world (Swiss Alps, Colorado Rocky Mountains, Tibetan Plateau, and Tropical Andes) and the corresponding hemispheric land temperature. The Swiss Alps consistently exhibit a higher warming rate compared to the daily average temperature trend of the Northern Hemisphere (Land) throughout the study period, except for the autumn season. In contrast, only the Tibetan Plateau exhibits a higher warming rate than the reference—that is, the corresponding hemisphere (Land) temperature in autumn. The Colorado Rocky Mountains experience their highest warming rate during spring, whereas the Tibetan Plateau shows a lower warming rate than the reference during spring. The study, largely based on observational data, suggests a strong seasonality in the elevation-dependent response of mountain regions along with specific spatial and temporal conditions. Ferguglia et al. [7] studied the elevation-dependent precipitation patterns over four mountain regions of the world (the Tibetan Plateau, the Greater Alpine Region, the Rocky Mountains, and the Andes) using the ERA5 dataset. Their research concluded that there is a positive elevation gradient for precipitation including extreme precipitation events with elevation for precipitation across diverse geographical areas.
The Tibetan Plateau and surrounding mountainous areas, commonly referred to as the third pole (TP), with an average elevation of about 4 km, are also known as the Asian Water Tower. This distinction arises from the fact that most of Asia’s main rivers originate from this region, serving as a freshwater source for more than 1.4 billion people [8,9]. The unique orographic structure and the temporal and spatial distribution of heating fields play a pivotal role in influencing atmospheric circulation patterns of global and regional climate systems. Some of the effects of TP on atmospheric circulations include the splitting of westerlies into two branches during winter and the occurrence of a large warm-core anticyclone in the upper troposphere over the Plateau [10,11]. The hydrological cycles of both the TP and downstream regions are susceptible to changes in evaporation, precipitation patterns, surface water balance, and glacier melting in the TP. These changes have a direct impact on the local population [12,13].
Studies over TP using observational data [3,14,15] have shown that the average yearly warming trend across TP is greater than that of the Northern Hemisphere and the same latitudinal zones. Using data from 77 observation stations over 1971–2000, Wu et al. [16] discovered that annual precipitation had increased by 1.20 mm/year with a geographic difference ranging from −5.85 mm to 8.45 mm/year in this region. Stations in the southern plateau show a wetting trend, while stations in the northern plateau, particularly those in the source of the Three River Area, show a drying tendency according to this study. The sparsity and spatial–temporal discontinuities of observation stations, particularly in the north and western TP and at high elevations, make the research in this domain challenging [17,18]. For capturing precipitation, complex orography and solid-state precipitation cause issues even for satellite products [17]. According to AR6 from the IPCC, warming in mountain regions exceeds the global mean temperature by 1.5 times [5], highlighting a significant disparity when compared to non-mountainous regions at similar latitudes. However, accurately capturing these intricate elevation-driven climate variations poses challenges in contemporary climate modelling and reanalysis datasets.
This study aims to address these challenges by examining four prominent reanalysis datasets—ERA5, IMDAA, HAR-v2, and TPRR within the CPTP (Convection-Permitting Third Pole) project from the CORDEX FPS (Coordinated Regional Downscaling Experiment—Flagship Pilot Studies) Domain 1, covering the Tibetan Plateau and adjoining mountainous terrains from 1988 to 2020. Specifically, the focus lies in identifying biases in temperature and precipitation trends of the four reanalysis datasets by including the influences of snow depth, albedo, and elevation. With elevations ranging from large peaks to wide high-altitude plateaus, it is relevant to study elevation-dependent climate change (EDCC) over the TP by extending EDW studies to encompass broader climate variables, processes, and mechanisms in higher elevations [4,7].

2. Data and Methods

In this study, we utilized four reanalysis datasets—ECMWF atmospheric reanalysis fifth generation (ERA5), Indian Monsoon Data Assimilation and Analysis (IMDAA), the High Asia Refined Analysis version 2 (HAR-v2), and Tibetan Plateau Regional Reanalysis (TPRR)—to compare their representation of EDCC over the third pole during 1988–2020. A short summary of the four reanalysis datasets is given in Table 1. Additionally, we incorporated NOAA’s Earth Topography (ETOPO) 2022 and the Hadley Centre Integrated Surface Database (HadISD) observation dataset for further comparison. Trend analysis and principal component analysis (PCA) are the key methods for comparing how the datasets capture EDCC. The Pettitt test is applied to identify the main shifts in temporal trends and determine the study period. To account for elevation effects, we incorporated elevation bands and EDCC indices.

2.1. ETOPO 2022

NOAA’s Earth Topography (ETOPO) 2022 is available at 30 arc-second (~1 km) spatial resolution, providing bare-earth elevation estimates after buildings and forests have been removed (Last Access on 29 January 2025; https://www.ncei.noaa.gov/products/etopo-global-relief-model). ETOPO is widely used in the scientific community because of its high spatial resolution and reliability due to its integration of various datasets [19,20].

2.2. ERA5

The ECMWF atmospheric reanalysis fifth generation (ERA5) dataset was developed by Copernicus Climate Change Service (C3S) at ECMWF. This global dataset currently covers the period from 1940 to the present day with a spatial resolution of 31 km horizontally and an hourly temporal resolution [21]. The detailed information provided about the uncertainties of the atmospheric and oceanic variables enhance the transparency and reliability of scientific studies [22]. In this study, we used ERA5 monthly averaged data on a single level (Last Access on 29 January 2025; https://cds.climate.copernicus.eu).

2.3. IMDAA

The National Centre for Medium-Range Weather Forecasting (NCMWRF) of India developed the Indian Monsoon Data Assimilation and Analysis (IMDAA) dataset. IMDAA is available with a spatial resolution of 12 km and a temporal resolution of 1 h (Last Access on 29 January 2025; https://rds.ncmrwf.gov.in). The IMDAA dataset is dedicated to advancing numerical weather prediction systems for enhanced reliability and accuracy over India and neighbouring regions. The dataset covers the period from 1979 to the present day by downscaling ERA-Interim (ERA-I) data using the Unified Model system from the U.K. Met Office. The quality of the dataset is improved by encompassing a diverse array of surface, upper-air, and satellite observations. Most of the IMDAA domains are devoid of snow cover, and snow cover is allowed to evolve within the model since satellite and in situ observations are not very reliable due to the complexity of the terrain and limited number of stations [23].

2.4. HAR-v2

The HAR-v2 dataset was developed within the CaTeNA project (Climatic and Tectonic Natural Hazards in Central Asia); HAR-v2 covers the period of 1980–2023 with a spatial resolution of 10 km and extends across the region known as High-Mountain Asia (HMA) (last access on 29 January 2025; https://www.tu.berlin/en/klima/research/regional-climatology/high-asia/har). The data are generated through the dynamical downscaling of ERA5 reanalyses data and integrated with Japanese 55-year reanalysis snow depth data, using the Weather Research and Forecasting (WRF) model [24].

2.5. TPRR

Tibetan Plateau Regional Reanalysis (TPRR) is a 62-year atmospheric regional reanalysis dataset specifically developed for the Tibetan Plateau region. TPRR offers a horizontal spatial resolution of 9 km and a temporal resolution of 1 h (last access on 29 January 2025; https://doi.org/10.11888/Atmos.tpdc.300821. The dataset is based on ERA5 but replaced the snow depth and snow water equivalent of ERA5 variables using the Global Land Data Assimilation System (GLDAS) since ERA5 overestimates these variables over TP [17]. TPRR was developed using the WRF model, employing re-initialization techniques, spectral nudging (SN), and several optimization methodologies to improve its representation of regional climate processes [25]. TPRR has been reported to outperform ERA5 in capturing climatological characteristics and seasonal variations of precipitation and temperature (air temperature at 2 m above ground) as demonstrated in the study conducted by [17]. Since snow depth data is not available on the TPRR website, we used GLDAS snow depth data [26].

2.6. HadISD

The HadISD (Hadley Centre Integrated Surface Database) is a global sub-daily weather station dataset derived from NOAA’s Integrated Surface Dataset (ISD) (last access on 29 January 2025; https://www.metoffice.gov.uk/hadobs/hadisd/). Of the many variables provided by HadISD, only six, including temperature, undergo rigorous quality control [27,28]. Therefore, this study relies on HadISD data specifically for the temperature variable. We selected HadISD data within the study domain (70° E to 100° E and 25° N to 40° N) at elevations of 2 km or higher, covering the study period.

2.7. Trend Analysis

A linear regression model using the ordinary least squares (OLS) method was used to calculate the trend. In this approach, time is taken as the independent variable and plotted along the x-axis, while the dependent variable—representing the climate parameter of interest—is plotted on the y-axis. The annual and seasonal values of the selected climate variable serve as the dependent variable with respect to time [29].

2.8. Pettitt Test

The Pettitt test is used to find out the point where abrupt change happens in time series data. The Pettitt test will help us to identify the more important parts of the time series where significant changes happen by splitting the time series into two. A study by Wood et al. [30] on reanalysis datasets found that temperature variability is more consistent with observational data compared to precipitation variability. So, we selected the temperature variable from the ERA5 dataset since this dataset has a longer time frame to apply the Pettitt test. Based on the results from the Pettitt test, we segmented the entire data into two periods: 1940–1987 and 1988–2020. In addition, the Mann–Kendall test was applied to both periods and found a significant increasing trend (0.25 °C/decade) for 1988–2020. However, no clear trend is observed in the temperature data for 1940–1987. Consequently, we selected the second part of the time period, characterized by a significant increasing trend based on the long-term ERA5 dataset, for further analysis.

2.9. Principal Component Analysis
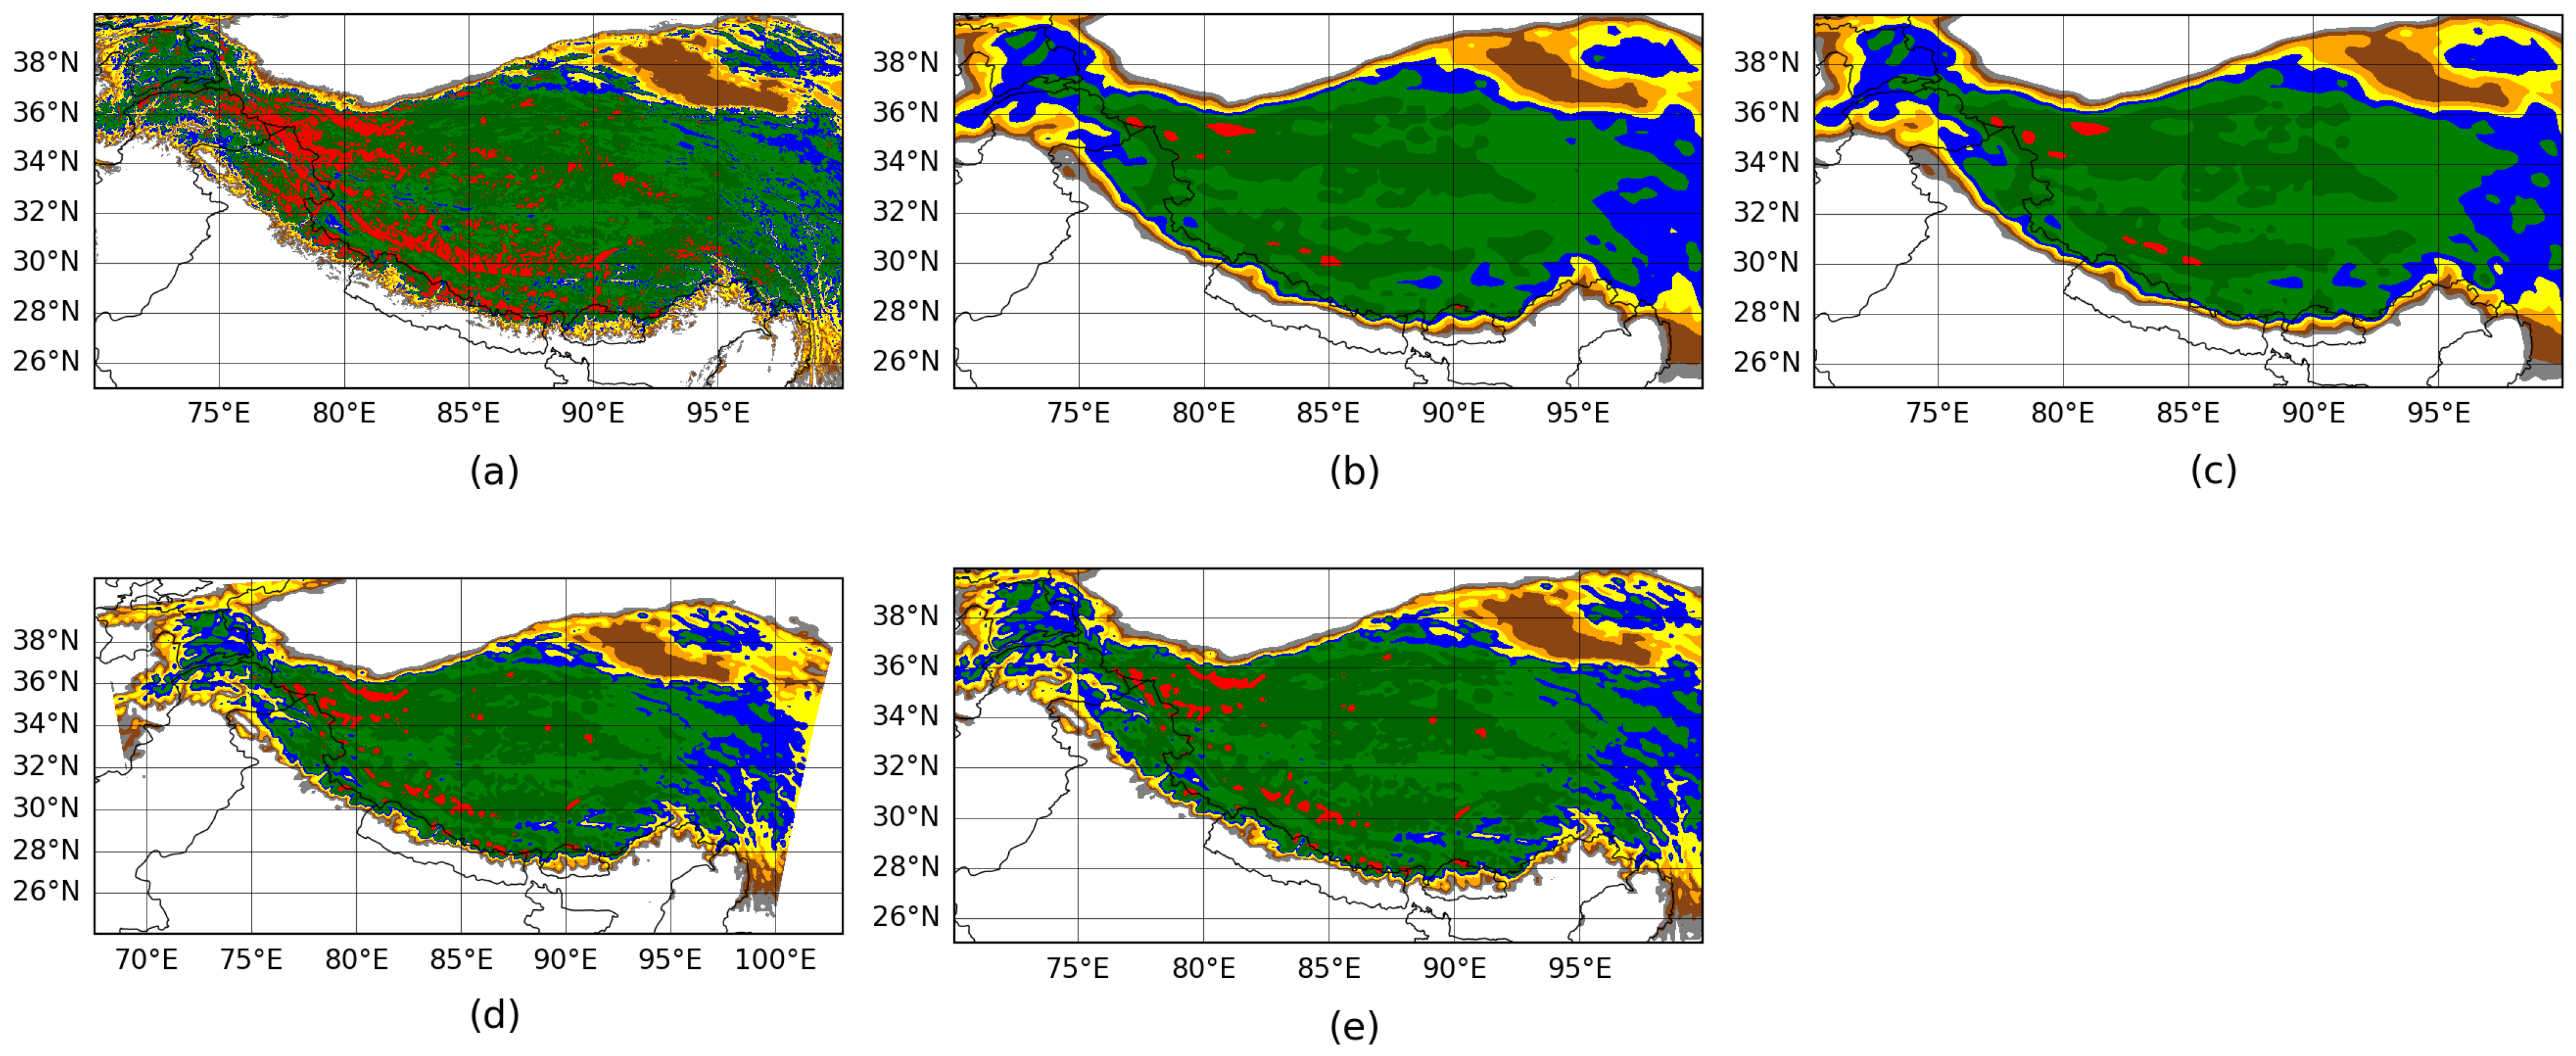
Principal component analysis (PCA) is a powerful dimensionality reduction technique. It is widely used to simplify analysis by reducing the dimensionality of datasets consisting of interrelated variables by preserving as much statistical information as possible [31]. A PCA loading plot (explained in Appendix A) helps to visualize the correlation between the original variables, like temperature trends, precipitation trends, snow depth trends, and albedo trends altogether. The cosine of the angle between any two vectors in the PCA loading plots is an approximation of the coefficient of correlation between those variables.

2.10. Orography

In small horizontal-distance climatic parameters, such as temperature, precipitation shows a rapid systematic variance in complex topography such as mountains [32,33]. Hence, representing complex terrains, including mountains and valleys, high resolution helps to assess the climate more precisely in the region. We selected our study region based on the common coverage of the four datasets and domain of the CPTP—CORDEX-FPS [34]. Therefore, we performed analysis on the region covering 70° E to 100° E and 25° N to 40° N having an elevation of 2 km or above.
Around 70% of the study area is 4 km above the sea surface according to the four reanalysis datasets (ERA5: 72.47%, IMDAA: 72.44%, HAR-v2: 68.66%, TPRR:73.44%). Reanalyses underestimate mountain elevation and overestimate valley depth compared to ETOPO (Figure 1), and real observations. For example, Mount Everest (27°59′17″ N, 88°55′31″ E) has a recorded height of 8848.86 m [35]; ETOPO records 8353.83 m, while ERA5, IMDAA, HAR-v2, and TPRR report 5337.84 m, 5230.36 m, 6214.91 m, and 6190.03 m, respectively. Similarly, a valley at 28°10′ N, 85°59′ E with an actual elevation of 4166 m [36] is approximated at 4044.07 m in ETOPO, while ERA5, IMDAA, HAR-v2, and TPRR overestimate it at 5150.21 m, 4404.36 m, 4612.79 m, and 4579.07 m, respectively. Discrepancies in the representation of elevation across different reanalysis datasets can mislead when analyzing elevation-dependent climate change. A smaller subdomain within the study area (36.5°–39.5° N, 93.5°–100.0° E) was further selected to compare the temperature and precipitation trends across the four reanalysis datasets with results from a previous study conducted by Wang et al. [37]. Although the higher resolution of a dataset can enhance the precision of analysis, it does not guarantee accuracy in topographic or climatologic features. An accurate depiction of topography, along with the integration of various atmospheric and land surface feedbacks, is critical for enhancing the quality and reliability of reanalysis datasets [38,39].

Elevation Bands

We classified grid points in our study domain into 8 elevation bands for each reanalysis based on the elevation of the grid points (x) in the corresponding dataset. The elevation bands have a lowest bound of 2000 m and bandwidth of 500 m. Grids which have elevation of 5500 m or more fall into the last elevation band—band 8 (Table 2).

2.11. Elevation-Dependent Climate Change Indices

To quantify the magnitude of elevation dependency of climate change, we rely on two indices that were commonly used in previous studies: elevation-dependent warming index (EDWI) and elevation-dependent precipitation change index (EDPCI). In contrast to previous studies [2,40], where the mean warming (precipitation change) trends were regressed to the corresponding mean elevation of the elevation bands, we apply regression directly at each grid point to its corresponding elevation. This method allows us to better capture spatial variability and extremes within and between datasets, thereby enhancing the accuracy of the elevation dependency analysis compared to previous approaches.
S = n i = 1 n x i y i i = 1 n x i i = 1 n y i n i = 1 n x i 2 i = 1 n x i 2
S = slope of the regression line ° C m × year or mm m × year , x i = elevation ( m ) of the grid point , y i = temperature trend ( ° C / year ) or precipitation trend ( mm / year ) of the grid point , n = number of grid points .
To express the indices in km and decade scale, we multiply S by 10 and 1000.
E D W I ° C km × decade = S × 10 × 1000
E D P C I mm km × decade = S × 10 × 1000
We computed the indices for each season for each dataset to quantify the seasonal differences in elevation-dependent climate change across various datasets.

3. Results and Discussion

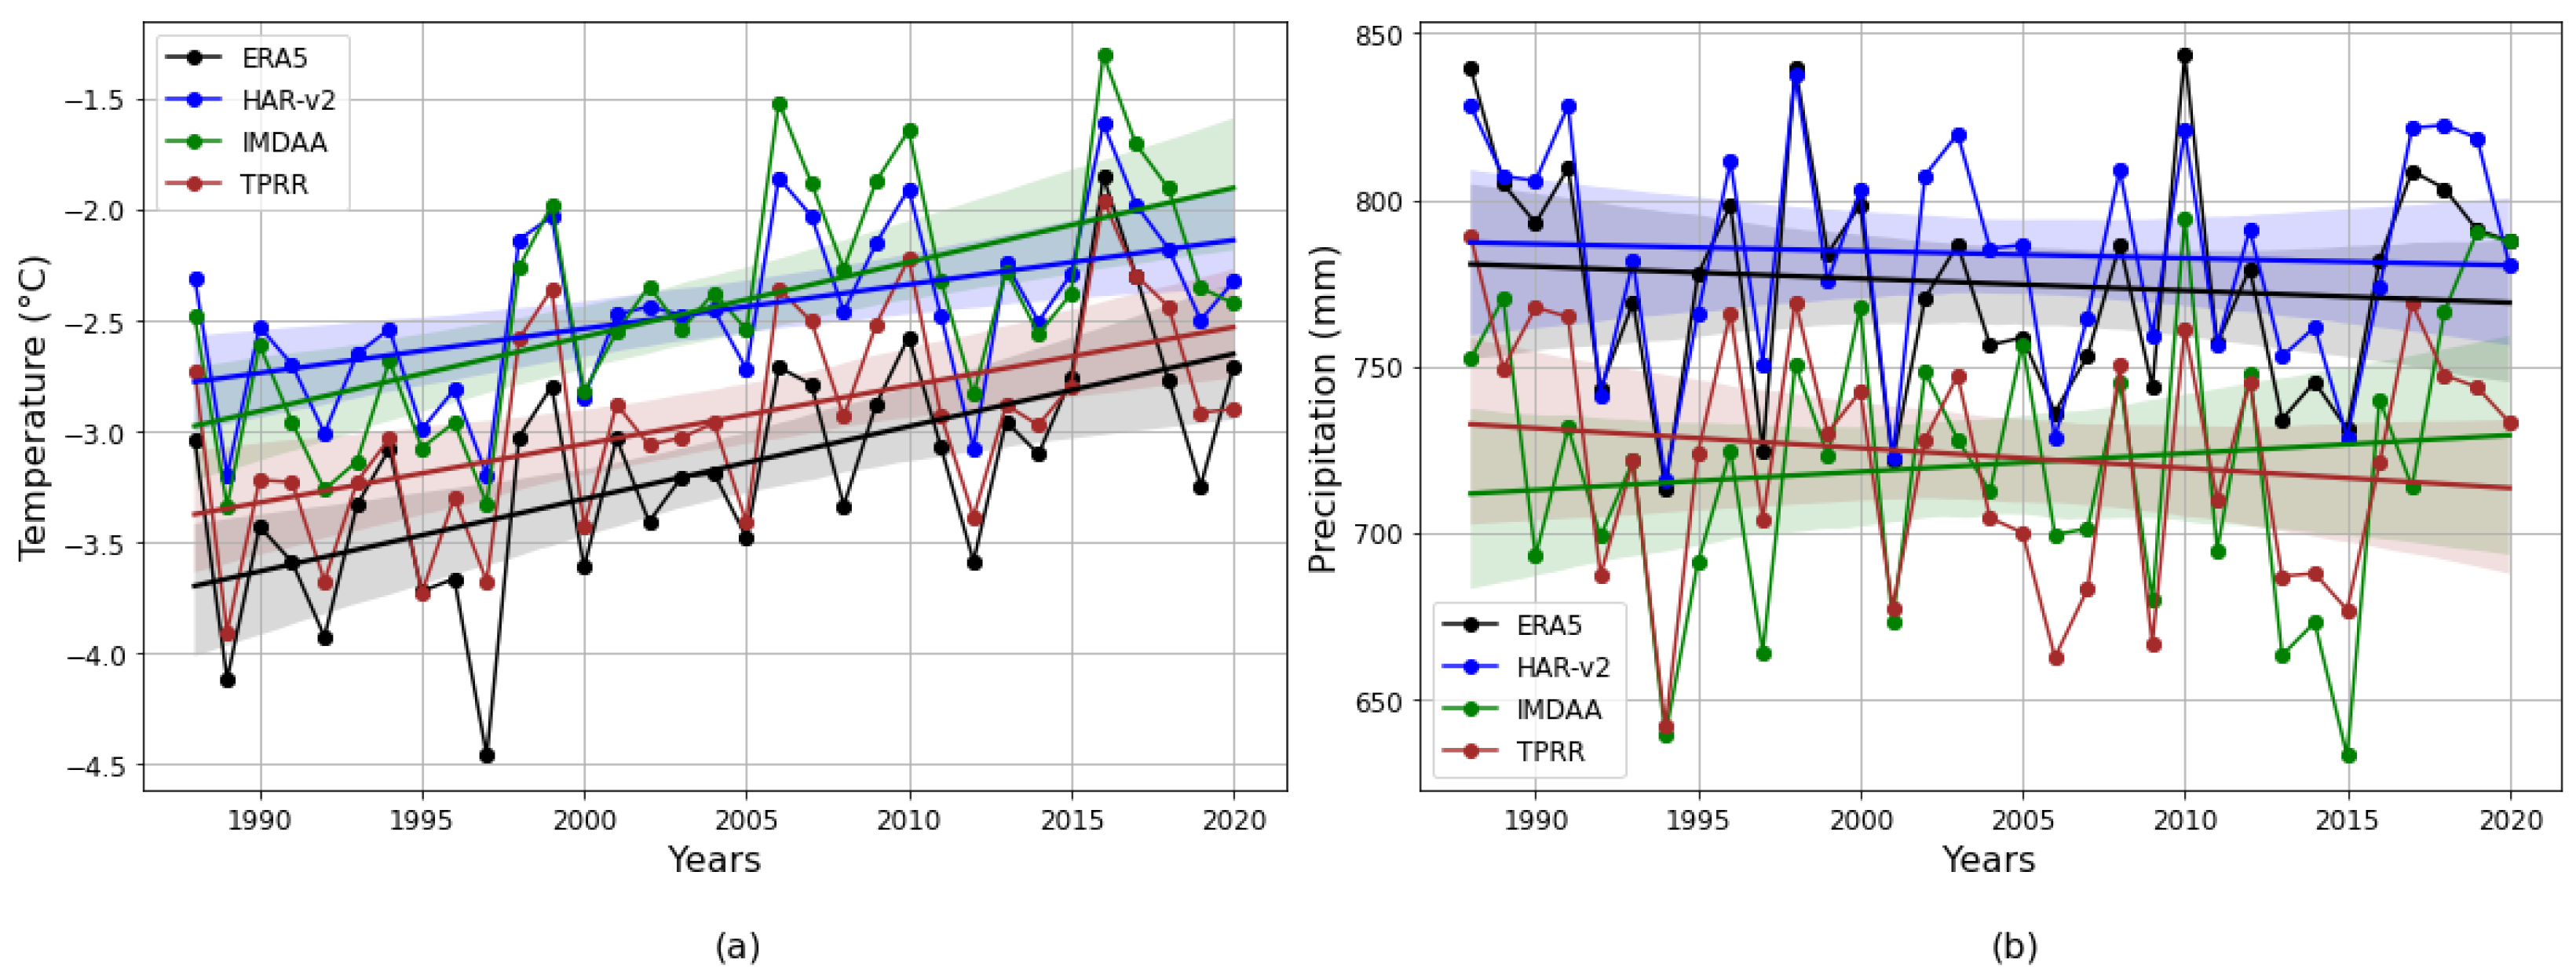
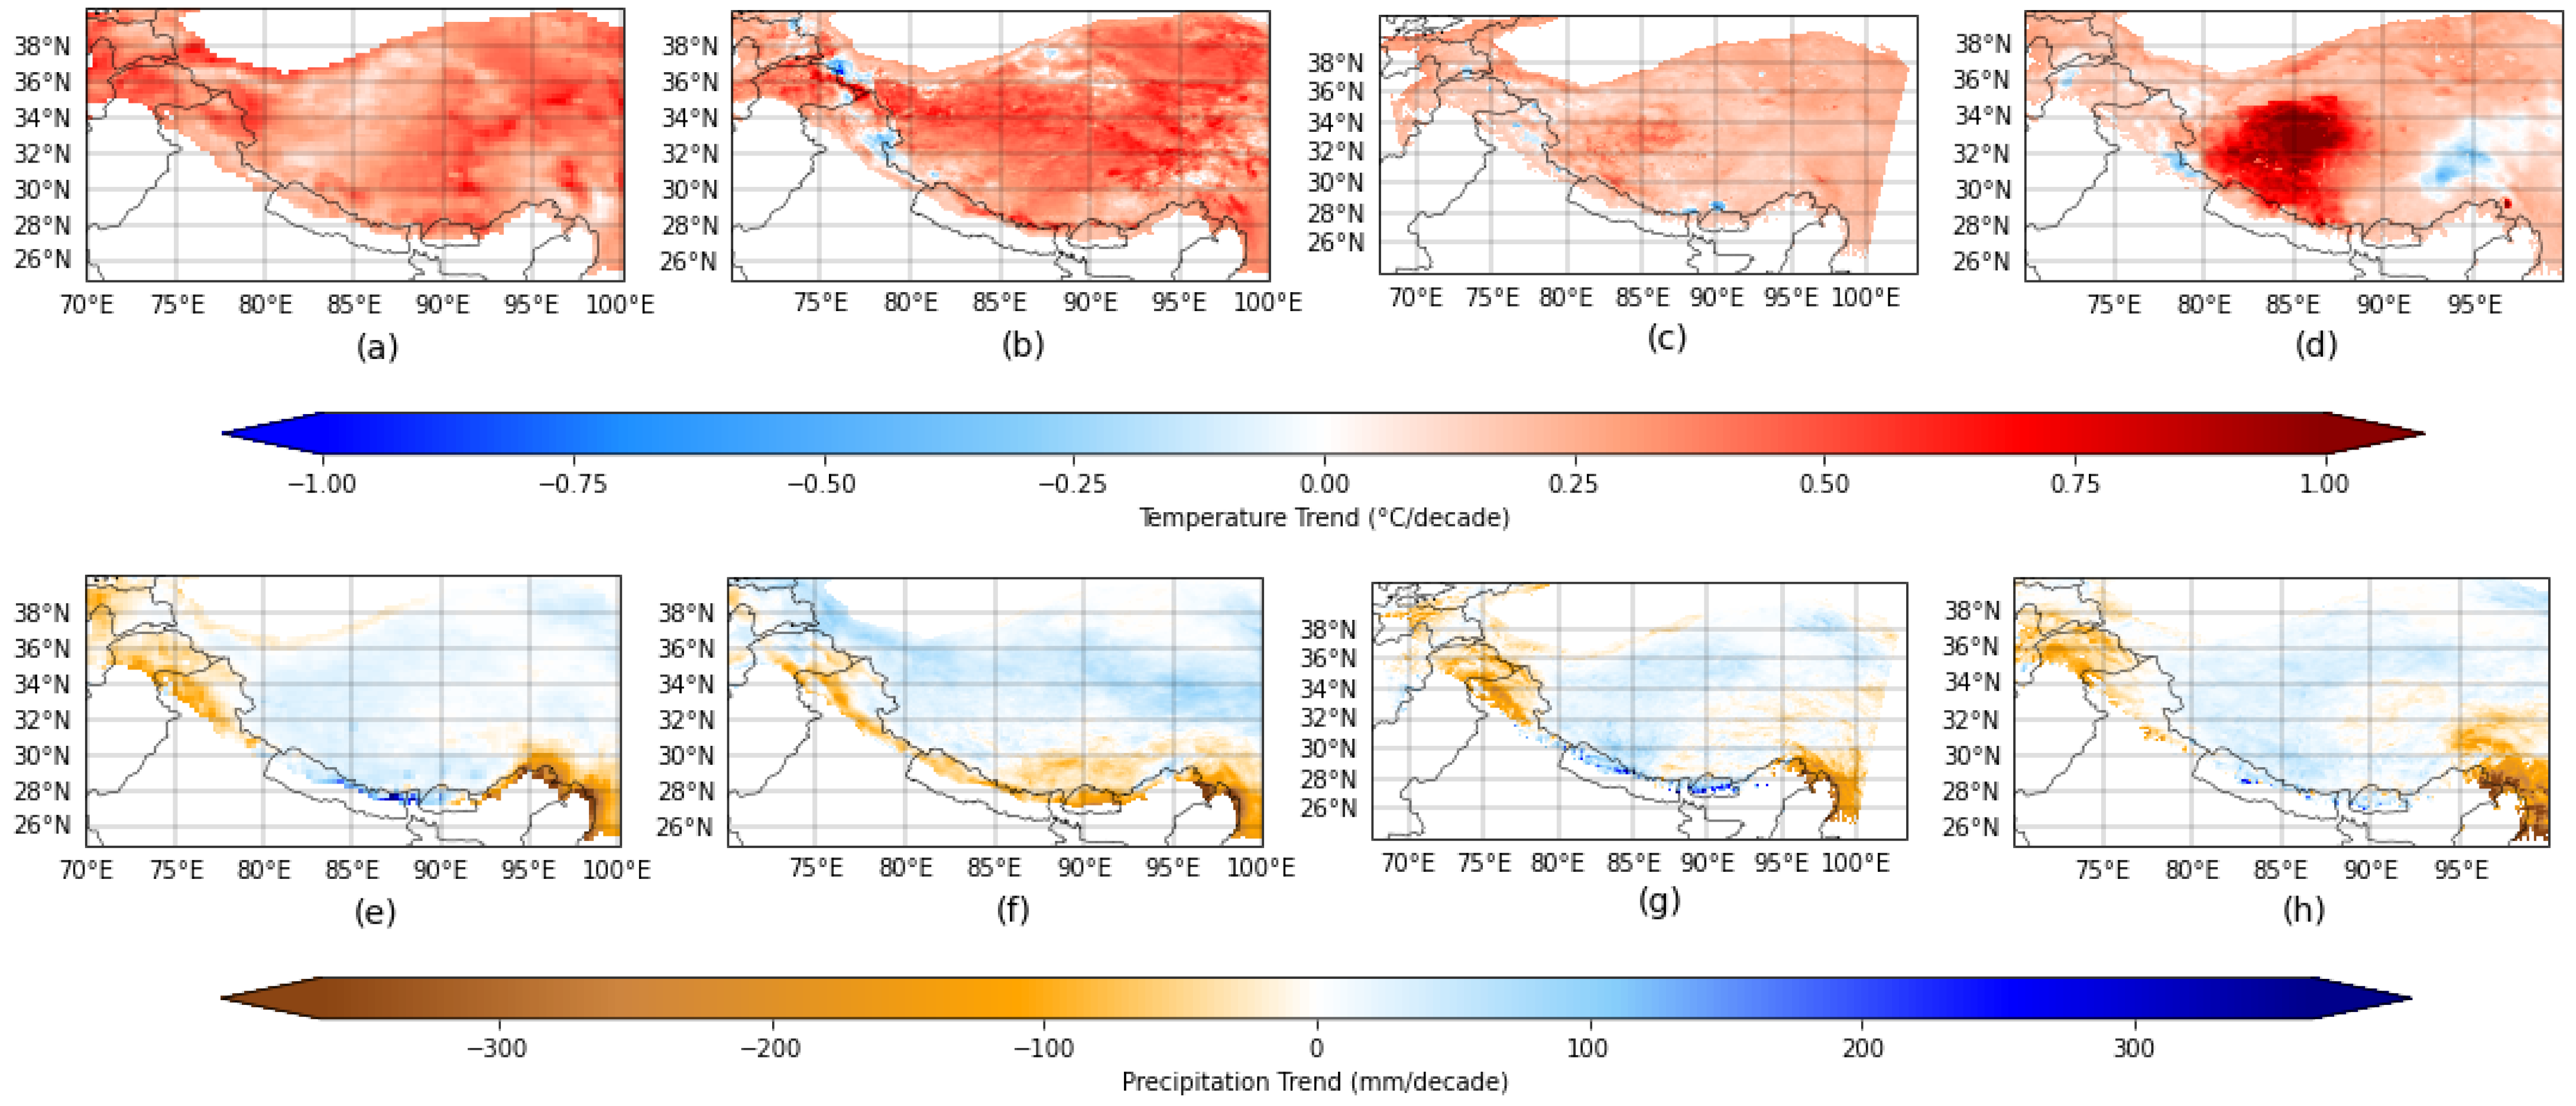
3.1. Annual Temperature and Precipitation Trends

The time series of area average annual temperature and precipitation for the study area from 1988 to 2020 is presented in Figure 2. The temperature from all four datasets shows a significantly rising (warming) trend (p > 0.05). TPRR and HAR-v2 suggest a warming rate of 0.26 °C/decade and 0.20 °C/decade, respectively; ERA5 and IMDAA show a warming rate of 0.33 °C/decade. Despite the differences in temperature trends between ERA5 vs. TPRR and HAR-v2 vs. IMDAA, the overlapping confidence intervals and t-test results indicate there are no statistically significant differences in the annual mean temperature between ERA5 vs. TPRR and HAR-v2 vs. IMDAA. All other pairs, including pairs showing similar long-term temperature trends, demonstrate a statistically significant difference in their 33-year annual mean temperature time series.
Similar statistical analysis reveals no significant differences in the annual precipitation between the ERA5 and HAR-v2 datasets, as well as between IMDAA and TPRR. Despite this, all datasets exhibit varying magnitudes of precipitation trends. IMDAA shows an increasing precipitation (wetting) trend, while the other datasets indicate a decreasing (drying) trend. Specifically, the trends for annual precipitation are as follows: ERA5 at −3.61 mm/decade, IMDAA at 5.49 mm/decade, HAR-v2 at −2.14 mm/decade, and TPRR at −5.98 mm/decade. However, none of these trends are statistically significant.
A study conducted by Wang et al. [37] in the Qilian Mountains (36.5°~39.5° N, 93.5°~104.0° E), located on the northeastern margin of the Tibetan Plateau, for the period 1980–2020, reported an annual temperature trend of 0.4 °C/decade and an annual precipitation trend of 10.27 mm/decade based on in situ observations. The same study reported an annual temperature trend of 0.43 °C/decade and a precipitation trend of 5.4 mm/decade from ERA5, while HAR-v2 trends were 0.27 °C/decade and 10.81 mm/decade, respectively. Our analysis, using four reanalysis datasets over a similar domain and timeline (36.5°–39.5° N, 93.5°–100.0° E; 1988–2020) as Wang et al. [37], suggest the following: HAR-v2 (0.23 °C/decade) and TPRR (0.23 °C/decade) both underestimate the annual temperature trend with respect to ERA5 (0.37 °C/decade), while IMDAA (0.43 °C/decade) shows an overestimation compared to others. For the precipitation trend, the results differ slightly. Considering HAR-v2 as the reference for annual precipitation since it was similar to the observation trend reported by Wang et al. [37], ERA5 (15.92 mm/decade) shows an overestimation of the precipitation trend, contrasting with findings from Wang et al. [37], where ERA5 underestimated the annual precipitation trend. IMDAA and TPRR show trends similar to HAR-v2 (10.81 mm/decade), with IMDAA overestimating the precipitation trend by 0.8 mm/decade and TPRR underestimating it by 1.37 mm/decade. A study by You et al. [41] conducted over the Tibetan Plateau (TP) region (26° N–39° N, 73° E–104° E) for the period 1979–2020 reported a warming rate of 0.34 °C/decade based on the ERA5 dataset. This rate closely aligns with our annual temperature trend and the findings of Yao et al. [42], which reported a temperature trend of 0.35 °C/decade using observational station data for 1970–2014. Furthermore, Wu et al. [16] observed spatial variability across the TP, reporting a warming trend of 0.2 °C/decade and a precipitation trend of 12.0 mm/decade based on observational station data from 1971 to 2000.
Previous studies have shown the cold bias in the ERA5 annual mean temperature trends over TP [17,37]. However, most of the time, ERA5 captures temperature trends more closely aligned with observed data compared to other new reanalysis datasets. IMDAA also aligns more closely with observed temperature trends along with ERA5. Only IMDAA shows a wetting trend for precipitation as in observational studies when considering the whole study domain. The complex precipitation mechanisms represented in reanalysis models contribute to higher uncertainties in precipitation estimates, making it a challenging variable for accurate representation in reanalysis datasets [37]. Figure 3 shows spatial distribution of annual temperature and precipitation trends of the datasets for the four reanalysis datasets.

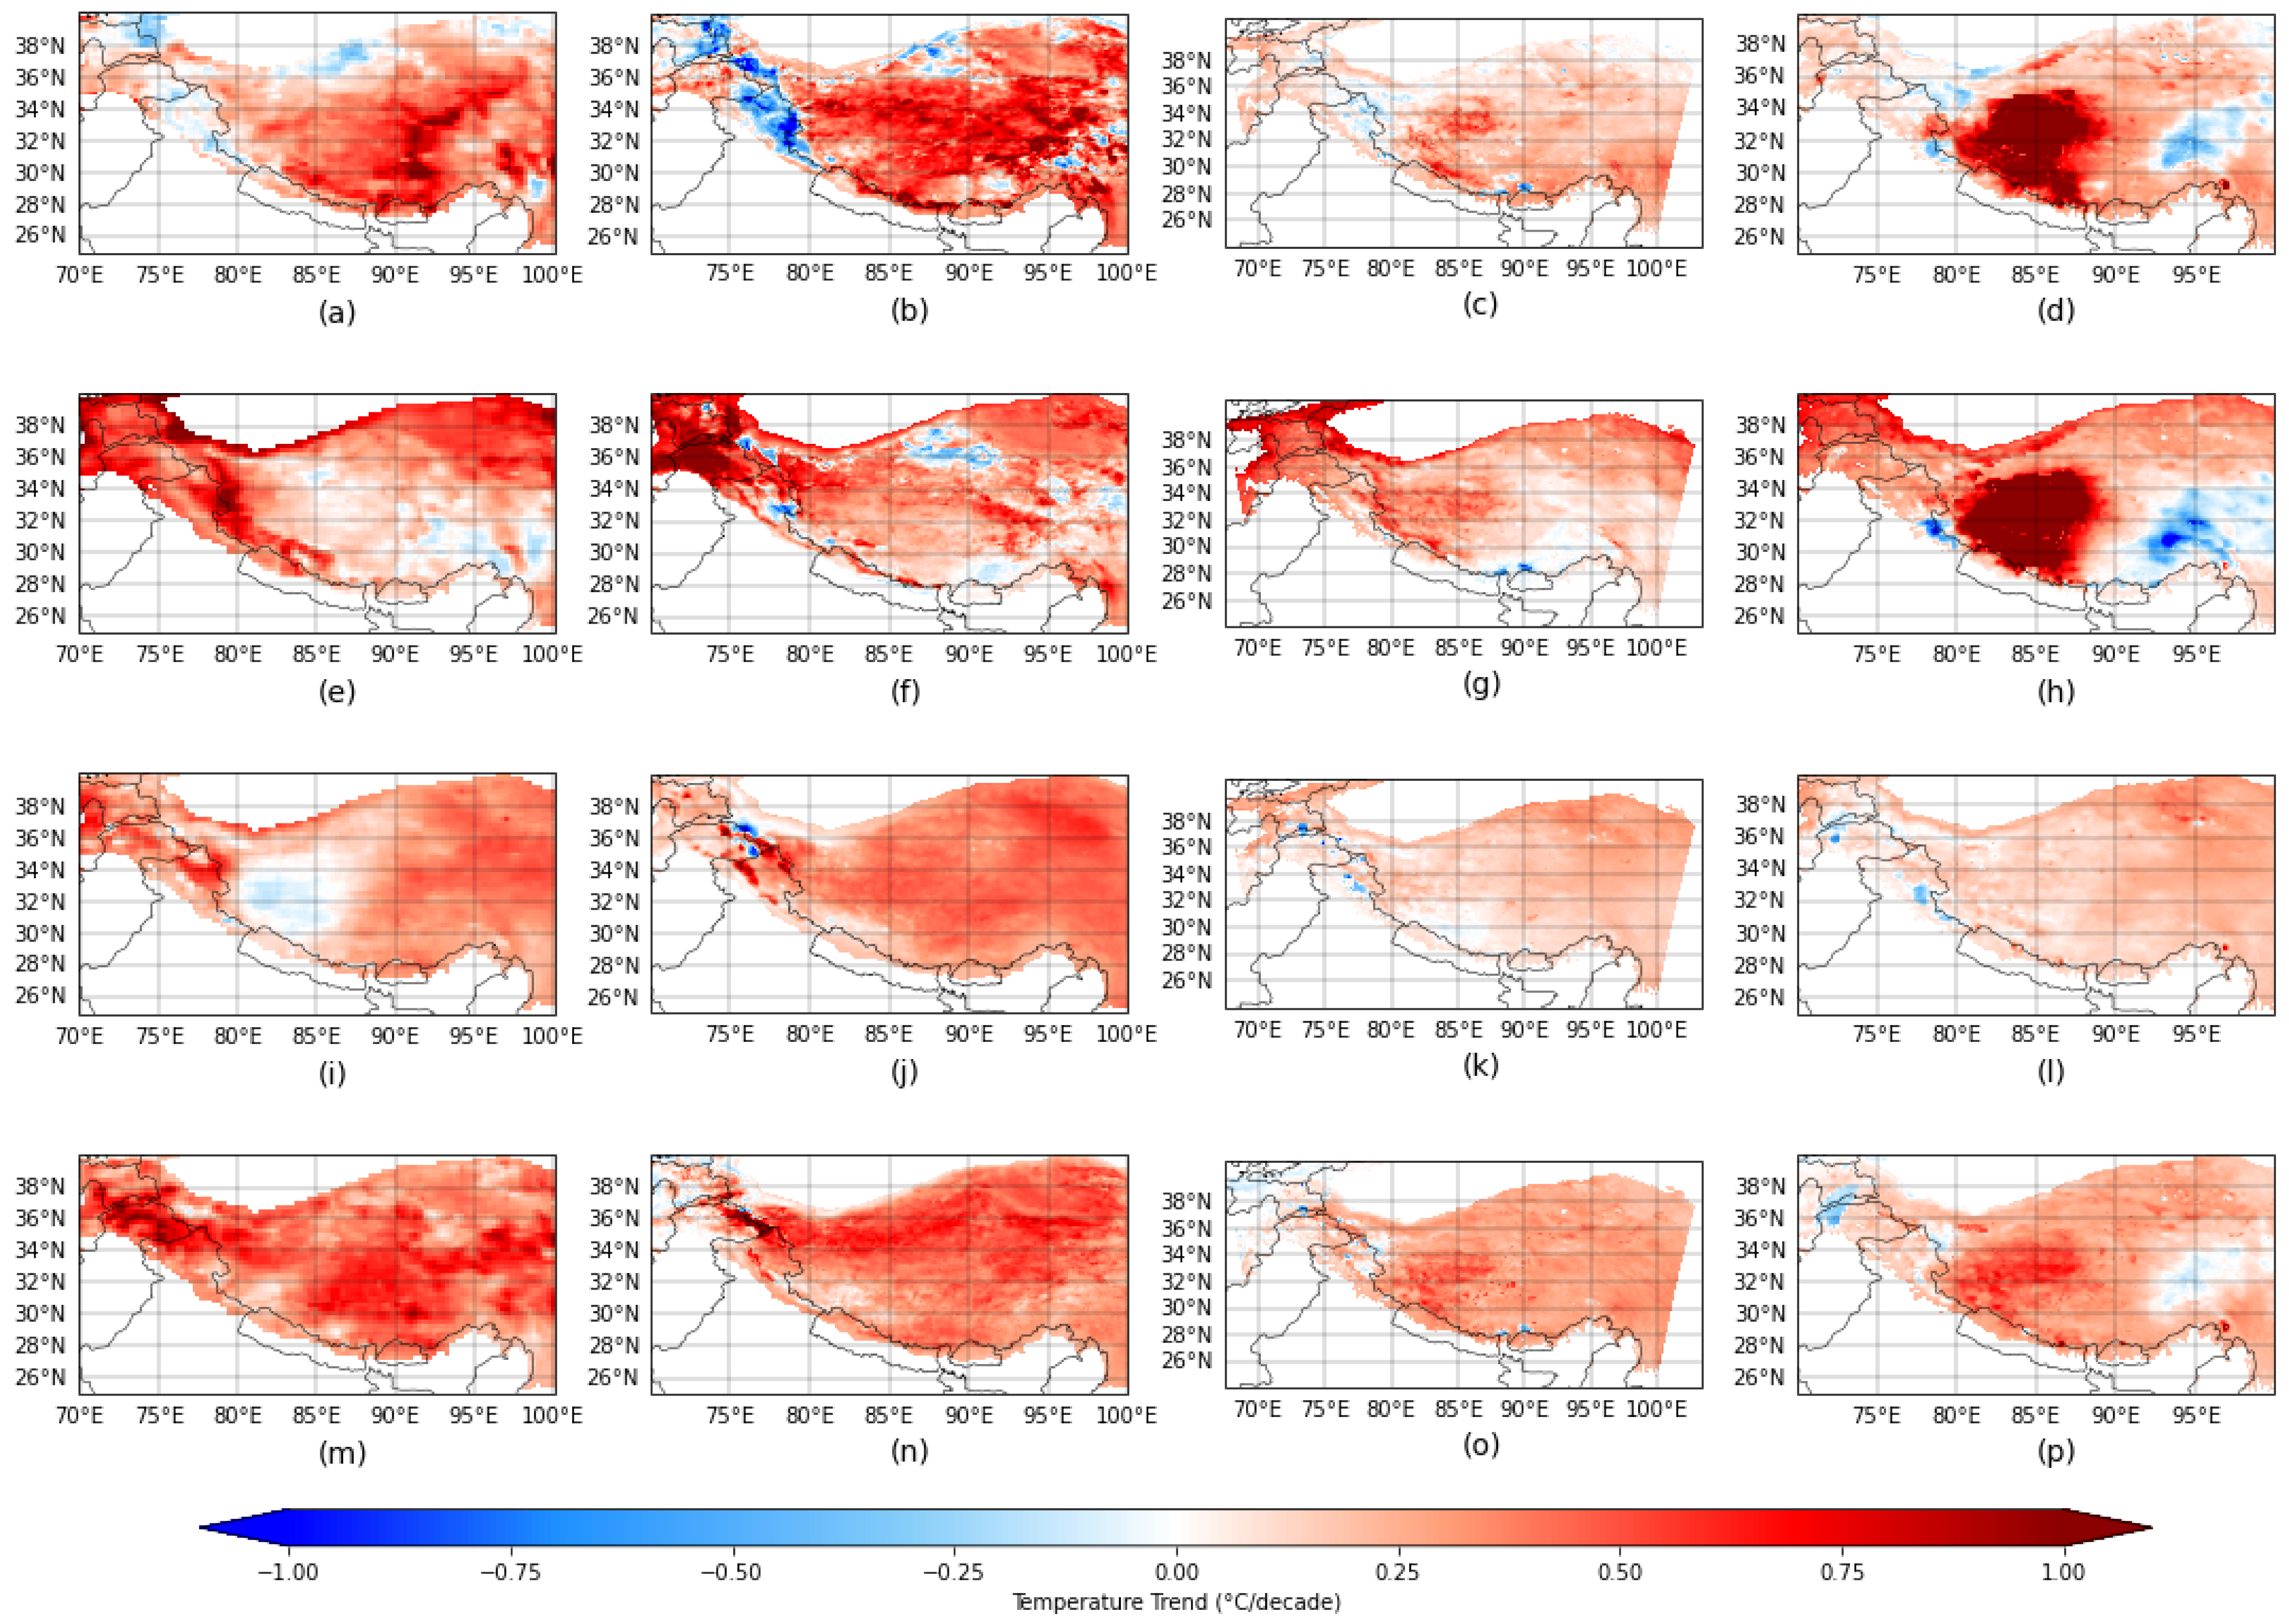
3.2. Spatial Features of Seasonal Trends

3.2.1. Temperature

The winter temperature trends over the study domain derived from ERA5-winter are represented in Figure 4a. In ERA5, intense warming occurs mainly in the central and southeast parts of the domain (east and central Himalayas, southeast parts of the Tibetan Plateau, and some regions of the Hengduan Mountains). Interestingly, certain areas in the mountain regions of Central Asia, the Northern Himalayas, the northern and northeastern parts of the Tibetan Plateau, and the Hengduan Mountains show a cooling trend (<0 °C/decade, blue). The spatial features of temperature trends from IMDAA-winter (Figure 4b) have some similarities to ERA5-winter, especially the locations of the cooling and warming regions. IMDAA shows more extreme trends in some grid points compared to ERA5; for example, the minimum (maximum) temperature trend in IMDAA is −1.7 °C/decade (1.54 °C/decade) while for ERA5, it is −0.44 °C/decade (1.52 °C/decade). In IMDAA and ERA5, 15.47% and 12.7% of the regions show a cooling trend, respectively. Compared to ERA5 and IMDAA in winter, HAR-v2 and TPRR have warming trends concentrated in the central and southwestern region of the plateau and central Himalayas. Only 7.7% of the domain shows cooling trends for HAR-v2 during the winter season. In HAR-v2, the cooling trends observed in some parts of the Hengduan Mountains and the northeastern Tibetan Plateau are weaker than those in ERA5 and IMDAA. TPRR in the winter season (Figure 4d) has intense and large warming trends in the southwestern regions of the plateau and central Himalayas. Certain grid points in TPRR during winter exhibit a maximum temperature trend of 2.12 °C/decade. Further analysis of mean annual temperature trends across the eight elevation bands for the four datasets (Figure S1a) reveals distinct patterns during winter. All datasets exhibit higher warming trends at higher elevations compared to lower elevations, with this pattern being most pronounced in TPRR and least evident in HAR-v2. All four datasets show that the mean temperature trend of grid points in band 8 is lower than that of grid points in band 7. HAR-v2 and TPRR display comparable temperature trends up to band 5. Above band 5, TPRR demonstrates a sharp rise in warming trends at higher elevations, a feature that is not as distinctly evident in HAR-v2. When comparing the winter temperature trends of the HadISD stations (Figure S2a) with the temperature trends of the corresponding nearest neighboring grid cells from the four reanalysis datasets, it is evident that the variability between datasets increases above 3500 m. ERA5 and IMDAA consistently align more closely with HadISD station trends across all elevation bands. In contrast, above 3500 m, TPRR and HAR-v2 underestimate temperature trends relative to observations from HadISD stations.
In spring, the cooling trends in all four datasets shift further eastward or become more concentrated on the eastern side of the study domain compared to winter. During the seasonal transition, the regions experiencing cooling trends shrink significantly compared to winter, for ERA5 (Figure 4e), IMDAA (Figure 4f), and HAR-v2 (Figure 4g). Meanwhile, TPRR-spring (Figure 4h) uniquely exhibits an increase of around 30% in the regions displaying a cooling trend compared to winter. In spring, the western part of the study domain shows intense warming compared to winter in ERA5 and IMDAA. However, in IMDAA, there is intense cooling also in close proximity. In HAR-v2, only 5.08% of the area exhibits a cooling trend in spring, area which is mainly confined to the southern part of the domain. The intense warming observed in the TPRR dataset at the south–central region of the study domain during winter persists into spring, a feature not shown by other datasets. Contrary to winter, ERA5, IMDAA, and HAR-v2 show lower temperature trends at higher elevations compared to lower elevations during spring (Figure S1b). TPRR exhibits temperature trends comparable to HAR-v2 up to band 5, but above this, it shows an intense warming trend at higher elevations, indicating positive elevation-dependent warming (EDW) during spring as well. HAR-v2 displays more pronounced variations in temperature trends across different elevation bands than winter. ERA5 and IMDAA exhibit more similar temperature trends overall; however, IMDAA shows lower temperature trends than ERA5 in lower elevations (below 4000 m), and higher temperature trends in higher elevations (above 5000 m) (Figure S1b). Compared to HAR-v2 and TPRR, ERA5 and IMDAA exhibit temperature trends more closely aligned with the station data in the nearest neighboring grid cells (Figure S2b). For these selected stations, TPRR consistently underestimates the temperature trends in the nearest neighboring grid cells. Despite its lower resolution, ERA5 is able to reproduce temperature trends that closely align with the station data.
Though the mean temperature is high in the summer season, when we consider the temperature trend, the intensity of warming is low compared to other seasons in summer. The cooling trends during summer are more concentrated in the western region of the domain. In ERA5 (Figure 4i) and IMDAA (Figure 4j), the mean temperature trends during summer are 0.27 °C/decade and 0.33 °C/decade, while in HAR-v2 (Figure 4k) and TPRR (Figure 4l), the warming is less intense, with both datasets showing a mean temperature trend of 0.16 °C/decade. During the summer season, HAR-v2 and TPRR exhibit very similar mean temperature trends, both underestimating the temperature trends compared to ERA5 and IMDAA. Our analysis suggests that above 3500 m, TPRR and HAR-v2 clearly underestimate the temperature trends relative to the HadISD station, ERA5, and IMDAA temperature trends (Figure S2c).
In autumn, ERA5 (Figure 4m) and IMDAA (Figure 4n) exhibit average temperature trends of 0.42 °C/decade and 0.36 °C/decade, respectively. ERA5 has only 0.13% of the domain showing a cooling trend during this season. Unlike winter, where there is a sudden jump in temperature trends after a certain elevation band, autumn shows a consistent increase in temperature trends with elevation (Figure S1d). Similar to earlier seasons, ERA5 and IMDAA exhibit comparable magnitudes, while TPRR and HAR-v2 display similar values for mean temperature trends of the elevation bands. For HAR-v2 (Figure 4o), the average temperature trend remains almost consistent across different seasons. As in winter, the variability between datasets increases above 3500 m, with TPRR underestimating the station temperature trends beyond this band. In contrast, HAR-v2, along with ERA5 and IMDAA, better represents the station temperature trends in autumn.

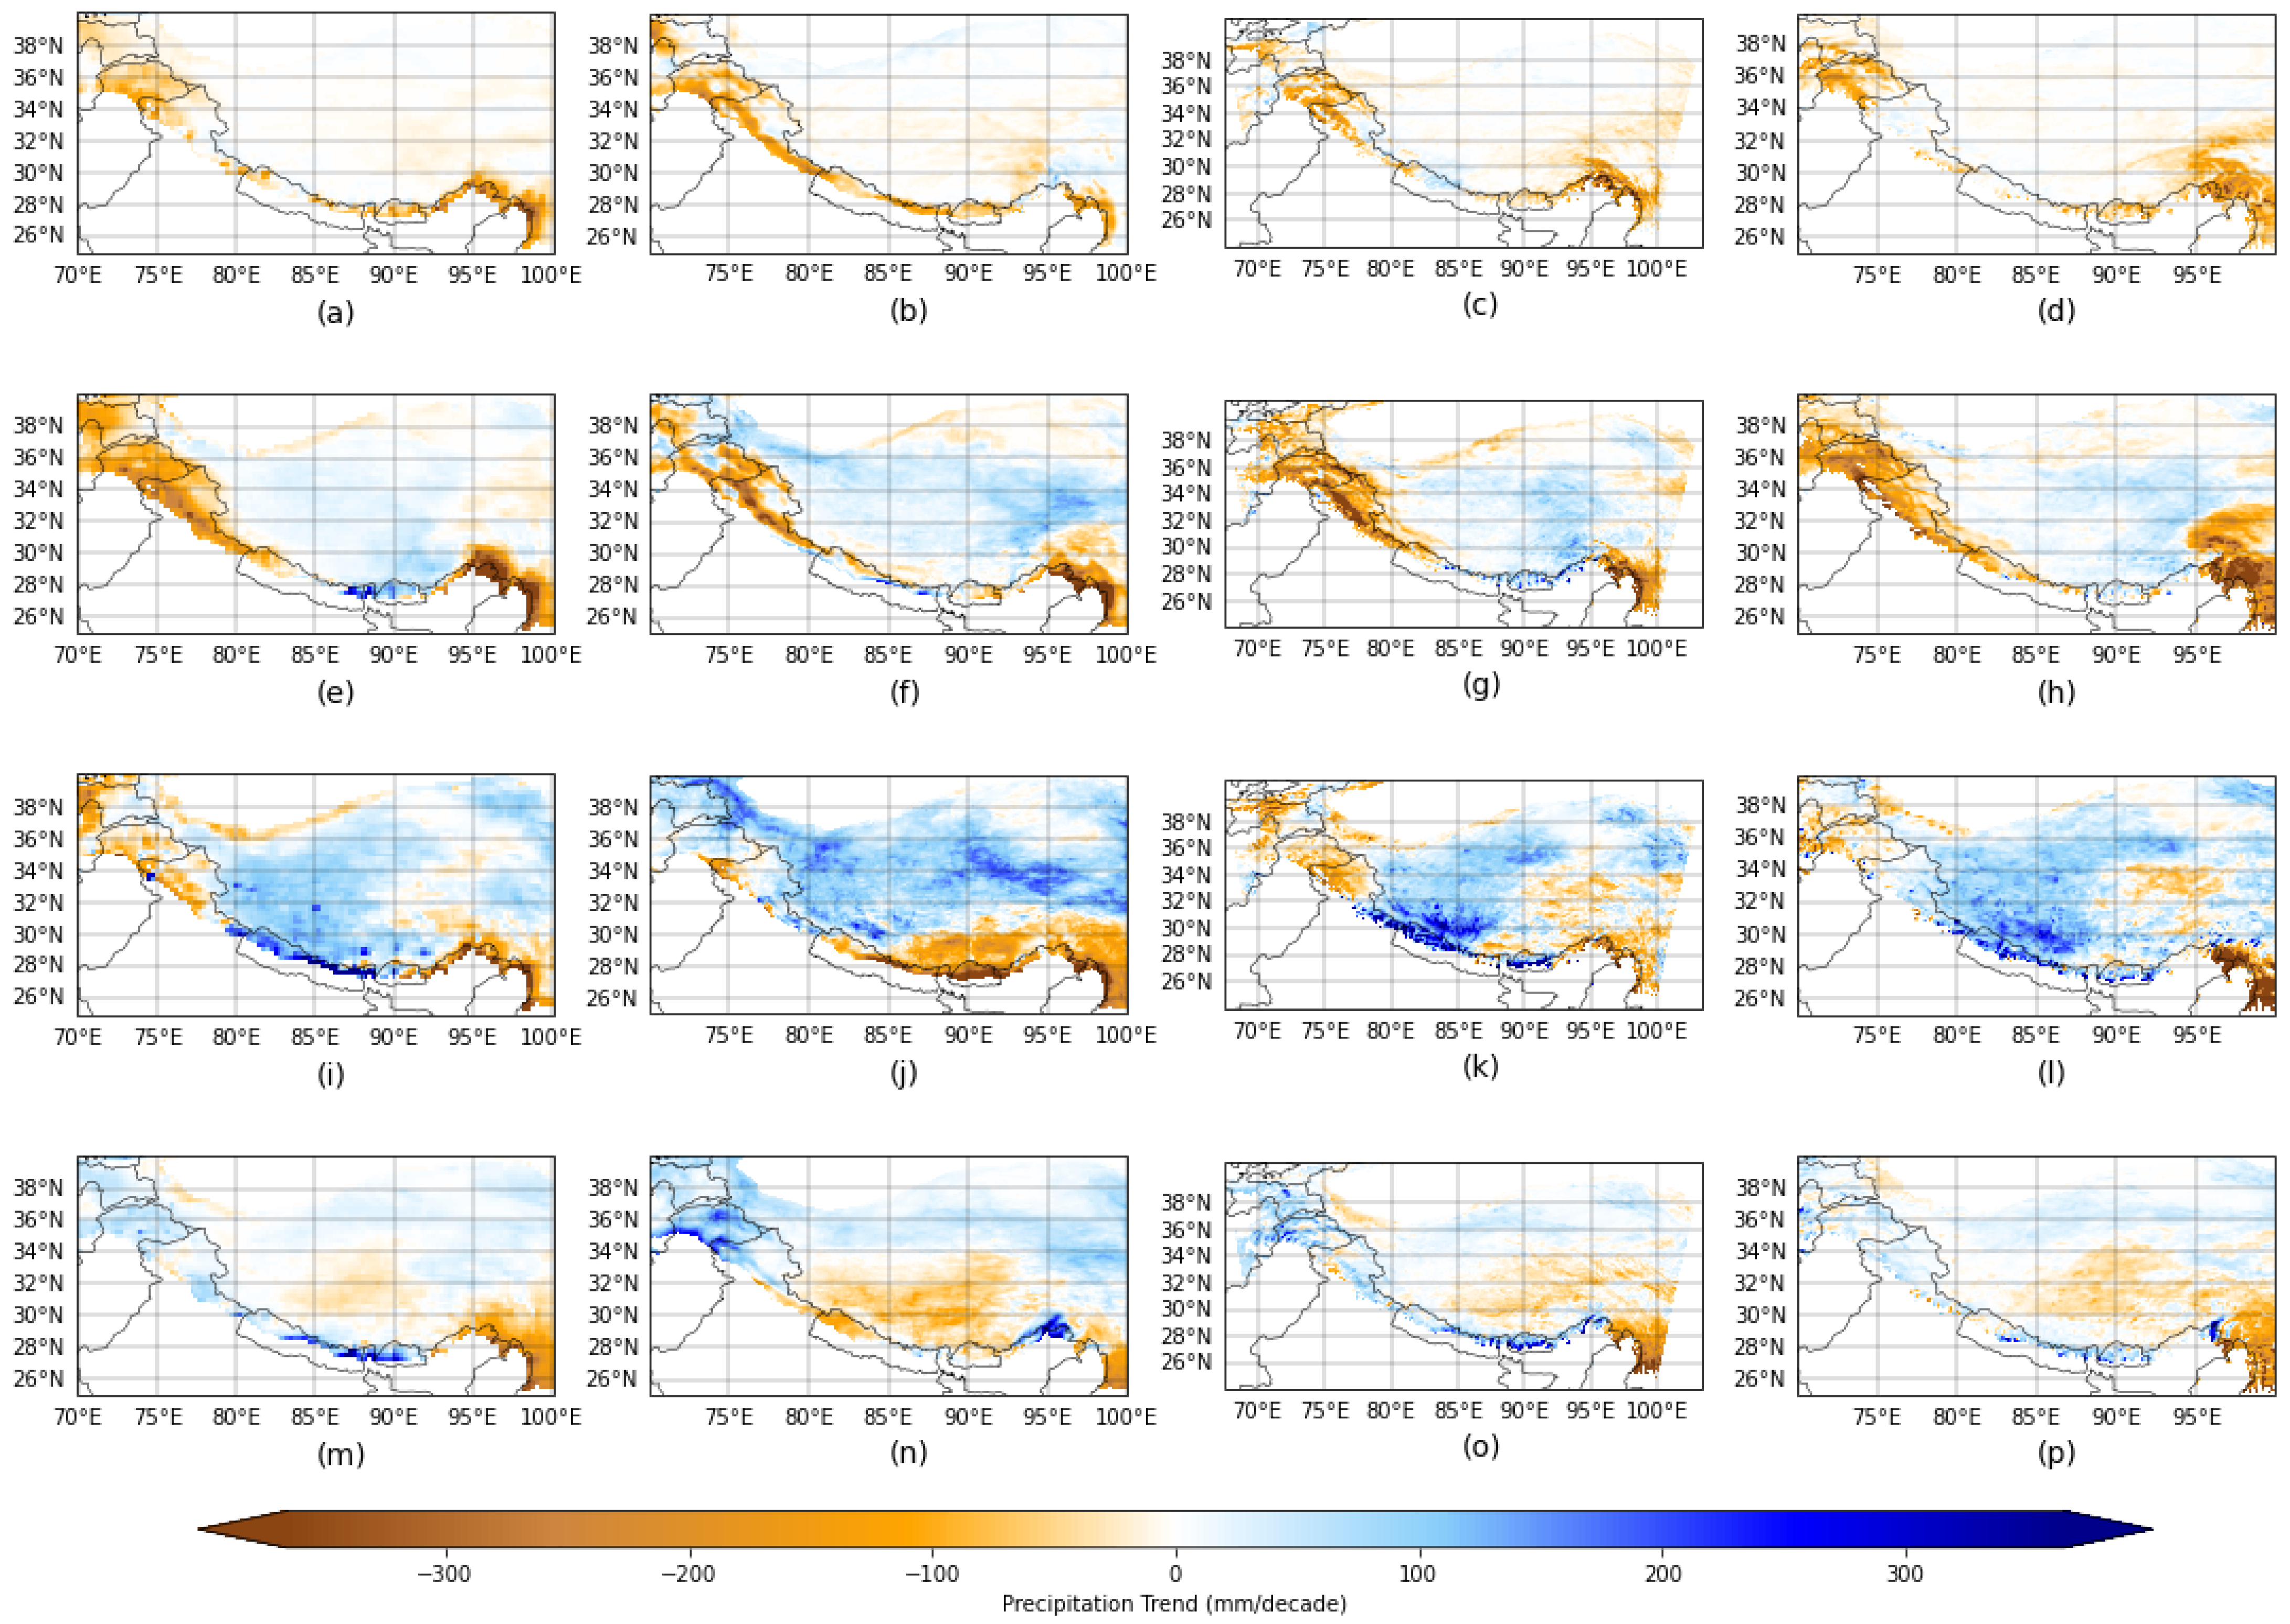
3.2.2. Precipitation

The trend in precipitation for ERA5 during the winter season (Figure 5a) predominantly exhibits a drying pattern, represented by the brown-shaded regions. Approximately 75% of the domain shows a drying trend, while the remaining areas show a wetting trend (blue-shaded regions). The wetting trend reaches a maximum of 68.11 mm/decade in certain grid points, whereas the drying trend intensifies to −479.25 mm/decade in certain grid points. The drying trend is particularly pronounced along the western and southern boundaries of the domain. Notably, the southeastern corner, which encompasses the Hengduan Mountain region, exhibits a more intense drying pattern compared to other areas. During the winter season, IMDAA (Figure 5b) exhibits a more pronounced wet bias compared to ERA5 and other datasets for the same season. Approximately 60% of the domain shows a drying trend, with an extreme magnitude of −295.93 mm/decade, while the maximum wetting trend reaches 136.02 mm/decade. HAR-v2-winter (Figure 5c) exhibits an average precipitation trend of −16.17 mm/decade across the study domain, with some grid points showing extreme drying trends of up to −606.67 mm/decade. Both HAR-v2 and TPRR (Figure 5d) indicate that 70% of the domain experiences a drying trend in winter, while the remaining 30% exhibits a wetting trend. Compared to other datasets, TPRR displays a more fragmented drying pattern, particularly along the southern boundaries of the domain. Overall, all datasets consistently indicate that the majority of the study area undergoes a drying trend during winter. Winter is the season in which all datasets show the highest percentage of the drying trend area and the lowest percentage of both the wetting trend area and its magnitude.
In spring, the average precipitation trend across datasets (Figure 5, second row) is relatively low compared to other seasons, with values of −22.88 mm/decade for ERA5, −17.96 mm/decade for HAR-v2, and −28.68 mm/decade for TPRR. Although IMDAA also exhibits a mean drying trend in spring (−4.14 mm/decade), its mean precipitation trend in winter is notably higher at −12.26 mm/decade. A pronounced wetting trend is observed in the eastern Himalayas in both ERA5 (Figure 5e) and HAR-v2 (Figure 5g). All datasets exhibit a mean drying trend up to elevation until band 5. However, IMDAA shows a wetting trend above band 5, whereas TPRR and ERA5 exhibit a wetting trend only at band 7 (Figure S3b). In contrast, HAR-v2 shows a consistent drying trend across all elevation bands, with minimal variation with elevation. Additionally, HAR-v2 underestimates the drying trend at lower elevations while overestimating it at higher elevations compared to the other three datasets.
The maximum and minimum extreme precipitation trends vary significantly across datasets in summer. In IMDAA (Figure 5j), the maximum wetting trend is 265.33 mm/decade, whereas in HAR-v2 (Figure 5k), it reaches 1415.91 mm/decade. Similarly, the extreme drying trends also fluctuate between datasets. IMDAA exhibits the lowest magnitude of drying trends at −930.9 mm/decade, while TPRR shows the highest magnitude at −2221.66 mm/decade. A major portion of the domain exhibits a wetting trend. All datasets, except for TPRR (Figure 5l), display a mean wetting trend, with the highest mean precipitation trend observed in the summer season compared to other seasons. In the central Himalayas, all datasets except IMDAA exhibit a wetting trend, while IMDAA shows a drying trend.All datasets have a mean wetting trend above band 4 (Figure S3c).
Similar to summer, the mean precipitation trend in autumn for all datasets, except IMDAA, indicates a wetting trend. TPRR has its highest mean precipitation trend in autumn at −1.99 mm/decade compared to other seasons. Approximately 60–65% of the domain shows a drying trend, while, as in summer, the southern boundaries of the domain display a more pronounced wetting trend in all datasets except IMDAA. All datasets except TPRR have a pronounced wetting trend around 3000 m to 5000 m (Figure S3d).

3.3. Elevation-Dependent Climate Change Indices

The EDCC indices in Figure 6 demonstrate how the temperature trend and the precipitation trend vary for each dataset in each season. Although all EDCC indices values are statistically significant, their magnitude or maybe even their sign might vary depending on the data. All datasets exhibit positive EDWIs during winter and autumn, indicating that warming trends intensify with elevation. As reported in previous studies [3,40], this positive EDWI pattern is a robust feature observed in winter and autumn. During winter, the EDWI values show considerable variation between datasets. HAR-v2 exhibits the lowest winter EDWI at 0.01 °C/(km × decade), while TPRR shows the highest at 0.14 °C/(km × decade). ERA5 and IMDAA have EDWI values of 0.07 °C/(km × decade) and 0.08 °C/(km × decade), respectively. In contrast to winter, EDWI values during autumn are more consistent across datasets. ERA5 and HAR-v2 both report values of 0.05 °C/(km × decade), while TPRR has the lowest EDWI at 0.04 °C/(km × decade), which is in contrast to its high winter EDWI. The highest autumn EDWI, 0.08 °C/(km × decade), is observed in IMDAA.
During spring, all datasets exhibit negative EDWI, with the exception of TPRR, which reports a positive EDWI of 0.10 °C/(km × decade). Similarly, in summer, negative EDWI values are observed in all datasets except IMDAA, which shows a positive EDWI of 0.03 °C/(km × decade). ERA5 exhibits the most negative EDWI during spring and summer, with values of −0.14 °C/(km × decade) and −0.06 °C/(km × decade), respectively. Similarly, HAR-v2 also shows negative EDWI in these seasons, with values of −0.08 °C/(km × decade) in spring and −0.04 °C/(km × decade) in summer. EDPCI shows an increasing trend across all seasons and datasets, except for IMDAA in winter, which exhibits a negative EDPCI of −11 mm/(km × decade). In spring and summer, the EDPCI values are significantly higher compared to winter and autumn, with autumn showing the lowest EDPCI values. The elevated EDPCI in spring and summer may be attributed to the overlap with the monsoon season. Among all datasets, mostly HAR-v2 records the lowest EDPCI values. The pronounced trends in the EDPCIs are driven more by the enhanced drying trend at lower elevations rather than the high wetting trend at higher elevations. This conclusion is based on a regression analysis of trend versus elevation, which was used as part of the methodology for calculating the EDPCI values for each grid.

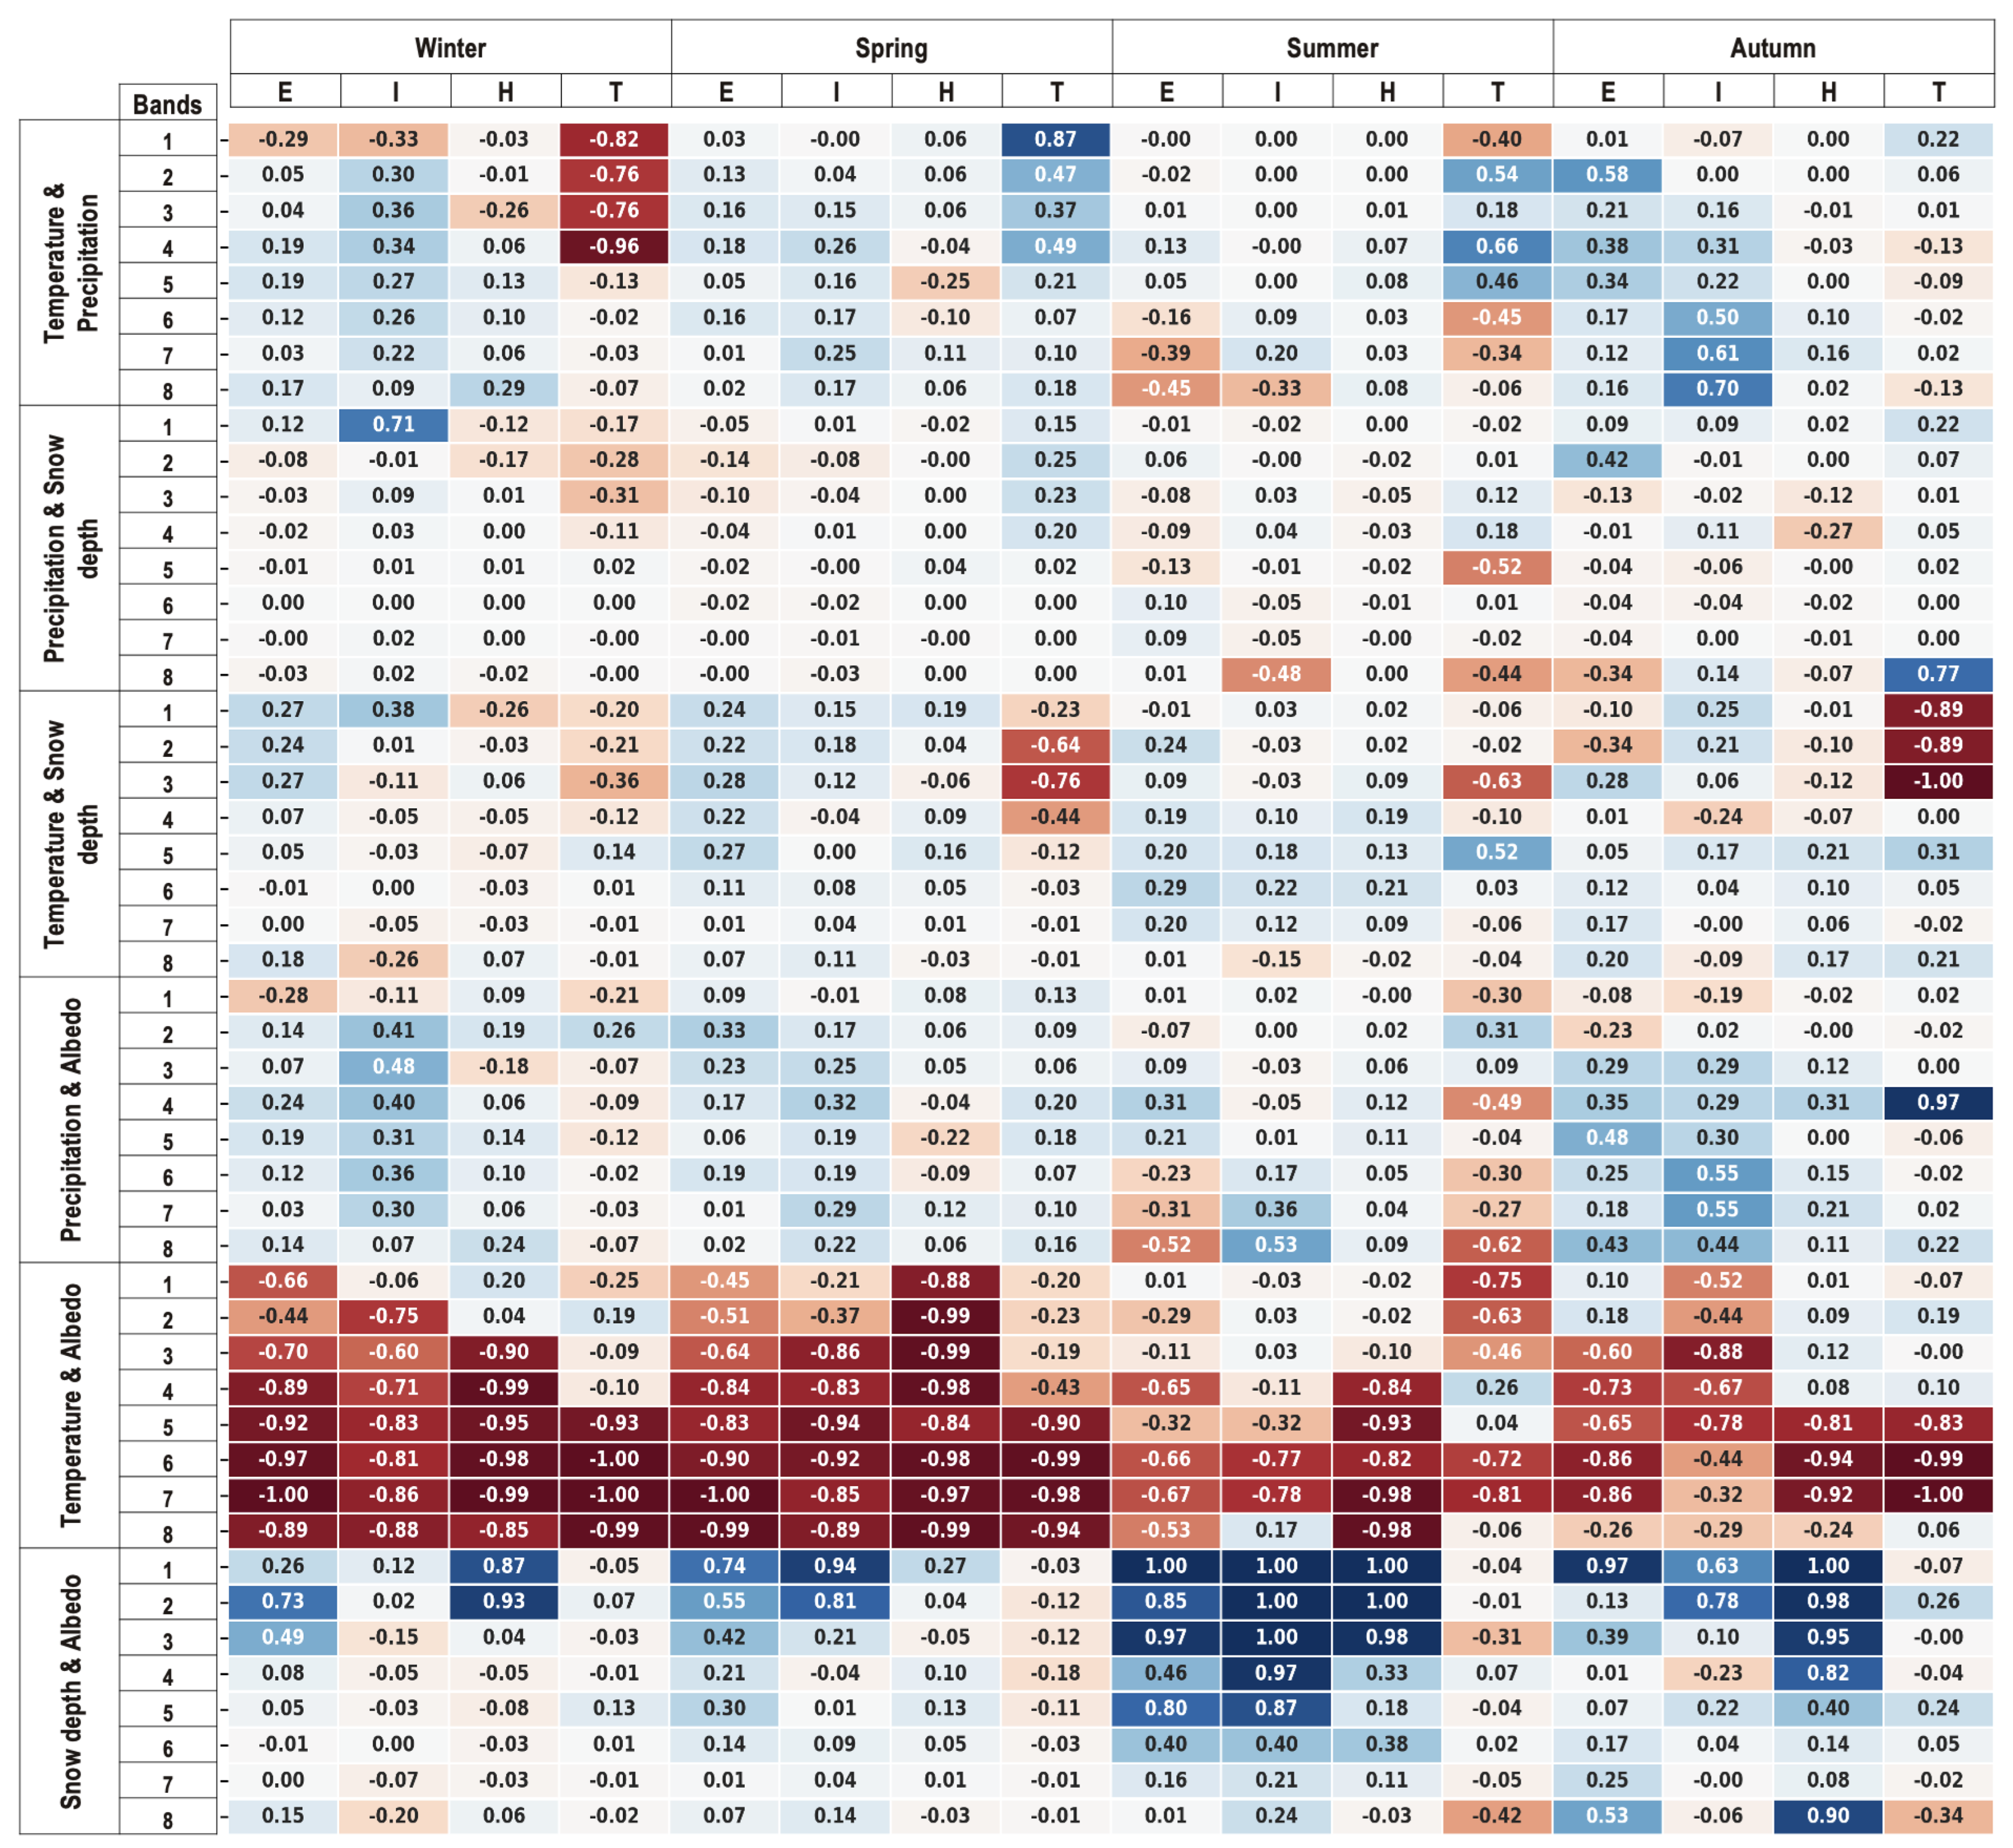
3.4. Correlation Between Variables

Figure 7 gives us an idea of the interrelationships between temperature, precipitation, snow depth, and albedo trends in different elevation bands and seasons for the four datasets. The angle between the variables in the loading plots reveals the correlation between the variables, as mentioned in Section 2.9.
Temperature and precipitation trends do not show a constant correlation; instead, their relationship varies with season, elevation, and, most importantly, the dataset analysed. In the TPRR dataset, a distinct correlation is observed in the lower elevation bands 1–4, with a relatively high negative correlation during winter and a positive correlation during spring, in contrast to trends observed at higher elevations and other datasets. In summer, ERA5 and IMDAA exhibit a slight negative correlation between temperature and precipitation trends at high elevations (for grid points with elevation above 4500 m for ERA5 and only for above 5500 m in IMDAA). In contrast, HAR-v2 shows little to no correlation between temperature and precipitation trends across all elevations during summer. TPRR, however, presents mixed results, with correlations fluctuating between positive and negative in a seemingly random pattern with elevation. The ERA5 and IMDAA datasets exhibit stronger positive correlations between temperature and precipitation trends across most elevation bands in autumn compared to the correlations observed in HAR-v2 and TPRR. In general, ERA5 and IMDAA demonstrate greater similarity in the correlation between temperature and precipitation trends. In contrast, HAR-v2 shows little to no correlation between these variables across all seasons and elevations, while TPRR displays strong correlations in specific elevations and seasons. The research by Kad et al. [6] projected changes in mountain precipitation across five major mountain regions (Eastern Himalayas, New Guinea, East Africa, Central America, and Central Andes) under greenhouse warming conditions. They proposed a positive feedback mechanism in the climate system called “Orographic moisture omega feedback”, which encompasses both wet and dry responses. This mechanism suggests a complex relationship between temperature and precipitation trends in mountainous regions. While a positive correlation between temperature and precipitation is expected in some areas, negative correlations may occur in others. The variability in these correlations highlights the intricate nature of mountain climate systems and the need for further analysis. The discrepancies found in our study between different datasets for the same elevation bands and time periods underscore the inconsistencies and warrant additional research.
Band 1 of IMDAA in winter exhibits a high positive correlation between precipitation and snow depth trends. TPRR and HAR-v2 display a slight negative correlation between precipitation and snow depth trends at lower elevations during winter, while at higher elevations, the relationship is mostly uncorrelated. In spring, lower elevations in the TPRR dataset exhibit a slight positive correlation between precipitation and snow depth trends. However, for most of the other time in this season and elevation bands, the relationship between these variables appears to be independent. At higher elevations, particularly in bands 5 and 8 of TPRR and band 8 of IMDAA, a more pronounced negative correlation is observed between precipitation and snow depth trends during summer. In autumn, correlations between precipitation and snow depth trends are inconsistent and vary randomly across different elevation bands. However, band 8 in TPRR exhibits a notably high positive correlation. Although a positive correlation between snow depth and precipitation trends is expected at higher elevations during colder seasons [43] where most precipitation occurs in solid form, this relationship is not clearly evident in the datasets. Li et al. [44], using Moderate Resolution Imaging Spectroradiometer (MODIS) snow product data, concluded that the decreasing trend in snow cover intensifies with elevation and that precipitation is a major factor influencing snow cover changes. However, in the reanalysis datasets, snow depth and precipitation trends fail to exhibit the anticipated strong correlation between these variables.
Studies conducted on observational datasets over the Tibetan Plateau and other regions have demonstrated a negative correlation between snow depth and temperature [45,46,47]. However, this expected negative correlation is not well represented in the reanalysis datasets. Notably, IMDAA and ERA5, particularly ERA5, often show a positive correlation between temperature and snow depth trends. The correlation between these variables varies with seasons and elevations, but ERA5 exhibits a noticeable bias towards positive correlations. This positive bias may stem from ERA5’s limitations in accurately representing snow depth. Specifically, ERA5 is known to overestimate snow depth in the TP domain [48]. For the TPRR dataset, temperature and snow depth trends exhibit a negative correlation at lower elevations, particularly up to band 4. In autumn, this correlation becomes strongly negative. At higher elevations, however, the correlation occasionally shifts towards a positive relationship.
Precipitation and albedo trends exhibit a positive correlation compared to the weaker positive correlation between precipitation and snow depth trends. The relationship between precipitation and albedo trends depends on the phase of precipitation (rain or snow) [49], which, in turn, is influenced by seasons and elevations. However, here, the correlation tends to be predominantly positive. This positive correlation is particularly prominent in IMDAA and is observed primarily during winter and autumn. In autumn, all datasets show a stronger tendency toward positive correlations between precipitation and albedo trends. Notably, TPRR exhibits an exceptionally strong positive correlation at band 4, while trends at other elevations in TPRR appear largely independent in autumn. Similarly, ERA5 and IMDAA generally display a positive correlation. However, in both ERA5 and TPRR, a negative correlation is observed between precipitation and albedo trends during summer at higher elevations.
The correlation between temperature and albedo trends is predominantly strongly negative across all datasets, particularly during spring and winter. In ERA5, a strong negative correlation is observed most of the time, especially at higher elevations during winter and spring. However, at lower elevations (bands 1 and 2), ERA5 shows a slight positive correlation in autumn. Similarly, IMDAA generally exhibits negative correlations between temperature and albedo trends, though these correlations are less pronounced compared to those in ERA5 at certain elevation bands. In contrast, HAR-v2 demonstrates a notably higher correlation between temperature and snow depth trends compared to the other datasets. During winter and autumn, lower elevations of HAR-v2 show a positive correlation between temperature and albedo trends. In TPRR, the strong negative correlation is primarily concentrated at higher elevations. While TPRR also exhibits a strong negative correlation between temperature and albedo trends, lower elevations and bands 4 and 5 in summer tend to show a positive correlation.
The snow depth and albedo trends generally exhibit a tendency toward a positive correlation. While a strong positive correlation between these trends is typically expected, this relationship, like others previously discussed, varies across datasets, seasons, and elevations. Interestingly, TPRR demonstrates the weakest correlation between snow depth and albedo trends, in contrast to the other datasets, which occasionally show a strong positive correlation. Most of the time, the three datasets (ERA5, IMDAA, and HAR-v2) display strong positive correlations at lower elevations. The correlation is strongest in summer, followed by autumn.

4. Summary and Conclusions

This study investigated temperature and precipitation patterns in the TP using four reanalysis datasets—ERA5, IMDAA, HAR-v2, and TPRR—with a focus on elevation dependency and seasonal variability. The analysis aimed to assess how these datasets differ, their alignment with HadISD station data, and how well they compare to findings from previous studies. A positive elevation-dependent warming trend is observed across all four datasets during winter and autumn, with varying magnitudes. In winter, the temperature trend shows a sudden rise around 4500 m and above, whereas in autumn, the warming trend increases more gradually and consistently with elevation.
All four reanalysis shows positive elevation-dependent wetting trends in all seasons except autumn with drying trends at lower elevations and relatively minimal changes at higher elevations. This study highlights significant discrepancies among the four datasets ERA5, IMDAA, HAR-v2, and TPRR when examining the correlations between temperature, precipitation, albedo, and snow depth trends across different elevations. The variability in these trends is inconsistent between datasets, making it challenging to use them for studying the underlying mechanisms of EDCC.
In certain instances, the datasets reveal unexpected relationships between variables, such as a weak correlation between temperature and snow depth trends. This raises concerns about their reliability for detailed climate analysis. While regional reanalysis datasets like HAR-v2 and TPRR incorporate more specific updates, they still fail to replicate the accuracy of ERA5 in capturing temperature and precipitation trends. ERA5 and IMDAA exhibit similar results in capturing correlations between trends, particularly for temperature and precipitation. In contrast, TPRR shows unique correlations, such as between temperature and precipitation trends, while snow depth and albedo trends remain largely independent. HAR-v2 generally exhibits weaker correlations overall but shows a strong relationship between temperature trends and albedo trends, as well as between snow depth trends and albedo trends. These differences highlight the variability in the trends of the relationships between the four variables across datasets, underscoring the need for careful interpretation. This emphasises the importance of validating reanalysis datasets against available observational data in the relevant time period and space before conducting elevation-dependent studies. Extending these findings to regions and time periods with sparse observational data offers the potential to study EDCC more accurately using reanalysis datasets. However, given the variations among datasets, future studies should carefully select datasets based on the specific climate variables, elevation ranges, and seasons of interest. This evaluation underscores the importance of identifying the most suitable reanalysis dataset, or a combination of datasets, to use as a reliable reference for studying EDCC in TP, even in regions or periods lacking observational data.

Supplementary Materials

The following supporting information can be downloaded at https://www.mdpi.com/article/10.3390/atmos16030327/s1; Figure S1: Mean annual temperature trends of 8 bands for four datasets, Figure S2: Annual temperature trends of the nearest-neighbor grid cell for four datasets compared with HadISD station data, Figure S3: Mean annual precipitation trends of 8 bands for four datasets.

Author Contributions

Conceptualization, A.R. and B.A.; methodology, A.R.; software, A.R.; validation, A.R.; formal analysis, A.R.; investigation, A.R., P.S. and B.A.; resources, B.A.; data curation, A.R. and P.S.; writing—original draft preparation, A.R.; writing—review and editing, A.R., P.S. and B.A.; visualization, A.R.; supervision, B.A.; project administration, B.A.; funding acquisition, B.A. All authors have read and agreed to the published version of the manuscript.

Funding

This research was funded by the Deutsche Forschungsgemeinschaft (DFG, German Research Foundation)—TRR 301—Project-ID 428312742.

Institutional Review Board Statement

Not applicable.

Data Availability Statement

The original data presented in the study are openly available. Details, along with relevant links, can be found in Section 2.

Acknowledgments

The authors thank Goethe University Frankfurt for funding and providing the computational resources. We acknowledge the use of the ERA5, IMDAA, HAR-v2, and TPRR datasets and extend our gratitude to all the contributors for their assistance and support throughout the research. P.S. was funded by the Deutsche Forschungsgemeinschaft (DFG, German Research Foundation)—TRR 301—Project-ID 428312742.

Conflicts of Interest

The authors declare no conflicts of interest.

Appendix A

Principal Component Analysis (PCA)

Let X be a matrix for ERA5 band 1 in the winter season. X will be an n × p matrix where n is the number of grids (number of observation) in ERA5 band 1, and p is the number of variables we are considering. The data is centered by subtracting mean of each variable from its corresponding column.
Performing Singular Value Decomposition (SVD—a matrix factorization technique that decomposes a matrix into three component matrices) on X centered will result in the following:
U , S , V T = S V D [ X centered ]
U = ( n × r ) matrix , V = ( p × r ) matrix , S = ( r × r ) diagonal matrix , r = rank of X centered .
The columns of V are the eigenvectors of the covariance matrix of X. So, the columns of V correspond to the PCs and the rows of V correspond to the original variables.
Computation of explained variance ratio:
Explained Variance Ratio of i t h PC = S i i 2 j = 1 r S j j 2
S i i = i t h diagonal element of matrix S .
We selected first three principal components (PCs) for our analysis, as these were sufficient to capture at least 70% of the total variance in the dataset.
From the matrix V, the element V i , j is the loading of the i t h variable on the j t h PC. The angle between the vectors in the loading plot provide information about the correlation between the variables. The angles between the vectors in the loading plots indicate the correlation between variables: angles < 90° suggest a positive correlation, angles ≈ 90° indicate little or no correlation, and angles > 90° suggest a negative correlation. For example, in the PCA loading plot for ERA5-band 1 in winter, the angle between the temperature and precipitation trends is 106.8°, which denotes a slight negative correlation between the variables.
Figure A1. 3D loading plot illustrating visual representation of variable contributions in PCA.
Atmosphere 16 00327 g0a1

References

  1. Intergovernmental Panel On Climate Change (IPCC). Climate Change 2022—Impacts, Adaptation and Vulnerability: Working Group II Contribution to the Sixth Assessment Report of the Intergovernmental Panel on Climate Change, 1st ed.; Cambridge University Press: Cambridge, UK, 2023. [Google Scholar] [CrossRef]
  2. Byrne, M.P.; Boos, W.R.; Hu, S. Elevation-dependent warming: Observations, models, and energetic mechanisms. Weather Clim. Dyn. 2024, 5, 763–777. [Google Scholar] [CrossRef]
  3. Rangwala, I.; Miller, J.R. Climate change in mountains: A review of elevation-dependent warming and its possible causes. Clim. Change 2012, 114, 527–547. [Google Scholar] [CrossRef]
  4. Pepin, N.C.; Arnone, E.; Gobiet, A.; Haslinger, K.; Kotlarski, S.; Notarnicola, C.; Palazzi, E.; Seibert, P.; Serafin, S.; Schöner, W.; et al. Climate Changes and Their Elevational Patterns in the Mountains of the World. Rev. Geophys. 2022, 60, e2020RG000730. [Google Scholar] [CrossRef]
  5. Intergovernmental Panel On Climate Change (IPCC). Climate Change 2021—The Physical Science Basis: Working Group I Contribution to the Sixth Assessment Report of the Intergovernmental Panel on Climate Change, 1st ed.; Cambridge University Press: Cambridge, UK, 2023. [Google Scholar] [CrossRef]
  6. Kad, P.; Ha, K.J.; Lee, S.S.; Chu, J.E. Projected Changes in Mountain Precipitation Under CO2-Induced Warmer Climate. Earth’s Future 2023, 11, e2023EF003886. [Google Scholar] [CrossRef]
  7. Ferguglia, O.; Palazzi, E.; Arnone, E. Elevation dependent change in ERA5 precipitation and its extremes. Clim. Dyn. 2024, 62, 8137–8153. [Google Scholar] [CrossRef]
  8. Cui, T.; Li, Y.; Yang, L.; Nan, Y.; Li, K.; Tudaji, M.; Hu, H.; Long, D.; Shahid, M.; Mubeen, A.; et al. Non-monotonic changes in Asian Water Towers’ streamflow at increasing warming levels. Nat. Commun. 2023, 14, 1176. [Google Scholar] [CrossRef]
  9. Dong, S.; Zhang, Y.; Shen, H.; Li, S.; Xu, Y. Introduction to the Third Pole. In Grasslands on the Third Pole of the World: Structure, Function, Process, and Resilience of Social-Ecological Systems; Dong, S., Zhang, Y., Shen, H., Li, S., Xu, Y., Eds.; Springer International Publishing: Cham, Switzerland, 2023; pp. 1–30. [Google Scholar] [CrossRef]
  10. Yanai, M.; Wu, G.X. Effects of the Tibetan Plateau. In The Asian Monsoon; Wang, B., Ed.; Springer: Berlin/Heidelberg, Germany, 2006; pp. 513–549. [Google Scholar] [CrossRef]
  11. Wang, B.; Bao, Q.; Hoskins, B.; Wu, G.; Liu, Y. Tibetan Plateau warming and precipitation changes in East Asia. Geophys. Res. Lett. 2008, 35, L14702. [Google Scholar] [CrossRef]
  12. Yang, K.; Ye, B.; Zhou, D.; Wu, B.; Foken, T.; Qin, J.; Zhou, Z. Response of hydrological cycle to recent climate changes in the Tibetan Plateau. Clim. Change 2011, 109, 517–534. [Google Scholar] [CrossRef]
  13. Zheng, G.; Allen, S.K.; Bao, A.; Ballesteros-Cánovas, J.A.; Huss, M.; Zhang, G.; Li, J.; Yuan, Y.; Jiang, L.; Yu, T.; et al. Increasing risk of glacial lake outburst floods from future Third Pole deglaciation. Nat. Clim. Change 2021, 11, 411–417. [Google Scholar] [CrossRef]
  14. Liu, X.; Chen, B. Climatic warming in the Tibetan Plateau during recent decades. Int. J. Climatol. 2000, 20, 1729–1742. [Google Scholar] [CrossRef]
  15. Duan, A.; Wu, G. Change of cloud amount and the climate warming on the Tibetan Plateau. Geophys. Res. Lett. 2006, 33, L22704. [Google Scholar] [CrossRef]
  16. Wu, S.; Yin, Y.; Zheng, D.; Yang, Q. Climatic trends over the Tibetan Plateau during 1971–2000. J. Geogr. Sci. 2007, 17, 141–151. [Google Scholar] [CrossRef]
  17. Zhou, P.; Tang, J.; Ma, M.; Ji, D.; Shi, J. High resolution Tibetan Plateau regional reanalysis 1961-present. Sci. Data 2024, 11, 444. [Google Scholar] [CrossRef]
  18. Ding, Y.; Wang, F.; Lu, Z.; Sun, P.; Wei, R.; Zhou, L.; Ao, T. Assessments of various precipitation product performances and disaster monitoring utilities over the Tibetan Plateau. Sci. Rep. 2024, 14, 19740. [Google Scholar] [CrossRef]
  19. MacFerrin, M.; Amante, C.; Carignan, K.; Love, M.; Lim, E. The Earth Topography 2022 (ETOPO 2022) Global DEM dataset. Earth Syst. Sci. Data Discuss. 2024; preprint. [Google Scholar] [CrossRef]
  20. NOAA National Centers for Environmental Information. ETOPO Global Relief Model—ncei.noaa.gov. Available online: https://www.ncei.noaa.gov/products/etopo-global-relief-model (accessed on 29 January 2025).
  21. Hersbach, H.; Bell, B.; Berrisford, P.; Hirahara, S.; Horányi, A.; Muñoz-Sabater, J.; Nicolas, J.; Peubey, C.; Radu, R.; Schepers, D.; et al. The ERA5 global reanalysis. Q. J. R. Meteorol. Soc. 2020, 146, 1999–2049. [Google Scholar] [CrossRef]
  22. Kouki, K.; Luojus, K.; Riihelä, A. Evaluation of snow cover properties in ERA5 and ERA5-Land with several satellite-based datasets in the Northern Hemisphere in spring 1982–2018. Cryosphere 2023, 17, 5007–5026. [Google Scholar] [CrossRef]
  23. Rani, S.I.; Arulalan, T.; George, J.P.; Rajagopal, E.N.; Renshaw, R.; Maycock, A.; Barker, D.M.; Rajeevan, M. IMDAA: High Resolution Satellite-era Reanalysis for the Indian Monsoon Region. J. Clim. 2021, 34, 5109–5133. [Google Scholar] [CrossRef]
  24. Wang, X.; Tolksdorf, V.; Otto, M.; Scherer, D. WRF-based dynamical downscaling of ERA5 reanalysis data for High Mountain Asia: Towards a new version of the High Asia Refined analysis. Int. J. Climatol. 2021, 41, 743–762. [Google Scholar] [CrossRef]
  25. Tang, J.; Zhou, P.; Ma, M.; Ji, D.; Shi, J. High Resolution Tibetan Plateau Regional Reanalysis (1961–Present). 2023. Available online: https://data.tpdc.ac.cn/en/data/cae861c4-9361-4a4a-a61e-71c54819c018 (accessed on 29 January 2025).
  26. Beaudoing, H.; Rodell, M.; NASA/GSFC/HSL. GLDAS Noah Land Surface Model L4 Monthly 0.25 × 0.25 Degree, Version 2.1, p.N.y. Available online: https://disc.gsfc.nasa.gov/datasets/GLDAS_NOAH025_M_2.1/summary (accessed on 29 January 2025).
  27. Dunn, R.J.H.; Willett, K.M.; Thorne, P.W.; Woolley, E.V.; Durre, I.; Dai, A.; Parker, D.E.; Vose, R.S. HadISD: A quality-controlled global synoptic report database for selected variables at long-term stations from 1973–2011. Clim. Past 2012, 8, 1649–1679. [Google Scholar] [CrossRef]
  28. Dunn, R.J.H.; Willett, K.M.; Parker, D.E.; Mitchell, L. Expanding HadISD: Quality-controlled, sub-daily station data from 1931. Geosci. Instrum. Methods Data Syst. 2016, 5, 473–491. [Google Scholar] [CrossRef]
  29. Ahmed, R.; Shamim, T.; Bansal, J.K.; Rather, A.F.; Javaid, S.; Wani, G.F.; Malik, I.H.; Ahmed, P.; Jain, S.K.; Imdad, K.; et al. Assessing climate trends in the Northwestern Himalayas: A comprehensive analysis of high-resolution gridded and observed datasets. Geomat. Nat. Hazards Risk 2024, 15, 2401994. [Google Scholar] [CrossRef]
  30. Wood, R.R.; Janzing, J.; Van Hamel, A.; Götte, J.; Schumacher, D.L.; Brunner, M.I. Comparison of high-resolution climate reanalysis datasets for hydro-climatic impact studies. EGUsphere, 2024; preprint. [Google Scholar] [CrossRef]
  31. Jolliffe, I.T.; Cadima, J. Principal component analysis: A review and recent developments. Philos. Trans. R. Soc. A Math. Phys. Eng. Sci. 2016, 374, 20150202. [Google Scholar] [CrossRef] [PubMed]
  32. Beniston, M. Mountain Weather and Climate: A General Overview and a Focus on Climatic Change in the Alps. Hydrobiologia 2006, 562, 3–16. [Google Scholar] [CrossRef]
  33. Guan, Y.; Liu, J.; Cui, W.; Chen, D.; Zhang, J.; Lu, H.; Maeda, E.E.; Zeng, Z.; Beck, H.E. Elevation Regulates the Response of Climate Heterogeneity to Climate Change. Geophys. Res. Lett. 2024, 51, e2024GL109483. [Google Scholar] [CrossRef]
  34. Collier, E.; Ban, N.; Richter, N.; Ahrens, B.; Chen, D.; Chen, X.; Lai, H.W.; Leung, R.; Li, L.; Medvedova, A.; et al. The first ensemble of kilometer-scale simulations of a hydrological year over the third pole. Clim. Dyn. 2024, 62, 7501–7518. [Google Scholar] [CrossRef]
  35. News, B. Mt Everest Grows by Nearly a Metre to New Height. 2020. Available online: https://www.bbc.com/news/world-asia-55218443 (accessed on 13 February 2025).
  36. Chen, P.; Kang, S.; Li, C.; Zhang, Q.; Guo, J.; Tripathee, L.; Zhang, Y.; Li, G.; Gul, C.; Cong, Z.; et al. Carbonaceous aerosol characteristics on the Third Pole: A primary study based on the Atmospheric Pollution and Cryospheric Change (APCC) network. Environ. Pollut. 2019, 253, 49–60. [Google Scholar] [CrossRef]
  37. Wang, Y.; Sun, W.; Huai, B.; Wang, Y.; Ji, K.; Yang, X.; Du, W.; Qin, X.; Wang, L. Comparison and evaluation of the performance of reanalysis datasets for compound extreme temperature and precipitation events in the Qilian Mountains. Atmos. Res. 2024, 304, 107375. [Google Scholar] [CrossRef]
  38. Jiang, Y.; Yang, K.; Qi, Y.; Zhou, X.; He, J.; Lu, H.; Li, X.; Chen, Y.; Li, X.; Zhou, B.; et al. TPHiPr: A long-term (1979–2020) high-accuracy precipitation dataset (1/30°, daily) for the Third Pole region based on high-resolution atmospheric modeling and dense observations. Earth Syst. Sci. Data 2023, 15, 621–638. [Google Scholar] [CrossRef]
  39. Von Lerber, A.; Mech, M.; Rinke, A.; Zhang, D.; Lauer, M.; Radovan, A.; Gorodetskaya, I.; Crewell, S. Evaluating seasonal and regional distribution of snowfall in regional climate model simulations in the Arctic. Atmos. Chem. Phys. 2022, 22, 7287–7317. [Google Scholar] [CrossRef]
  40. Palazzi, E.; Filippi, L.; Von Hardenberg, J. Insights into elevation-dependent warming in the Tibetan Plateau-Himalayas from CMIP5 model simulations. Clim. Dyn. 2017, 48, 3991–4008. [Google Scholar] [CrossRef]
  41. You, Q.; Cai, Z.; Pepin, N.; Chen, D.; Ahrens, B.; Jiang, Z.; Wu, F.; Kang, S.; Zhang, R.; Wu, T.; et al. Warming amplification over the Arctic Pole and Third Pole: Trends, mechanisms and consequences. Earth-Sci. Rev. 2021, 217, 103625. [Google Scholar] [CrossRef]
  42. Yao, T.; Xue, Y.; Chen, D.; Chen, F.; Thompson, L.; Cui, P.; Koike, T.; Lau, W.K.M.; Lettenmaier, D.; Mosbrugger, V.; et al. Recent Third Pole’s Rapid Warming Accompanies Cryospheric Melt and Water Cycle Intensification and Interactions between Monsoon and Environment: Multidisciplinary Approach with Observations, Modeling, and Analysis. Bull. Am. Meteorol. Soc. 2019, 100, 423–444. [Google Scholar] [CrossRef]
  43. Rebetez, M. Seasonal relationship between temperature, precipitation and snow cover in a mountainous region. Theor. Appl. Climatol. 1996, 54, 99–106. [Google Scholar] [CrossRef]
  44. Li, C.; Su, F.; Yang, D.; Tong, K.; Meng, F.; Kan, B. Spatiotemporal variation of snow cover over the Tibetan Plateau based on MODIS snow product, 2001–2014. Int. J. Climatol. 2017, 38, 708–728. [Google Scholar] [CrossRef]
  45. You, Q.; Kang, S.; Ren, G.; Fraedrich, K.; Pepin, N.; Yan, Y.; Ma, L. Observed changes in snow depth and number of snow days in the eastern and central Tibetan Plateau. Clim. Res. 2011, 46, 171–183. [Google Scholar] [CrossRef]
  46. Zhang, X.; Wang, K.; Boehrer, B. Variability in observed snow depth over China from 1960 to 2014. Int. J. Climatol. 2021, 41, 374–392. [Google Scholar] [CrossRef]
  47. Dyrrdal, A.V.; Saloranta, T.; Skaugen, T.; Stranden, H.B. Changes in snow depth in Norway during the period 1961–2010. Hydrol. Res. 2013, 44, 169–179. [Google Scholar] [CrossRef]
  48. Orsolini, Y.; Wegmann, M.; Dutra, E.; Liu, B.; Balsamo, G.; Yang, K.; De Rosnay, P.; Zhu, C.; Wang, W.; Senan, R.; et al. Evaluation of snow depth and snow cover over the Tibetan Plateau in global reanalyses using in situ and satellite remote sensing observations. Cryosphere 2019, 13, 2221–2239. [Google Scholar] [CrossRef]
  49. Marshall, S.J.; Miller, K. Seasonal and interannual variability of melt-season albedo at Haig Glacier, Canadian Rocky Mountains. Cryosphere 2020, 14, 3249–3267. [Google Scholar] [CrossRef]
Figure 1. Orography from the datasets: (a) ETOPO, (b) ERA5, (c) IMDAA, (d) HAR-v2, and (e) TPRR.
Atmosphere 16 00327 g001
Figure 2. Annual mean (a) temperature (b) precipitation with 90% confidence interval.
Atmosphere 16 00327 g002
Figure 3. Annual temperature trends for 1988–2020: (a) ERA5, (b) IMDAA, (c) HAR-v2, (d) TPRR. Annual precipitation trends for 1988–2020: (e) ERA5, (f) IMDAA, (g) HAR-v2, (h) TPRR.
Atmosphere 16 00327 g003
Figure 4. Seasonal temperature trends for 1988–2020: (a) ERA5–winter, (b) IMDAA–winter, (c) HAR-v2–winter, (d) TPRR–winter, (e) ERA5–spring, (f) IMDAA–spring, (g) HAR-v2–spring, (h) TPRR–spring, (i) ERA5–summer, (j) IMDAA–summer, (k) HAR-v2–summer, (l) TPRR–summer, (m) ERA5–autumn, (n) IMDAA–autumn, (o) HAR-v2–autumn, (p) TPRR–autumn.
Atmosphere 16 00327 g004
Figure 5. Seasonal precipitation trends for 1988–2020: (a) ERA5–winter, (b) IMDAA–winter, (c) HAR-v2–winter, (d) TPRR–winter, (e) ERA5–spring, (f) IMDAA–spring, (g) HAR-v2–spring, (h) TPRR–spring, (i) ERA5–summer, (j) IMDAA–summer, (k) HAR-v2–summer, (l) TPRR–summer, (m) ERA5–autumn, (n) IMDAA–autumn, (o) HAR-v2–autumn, (p) TPRR–autumn.
Atmosphere 16 00327 g005
Figure 6. Values of elevation-dependent climate change indices of (a) temperature and (b) precipitation.
Atmosphere 16 00327 g006
Figure 7. Table showing the correlation between pairs of variables across different seasons and elevation bands. E, I, H, and T represent ERA5, IMDAA, HAR-v2, and TPRR, respectively. The color gradients in the cells represent the intensity of correlation. Dark red indicates a strong negative correlation, dark blue signifies a strong positive correlation, and lighter colors correspond to weaker correlations.
Atmosphere 16 00327 g007
Table 1. Summary of reanalysis datasets.
ERA5IMDAAHAR-v2TPRR
Temporal ResolutionHourlyHourlyHourlyHourly
Spatial Resolution31 km12 km10 km9 km
Time Coverage1940–Present1979–Present1980–20231961–Present
Spatial CoverageGlobalIndian Monsoon RegionHMATibetan Plateau
ModelIFS 41r2UM v10.2WRF v4.0.3WRF v4.2
Boundary Condition-ERA-IERA5ERA5
Table 2. Definition of elevation bands for classification of grid points.
BandsElevation (m)Area (%)
ERA5 IMDAA HAR-v2 TPRR
12000 ≤ x 1 < 25002.42.32.72.1
22500 ≤ x < 30004.64.75.24.7
33000 ≤ x < 35005.65.66.05.0
43500 ≤ x < 40007.37.39.07.3
54000 ≤ x < 450018.818.317.417.0
64500 ≤ x < 500035.036.233.836.4
75000 ≤ x < 550025.324.822.924.6
85500 ≤ x0.90.72.93.0
1 Elevation of grid point.
Disclaimer/Publisher’s Note: The statements, opinions and data contained in all publications are solely those of the individual author(s) and contributor(s) and not of MDPI and/or the editor(s). MDPI and/or the editor(s) disclaim responsibility for any injury to people or property resulting from any ideas, methods, instructions or products referred to in the content.

