Article

CALIPSO Overpasses During Three Atmospheric Pollen Events Detected by Hirst-Type Volumetric Samplers in Two Urban Cities in Greece

by
Archontoula Karageorgopoulou
1,*,
Elina Giannakaki
1,
Christos Stathopoulos
1,
Thanasis Georgiou
2,
Eleni Marinou
2,
Vassilis Amiridis
2,
Ioanna Pyrri
3,
Maria-Christina Gatou
1,
Xiaoxia Shang
4,
Athanasios Charalampopoulos
5,
Despoina Vokou
5 and
Athanasios Damialis
5
1
Department of Environmental Physics and Meteorology, Faculty of Physics, University of Athens, 15784 Athens, Greece
2
Institute for Astronomy, Astrophysics, Space Applications and Remote Sensing, National Observatory of Athens, 15236 Athens, Greece
3
Department of Ecology and Systematics, Faculty of Biology, University of Athens, 15784 Athens, Greece
4
Finnish Meteorological Institute, Atmospheric Research Centre of Eastern Finland, 70211 Kuopio, Finland
5
Department of Ecology, School of Biology, Faculty of Sciences, Aristotle University of Thessaloniki, 54124 Thessaloniki, Greece
*
Author to whom correspondence should be addressed.
Atmosphere 2025, 16(3), 317; https://doi.org/10.3390/atmos16030317
Submission received: 24 January 2025 / Revised: 24 February 2025 / Accepted: 5 March 2025 / Published: 10 March 2025

Abstract

:
Vertically retrieved optical properties by Cloud-Aerosol Lidar and Infrared Pathfinder Satellite Observations (CALIPSO) were investigated in the case of three selected events over Athens and Thessaloniki with documented high pollen concentrations. Hirst-type volumetric samplers were used to detect and characterize the pollen during the CALIPSO overpasses. Only cases with a total pollen concentration greater than 400 grains m−3 for at least two hours per day were considered severe pollen events, while model simulations were used to exclude the presence of other depolarizing aerosol types. This study provides mean values of lidar-derived optical properties inside the detected pollen layers; i.e., optical values represent the atmosphere with the presence of pollen, in urban cities of Greece. Specifically, three observed aerosol layers, one over Athens and two over Thessaloniki with particulate color ratios of 0.652 ± 0.194, 0.638 ± 0.362, and 0.456 ± 0.284, and depolarization ratios of 8.70 ± 6.26%, 28.30 ± 14.16%, and 8.96 ± 6.87%, respectively, were misclassified by CALIPSO as marine-dusty marine, dust, and polluted dust. In cases of intense pollen presence, CALIPSO vertical profiles and aerobiological monitoring methods may be used synergistically to better characterize the atmospheric pollen layers.

Graphical Abstract

1. Introduction

Pollen constitutes the second most abundant type of biogenic particles in the atmosphere, and it affects climate on local and global scales [1,2]. Atmospheric pollen at the ground level has been associated with allergy-related diseases, such as asthma, rhinitis, and atopic eczema [3,4,5]. Furthermore, it has been found that pollen exposure diminishes the antiviral interferon response resulting in a weakened immunity against certain respiratory viruses [6,7]. The number of people suffering from pollen-triggered allergies is expected to increase due to climate change [8]. Climate change increases the amount of pollen and shifts the pollen season earlier [9]. In addition, pollen can be lifted up to several kilometers by turbulent mixing in the boundary layer, and once it reaches the top of the boundary layer, it can travel thousands of kilometers from the source regions [10,11,12,13,14]. A considerable amount of pollen was registered at 2 km, and pollen was also found to be present at 4 km according to the Cooperative Convective Precipitation Experiment (CCOPE) project near Miles City, Montana (USA) [15]. Pollen impacts the solar radiation reaching Earth, and this provokes a cooling effect, while the warming of the atmosphere is favored through the interaction of the pollen and long-wave radiation. Moreover, the presence of pollen can influence cloud formation and properties by acting as both ice-nucleating particles [16,17,18] and cloud condensation nuclei [19,20,21]. Evaluating these health and climate impacts is challenging, as there are around 4000 pollen types https://www.paldat.org (accessed on 16 February 2025) [22].
Due to the implications of pollen in human health and its environmental and climatological impact, the number of pollen monitoring stations is constantly increasing worldwide [23,24]. The majority of them are based on the Hirst principle [25] that captures bioparticles on adhesive surfaces. Τhe diverse pollen taxa present in the air are identified optically with the use of light microscopes according to their morphological characteristics [26,27]. In recent years, automated devices have been developed that can monitor pollen in real-time or near real-time. These samplers utilize the physical or chemical properties to infer the identity of the detected pollen grains, such as the Wideband Integrated Bioaerosol Sensor (WIBS) [28,29] and the Plair Rapid-E [30] via the fluorescence spectra, the BAA500 via image recognition [31], the Swisens Poleno via digital holography [32], and the KH-3000-01 via light scattering [33]. These devices are placed on building rooftops or on the ground; therefore, they do not offer information regarding the vertical distribution of pollen.
An effective method to investigate the vertical distribution of pollen grains is light detection and ranging (lidar). The particulate depolarization ratio can be used to track pollen grains when other non-spherical particle types are absent [34]. Pollen observation has been conducted using ground-based lidar [35,36,37,38,39], while this study expands on the use of space-based lidar. The Cloud-Aerosol Lidar with Orthogonal Polarization (CALIOP) flown aboard the Cloud-Aerosol Lidar and Infrared Pathfinder Satellite Observations (CALIPSO) provide comprehensive information regarding the optical properties of the particles [40,41,42,43,44,45,46,47,48].
In Greece, pollen has been primarily recorded using conventional methods, except for one study that implemented a ground-based lidar method to detect the type and amount of pollen grains and fungal spores in real time [49]. In Athens, airborne pollen monitoring is limited. A study identified 22 pollen types present in the air during the period from June 1973 to August 1974, with the prevalent ones being Olea, Pinus, Cupressaceae, Poaceae, Quercus, Urticaceae, Plantago, Chenopodium, Rumex, and Eucalyptus [50]. In recent years, Pinus, Olea, Cupressus, Quercus, Populus, and Parietaria pollen grains were registered during April–May 2018 [49]. On the other hand, Thessaloniki possesses one of the longest pollen (and fungal spores) time-series worldwide, commencing since 1987, with the most dominant airborne pollen types being Cupressaceae, Quercus, Urticaceae, Oleaceae, Pinaceae, Poaceae, Platanus, Corylus, Chenopodiaceae, and Populus, based on the (1987–2001) pollen calendar [51]. Most studies in Greece so far have addressed the characterization of pollen type abundance and pollen season onset, as well as the relation between pollen spatiotemporal distribution and meteorological factors. Pollen and fungal spores in the air have been primarily monitored in urban areas to forecast and mitigate allergies. Research on pollen at higher altitudes (above ground level) has not been performed, except for the study by Damialis et al. (2017) [12], conducted in Thessaloniki from March to July 2010. Bioparticles were sampled with an aircraft and a car at altitudes ranging from sea level to 2 km above the ground and varied qualitatively and quantitatively, even far from the primary source. However, apart from this restricted altitude study on pollen, there are still no studies on its optical properties in Greece, unlike other European countries, such as Finland [34] and Spain [38].
This study, for the first time, analyzes intense pollen events over Athens and Thessaloniki, registered by Hirst-type volumetric samplers in conjunction with vertical aerosol profiles generated by CALIPSO. The aim of this research is to investigate the potential of CALIPSO pollen detection based on depolarization measurements. This is challenging due to other aerosols that may significantly depolarize radiation. This study also aims to provide the optical properties of different pollen types measured in two urban cities.

2. Methodology

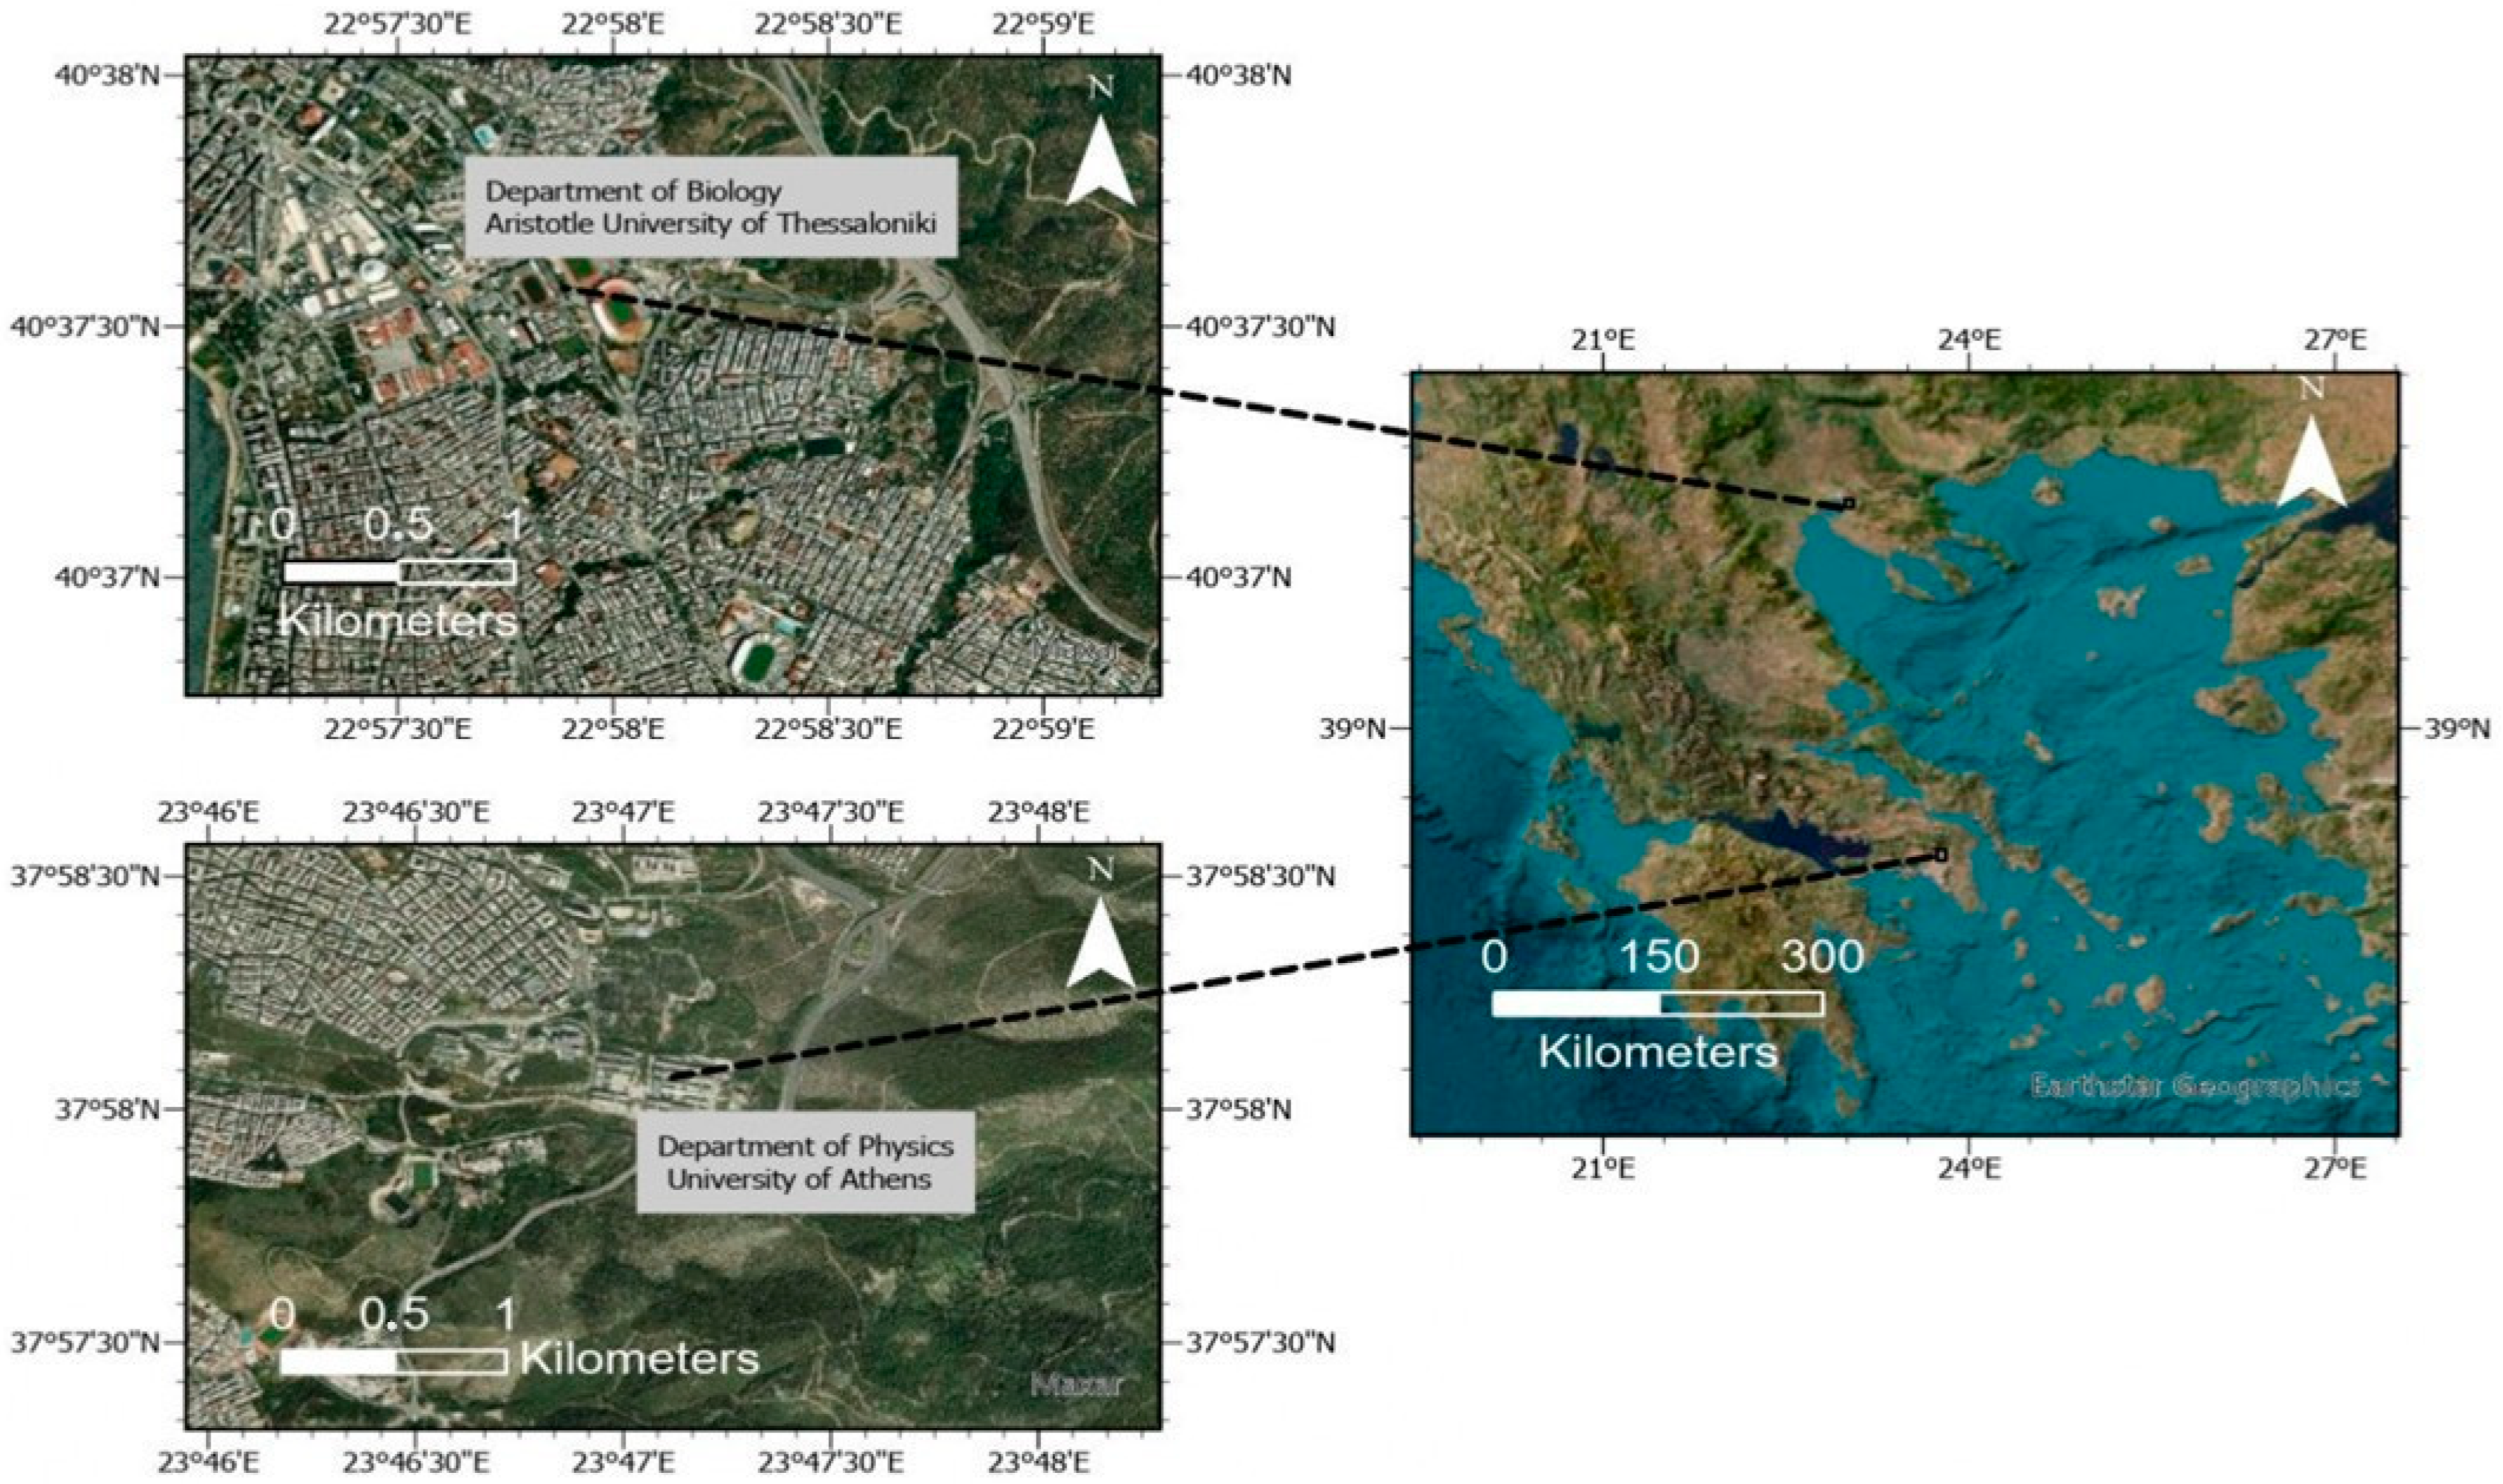
2.1. Sites Description

Athens, the capital and largest city of Greece with a population of about 3.8 million, [52] is located in the center of the Attica basin. Attica is surrounded by mountains and has an opening to the sea in the south. The mountains include Hymettus (1050 m) in the east, which is the closest to the study area, Pendeli (1100 m) in the north, Parnitha (1400 m) in the northwest, and Aigaleo (450 m) in the west. The peri-urban forests are dominated by Pinus halepensis mixed with Quercus coccifera, Q. pubescens, Juniperus oxycedrus, and Cupressus sempervirens, in the lowlands intermixed with Olea europaea, Cercis siliquastrum, Ficus carica, and Prunus spp. The maquis vegetation includes Pistacia lentiscus, Arbutus unedo, Laurus nobilis, Erica arborea, Myrtus communis, etc. The phryganic ecosystems consist mainly of Phlomis fruticosa, Sarcopoterium spinosum, Euphorbia acanthothamnos, Thymus capitatus, Asphodelus, and Cistus spp. The climate of Athens is mild Mediterranean, with hot and dry summers and mild, not very rainy winters.
The complexity of this topography may lead to changes in the flow patterns and the depth of the mixing layer, thus influencing the dispersion of pollutants [53] including pollen particles. Attica’s intricate topography generates local circulation like sea and land breezes, drainage, and upslope flows. The intricacy of this geographical layout confines air pollutants, especially when meteorological factors favor local air circulation [54]. The study of air pollution and particulate matter including bioparticles in the area of Athens is of great importance for human health and the environment [55,56,57,58,59].
Thessaloniki is the second largest city in Greece with a population of approximately one million residents [52], and is located in northern Greece, situated around the Thermaikos Gulf. Thessaloniki is also surrounded by mountains that include Mount Vertiskos (1103 m) in the north and Chortiatis Mountain (1201 m) in the southeast, while towards the west there are mostly flatlands. The forests are predominantly composed of Pinus spp., Cupressus sempervirens, and Quercus spp., and the deciduous ones, primarily Quercus spp., Fagus spp., Carpinus spp., and Corylus spp.
The climate in Thessaloniki is similar to that of the Mediterranean region, i.e., summers are commonly hot and dry, while winters are mild but more rainy. The presence of anticyclonic conditions in the northern part of Greece is associated with more frequent episodes of poor air quality. These conditions are characterized by a weak or very weak surface pressure gradient intensity, which varies depending on the location and size of the anticyclone [60]. Moreover, air pollution episodes are influenced by the formation of local atmospheric circulations, such as sea–land breezes and drainage flows, which are provoked by the complexity of the terrain [61,62].

2.2. Pollen Data

During this study, selected pollen events within the boundary layer of Athens and Thessaloniki are analyzed. Hirst-type volumetric samplers (Burkard Manufacturing Co., Ltd., Hertfordshire, UK) that record bioparticles continuously with a 2 h time resolution, are situated on the buildings’ rooftops of the Physics and Biology Departments, in Athens (lat. 37.97°, lon. 23.78°, approximately 260 m above sea level) and Thessaloniki (lat. 40.63°, lon 22.96°, approximately 70 m above sea level), respectively (Figure 1). The samplers have an air suction rate of 10 L·min−1. Bioparticles are impacted through an orifice and trapped on a transparent plastic tape coated with a gelvatol glycerol-phenol-based adhesive. The tape is replaced every week, and the exposed one is cut into 20 × 48 mm pieces, each corresponding to a 24 h calendar day. The pieces are mounted on glass slides with glycerine jelly and a cover slip and are examined under a Zeiss AxioStar Binocular Microscope (manufactured in 2004 by Zeiss AG, Oberkochen, Germany) at 400× magnification. For each 24 h piece, 12 transverse traverses are analyzed corresponding to the 2 h resolution. The identification of pollen types is to the genus or family level according to their distinctive morphological features. Pollen concentration is expressed in grains m−3, by transforming the counted grains on the sample tape surface in relation to the inlet airflow and the tape area analyzed.
The Hirst-type sampler documented the presence of 39 pollen types in Athens during the spring of 2021. These include Alnus, Betula, Betulaceae, Brasicaceae, Carex, Citrus, Compositae, Cupressus, Ephedra, Ericaceae, Eucalyptus, Euphorbia, Fraxinus, Graminae, Hypericum, Juglans, Laurus, Moraceae, Olea, Oleaceae, Phlomis, Pinaceae, Platanus, Poaceae, Populus, Quercus, Rosaceae, Rumex, Salix, Saxifraga-Teucrium, Silene, Taraxacum, Trifolium, Parietaria, Urticaceae, Vicia, Vitis, and Pteridium pollen grains. Additionally, the presence of 18 pollen types, Alnus, Ambrosia, Artemisia, Betula, Carpinus, Chenopodiaceae, Corylus, Cupressaceae, Oleaceae, Pinaceae, Plantago, Platanus, Poaceae, Populus, Quercus, Rumex, Ulmus, and Urticaceae was registered during the spring of 2020 in Thessaloniki.
In this study, a threshold of 400 grains m−3 in total pollen concentration for at least two hours was used to consider a clear-cut pollen event. According to Shang et al. (2020) [63], throughout a 4-month pollen campaign from May to August 2016 in Kuopio, Finland, a minimum value of 300 grains m−3 (for daily mean pollen concentration) was established for birch and pine, whereas a reduced threshold of 20 grains m−3 was set for nettle and mixed birch with spruce pollen types. A pollen episode is attributed to a mixture of diverse pollen taxa with one or two taxa dominating, as documented over the years with the Hirst-type sampler. However, studying pollen grains with a relatively minor contribution to the total is challenging. Therefore, a minimum concentration of 50 grains m−3 was established for analyzing the different pollen types. This approach facilitates the distinction between predominant pollen types, as pollen concentrations below this threshold contribute less than 12.5% to the total pollen concentration.
The selected case studies are presented in Table 1. The dominant pollen types, Pinaceae, Cupressaceae, Carpinus, and Platanus, are depicted in Figure 2. Pine pollen grains rank among the largest pollen grains, while their shape varies significantly from that of other pollen types due to the presence of two air sacci (Figure 2a) attached to the central part [64]. Cupressaceae family pollen grains have a diameter of 20 to 40 μm and an almost globose shape (Figure 2b). The exine of a Cupressaceae pollen grain has a granulose texture covered with numerous tiny particles smaller than a micrometer. As far as Carpinus pollen grains are concerned, the exine’s surface sculpture is irregularly cone-shaped, with a pointed apex (Figure 2c) [65]. Platanus pollen grains are suboblate (Figure 2d) and it was estimated that 88% of these were deposited within a range of 2.5 km, while some grains can go even further [66]. The participation percentages of the pollen types studied are 93%, 97%, and 91%, respectively, demonstrating that the presence of unstudied types does not affect the overall results.

2.3. Space-Based Lidar

CALIOP, manufactured by Ball Aerospace & Technologies Corp. in Boulder, Colorado, United States, was released on 28 April 2006, from Vandenberg Air Force Base, California, and has been acquiring global atmospheric profiles since June 2006. Data products generated from CALIOP measurements are globally distributed through the Atmospheric Science Data Center (ASDC) at NASA’s Langley Research Center (LaRC). As the principal instrument aboard the CALIPSO satellite of the NASA A-Train, CALIOP is a standard dual-wavelength (532 and 1064 nm) backscatter lidar operating a polarization channel at 532 nm [67]. CALIOP measures high-resolution (1/3 km in the horizontal direction and 30 m in the vertical direction) profiles of the attenuated backscatter of aerosols and clouds at 532 and 1064 nm along with polarized backscatter in the visible channel. These data are distributed as a part of the CALIPSO Level 1 products. After calibration and range correction, cloud and aerosol layers are identified, and aerosol backscatter and extinction are retrieved at 532 and 1064 nm and delivered in the Level 2 product. The CALIPSO Level 2 product determines the locations of layers within the atmosphere [68], discriminates aerosol layers from clouds [69], categorizes aerosol layers as one of the following subtypes: marine, dust, polluted continental/smoke, clean continental, polluted dust, elevated smoke, dusty marine, PSC (polar stratospheric clouds), volcanic ash, sulfate/other, and totally attenuated [70,71]. CALIPSO estimates the mean aerosol optical properties of each layer detected, including, among others, mean values of attenuated backscatter coefficient, optical depth, particulate depolarization ratio, particulate color ratio, and lidar ratio. From now on, the particulate color ratio and particulate depolarization ratio will be referred to as the color ratio and depolarization ratio, respectively. In this study, we used the Level 2 Aerosol Layer Product Version 4 in combination with Aerosol Profile Product Version 4, and we analyzed aerosol layers of marine, dust, dusty marine, or polluted dust.

2.4. Models

The origin of the air masses was investigated using the Hybrid Single-Particle Lagrangian Integrated Trajectory model (HYSPLIT) developed by the National Oceanic and Atmospheric Administration (NOAA). The NOAA HYSPLIT model devises uncomplicated approaches for simulating intricate dispersion and deposition processes in computing using either puff or particle approaches [72,73]. GDAS (Global Data Assimilation System) meteorological data was used to perform the simulations. Four-day backward trajectories arriving at the study period of Athens and Thessaloniki from 0.5 up to 2.5 km with a step of 0.5 km were examined. Moreover, the Regional Atmospheric Modeling System (RAMS) was employed, which was developed at Colorado State University in cooperation with the ASTER division of Mission Research Corporation, with the aim of simulating and forecasting meteorological phenomena and displaying their results [74]. The Atmospheric Modeling and Weather Forecasting Team of the University of Athens developed the Integrated Community Limited Area Modeling System (ICLAMS) based on RAMS with the main purpose of studying the interactions of aerosols with the atmosphere. The atmospheric model RAMS/ICLAMS was selected to describe dust and sea-salt emissions and transport [75]. Furthermore, the System for Integrated modeLling of Atmospheric coMposition (SILAM) was employed to assess the presence of pollen across the broader European region, encompassing the following six types: Alder, Birch, Grass, Mugwort, Olive, and Ragweed. However, the SILAM pollen types do not correspond to the dominant pollen types collected by the trap. All the simulations were utilized to confirm both the presence of intense pollen cases and the absence of marine and/or dust aerosols in the atmosphere during the intense pollen events.

3. Results

Three study periods were analyzed, one for Athens during the spring of 2021, and two for Thessaloniki during the spring of 2019 and 2020. Cases with a total pollen concentration greater than 400 grains m−3 for at least two hours per day were considered severe pollen events, and those that coincided with CALIPSO overpassing in a distance lower than 180 km were selected for analysis. The number of CALIPSO overpasses with the applied pollen criteria described above was 7 for Athens and 17 for Thessaloniki. From these cases, 3 of Athens and 7 of Thessaloniki were excluded due to clouds. One case in Athens was also omitted due to insufficient CALIPSO data.
In total, the origin of the air masses for 3 cases in Athens and 10 in Thessaloniki was investigated using backward trajectories analysis. One case in Thessaloniki was omitted due to Saharan dust transport. Two of the case studies over Athens and seven over Thessaloniki were characterized by CALIPSO as polluted continental aerosol. The presence of this type of aerosol was anticipated given the urban characteristics of the study areas, without disregarding the potential presence of pollen. Finally, three cases remained, one over Athens and two over Thessaloniki, in which the aerosol type was characterized as marine, dust, dusty marine, or polluted dust.
The RAMS/ICLAMS model was further used to confirm the absence of marine and/or dust particles in the finally selected cases. Strict limits were set for the concentrations of dust and sea-salt particles to validate their absence. The concentrations of dust and marine particles may not exceed the values of 5 µg·m−3 and 1.25 µg·m−3, respectively [76,77,78].
The prevailing meteorological conditions were analyzed to determine whether they facilitated the transport of aerosol particles between the volumetric trap sampling area and the location of the nearest satellite overpass, given the absence of pollen model data (e.g., SILAM) for the identified dominant pollen types.

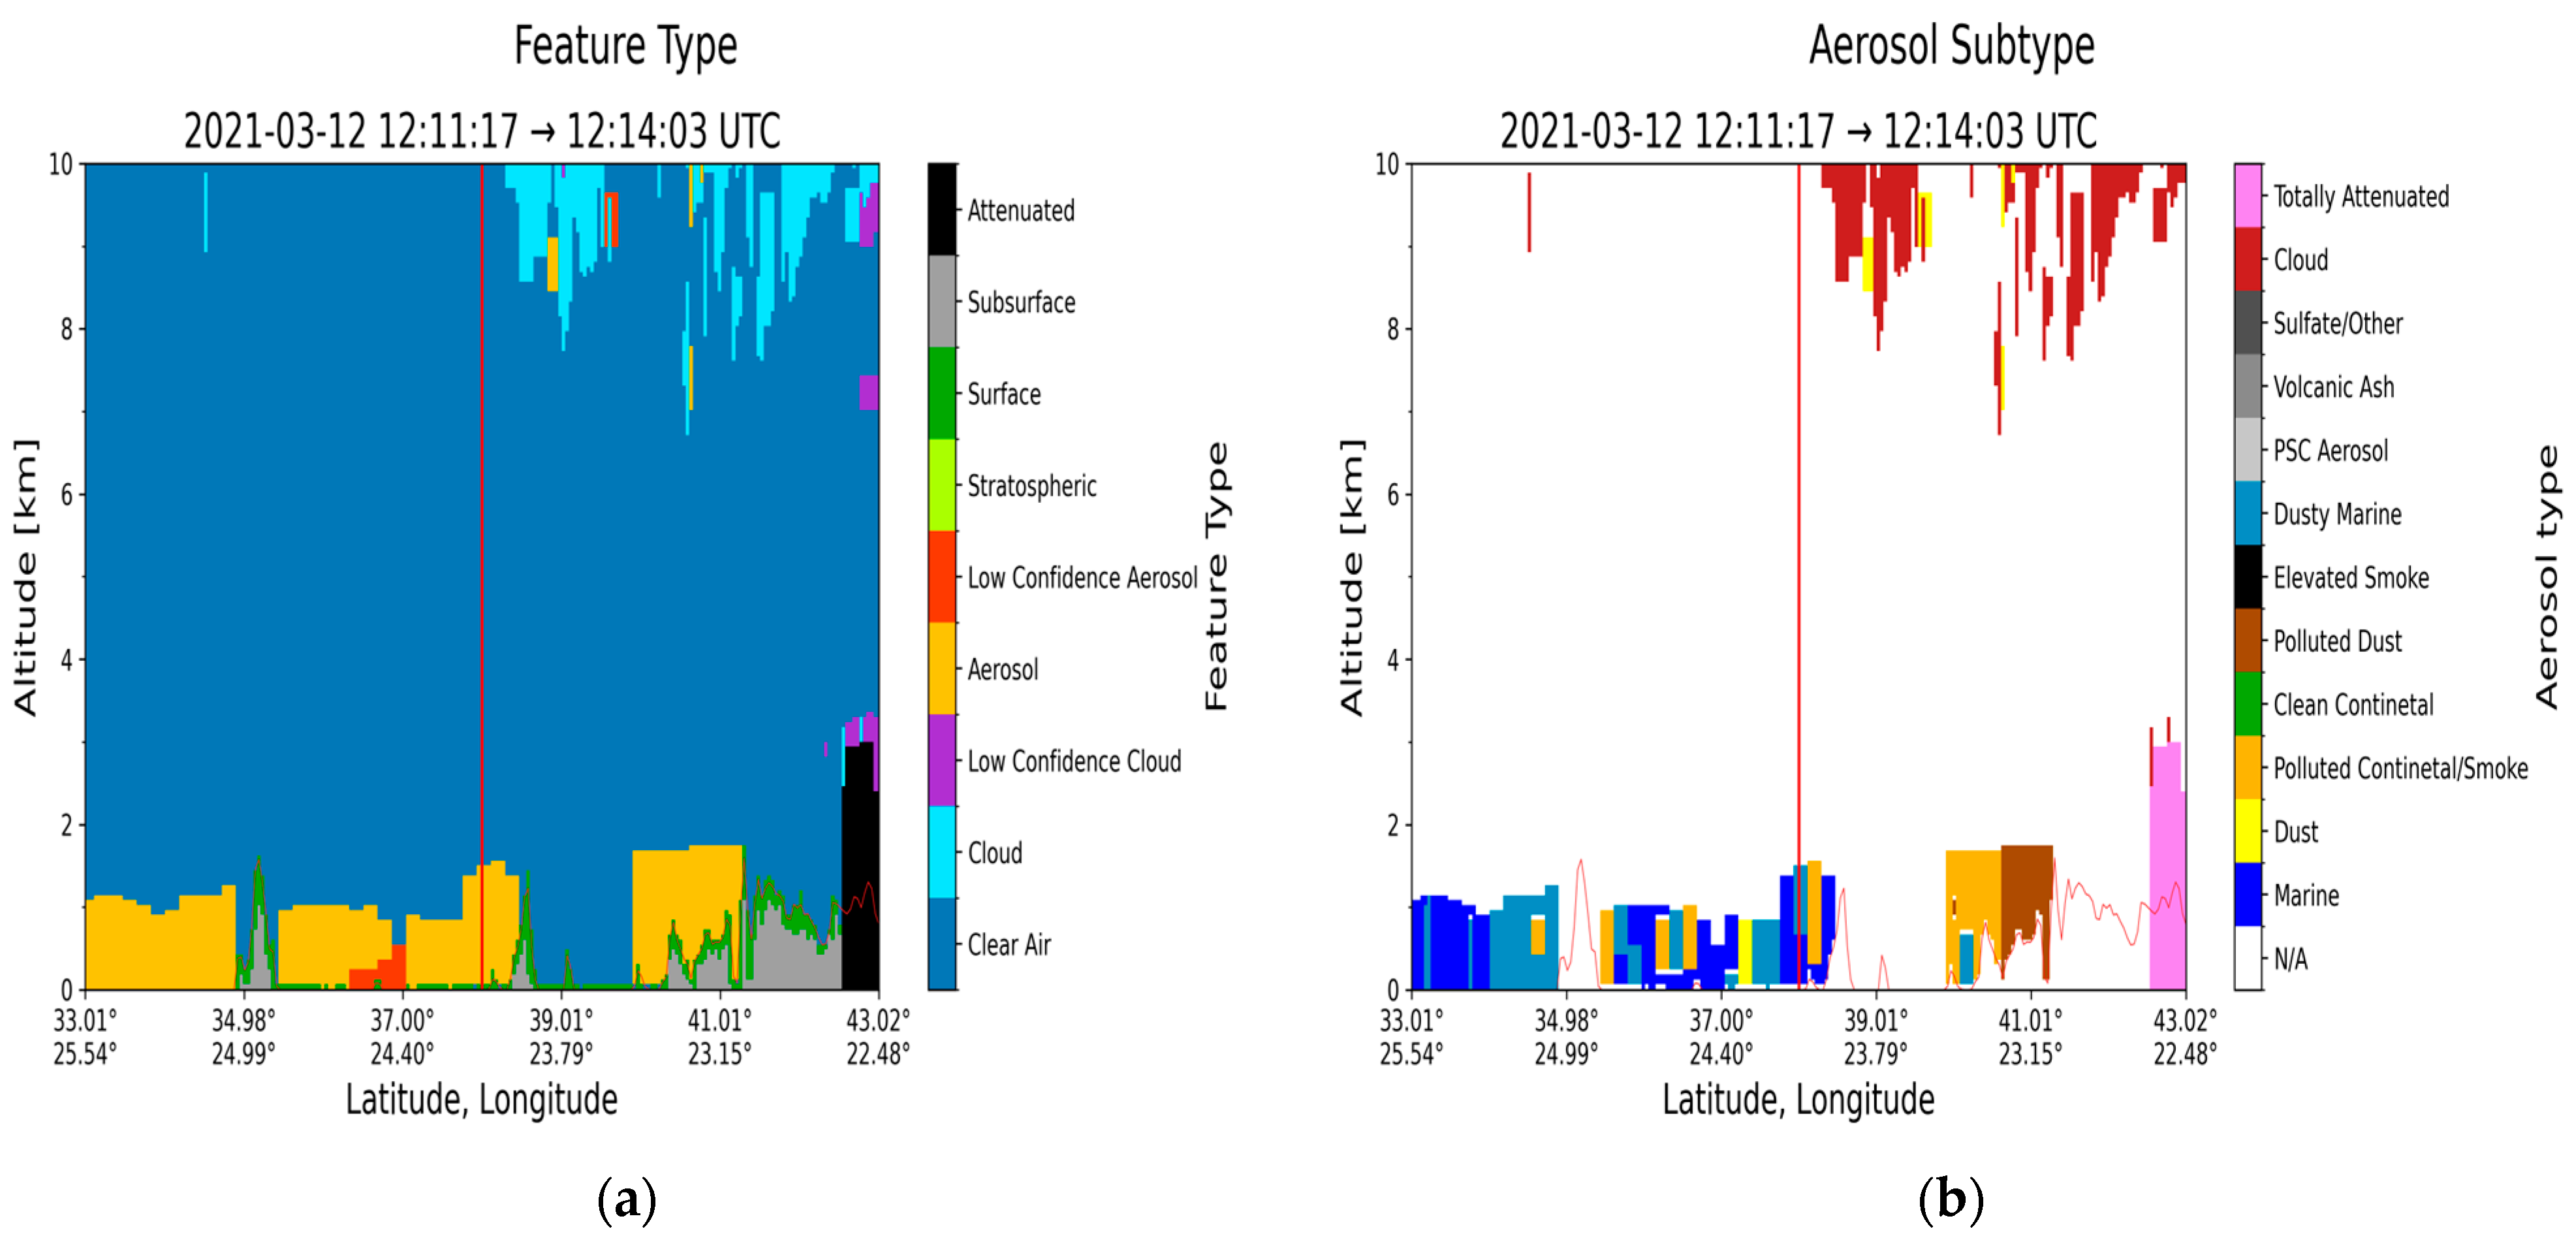
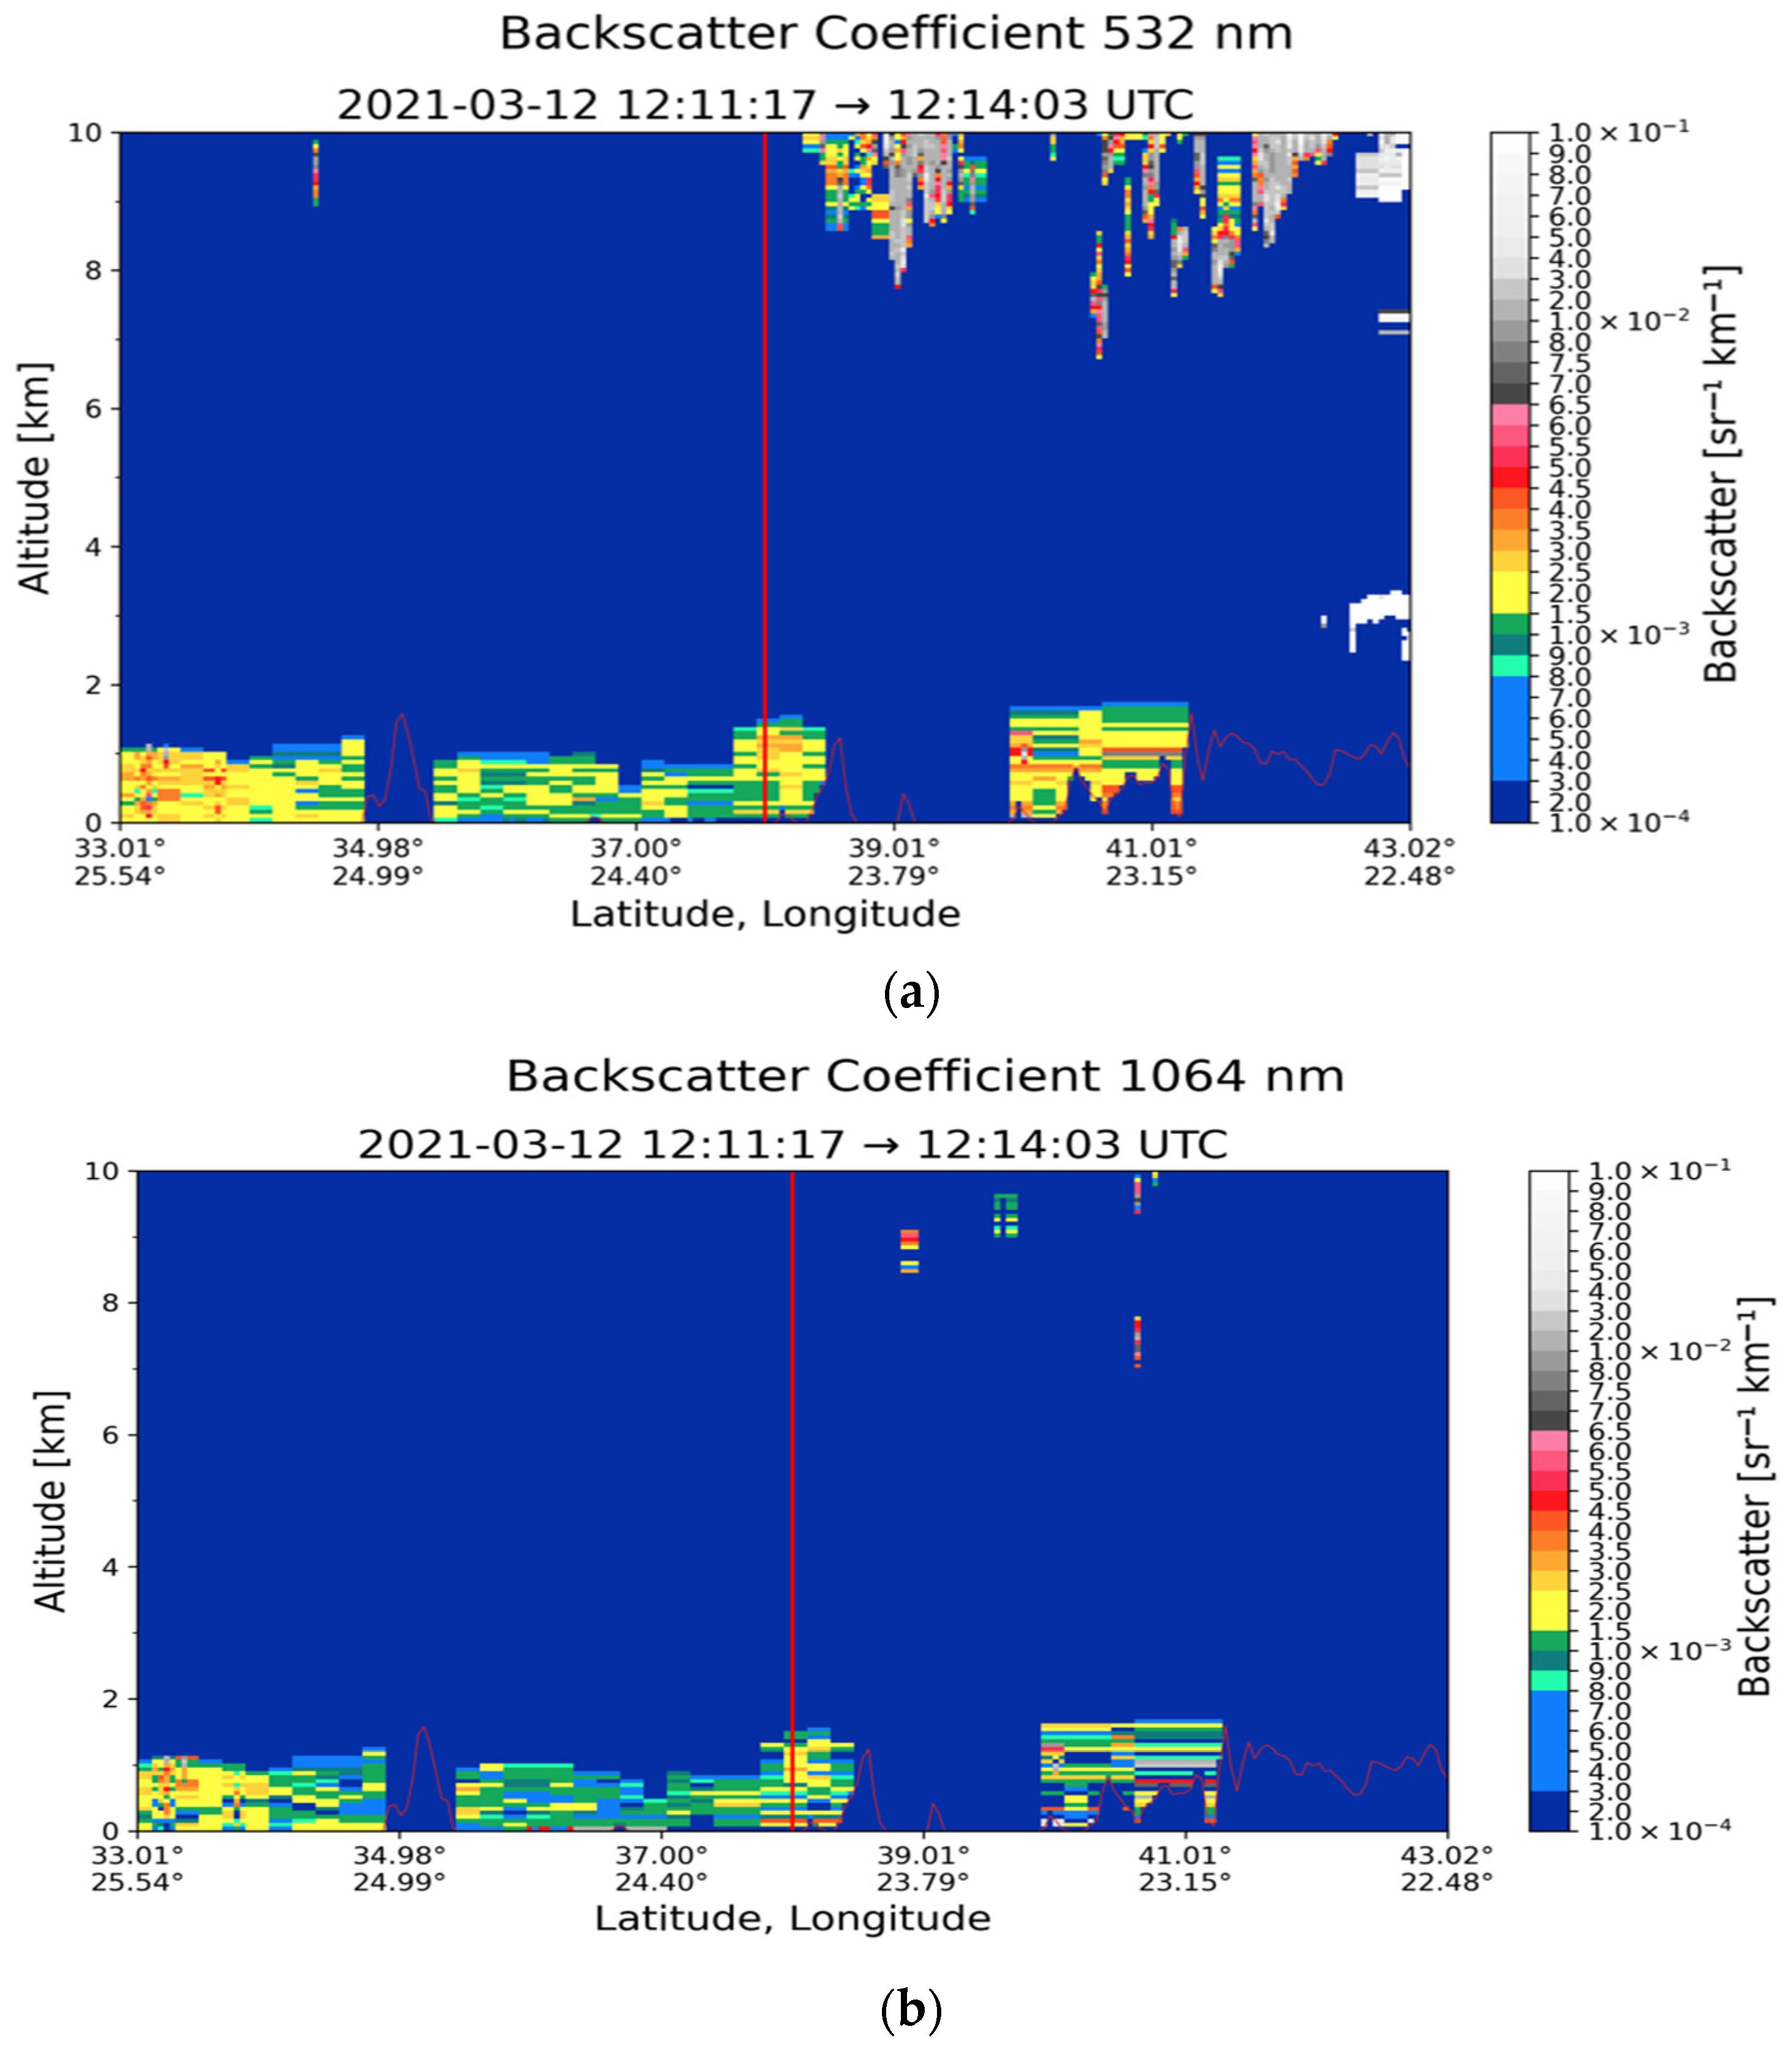
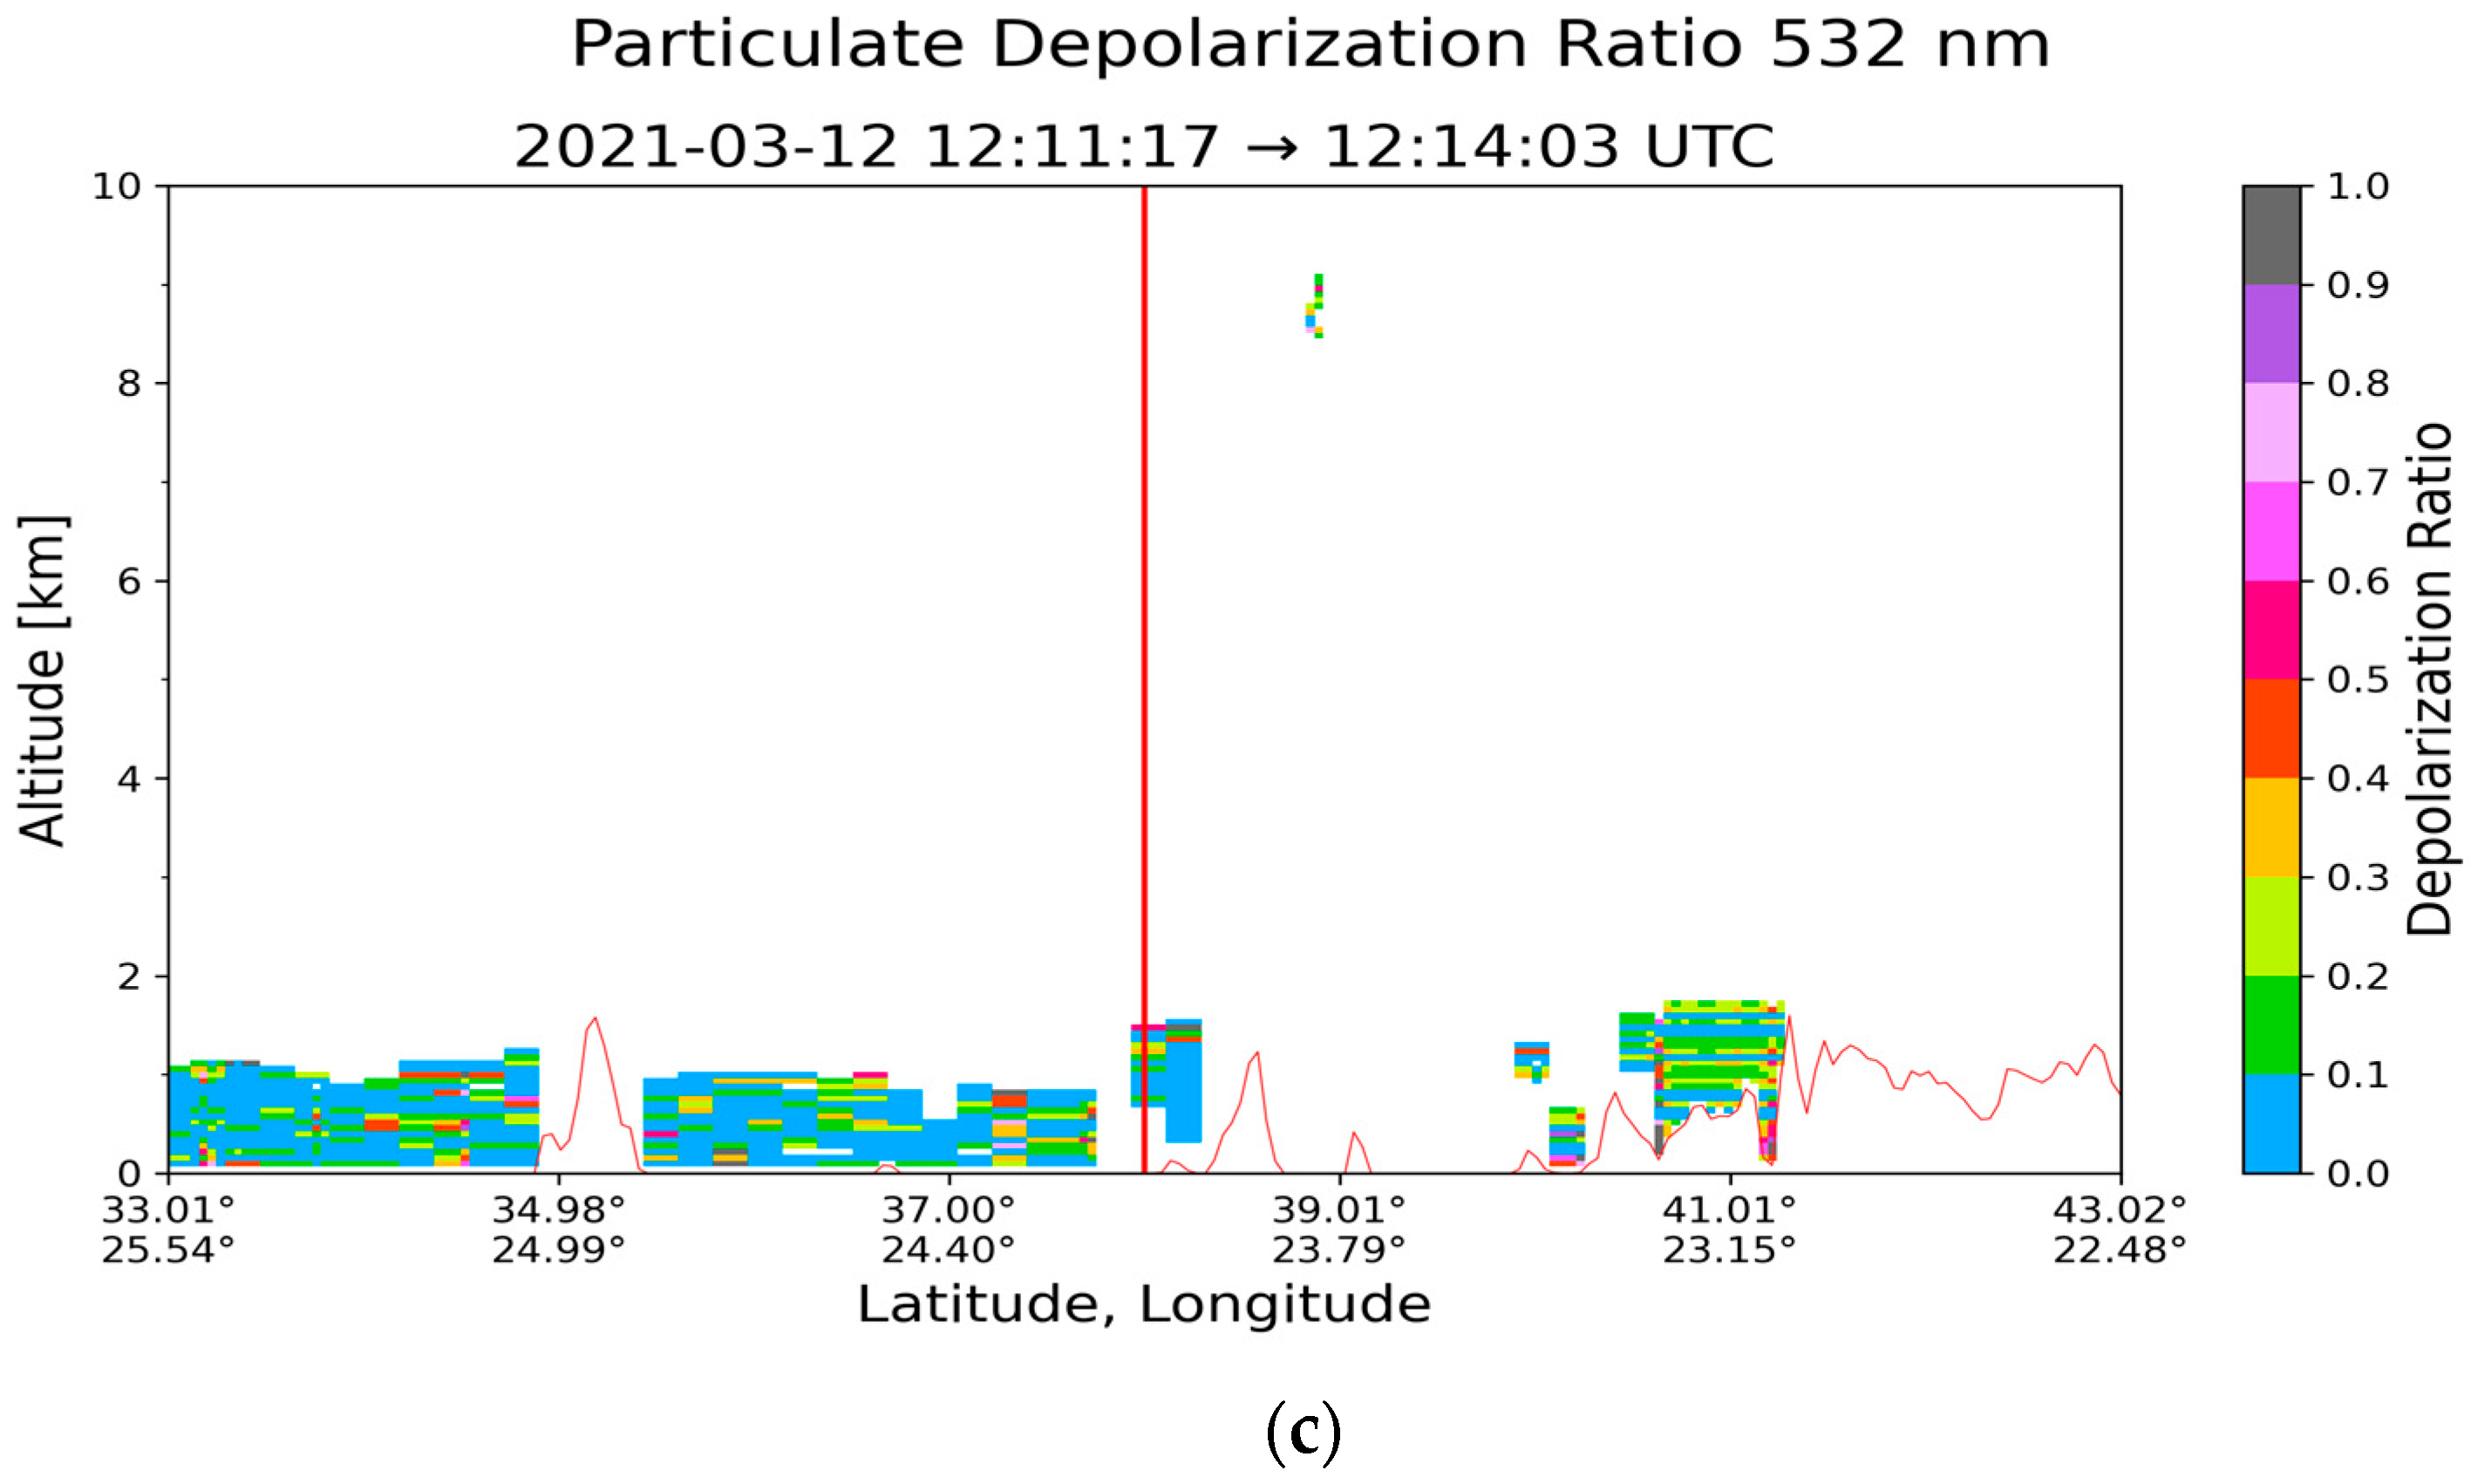
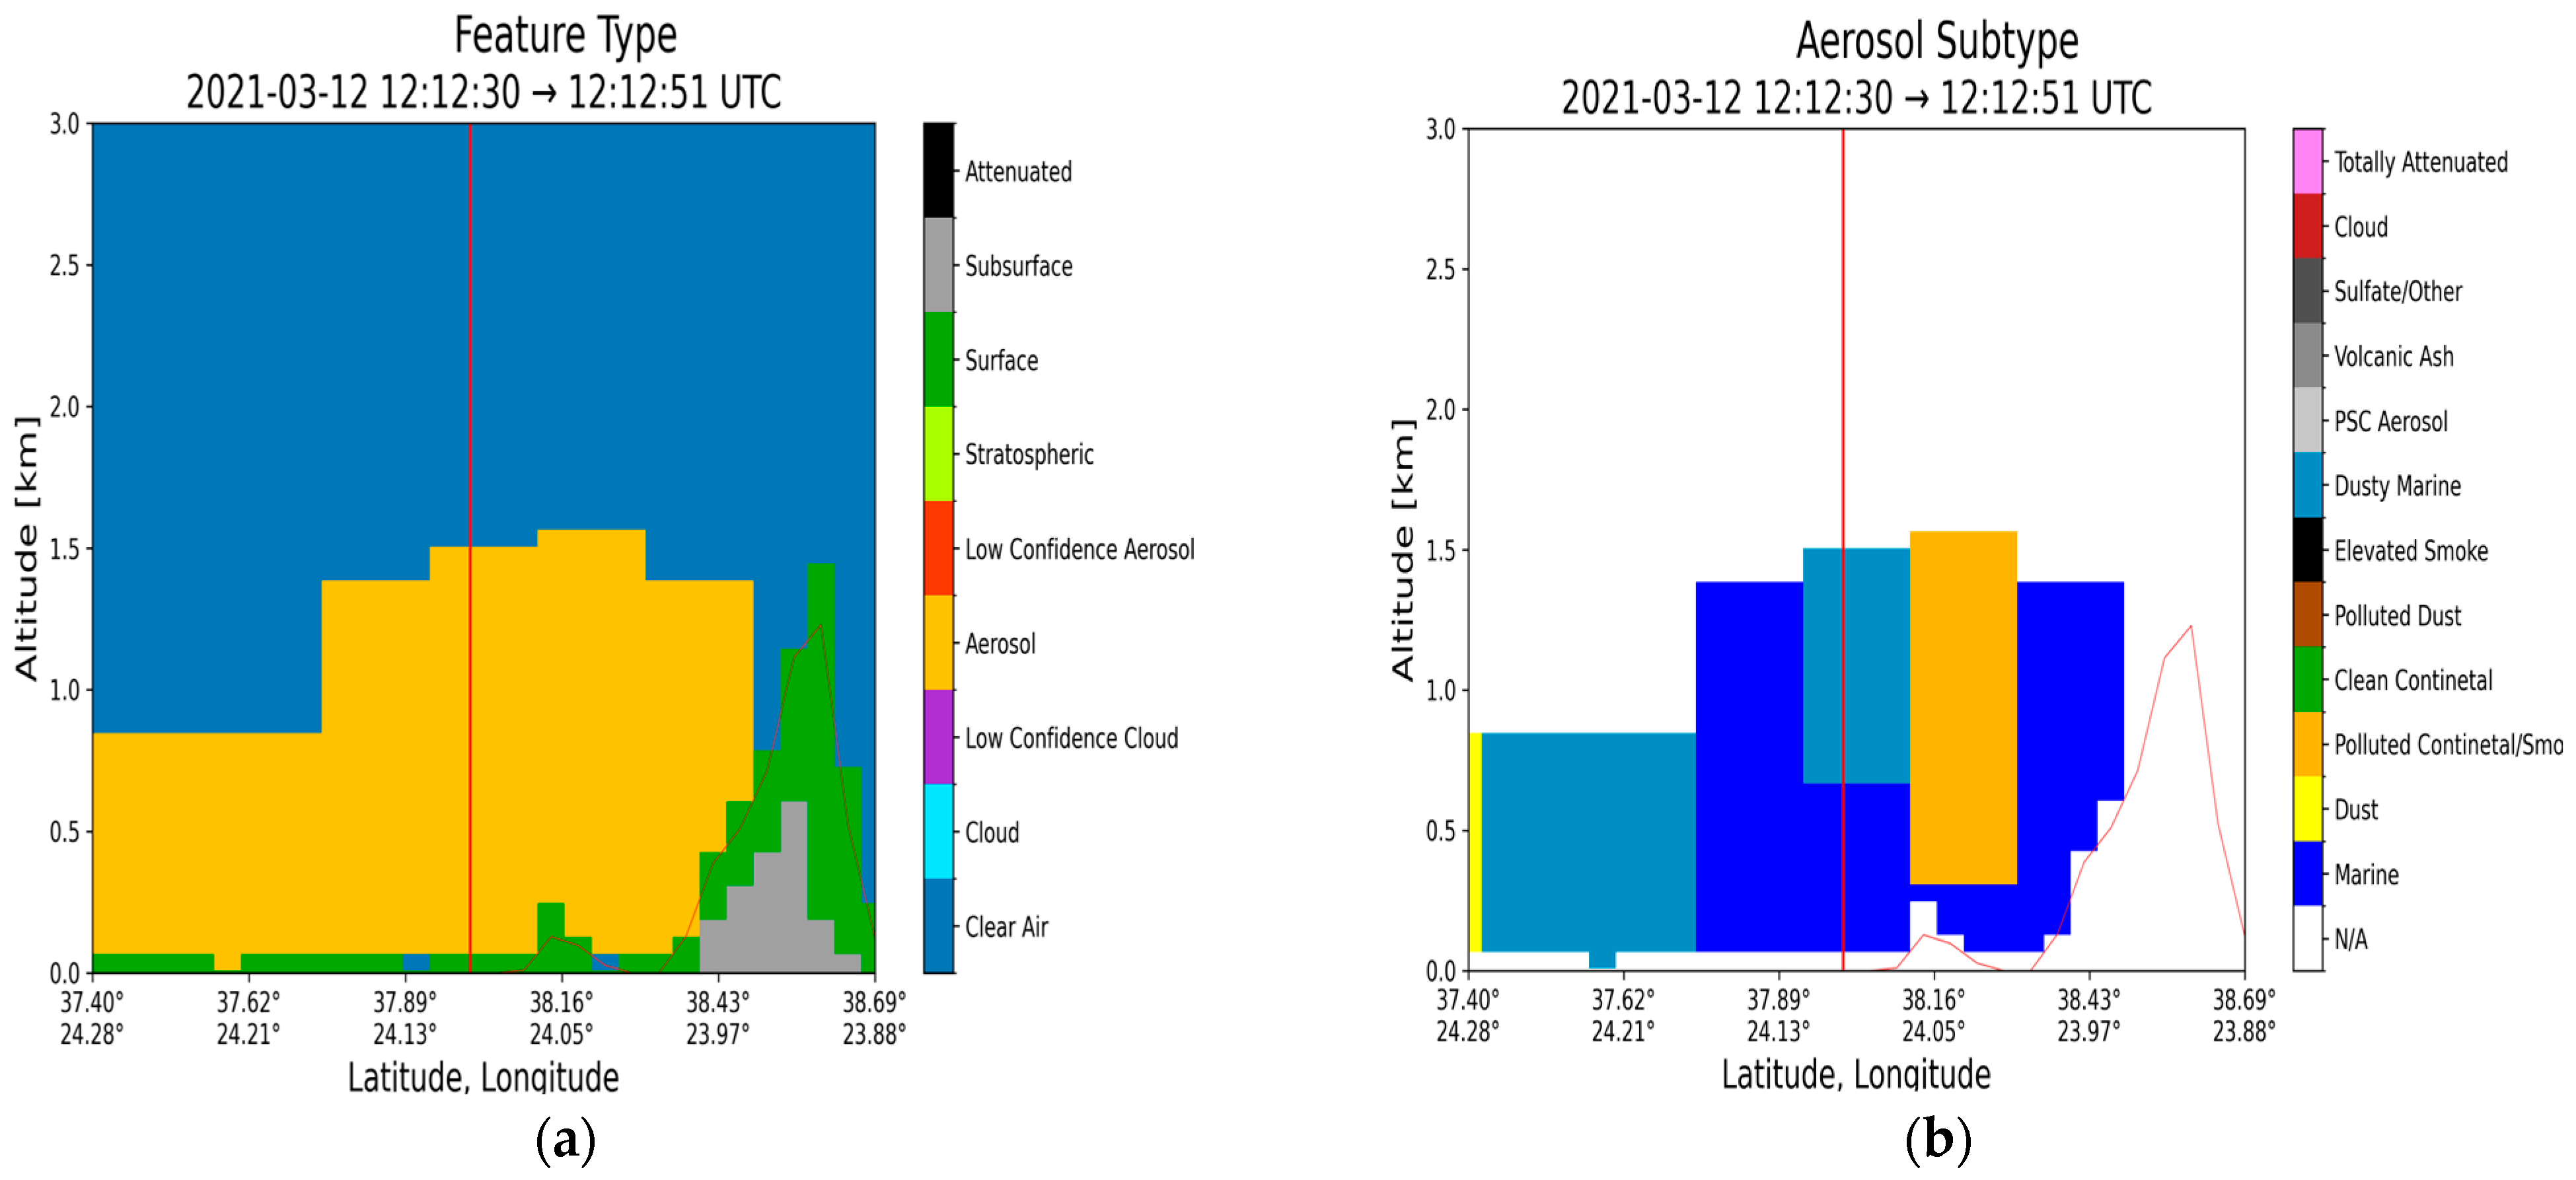
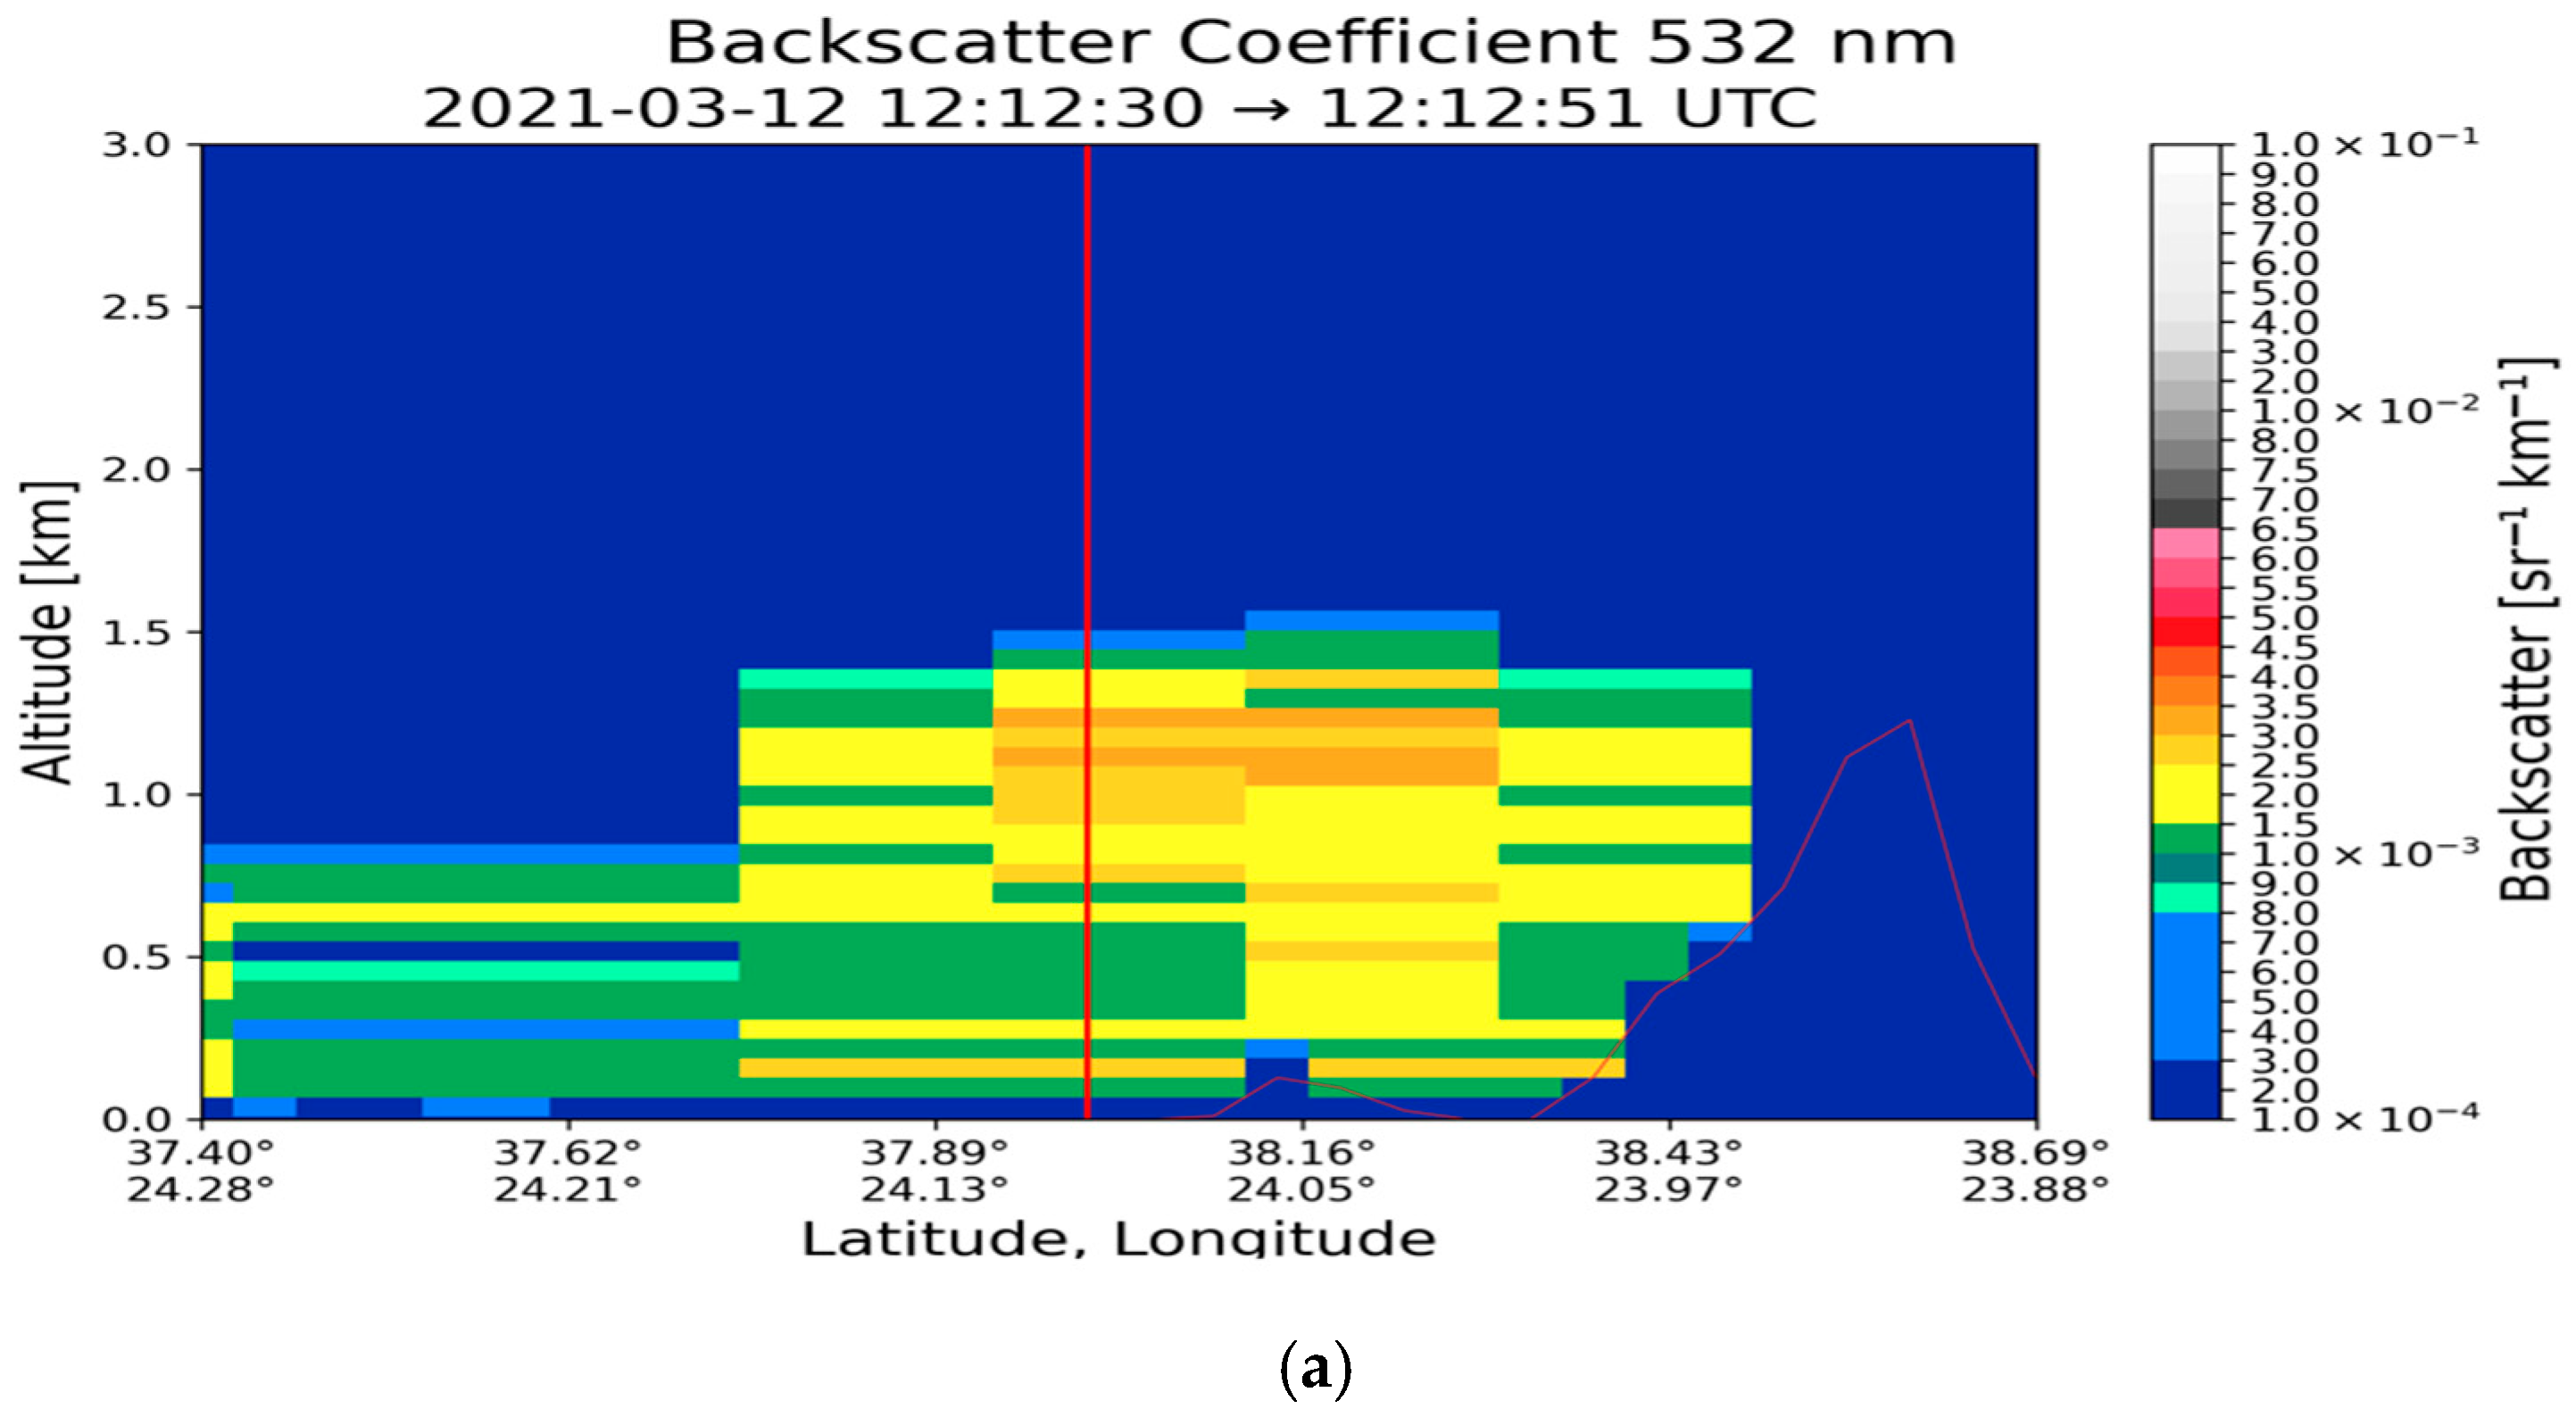
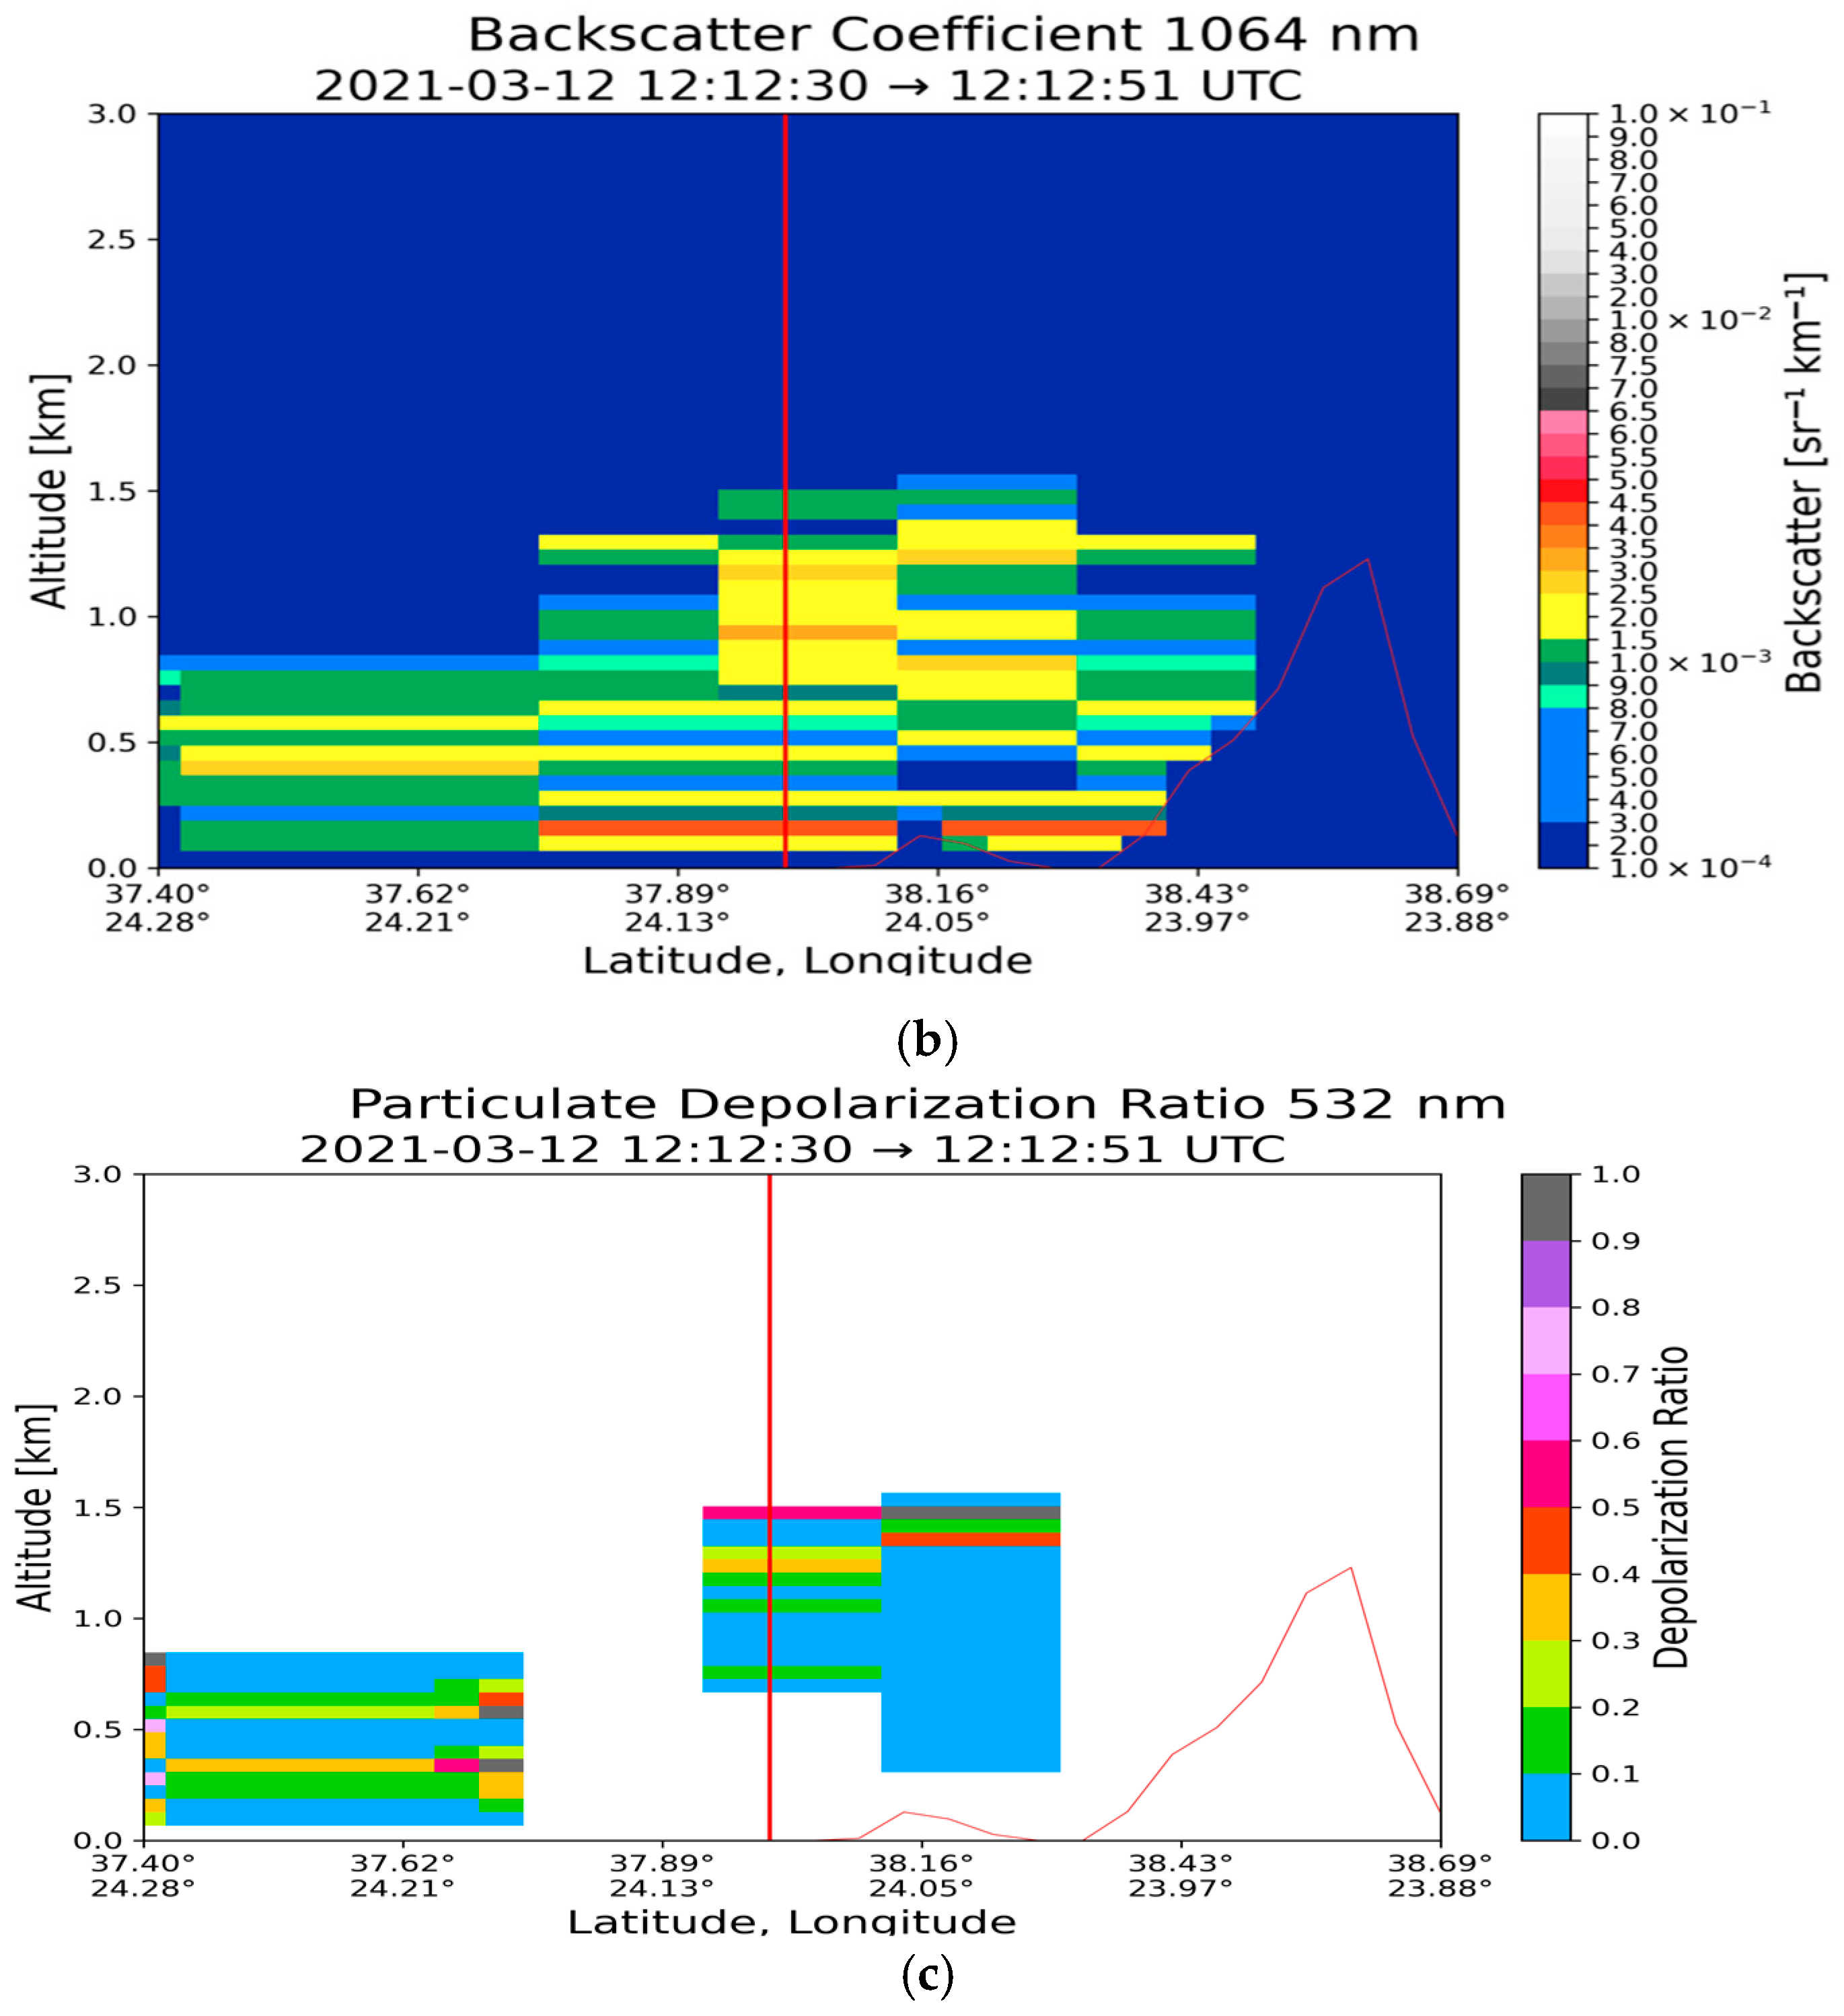
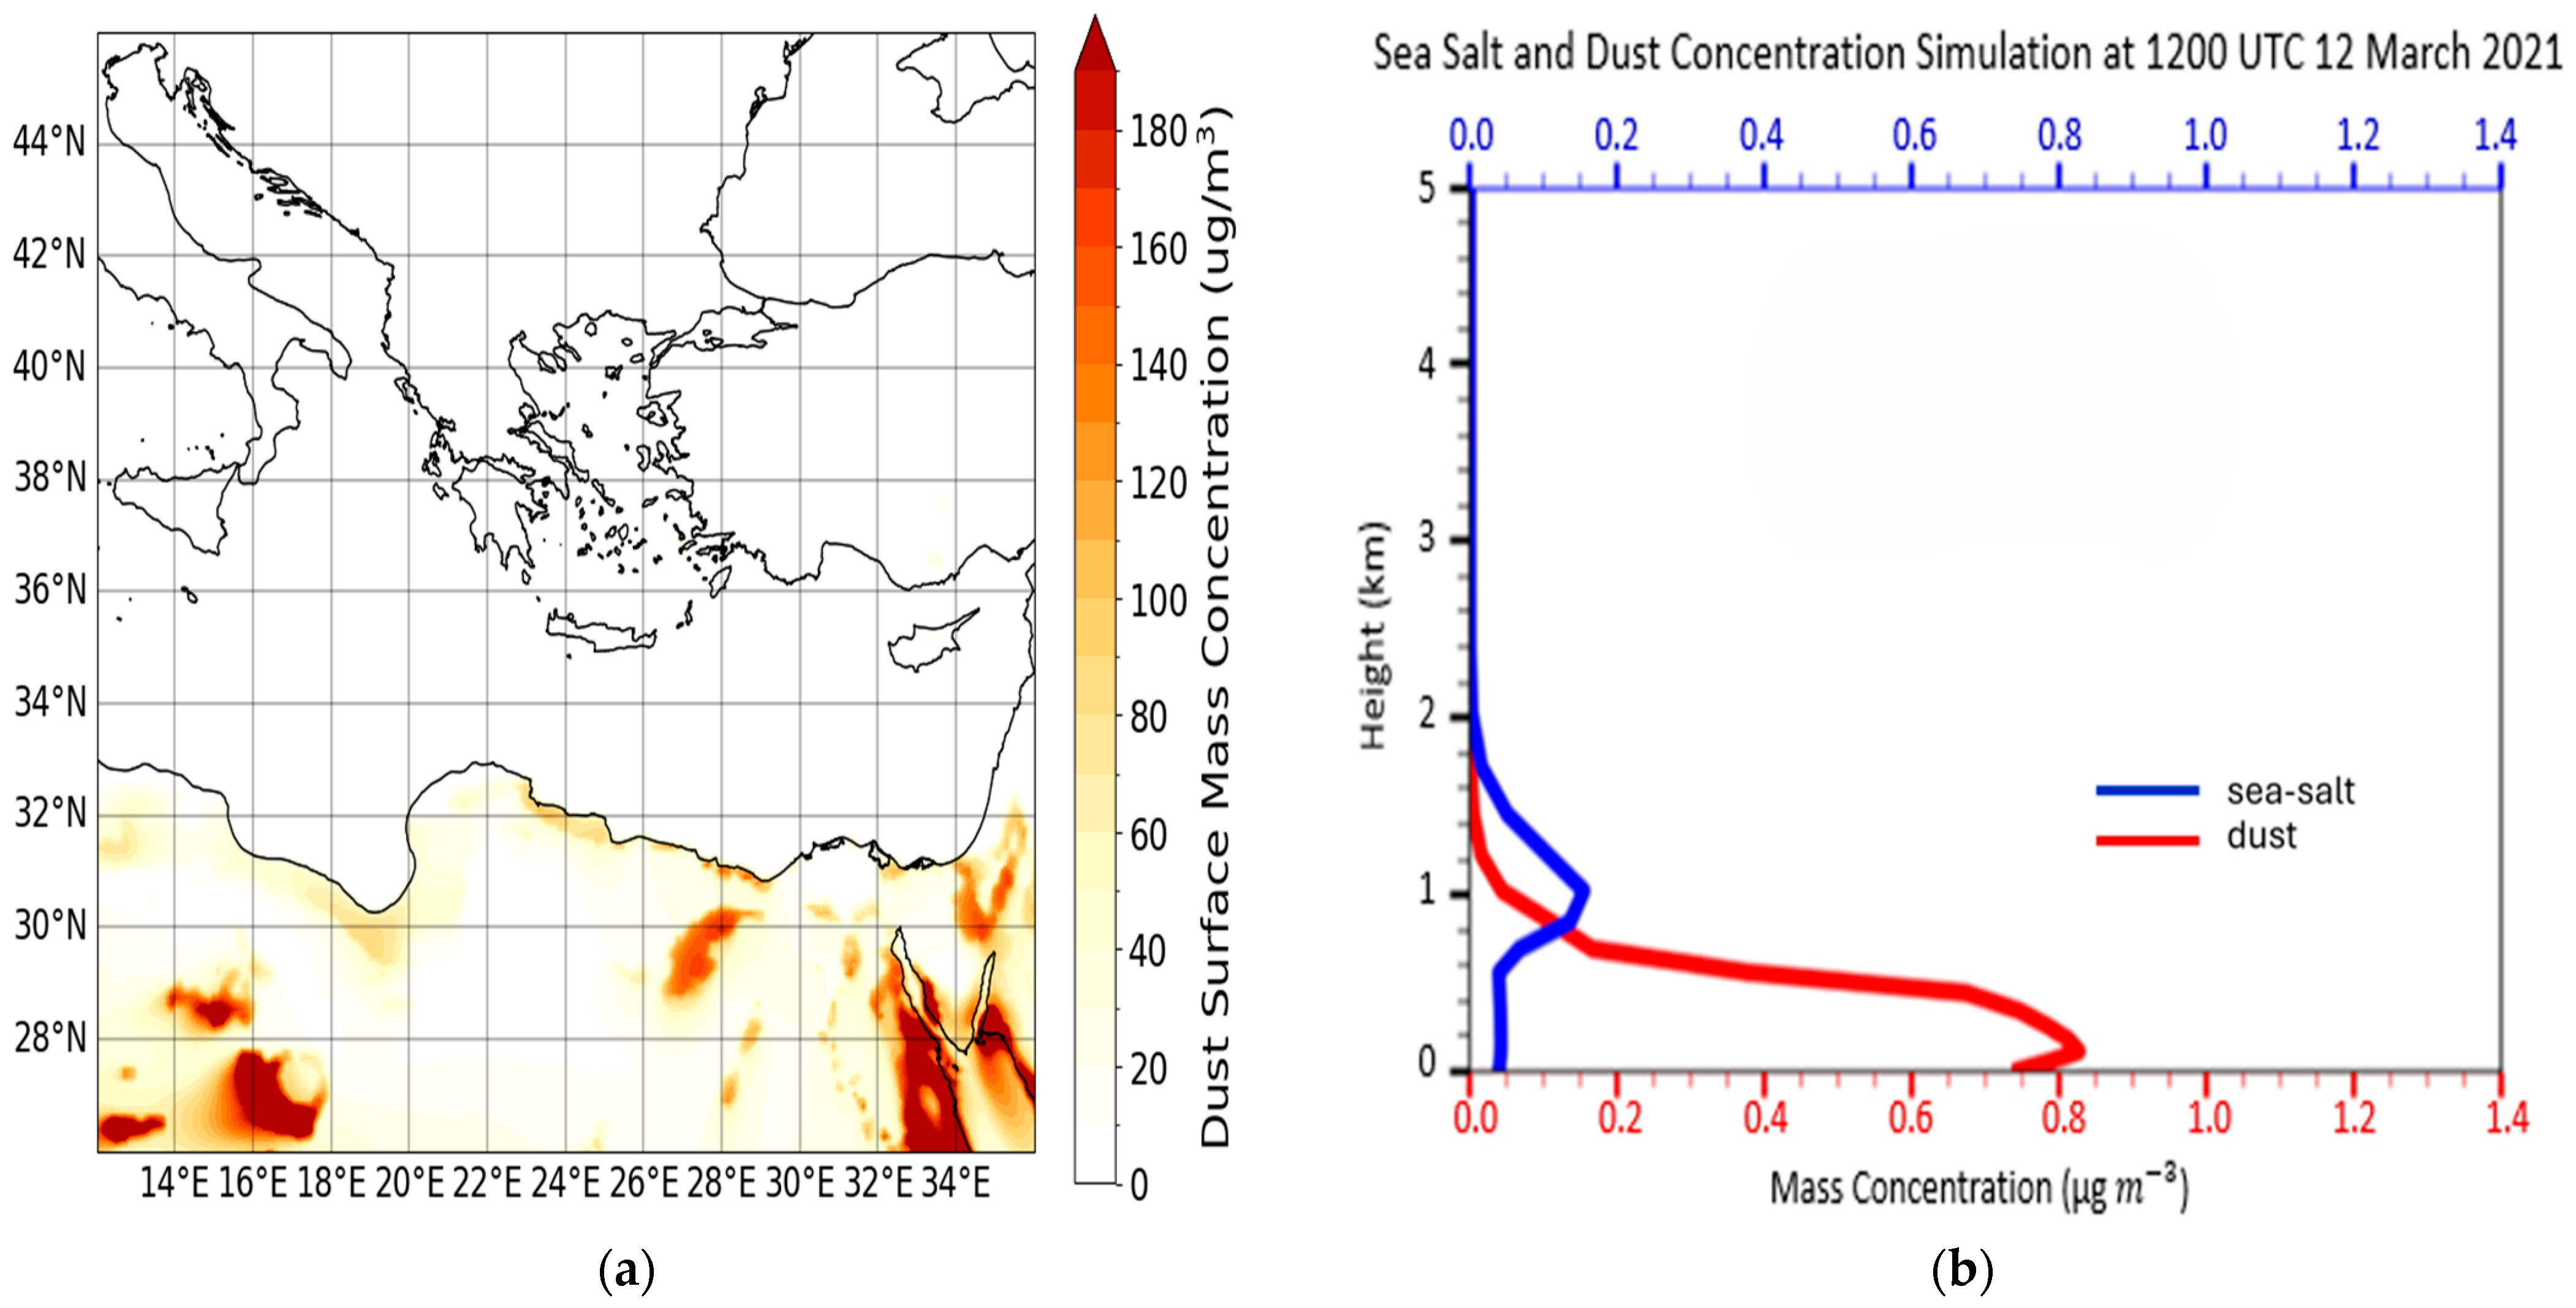
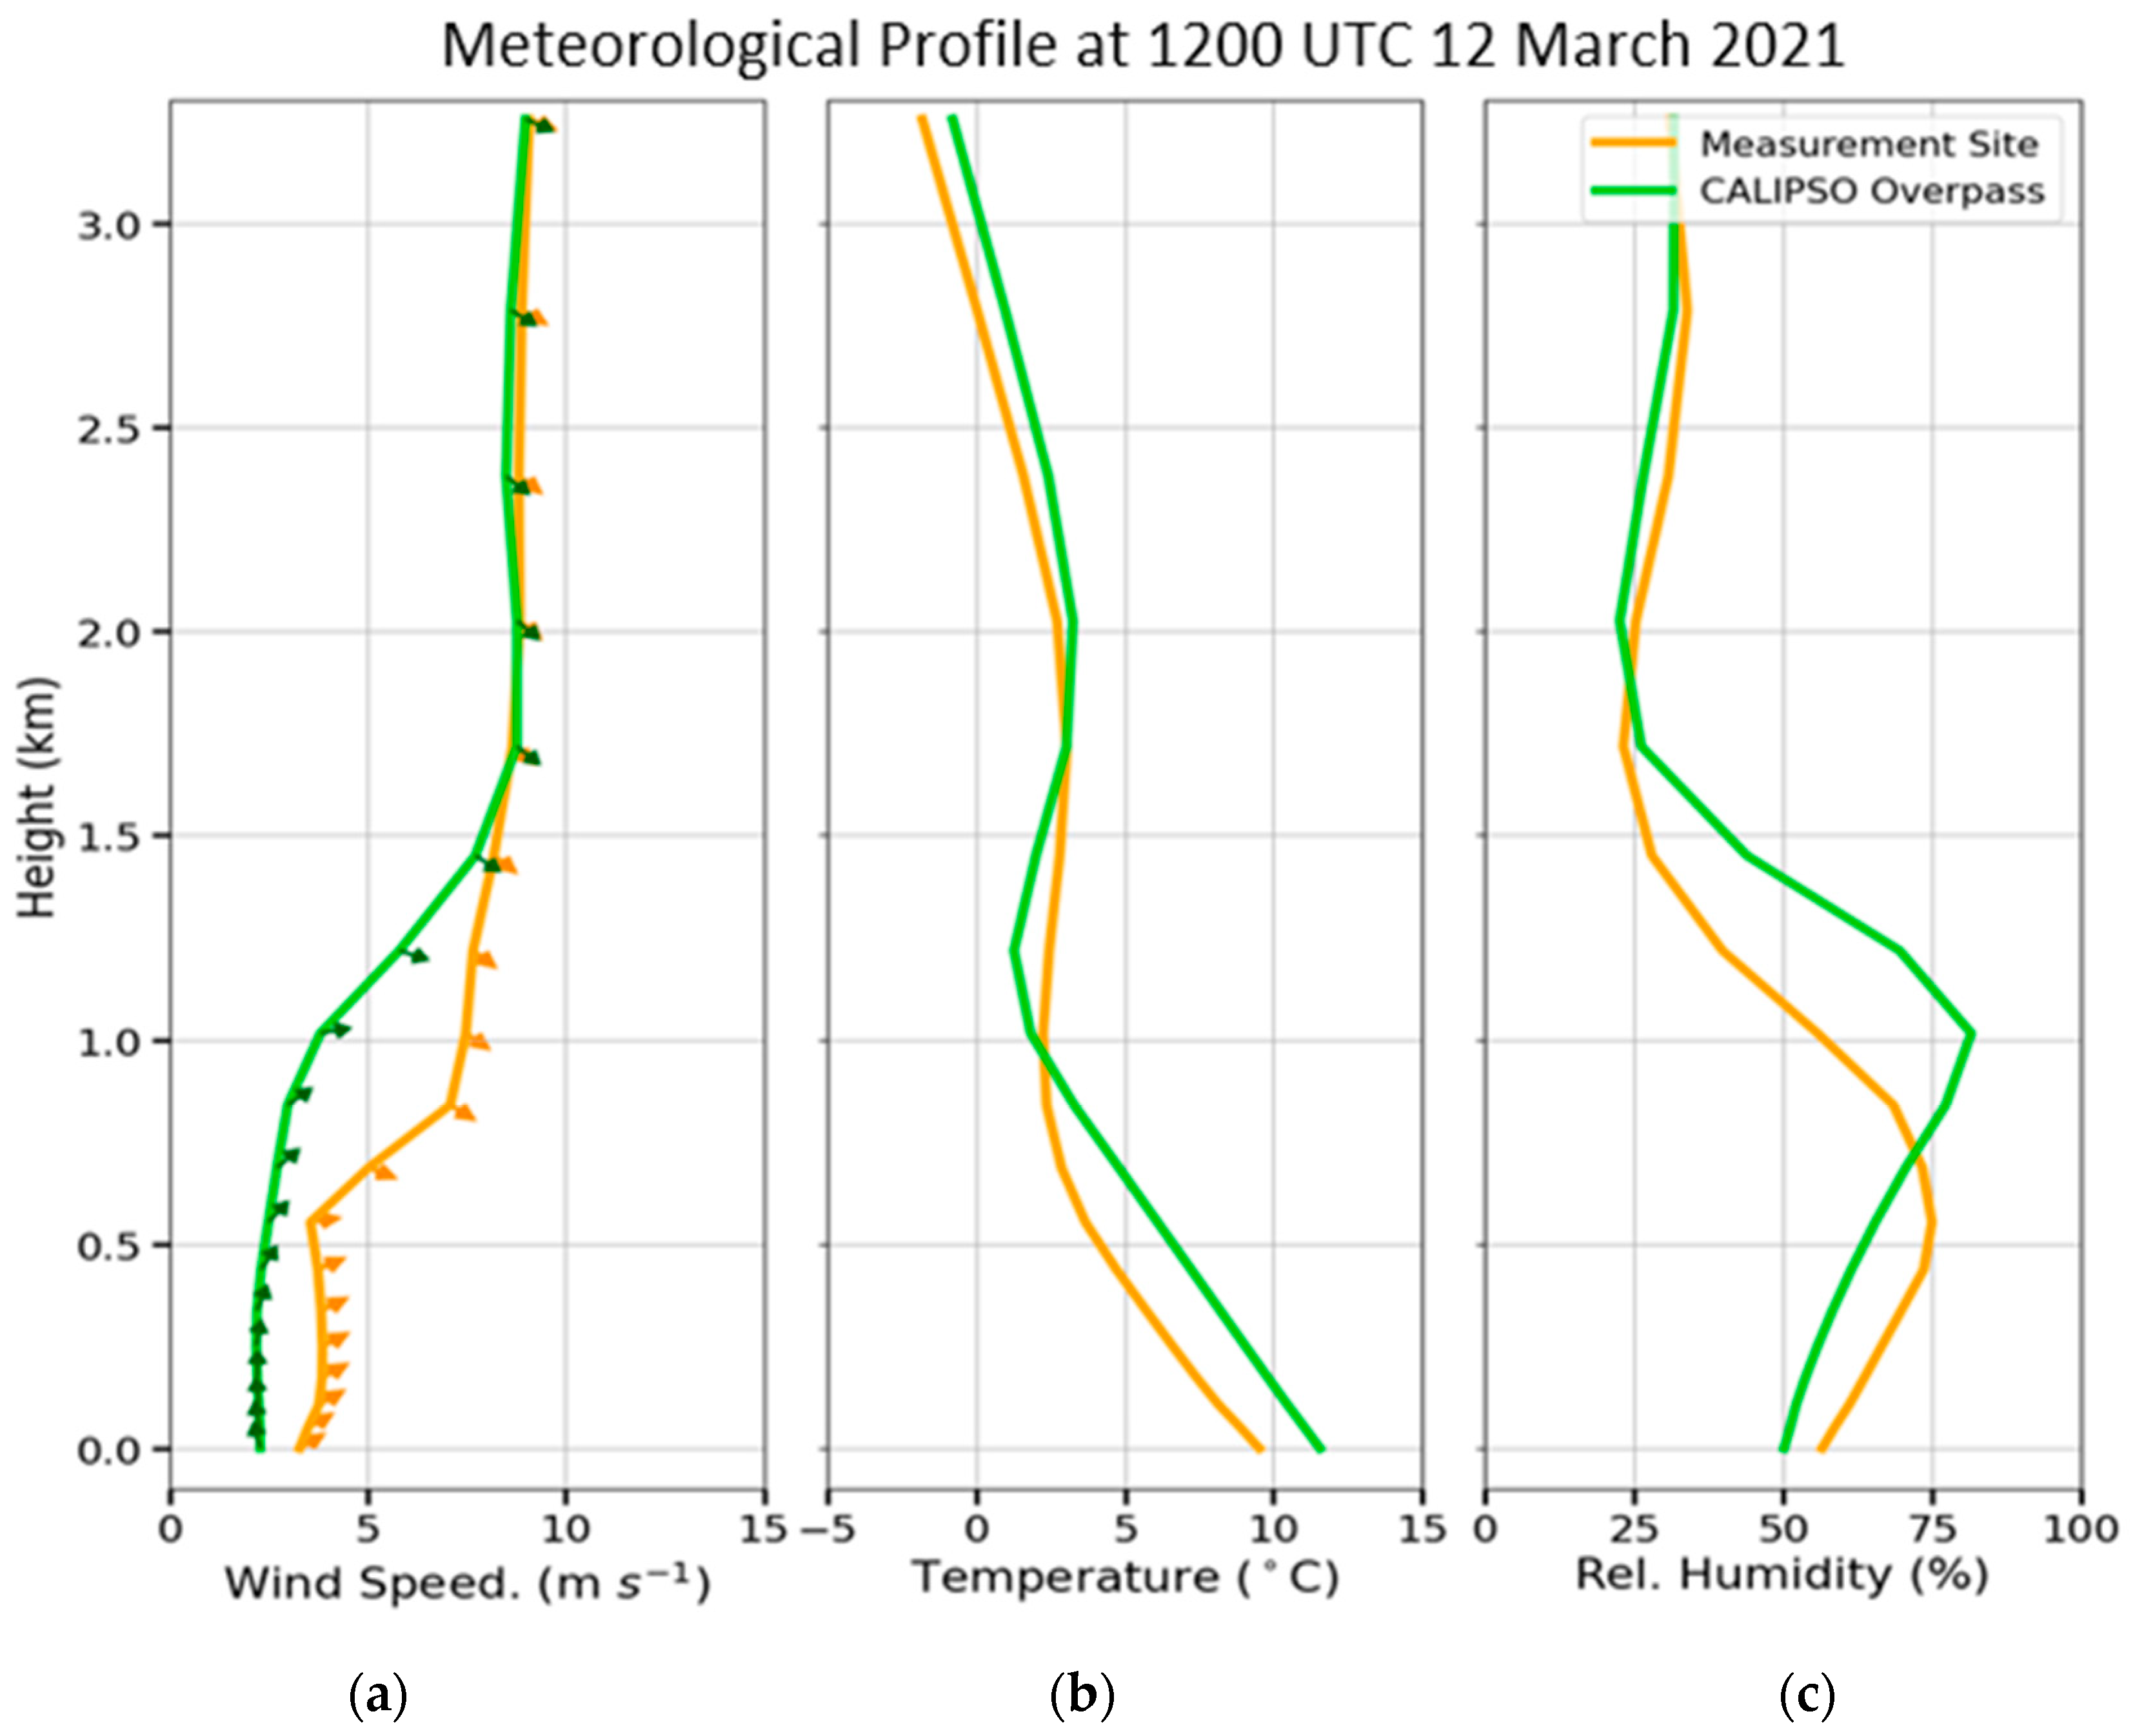
3.1. Case Study in Athens: 12 March 2021

High levels of pollen were observed over Athens corresponding to only three types, namely Pinaceae, Cupressus, and Populus. The total pollen concentration increased within the period 6–12 UTC. The highest value was reported at 409 grains m−3 between 10 and 12 UTC (Figure 3). The dominant pollen types were Pinaceae and Cupressaceae at a rate of 69% and 24%, respectively, while Populus pollen concentration values were lower than 50 grains m−3, contributing less than 7% to the total pollen concentration.
The minimum distance between CALIPSO and the pollen sampler was 27.8 km at 12:12:40 UTC and is presented in Figure 4 and Figure 5 with the red vertical line. The CALIPSO Aerosol Layer Product identified a layer between 0.083 km and 1.370 km. Feature optical depth was found as 0.047 ± 0.012 at 532 nm and 0.034 ± 0.014 at 1064 nm, while the IGBP surface type was attributed to the type of cropland. CALIPSO characterized the aerosol layer as marine and dusty marine based on the CALIPSO Feature Mask product (Figure 4). The mean particle backscatter coefficient within the layer was found equal to 0.191 × 10⁻² ± 0.052 × 10⁻² and 0.125 × 10⁻² ± 0.048 × 10⁻² km−1·sr−1 at 532 nm and 1064 nm, respectively (Figure 5). The color ratio is indicative of particle size, while the depolarization ratio indicates the particle shape. The value ranges of color ratio and depolarization ratio were from 0.154 up to 0.935 and 1.56% up to 20.35%, respectively. The mean values of the optical properties, along with their standard deviations, as provided by the CALIPSO Aerosol Layer and Profile Product for the pollen aerosol layer, are presented in Table 2. The mean values of color ratio and depolarization ratio were equal to 0.652 ± 0.194 and 8.70 ± 6.26%, respectively, which indicate the presence of relatively large non-spherical particles. Large standard deviations resulted from the variability of the optical properties within the aerosol layer. The mean Ångström exponent value was 0.62, verifying the large particle size. The Appendix A (Figure A1 and Figure A2) includes graphs of the broader area, demonstrating that the aerosol layer originates from lower altitudes, indicating the absence of long-range transport in the free troposphere.
Four-day backward trajectories analysis indicated no transportation of Saharan dust (Figure 6), while mass concentration profiles performed with the RAMS/ICLAMS models confirmed the absence of marine aerosol and dust particles up to 5 km (Figure 7). Sea-salt concentrations reached 0.2 µg·m−3 at the first 1 km, decreasing with height. Τhe concentration of dust particles slightly exceeded the value of 0.8 µg·m−3 and continued to decrease at higher altitudes, while at 1.2 km it was near zero. CALIPSO characterization of the aerosol layer as marine and dusty marine resulted in small lidar ratio values. Moreover, in Figure 8, the prevailing meteorological conditions are examined. Wind speed vertical distributions did not exhibit significant variations with height, remaining rather moderate both at the surface and up to a few kilometers from the ground, with values between 3 m·s−1 and 7 m·s−1. On the other hand, the temperature vertical profiles decreased from the surface to the first kilometer, indicating a negative gradient. These conditions favored the upward vertical movement of warmer air masses to higher altitudes. Regarding the vertical profile of humidity, an increase is evident from the surface up to the first kilometer, which can also have contributed to the hygroscopic growth of particles across all size ranges. It is therefore concluded that the relatively large particles perceived by CALIPSO were probably attributed to the strong contribution of the Pinaceae pollen particles within the aerosol layer. The transport of pollen from the trap to the nearest CALIPSO passage is confirmed by the prevailing westerly winds and the analysis of meteorological conditions that were conducted.
According to the study of Shang et al. (2020) [63], which was conducted in Finland, the mean lidar depolarization ratio at 532 nm for pure Pinaceae pollen was determined to equal 36 ± 1%, while in the same study, the value was calculated as 14 ± 6% for the intense pine pollen period. In another laboratory-based study [79], the depolarization ratio at 532 nm of Virginia pine pollen was found equal to 41%. Although these values are higher than those we have retrieved, two key factors must be considered. Firstly, the laboratory study was conducted in a controlled environment using purchased pollen grains, while lidar studies refer to ambient conditions; secondly, the lidar studies were conducted in quite different environments and conditions. The fact that Thessaloniki and Athens in Greece are urban cities and more polluted than Kuopio in Finland impacts the larger Ånsgtröm exponent and lower depolarization ratio values for the same pollen type. Lastly, it is important to state that it is not feasible to differentiate between pollen and urban particles with the existing equipment.

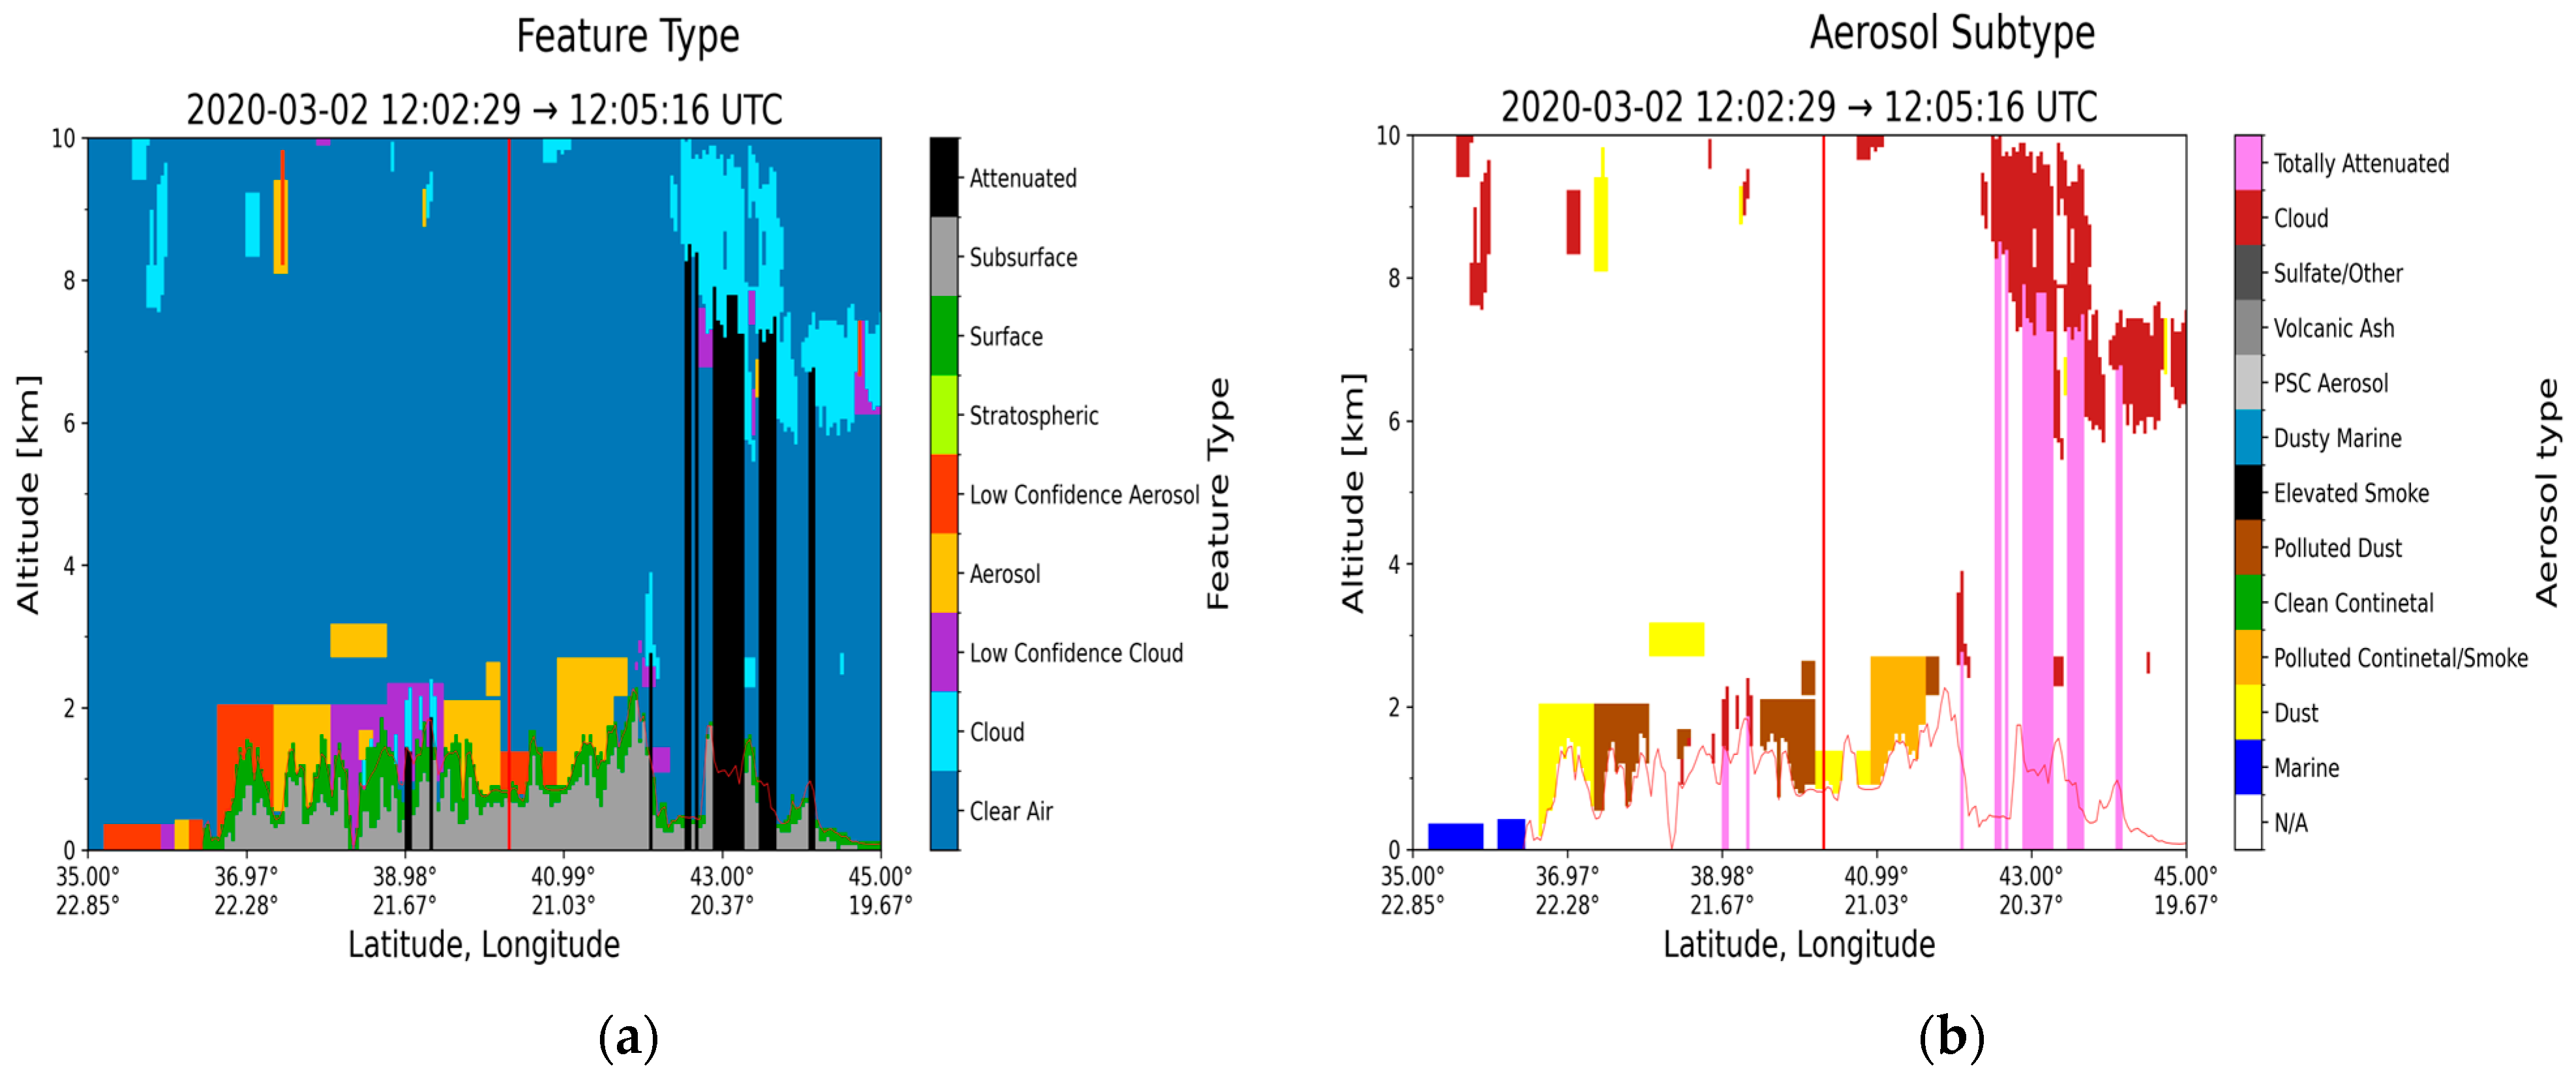
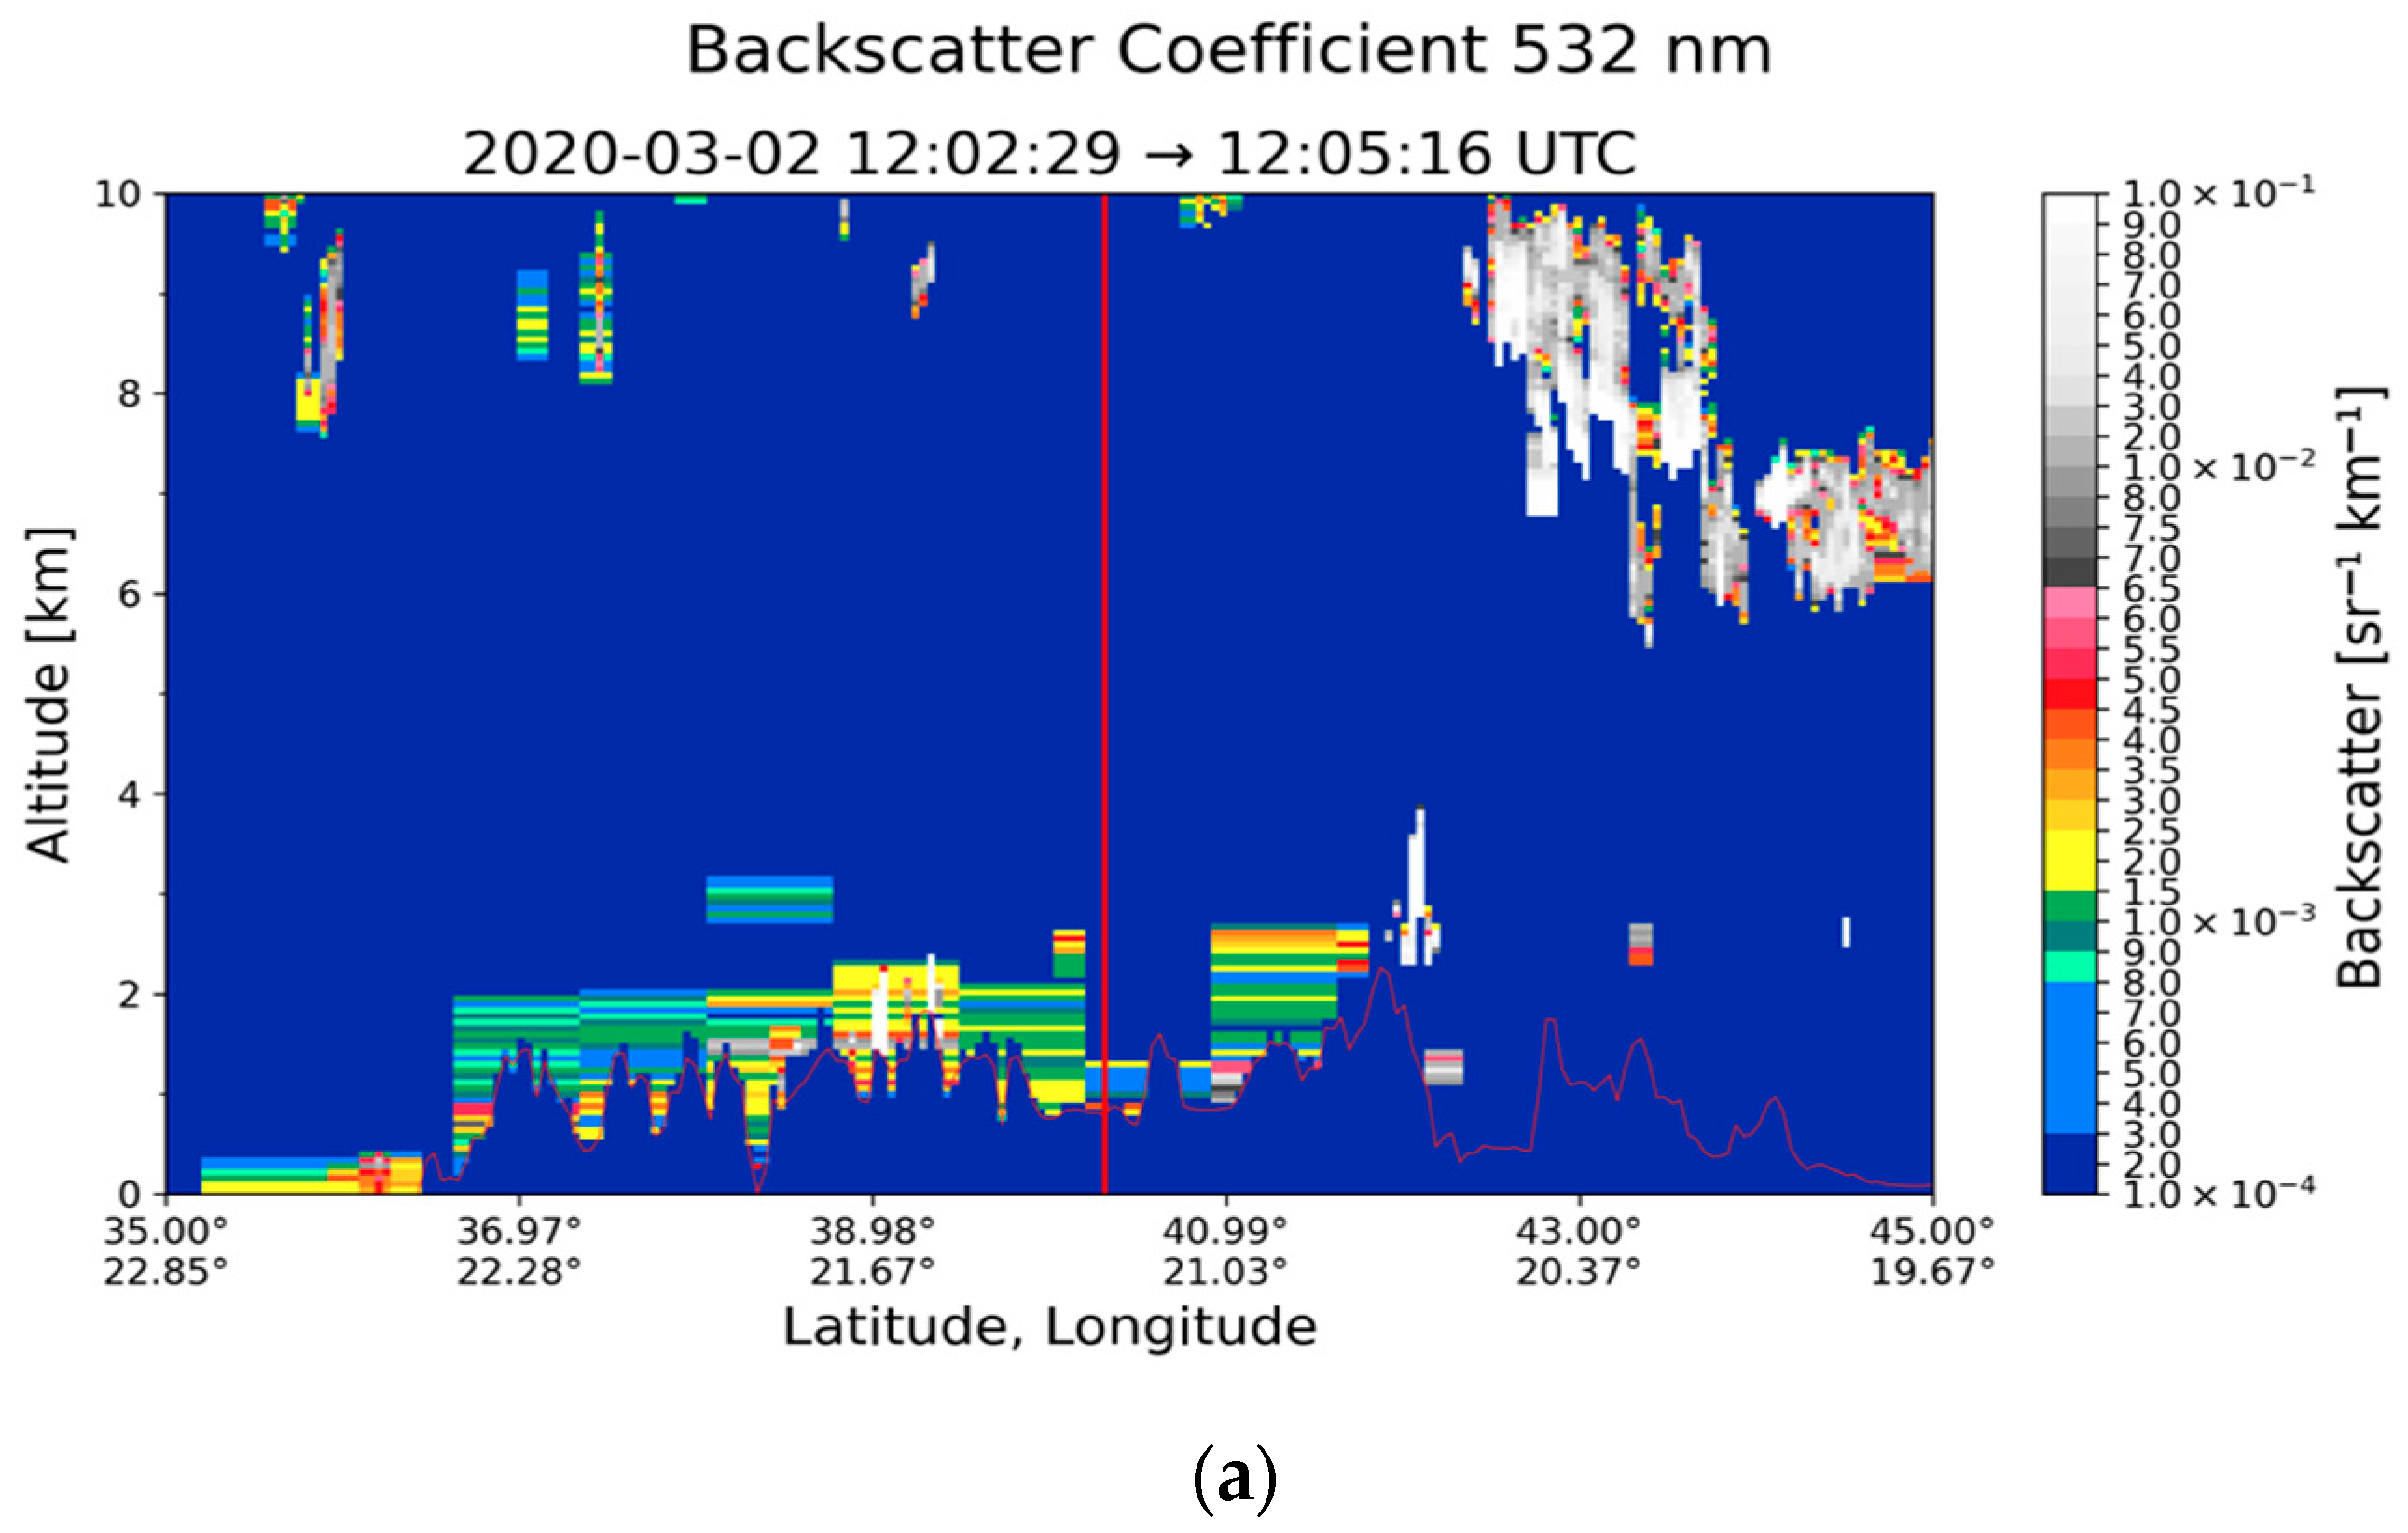
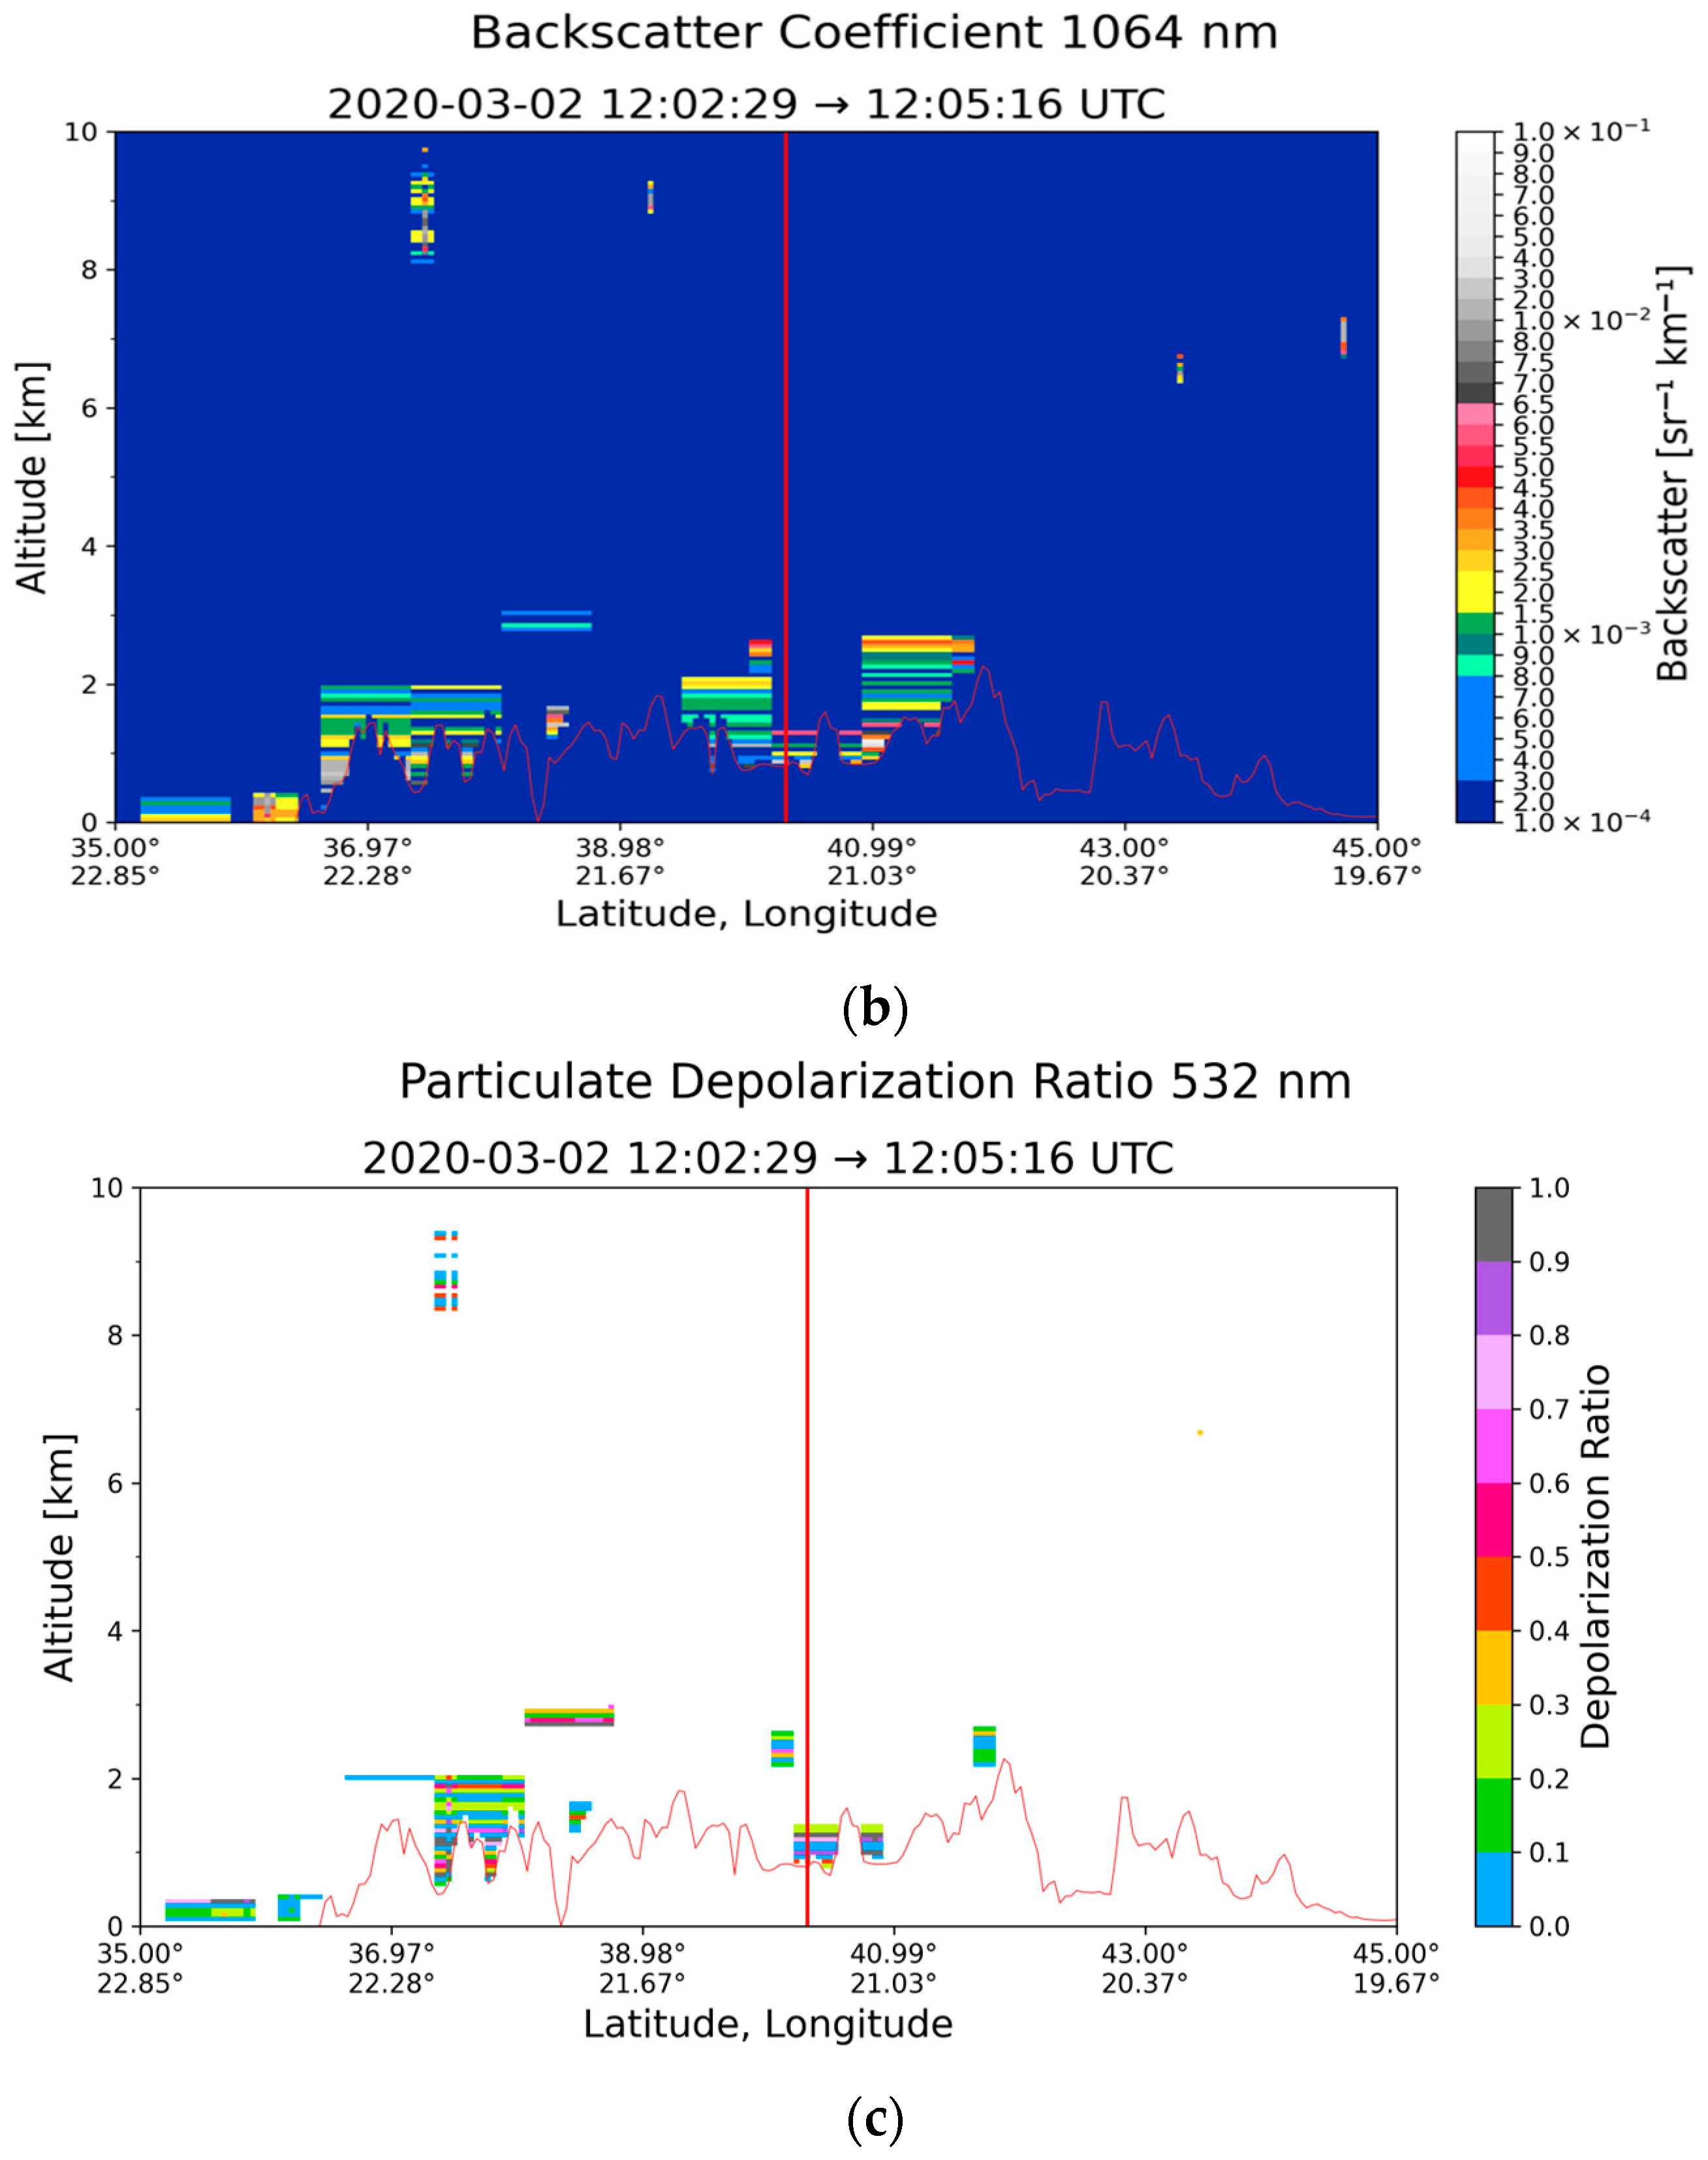
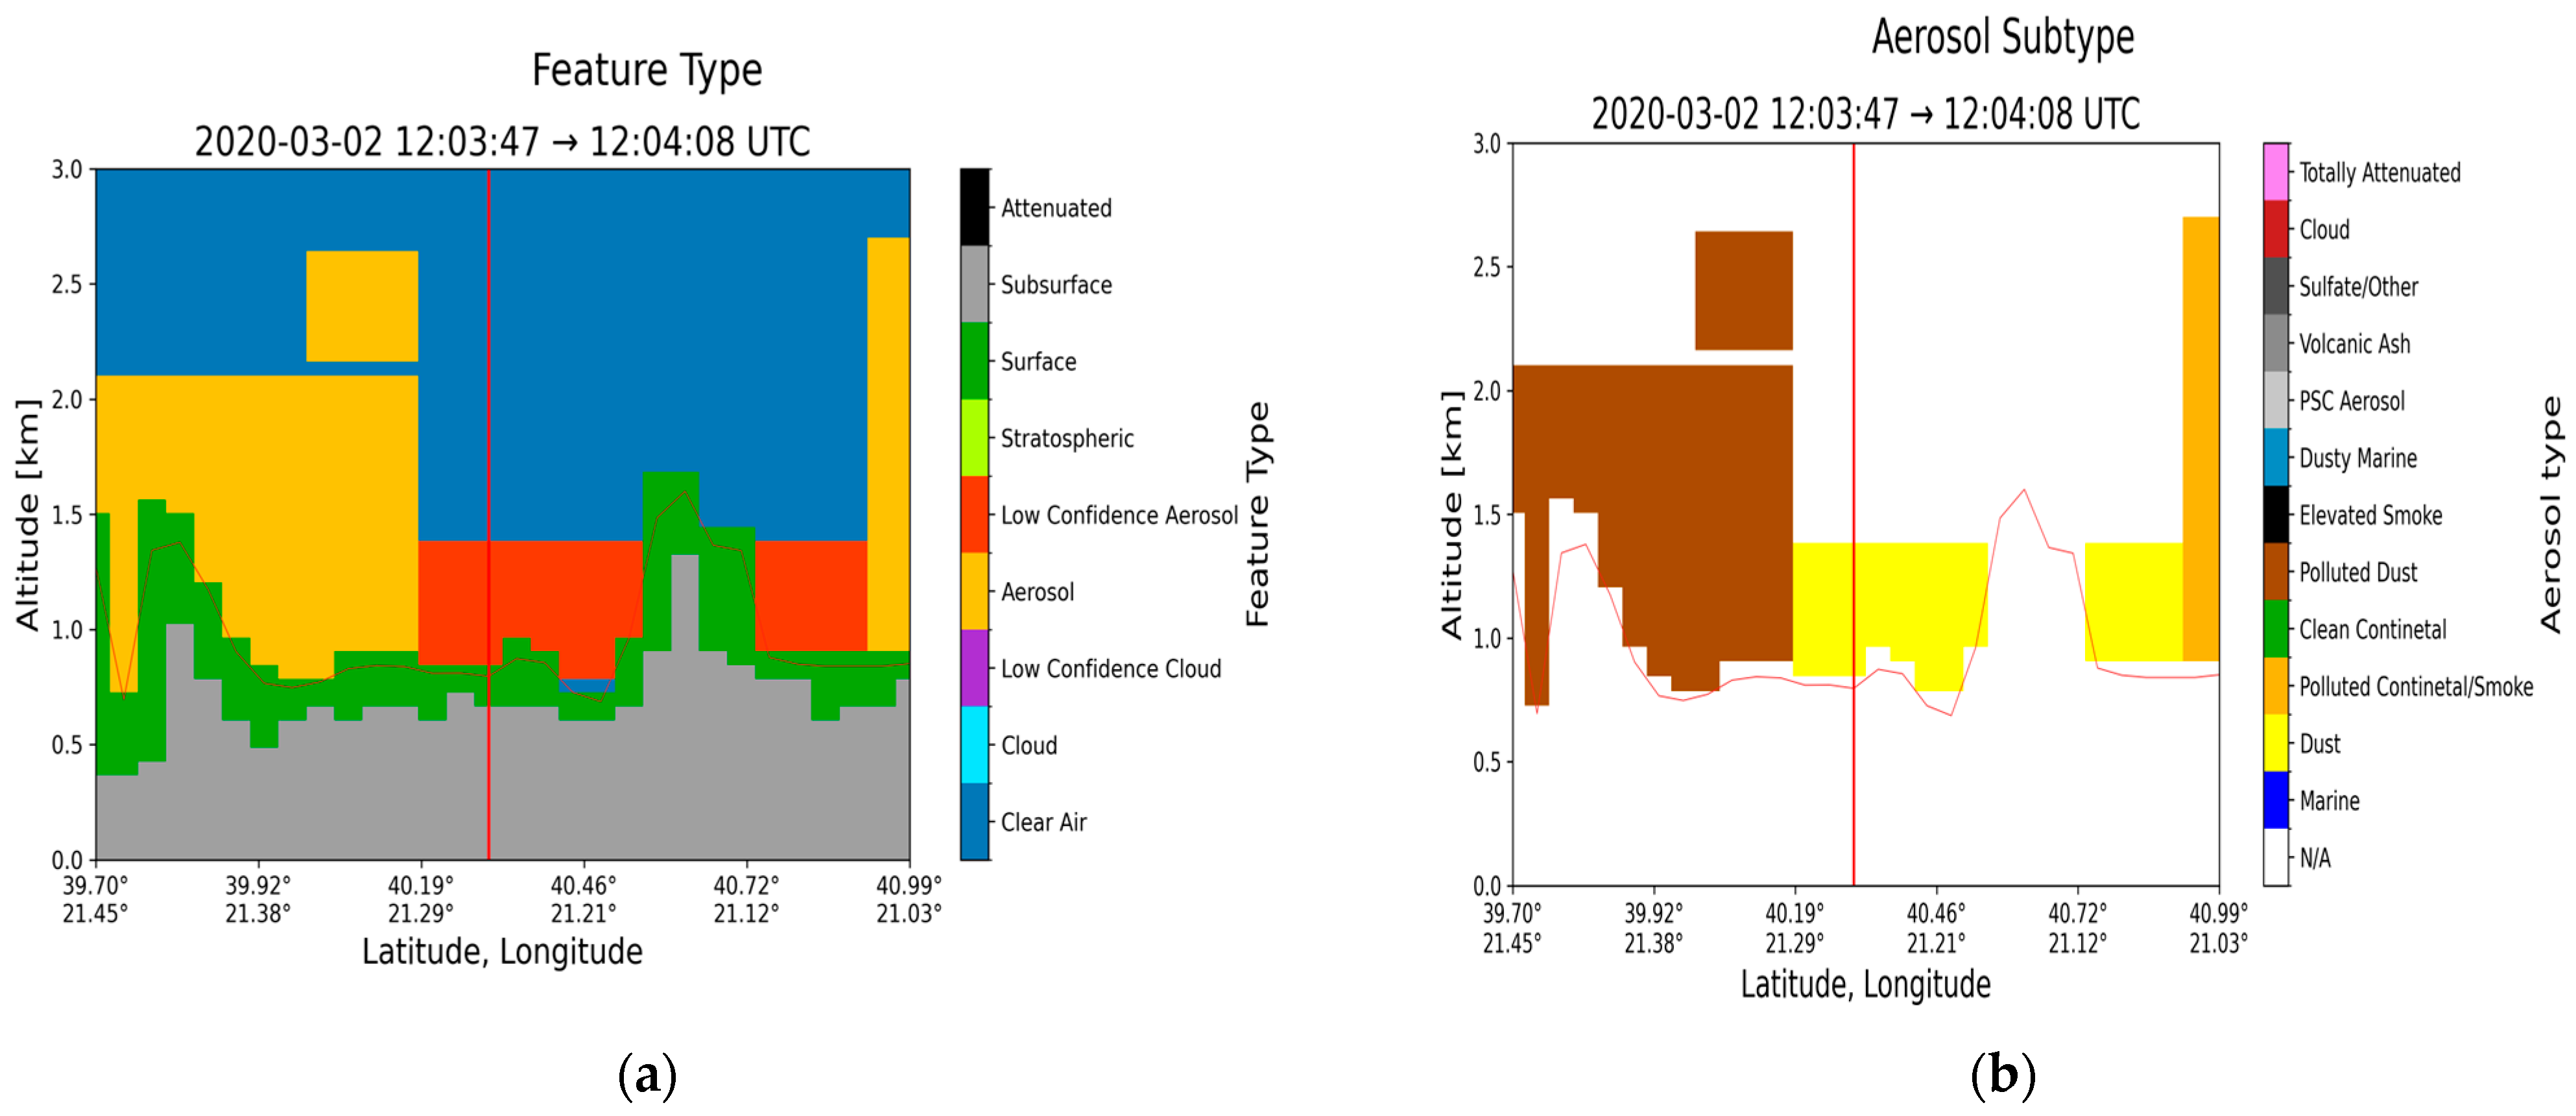
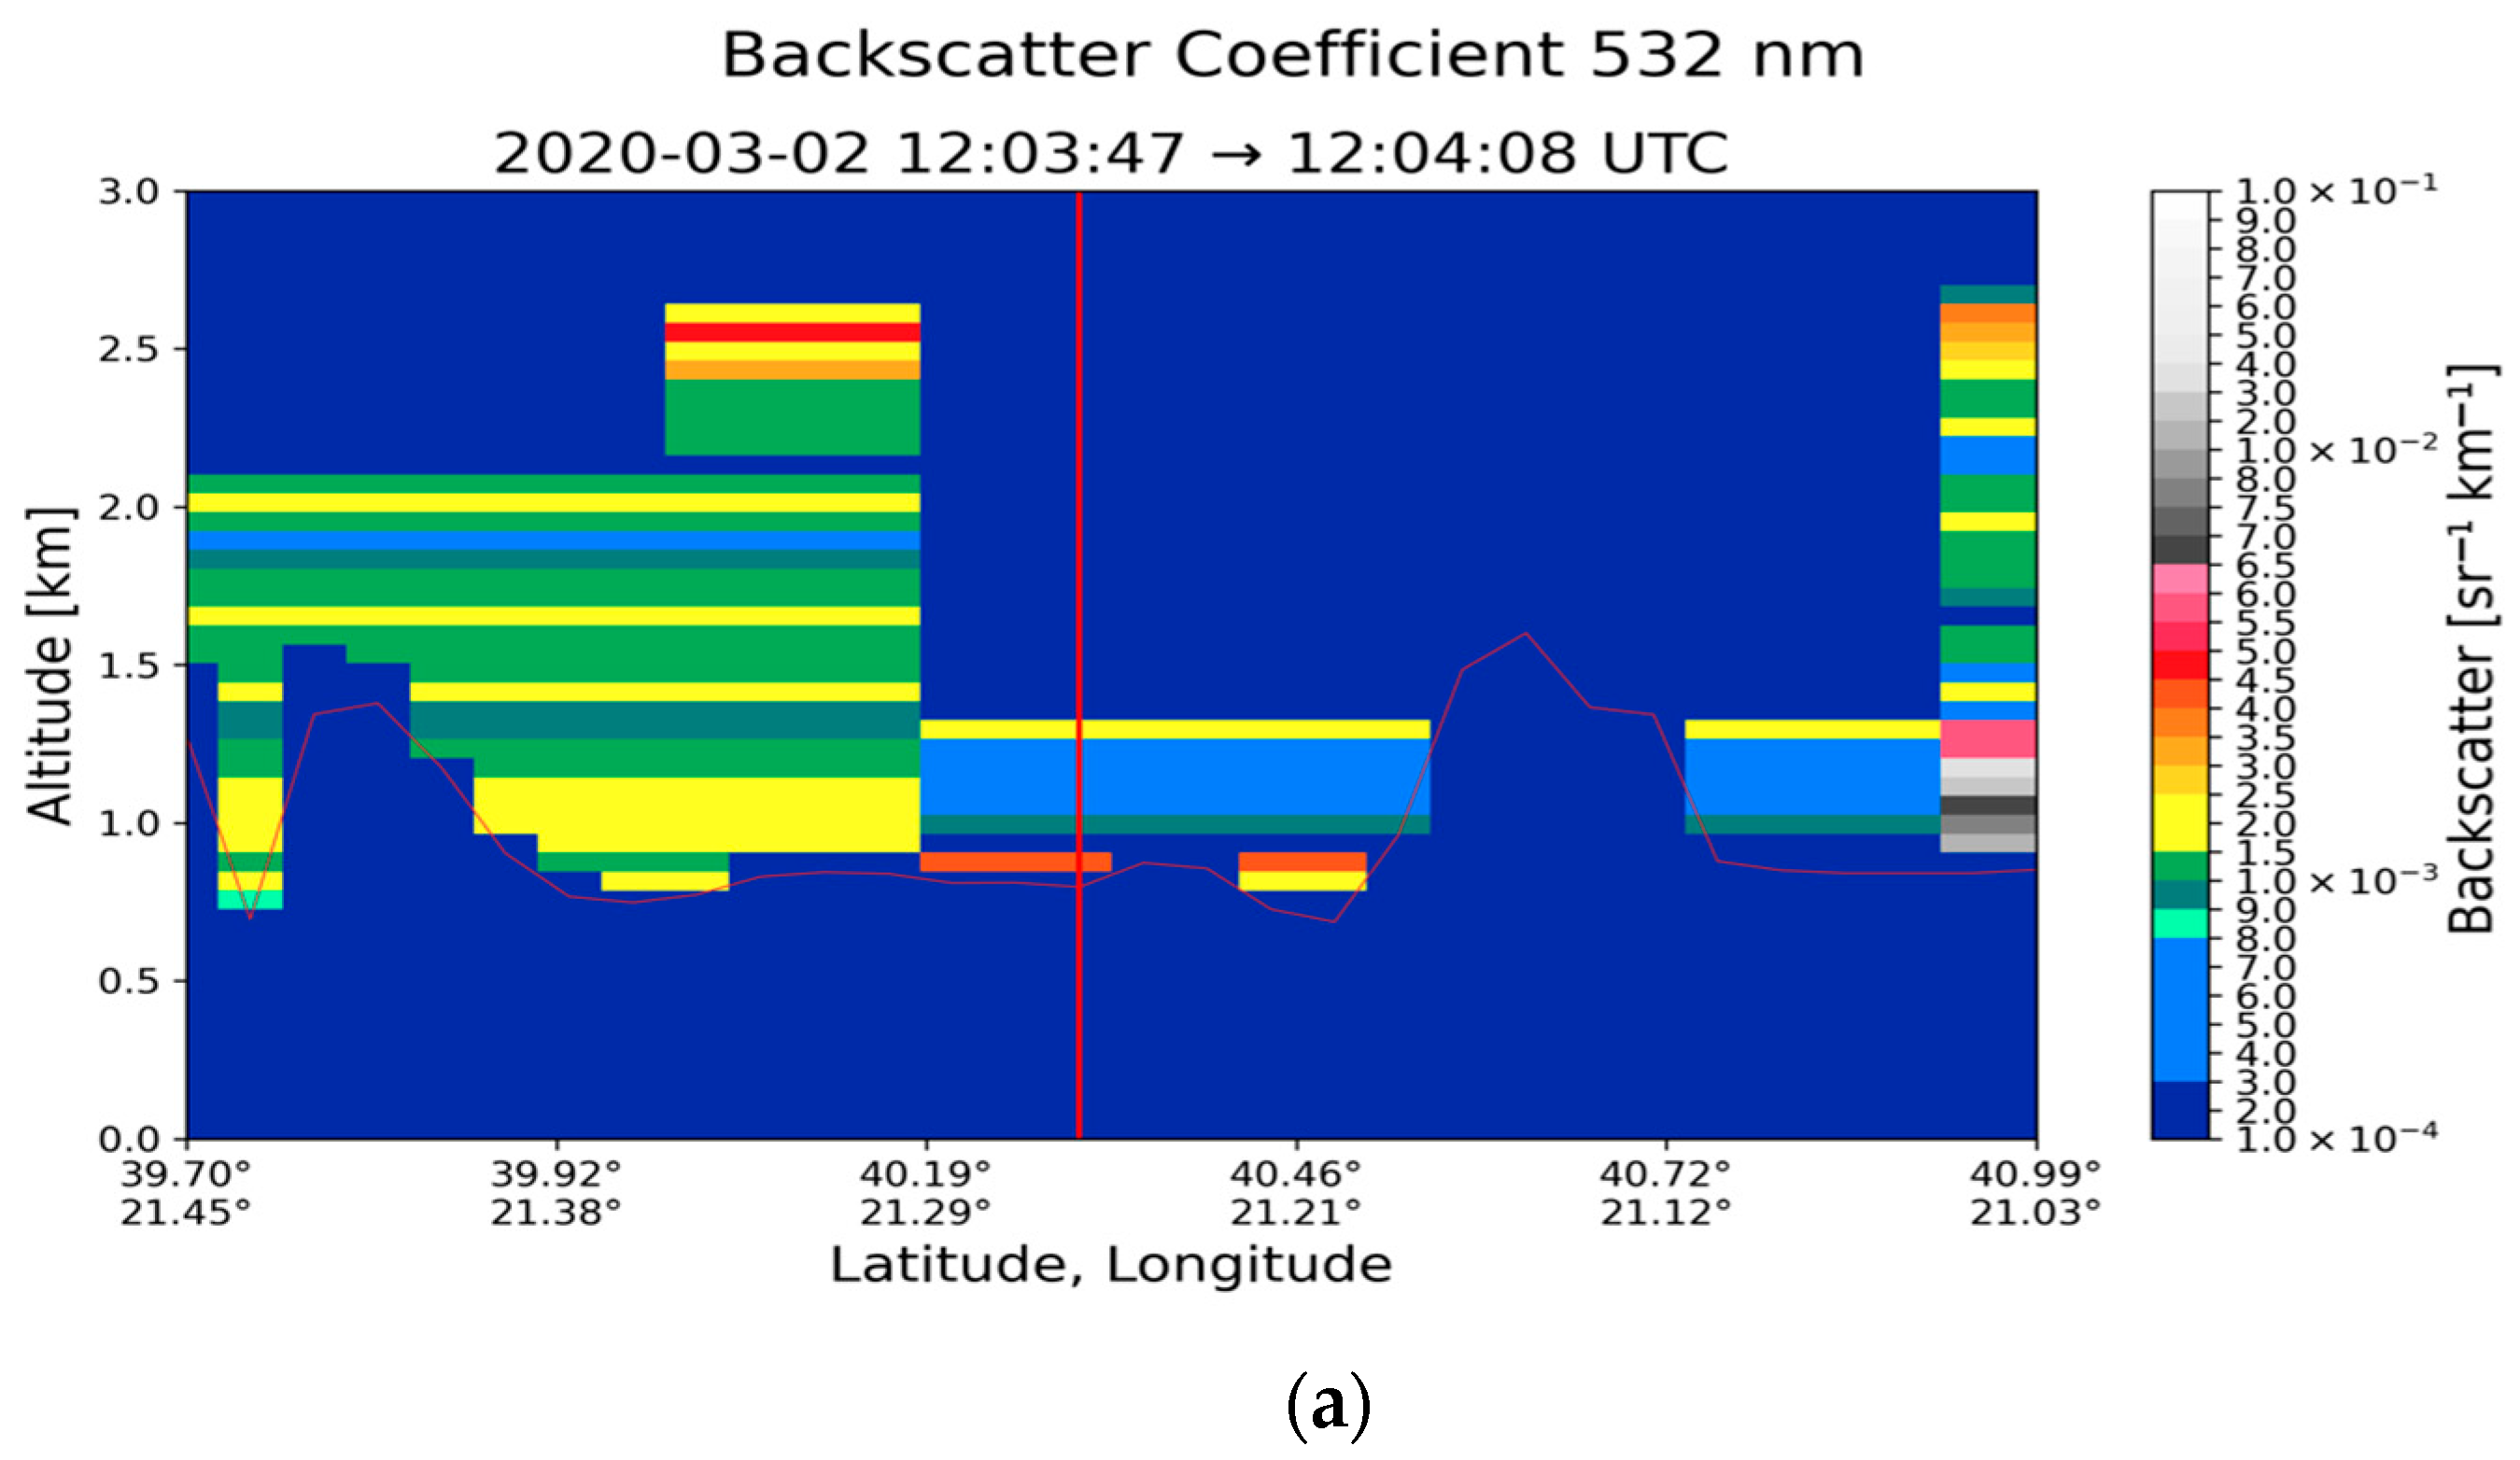
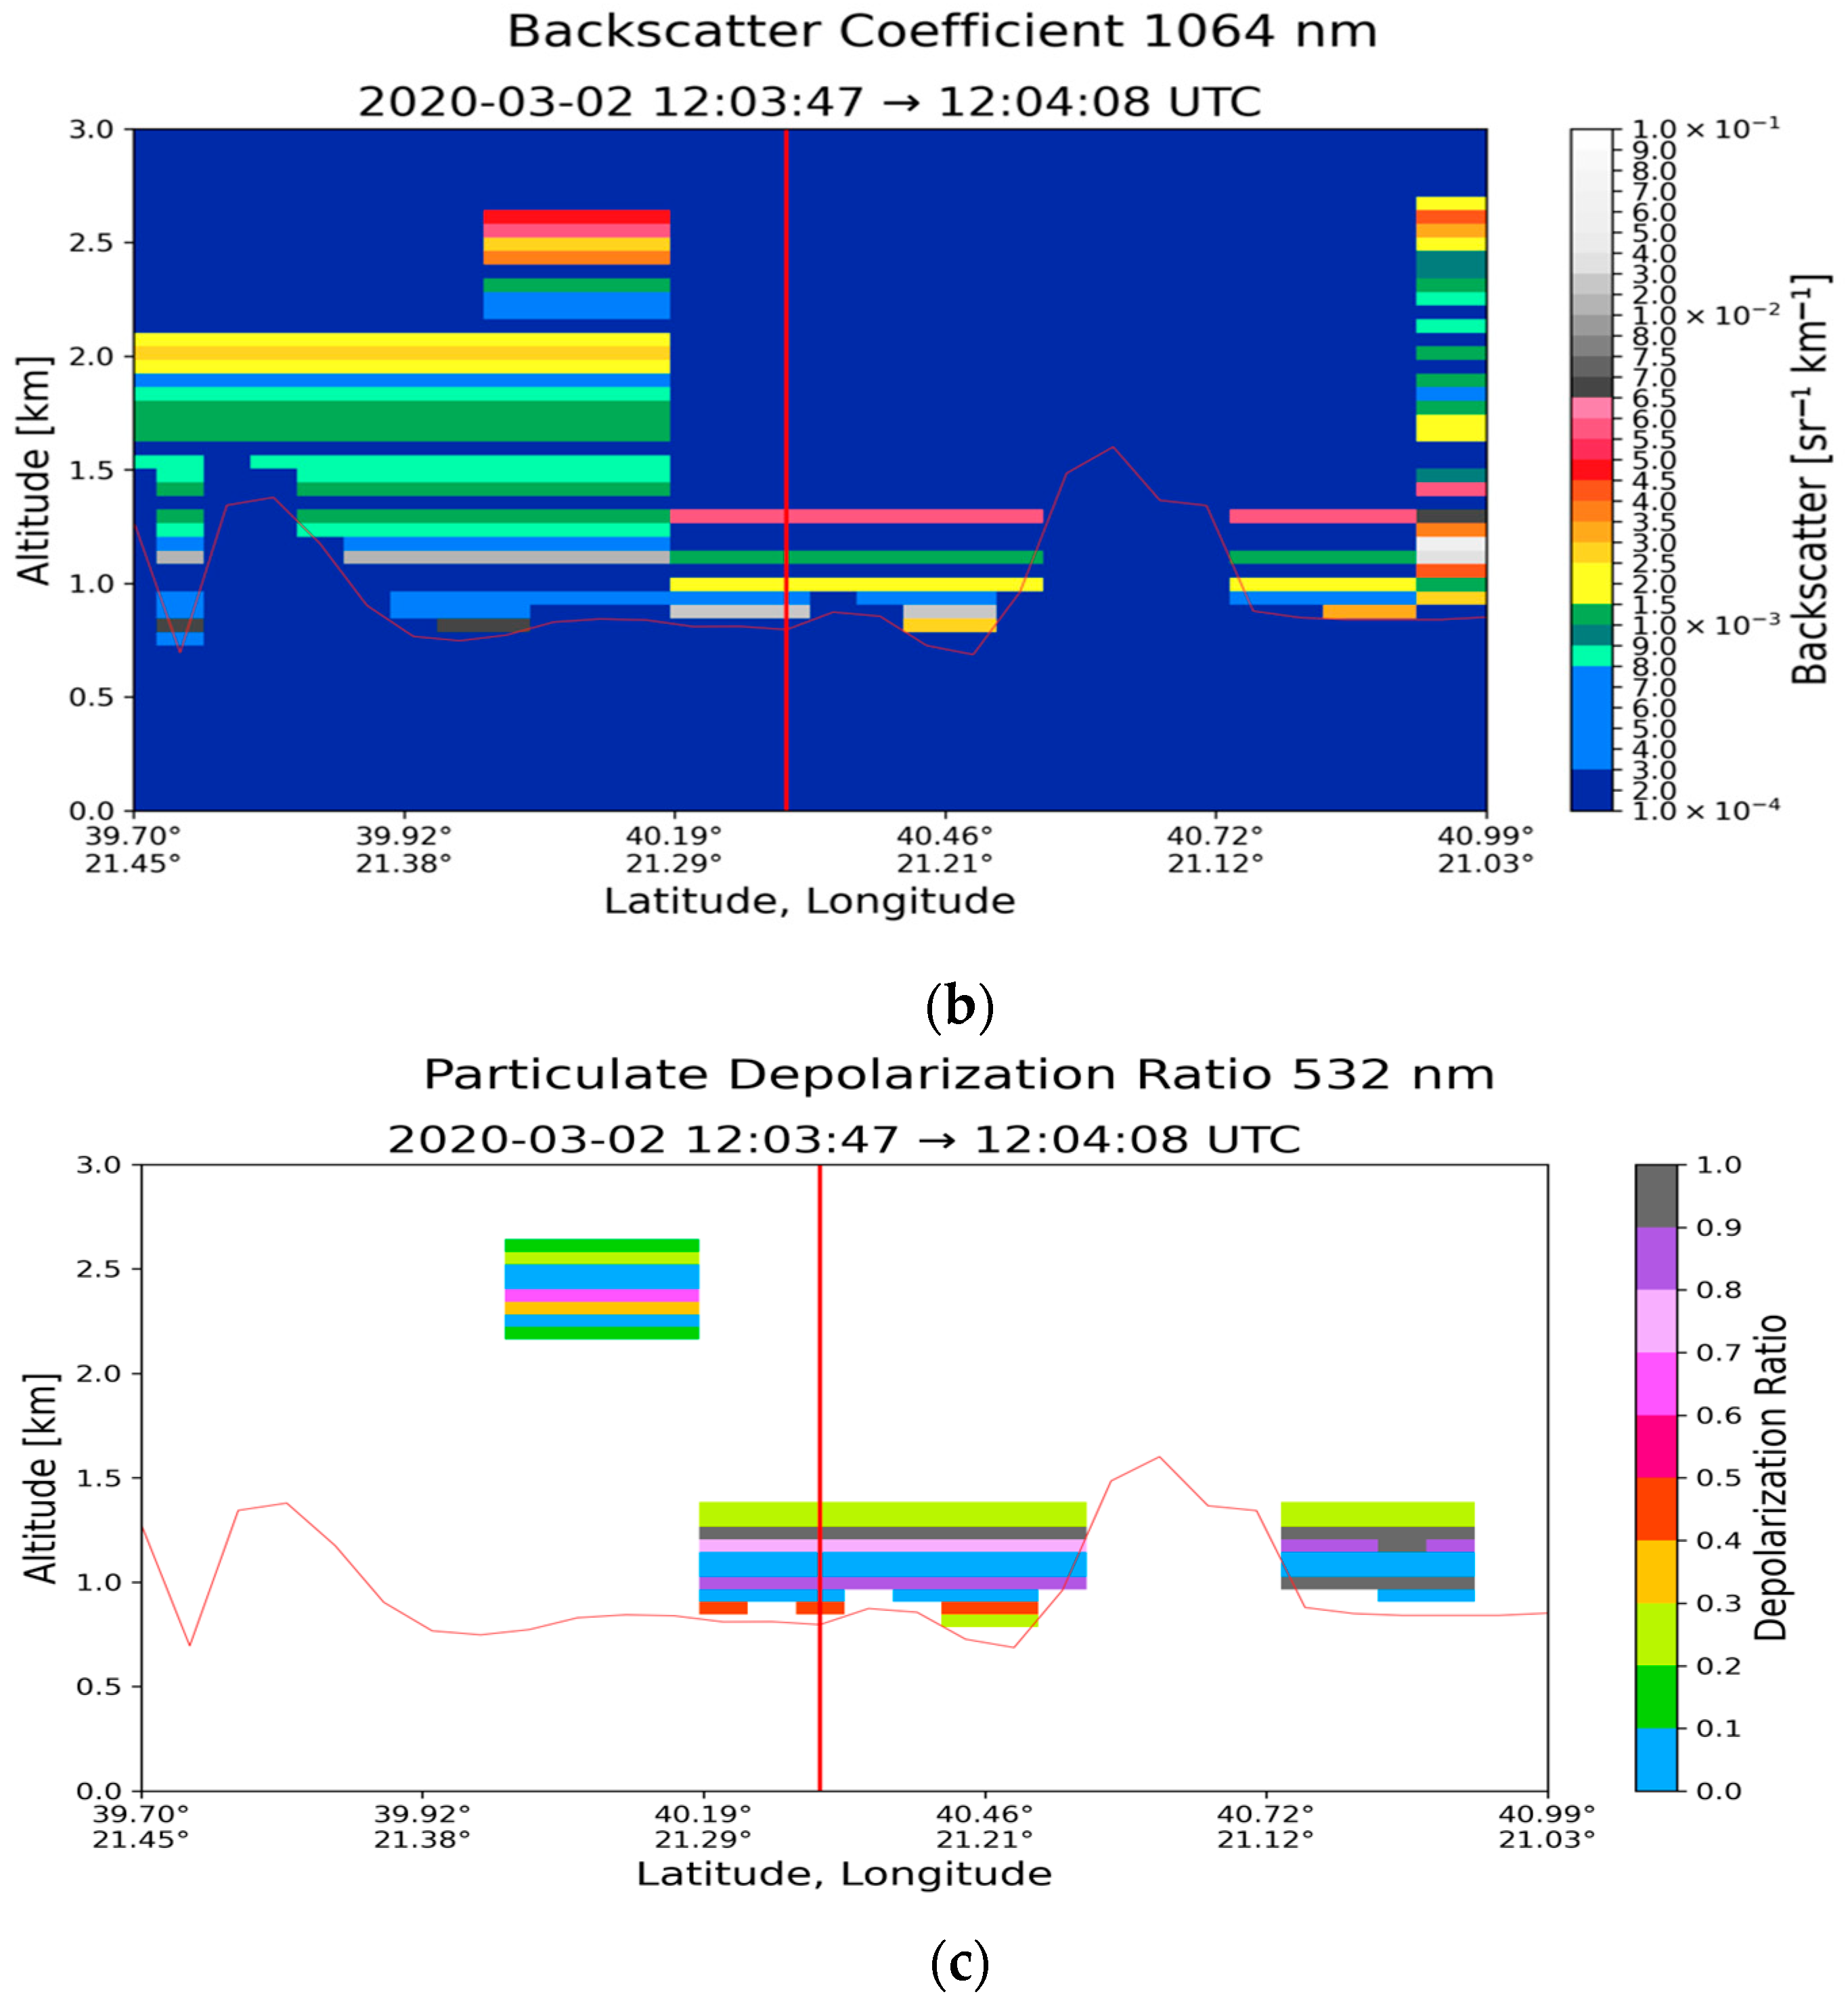
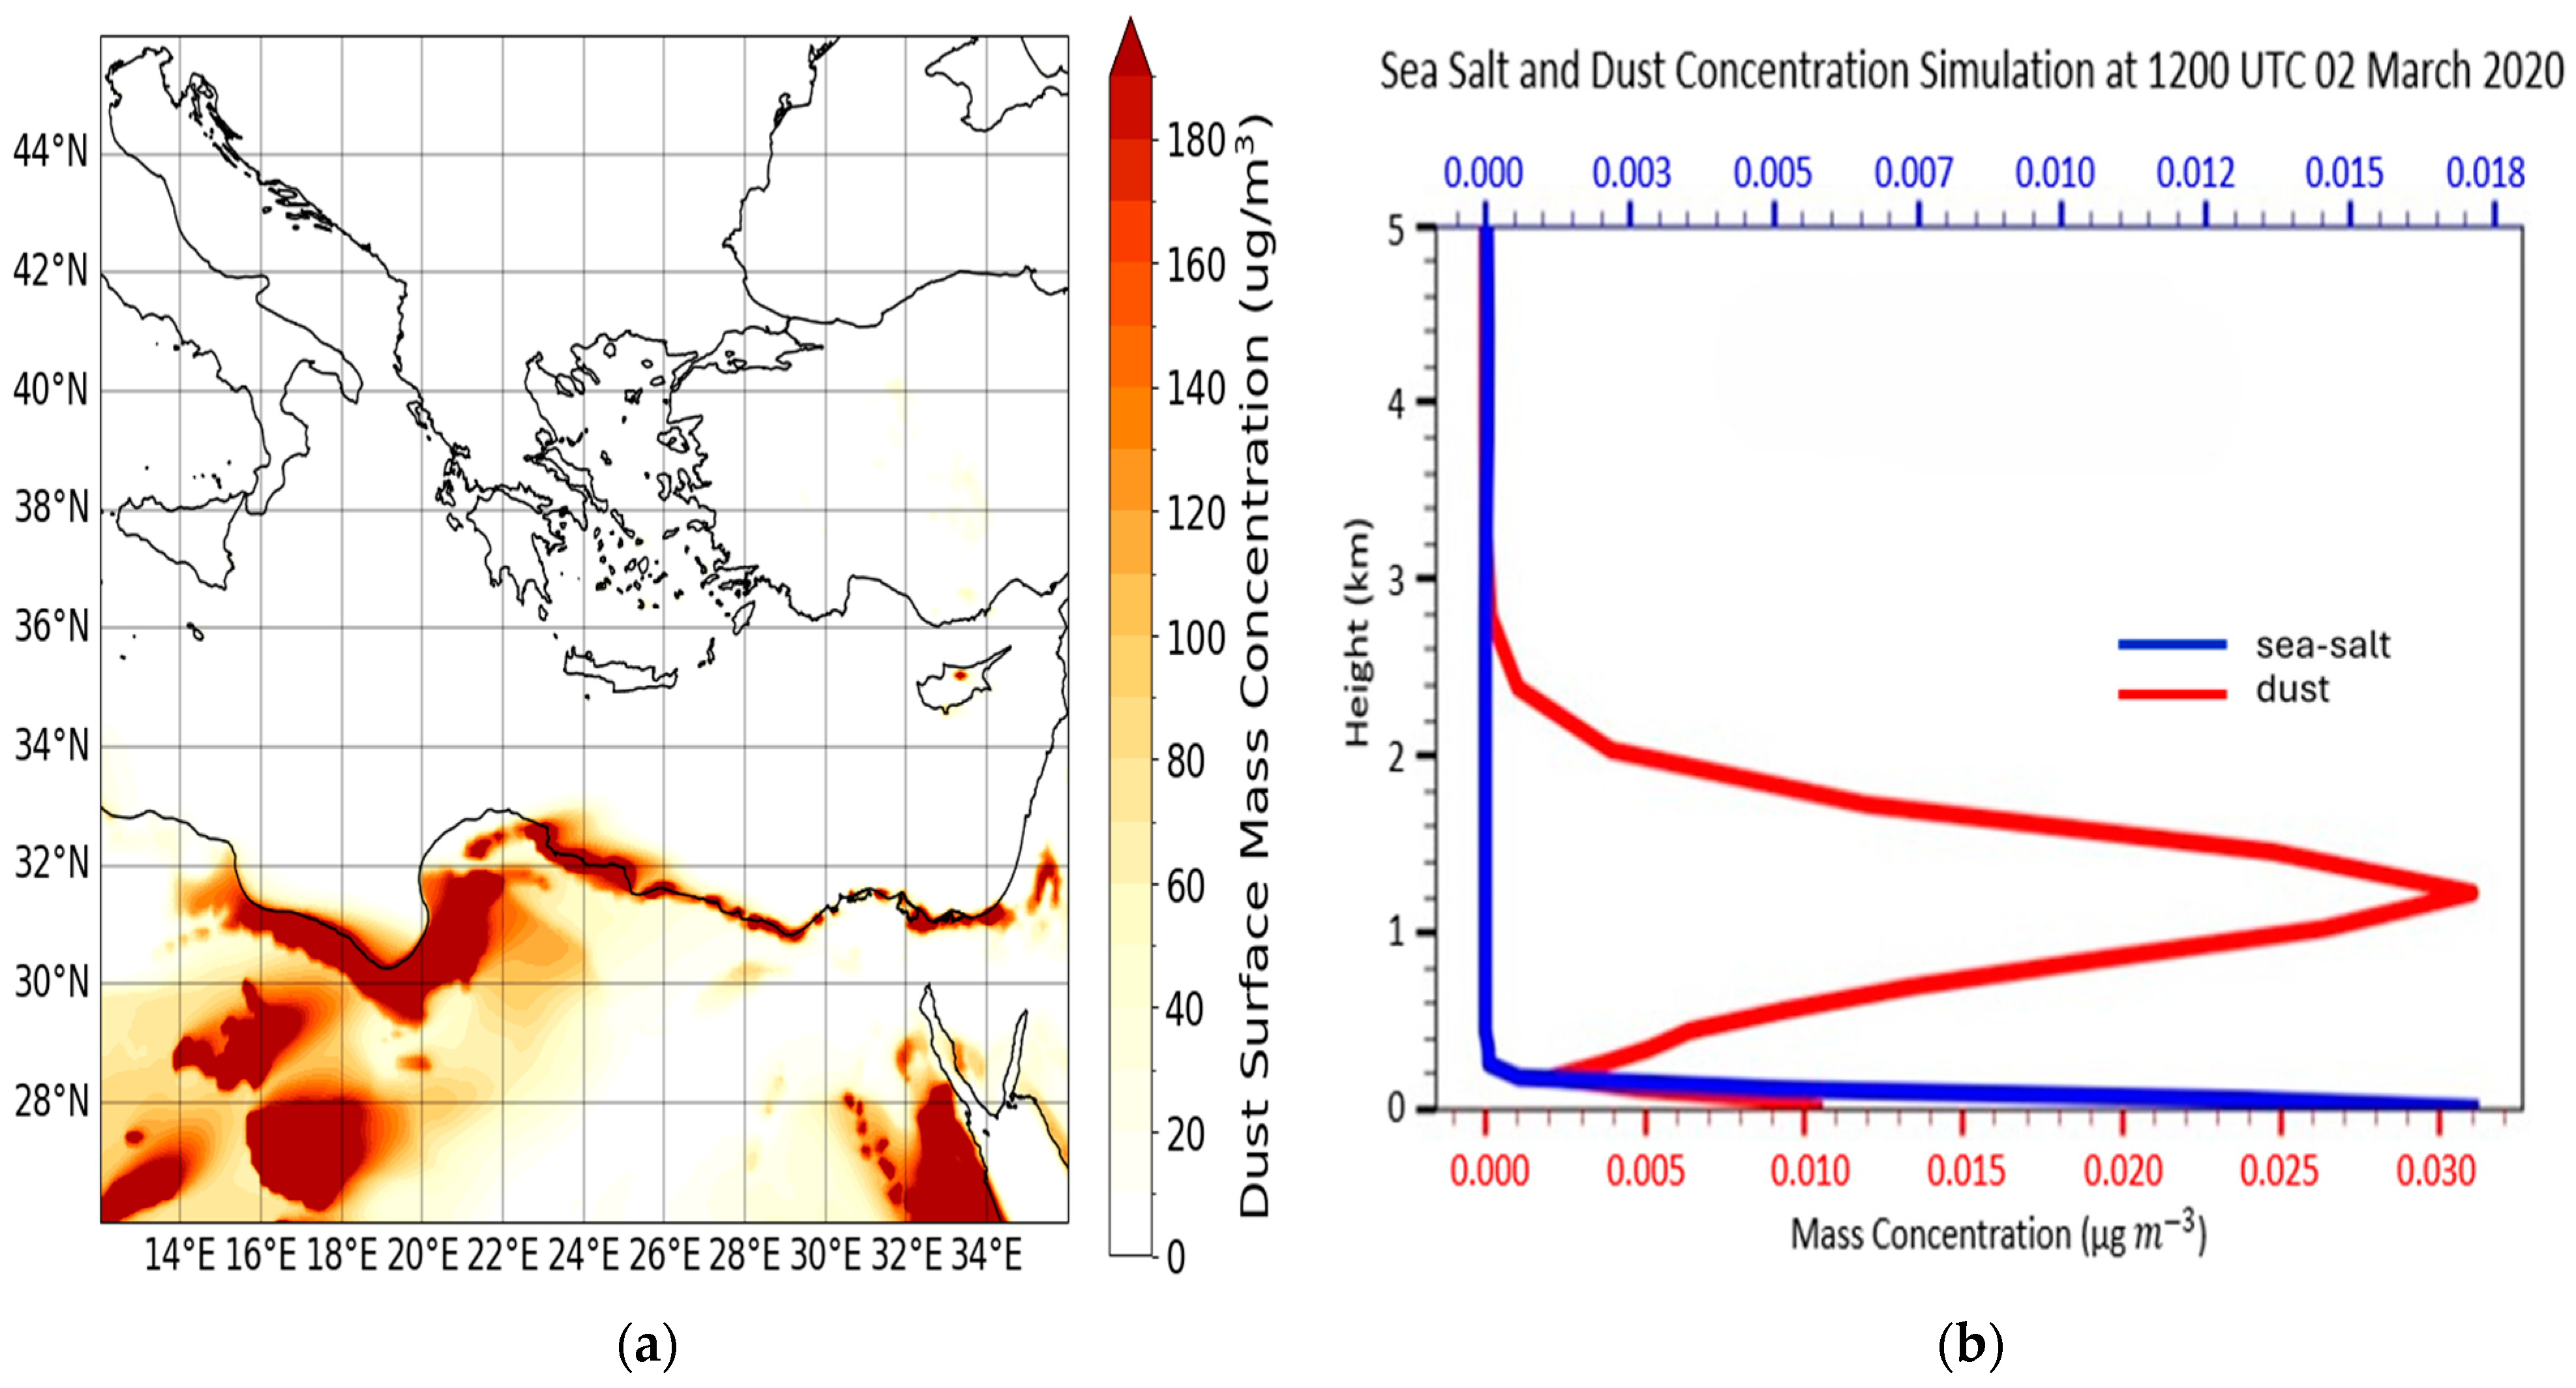
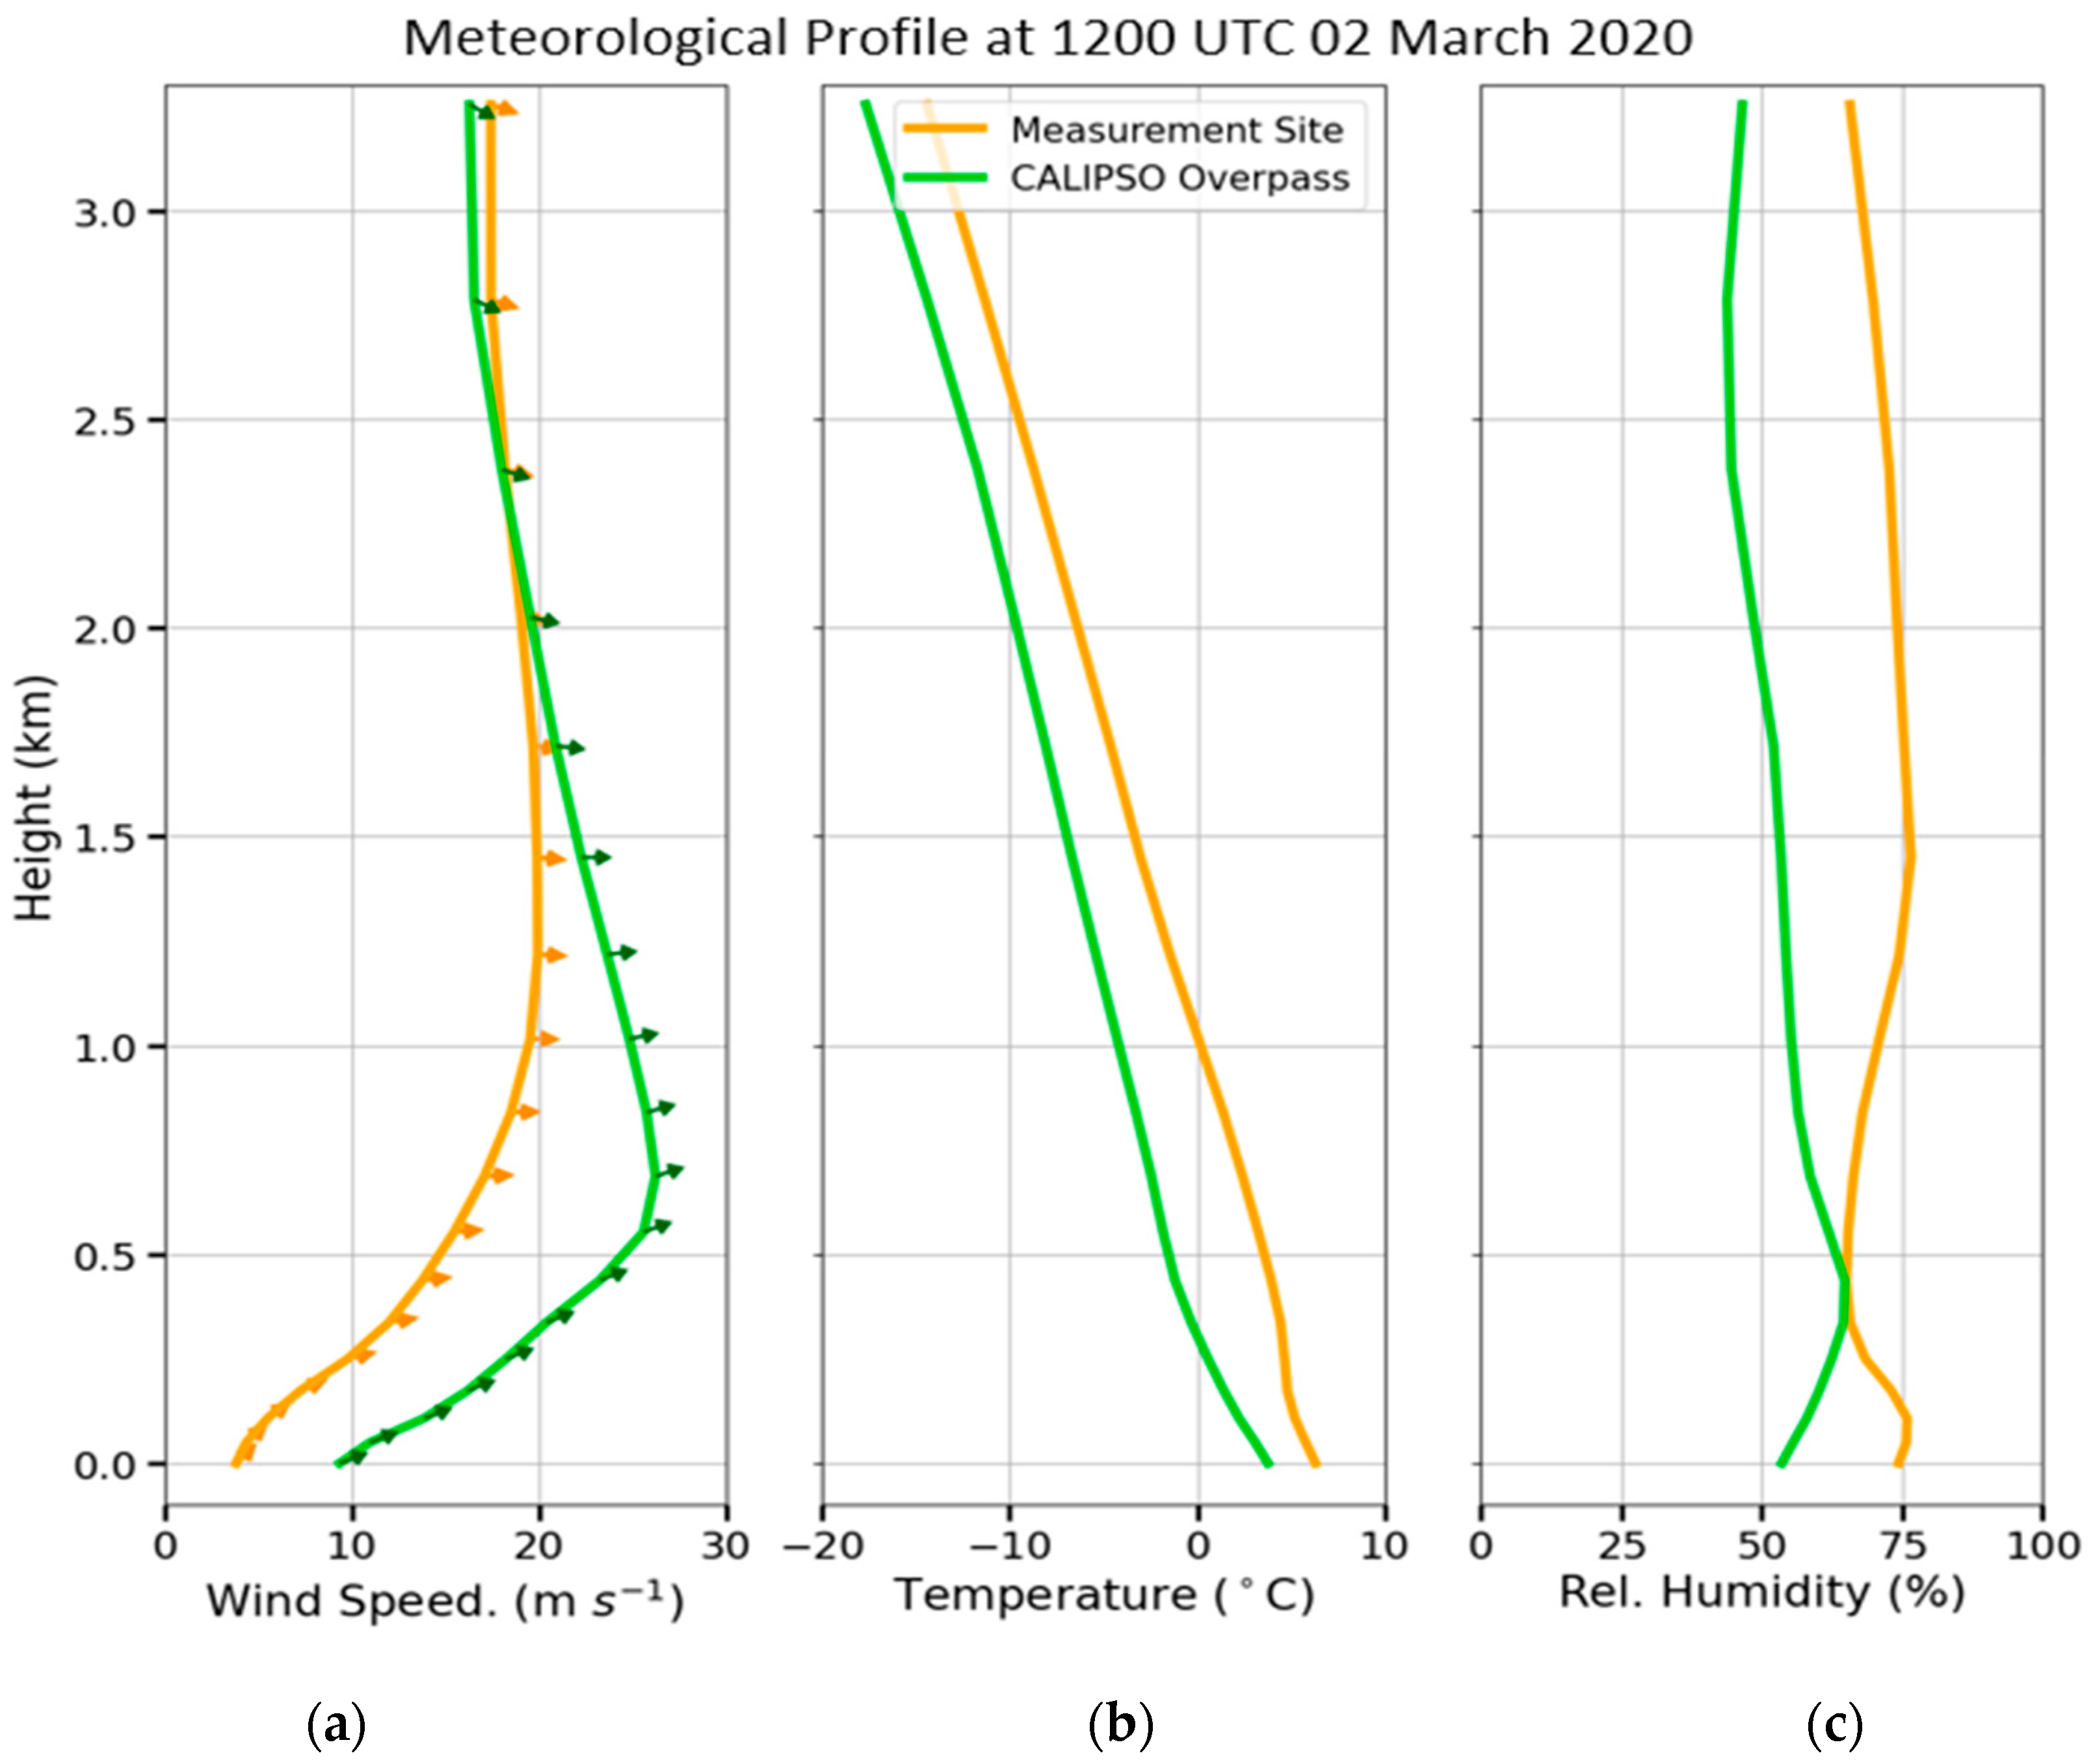
3.2. Case Study in Thessaloniki: 2 March 2020

The elevated concentrations were assigned to Alnus, Populus, Cupressaceae, Ulmus, and Urticaceae by the Hirst-type sampler (Figure 9). The maximum concentration reported was 424 grains m−3 between 8 and 10 UTC. Cupressaceae was the prevalent pollen type, contributing more than 96% to the total. It was anticipated, as it is one of the most frequently occurring pollen types in Thessaloniki during this time of year [51]. Alnus, Populus, Ulmus, and Urticaceae pollen grains had concentrations lower than 50 grains m−3 and contributed less than 4% to the total pollen concentration.
The satellite passed at 12:03:58 UTC when concentrations higher than 300 grains m−3 were recorded. The minimum distance between CALIPSO and the study area was 148.1 km west of Thessaloniki. CALIPSO observed a low-confidence aerosol, identified it as dust, and detected a layer between 0.801 and 1.340 km (Figure 10), while the surface type was characterized as crop-mosaic. Figure A3 and Figure A4 show that the aerosol layer does not originate from higher altitudes, ruling out long-range transport in the free troposphere. The feature optical depth was found to be equal to 0.030 ± 0.009 and 0.019 ± 0.007 at 532 and 1064 nm, respectively (Table 2). The mean backscatter coefficient at 532 nm and 1064 nm for this layer were calculated as 0.092 × 10⁻² ± 0.029 × 10⁻² and 0.062 × 10⁻² ± 0.048 × 10⁻² km−1·sr−1, respectively (Figure 11). The mean color ratio was 0.638 ± 0.362, while the mean depolarization ratio was 28.30 ± 14.16%. The mean Ångström exponent was calculated at 0.65.
Backward trajectories analysis showed no Saharan dust transportation. Furthermore, RAMS/ICLAMS simulations showed dust surface mass concentration and the vertical concentration of mass of marine particles and dust particles at 12 UTC (Figure 12). No dust presence was detected in Thessaloniki or the broader area of Greece. The concentration of dust particles increased within the first 1.3 km from the ground, reaching a maximum value of 0.031 µg·m−3. Subsequently, the values gradually decreased with altitude, reaching zero at 2.8 km. CALIPSO’s aerosol characterization as dust is not verified. The RAMS/ICLAMS model was also used to investigate the absence of relatively large marine particles. The maximum value of the concentration of marine particles was 0.0175 µg·m−3 at ground level at 12 UTC, while at an altitude of 0.2 km the sea-salt mass concentration dropped to zero values. Wind speed vertical profiles showed an increase in wind speed magnitude with height, which reached the maximum values between 0.5 km and 1 km above the ground (Figure 13). Concurrently, the vertical distribution of temperature manifested a decrease in temperature with height. Both the wind speed and temperature vertical patterns imply conditions that favor the horizontal and upward movement of air masses. Relative humidity values were within the range of 50 to 75%.
The analysis revealed that the large particles are neither dust nor marine in origin. Thus, the large aerosol load measured by CALIPSO was possibly influenced by Cupressaceae pollen grains, as evidenced by the findings from the pollen trap. Through a comprehensive analysis of CALIPSO, HYSPLIT, and RAMS/ICLAMS results, in conjunction with prevailing meteorological conditions, it has been concluded that the observed CALIPSO aerosol layer between 0.801 and 1.340 km was attributed to airborne pollen rather than dust. The region of the CALIPSO overpass, known for its rich vegetation, hosts a diverse array of tree species and plays a significant role in pollen production. The highest wind speed values are observed within the altitude range of 0.5 to 1 km, which overlaps substantially with the previously analyzed CALIPSO aerosol layer. Consequently, the transport of aerosol particles towards Thessaloniki, where the trap is located and pollen was detected, was facilitated. After excluding dust particles—whose characterization remains uncertain even for CALIPSO—it was determined that only pollen particles could depolarize the radiation to such a significant extent, resulting in a depolarization ratio of 28.30%. A laboratory study of the depolarization ratio at 180 angles lidar backscattering of pure pollen, showed that the mean depolarization ratio value of cypress pollen was 39.8 ± 0.3% [80]. The mixing of pollen grains with anthropogenic particles in the measurement site contributed to the smaller depolarization ratio values we reported compared to the laboratory study.

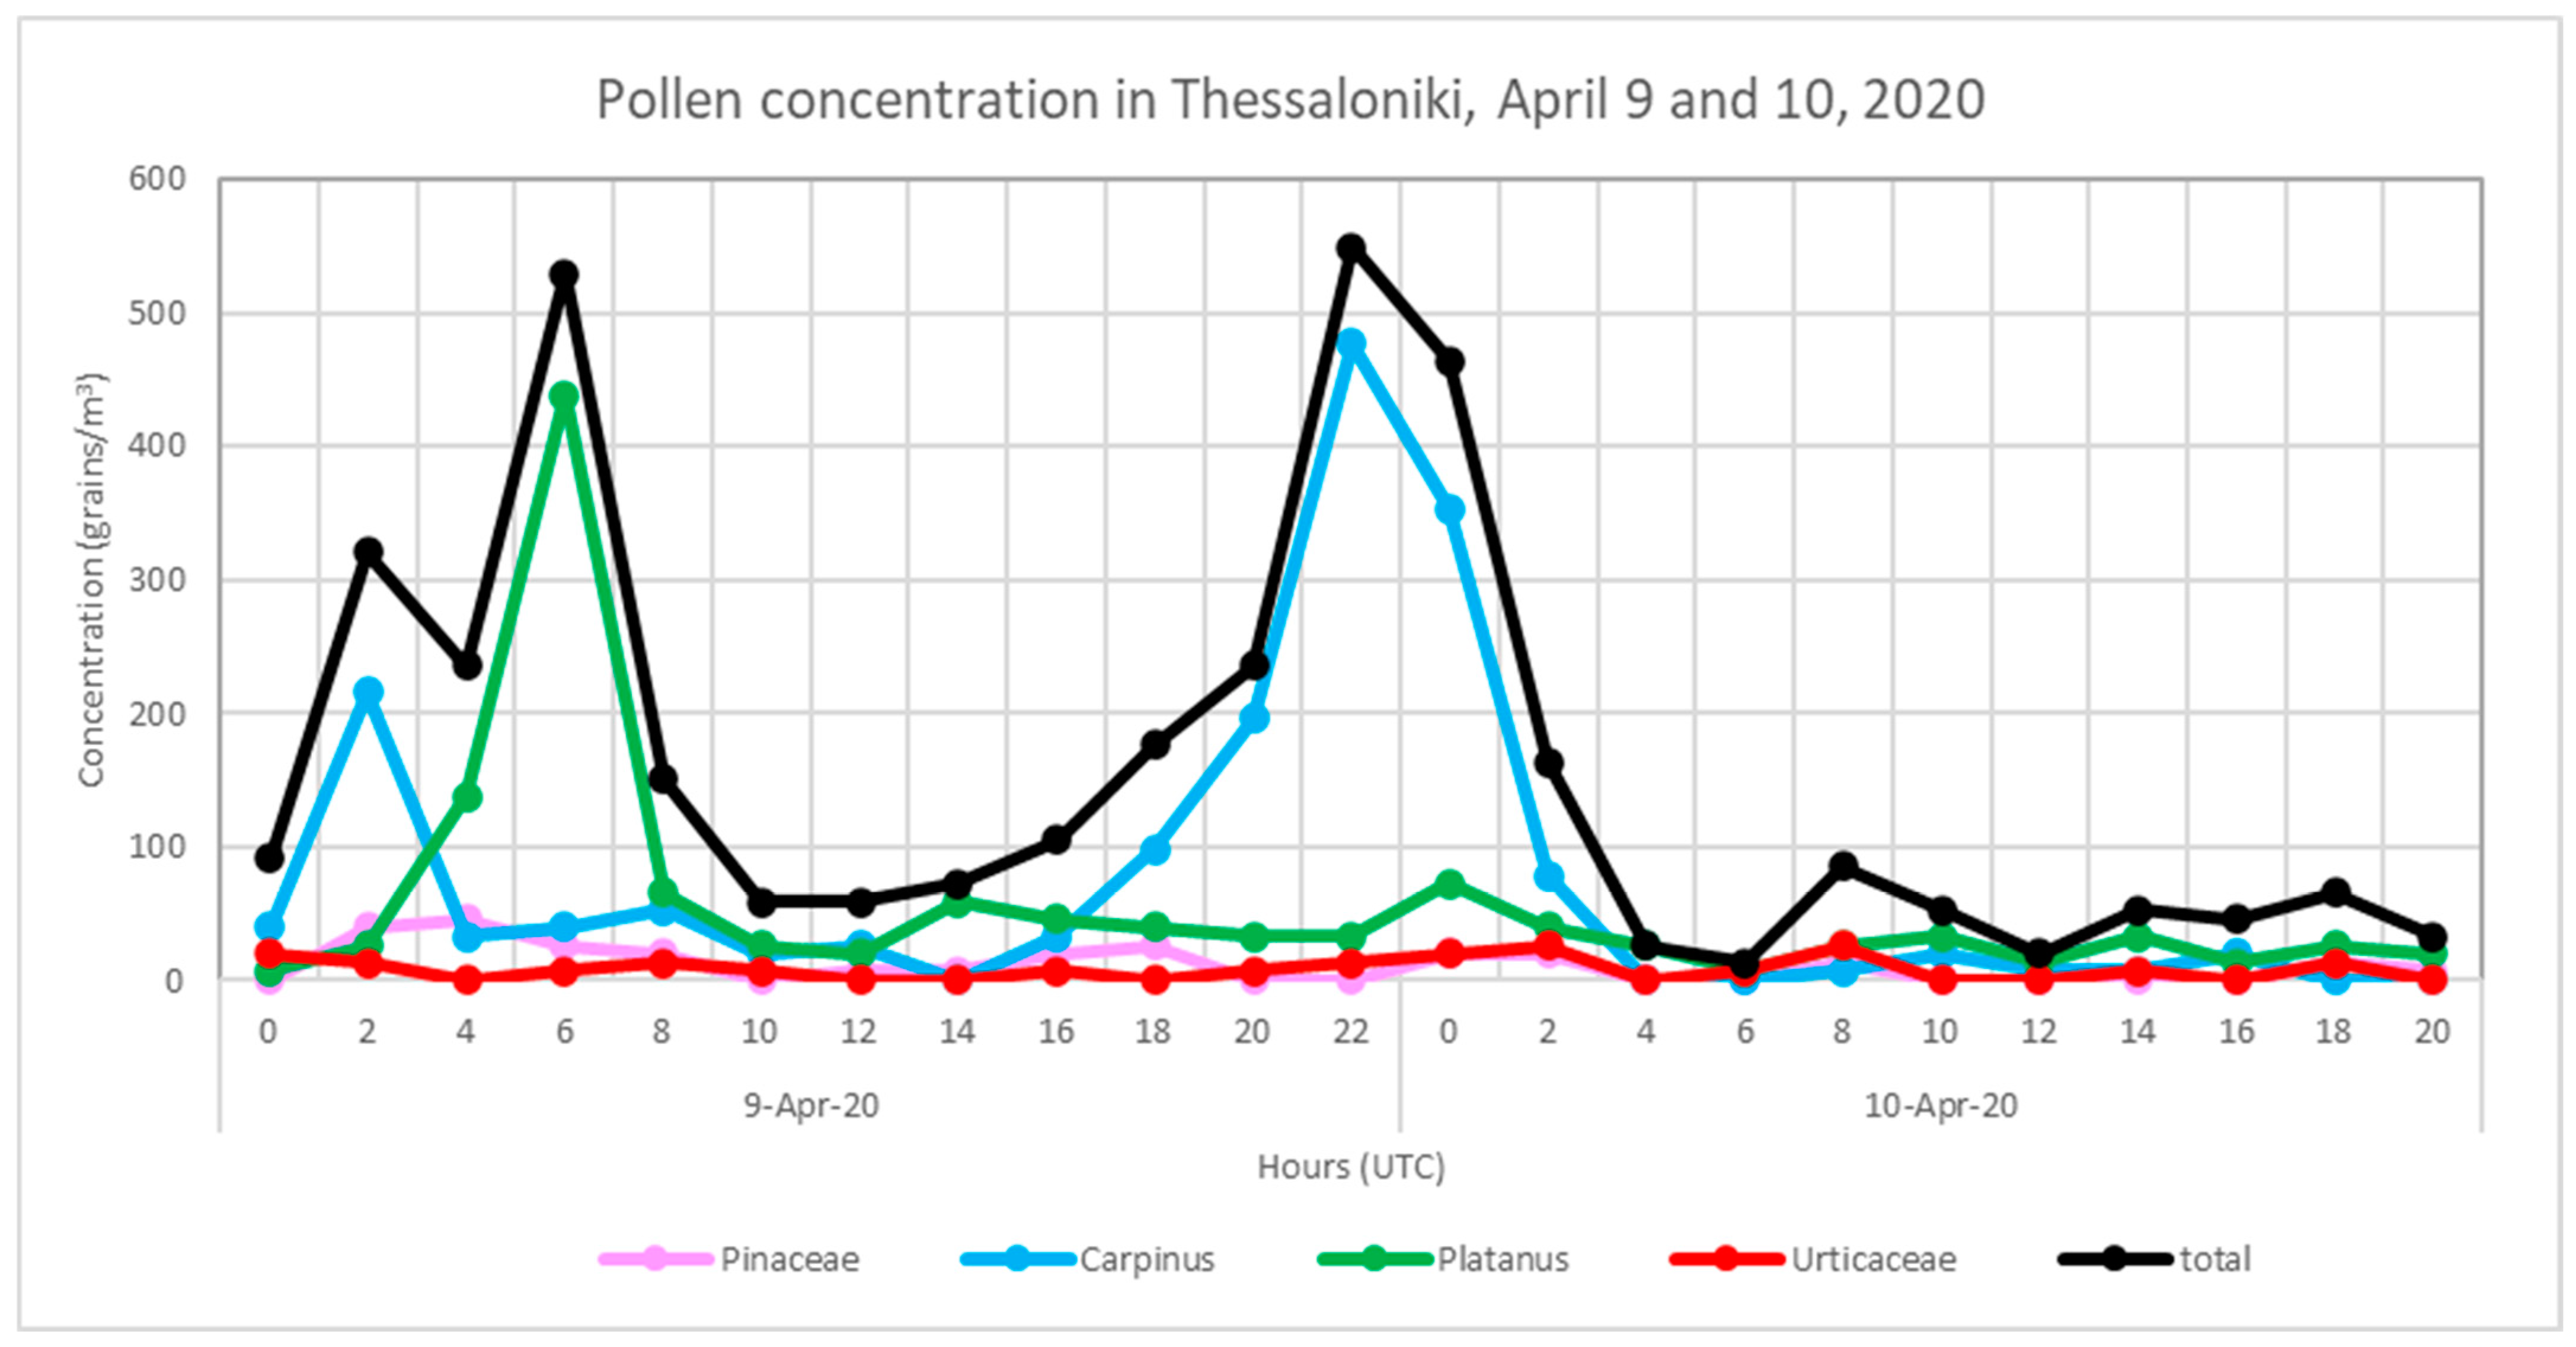
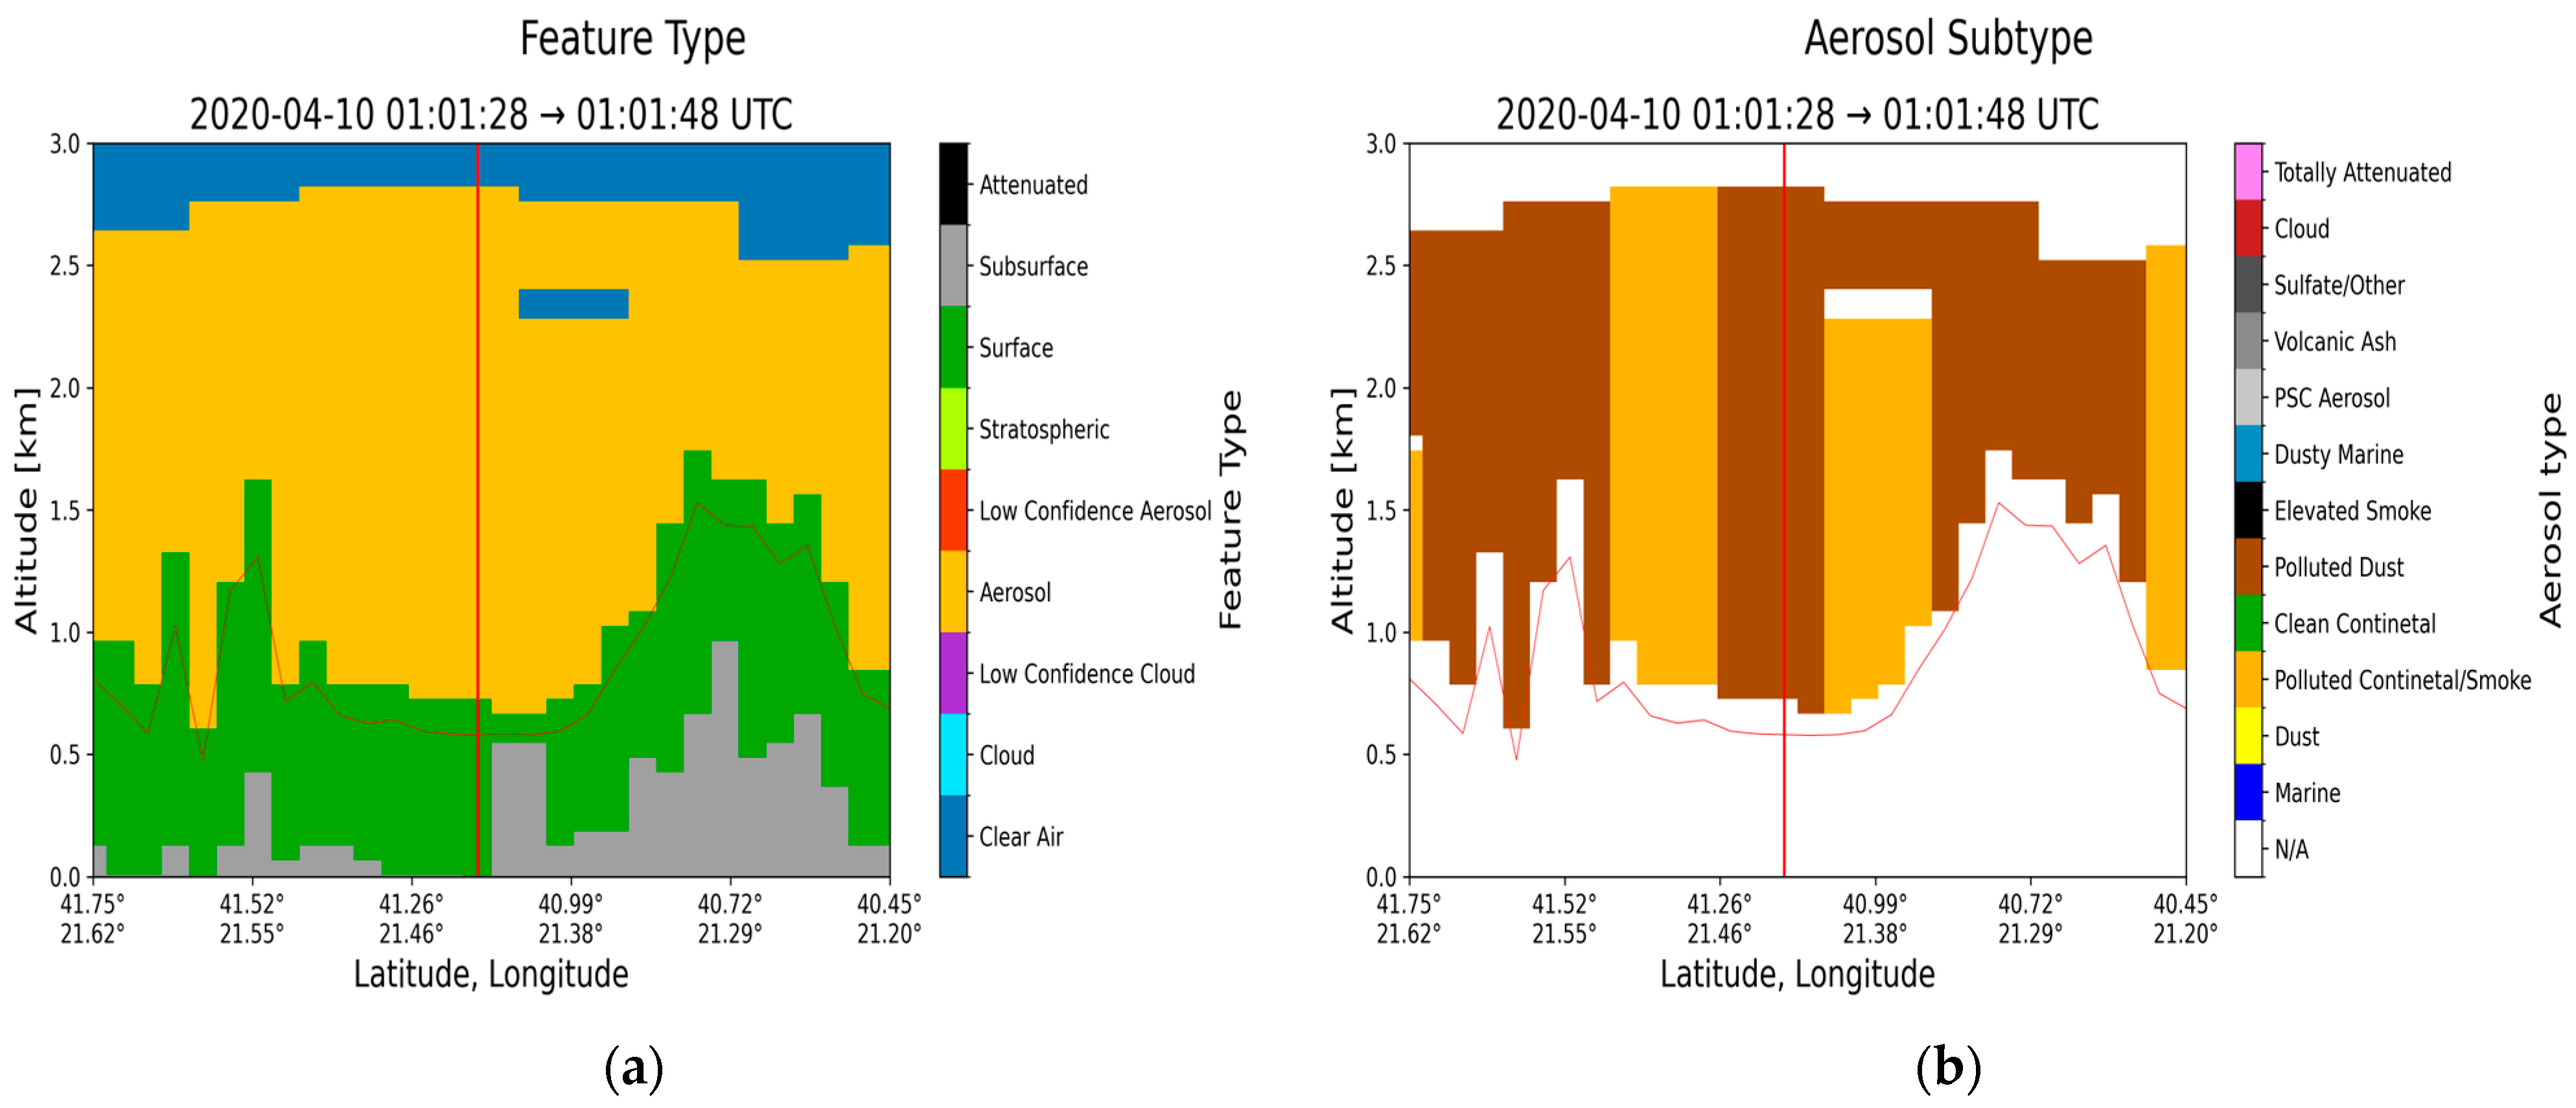
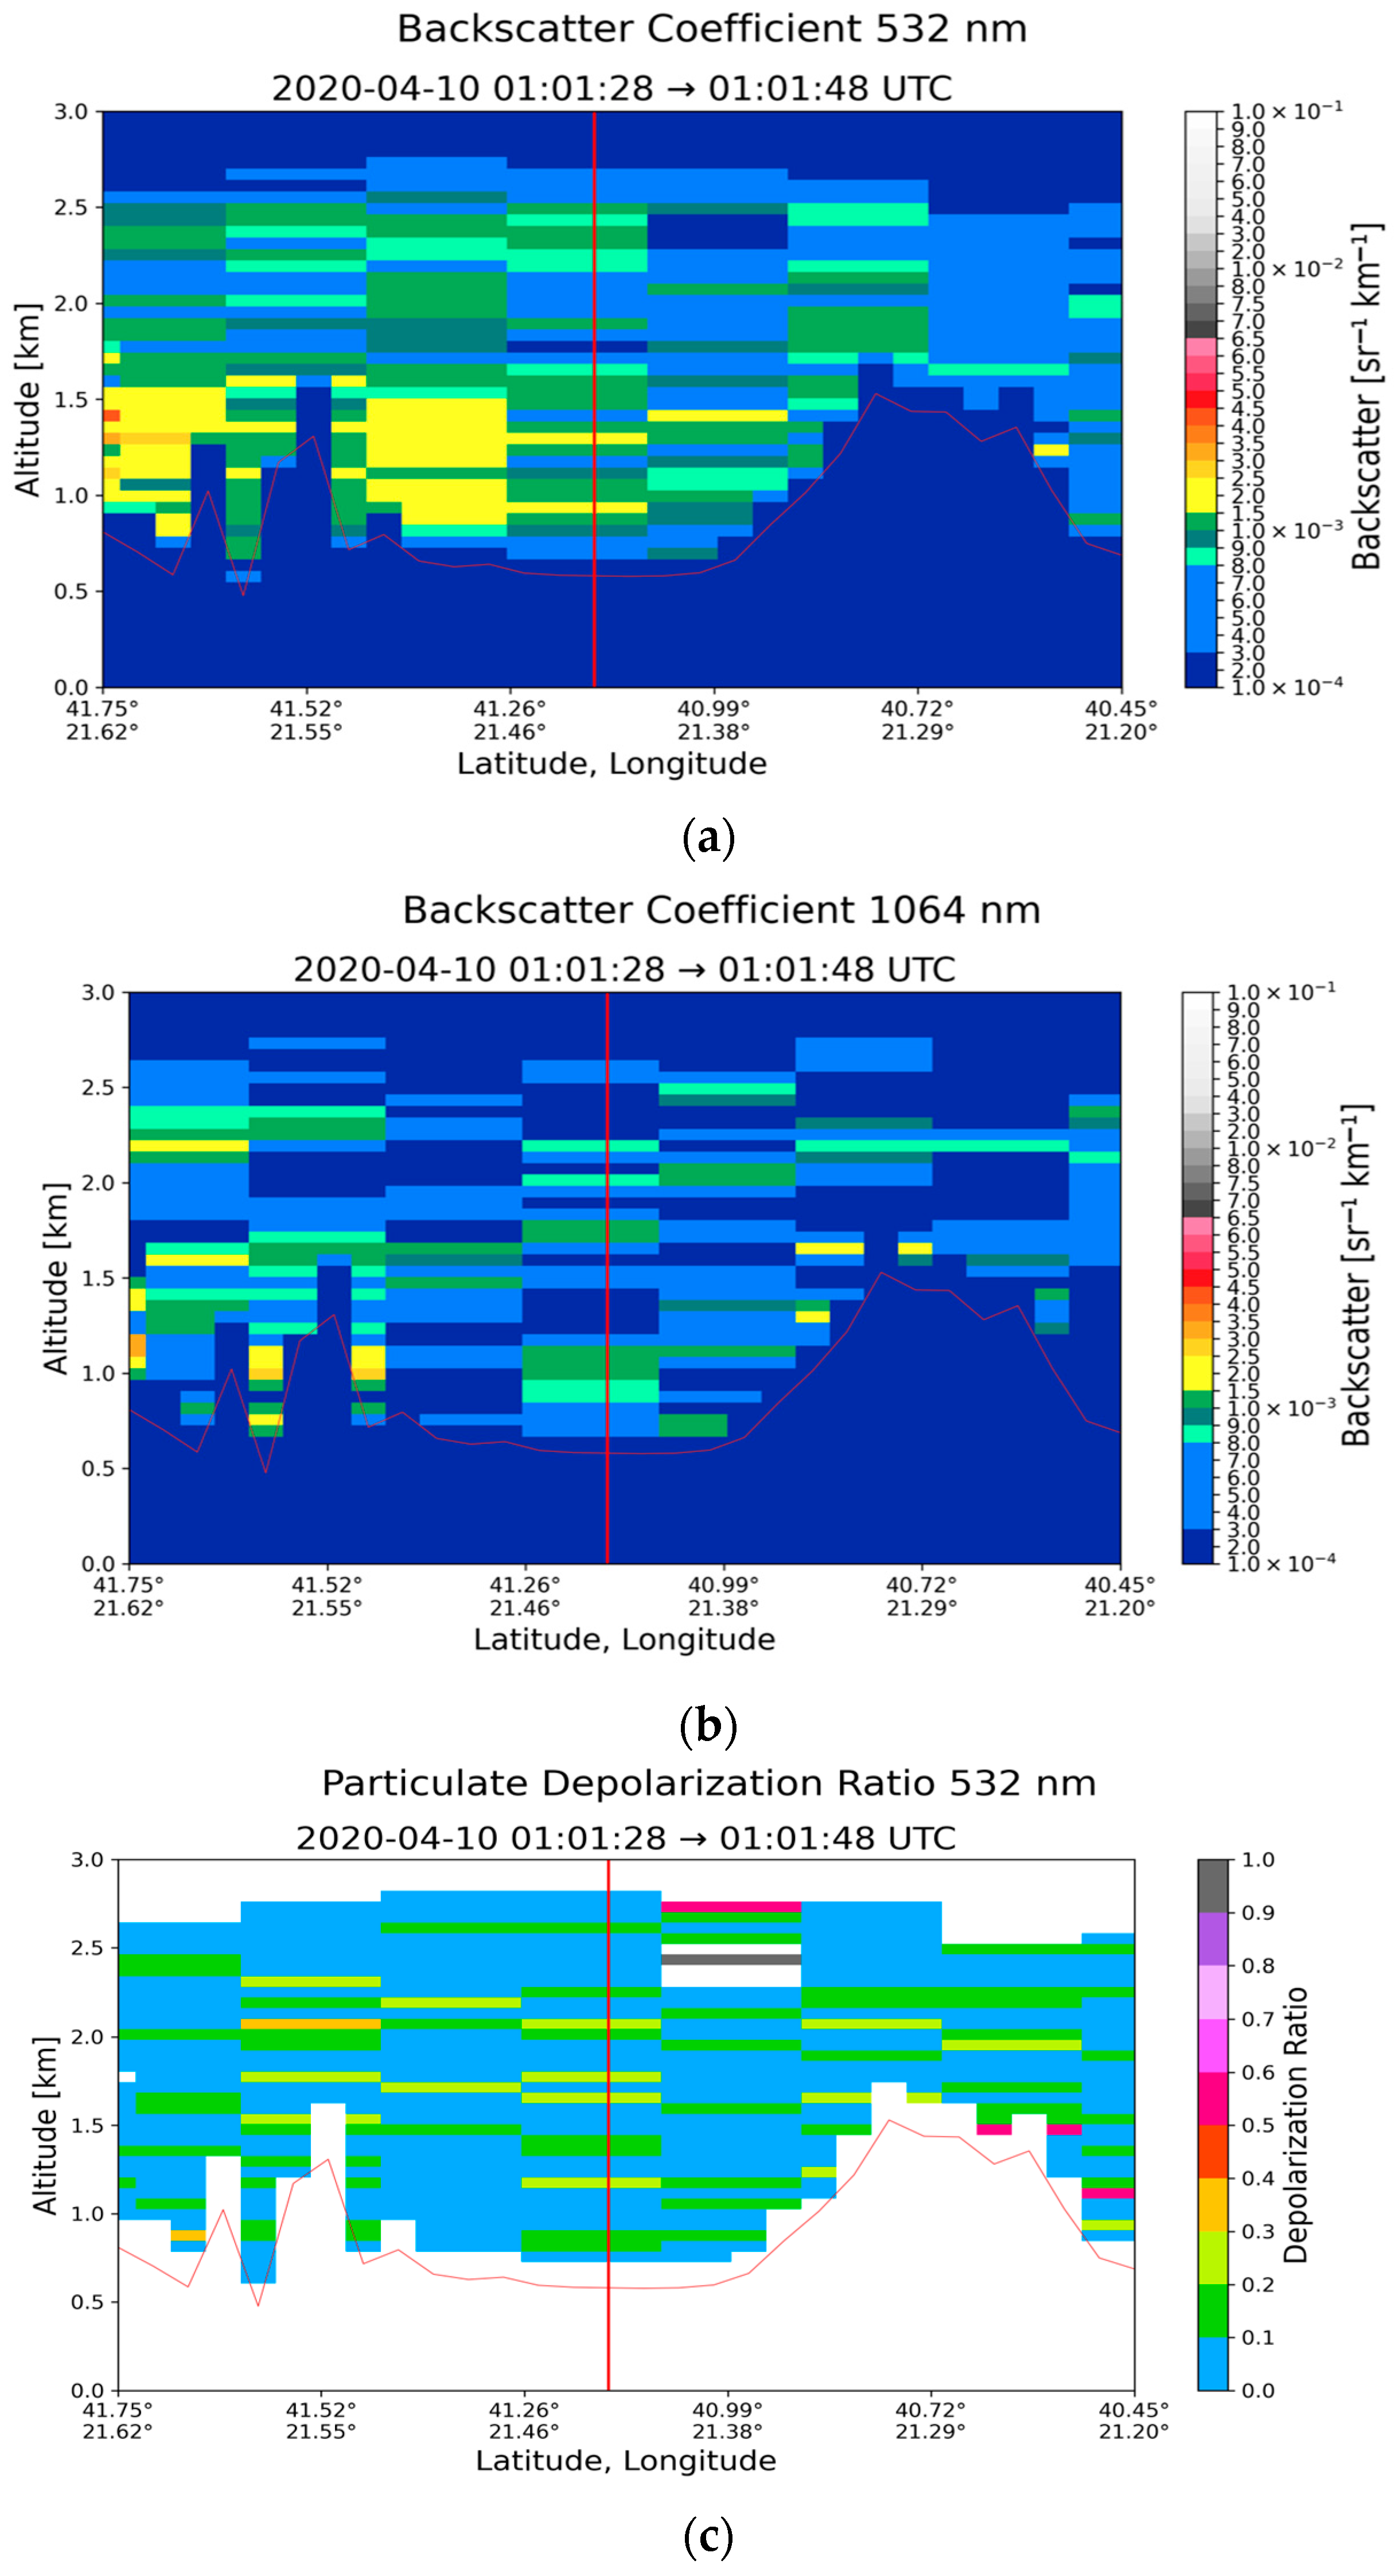
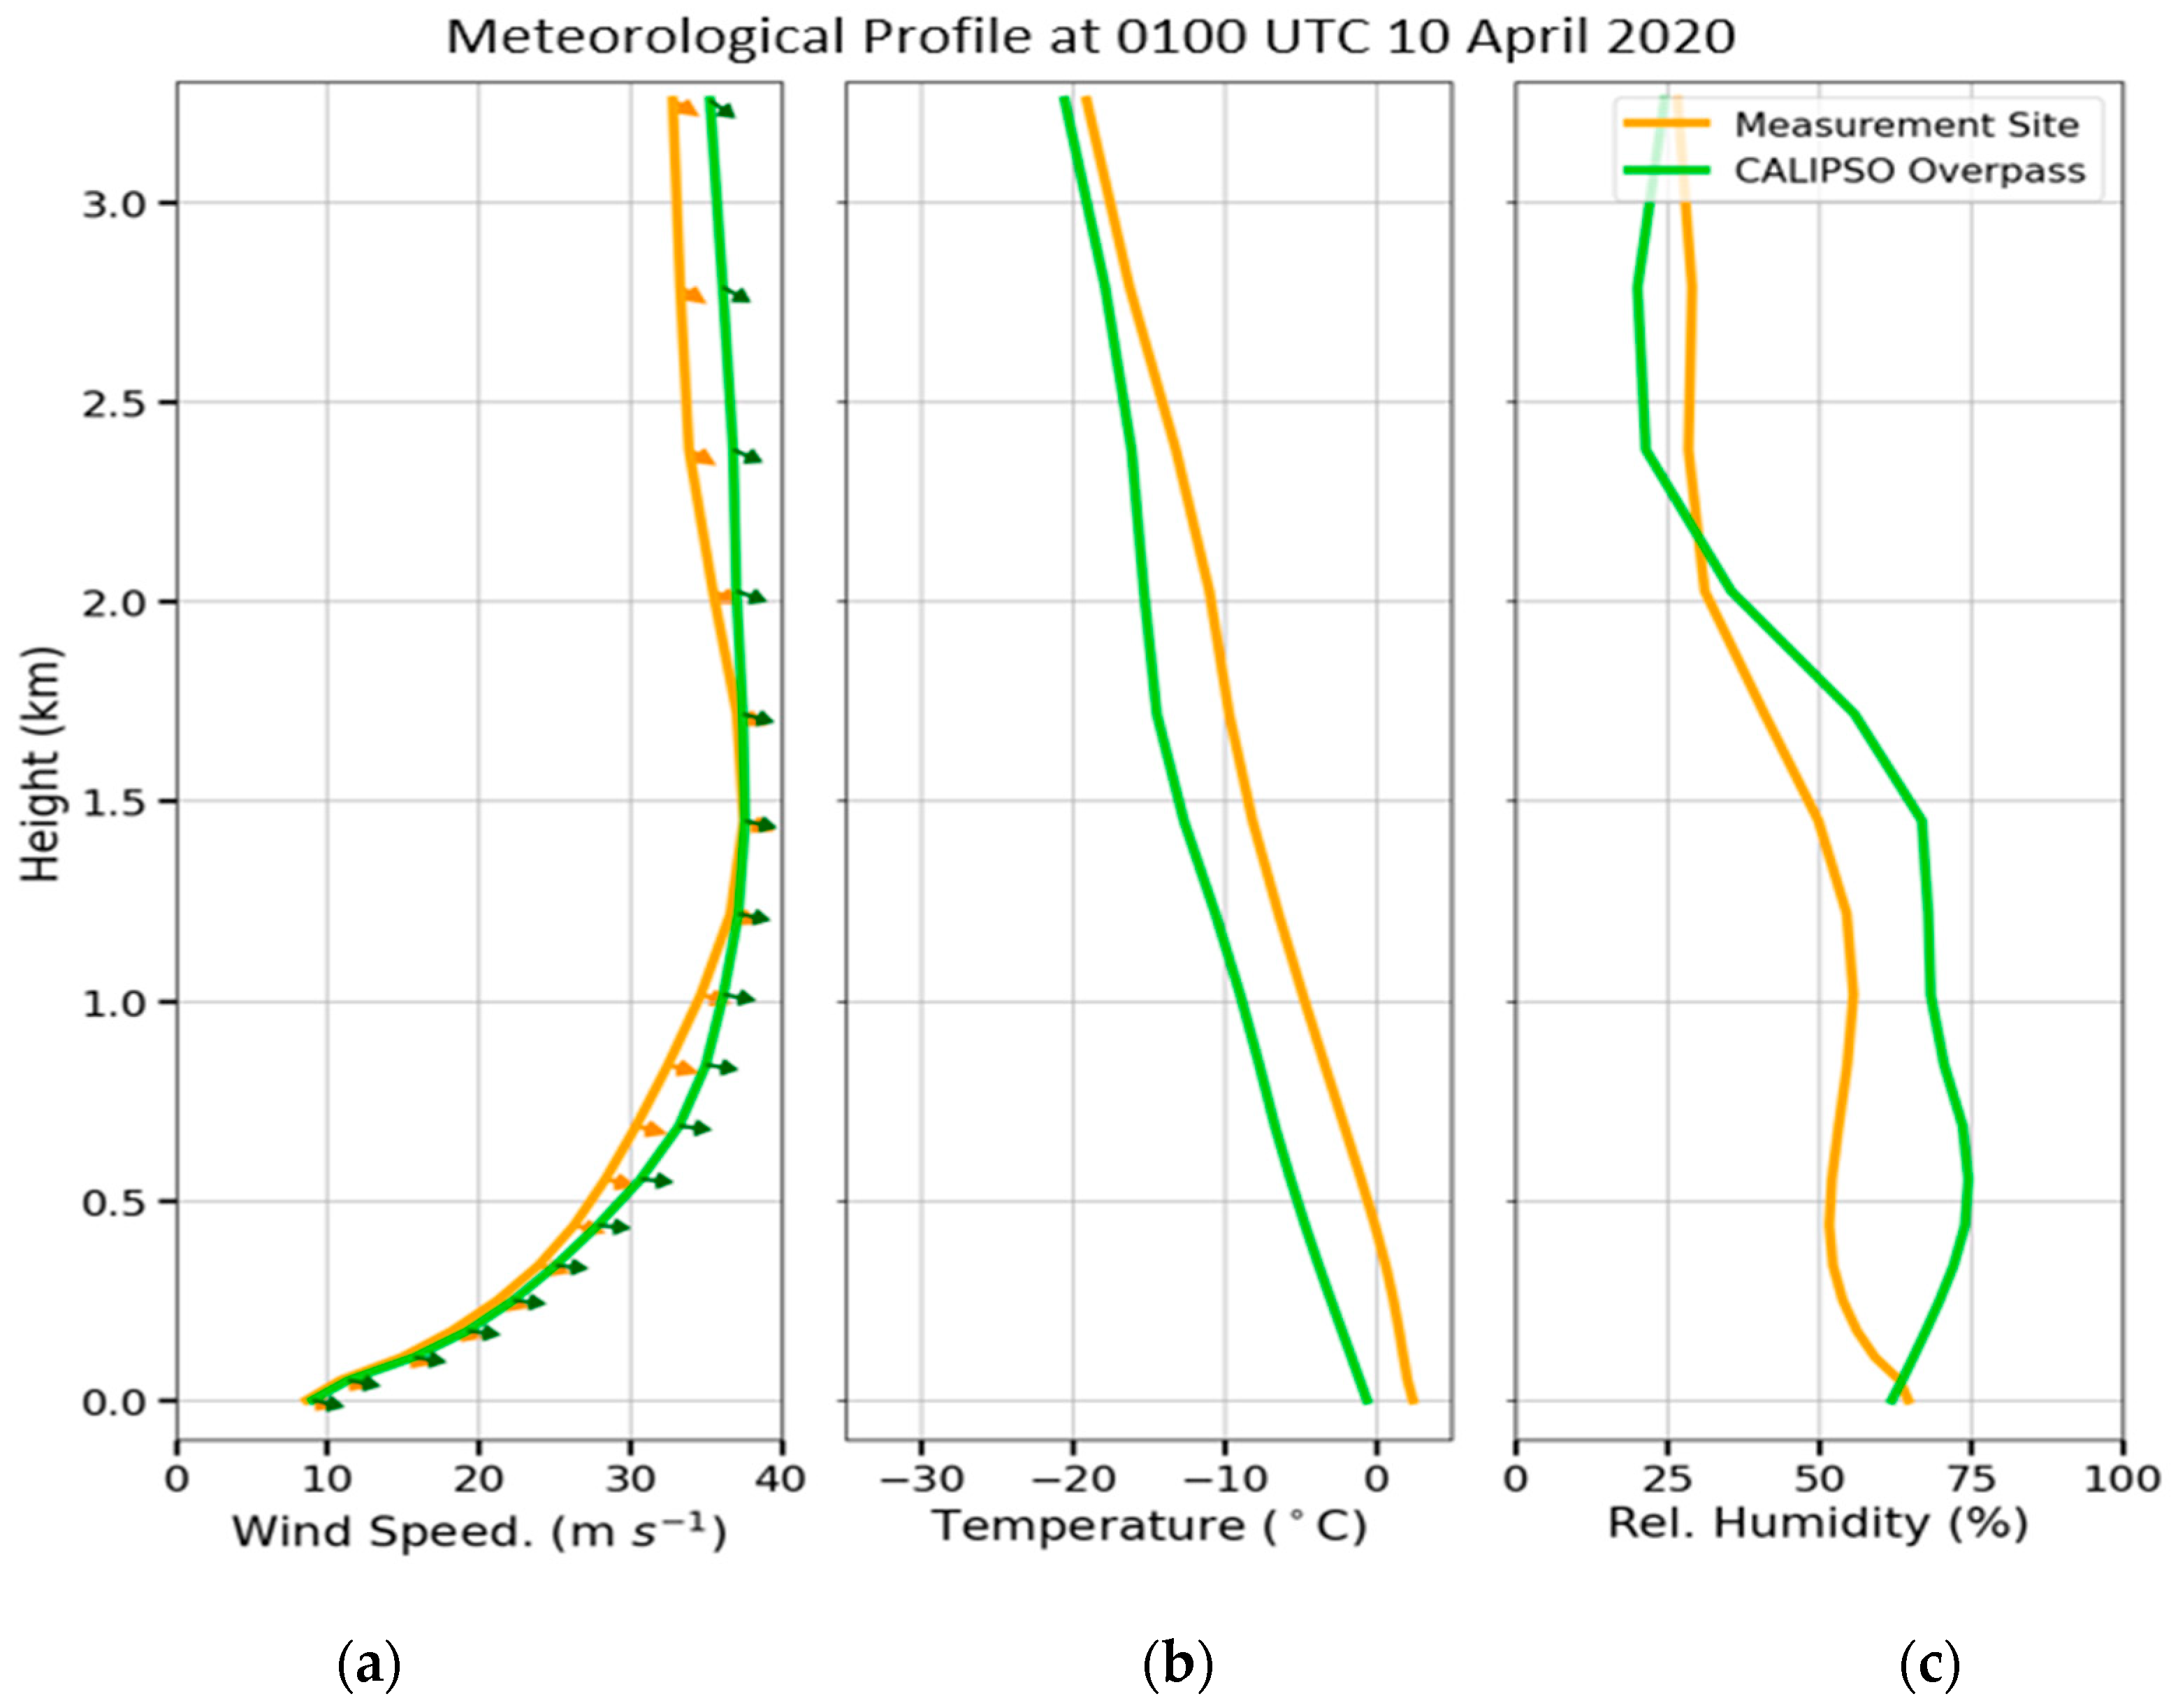
3.3. Case Study in Thessaloniki: 10 April 2020

On 9 April 2020, the presence of Alnus, Betula, Carpinus, Cupressaceae, Oleaceae, Pinaceae, Plantago, Platanus, Populus, Quercus, and Urticaceae was evident according to the sampler (Figure 14). The air pollen concentration exceeded the value of 500 grains m−3 between 5 and 7 UTC, where the prevailing pollen types were Platanus, contributing 83% to the total pollen concentration. In the next 4 h, pollen concentration decreased and reached its highest value of 549 grains m−3 within the period from 21–23 UTC. At that time, Carpinus dominated at a rate of 87%. From 23 UTC on 9 April 2020 to 01 UTC on 10 April 2020, total pollen concentration was measured at 464 grains m−3 while two dominant pollen types were found; Carpinus and Platanus, accounting for 76% and 15%, respectively.
CALIPSO passed on the 10th of April northwest of Thessaloniki at a minimum distance of 140.5 km at 01:01:38 UTC, characterized the IGBP surface type as cropland, and showed the existence of an aerosol layer between 0.711 and 2.777 km. Long-range transport from higher altitudes is ruled out, as shown in Figure A5 and Figure A6. The CALIPSO Feature Mask Product recognized the aerosols as polluted dust (Figure 15). Feature optical depth was found to be equal to 0.105 ± 0.044 at 532 nm and 0.039 ± 0.035 at 1064 nm. Mean values of the backscatter coefficient within the observed layer were found equal to 0.095 × 10⁻² ± 0.032 × 10⁻² km−1·sr−1 at 532 and 0.042 × 10⁻² ± 0.023 × 10⁻² km−1·sr−1 at 1064 nm (Figure 16). The mean Ångström exponent was calculated at 1.13. The color ratio ranged from 0.124 up to 1.217, with a mean of 0.456 ± 0.284, showing the existence of relatively large particles. The mean depolarization ratio was found to equal 8.96 ± 6.87%, indicating the existence of non-spherical particles.
The air mass trajectory analysis showed north flows and thus confirmed no Saharan dust transportation. The RAMS/ICLAMS simulations of sea-salt and dust mass concentration are presented in Figure 17. At ground level, dust mass concentration did not exceed the value of 3 µg·m−3 in the first 0.2 km, while it is evident that dust particles were not observed between 0.2 and 5 km. Moreover, the sea-salt concentration was only 0.2 µg·m−3 near the land surface and already zeroed out at 0.2 km. Thus, it is obvious that the large particles recognized by CALIPSO were neither dust nor marine. The trap detected the presence of pollen at near-ground level; however, it is not unexpected that the aerosol layer extends to higher altitudes, as pollen is commonly observed beyond just the surface level. The presence of pollen high in the atmosphere and its non-linear relationship with height have been demonstrated in previous investigations in the study area of Thessaloniki [12]. Surface and upper-level winds appeared to intensify, with the vertical distribution of wind speed exhibiting a logarithmic profile (Figure 18). Air temperature decreased with height suggesting unstable stratified conditions. These meteorological conditions can be associated with the vertical and horizontal transport of air in the first kilometers from the ground. Water vapor content did not manifest significant variability with height up to the first 1.5 km above ground with relative humidity values placed within the range of 50–75%. Therefore, the observed aerosol layer recognized by CALIPSO was probably misclassified as polluted dust and should be attributed to Carpinus and Platanus.

4. Discussion

In the first case (12 March 2021), the identification of CALIPSO aerosol type as marine and dusty marine led to low lidar ratios. Small color ratio values of 0.652 are indicative of relatively large particles which according to our simulations are not dusty marine nor marine aerosols. The Hirst-type sampler in Athens at that date confirmed the presence of Pinaceae and Cupressaceae grains. The depolarization ratio was equal to 8.70%, indicating non-spherical pollen aerosols mixed with anthropogenic particles.
In both cases involving Thessaloniki, dust was incorporated into the CALIPSO characterization of aerosol particles. In the case of Cupressaceae, the aerosol layer exhibited the smallest thickness among all cases, while CALIPSO highlighted the uncertainty in classifying the aerosol as dust. In the case of ‘Carpinus/Platanus’, the aerosol layer was at higher heights and had the largest geometrical depth of 2.1 km, characterized by CALIPSO as polluted dust. Aerosols identified as polluted cannot be dismissed given the urban nature of the study area. However, the presence of Saharan dust was verified neither by HYSPLIT nor by the RAMS/ICLAMS model. The aerosol layers were misclassified as dust due to the relatively large and depolarizing particles, which should be attributed to the existence of pollen particles.
Similar mean depolarization ratio values were found for both the ‘Pinaceae/Cupressaceae’ and ‘Carpinus/Platanus’ pollen cases. When the predominant type of pollen was Cupressaceae, the largest depolarization ratio of 28.30% was recorded. The color ratio values within the planetary boundary layer indicated similar size ranges for all pollen types observed. The high margin of error in the depolarization ratio and color ratio is mainly due to instrument noise, multiple scattering, aerosol mixing, and assumptions made in the retrieval process. These factors naturally introduce variability in the measurements and are common challenges in satellite-based lidar observations.
Other pollen studies have reported larger depolarization ratio values compared to our study. For example, the depolarization ratio at 532 nm of pure Pinaceae pollen was found to equal 36%, while for the intense pine pollen period, this value was calculated much lower at 14 ± 6% [63]. For the same pollen type, a laboratory study in Virginia [79] reported a depolarization ratio of 41%, while another laboratory study [80], found that pure Pine and Cypress pollen depolarize at 41.3% and 39.8%, respectively. As the value of the depolarization ratio in the presence of non-spherical or inhomogeneous particles depends on the amount of particles, the complexity of the particle shape (including its orientation), and the particle size relative to the wavelength, can greatly fluctuate depending on the aerosol population. Therefore, both the amount and the relative share of pollen compared with the rest of the aerosols in the volume have to be considered.
However, in the urban cities of Thessaloniki and Athens, the presence of pollen particles may significantly change the optical properties of the observed layers. Previous studies showed that Ångström exponent values greater than 2 indicate small particles associated with combustion byproducts, whereas Ångström exponent values less than 1 indicate large particles like sea salt and dust [81]. Generally, pollen grains are quite big and thus can be assumed to be wavelength-independent on the backscatter at wavelengths of 355 nm and 532 nm. Mean columnar values of the Ångström exponent between 355 and 532 nm were equal to 1.7 in the boundary layer during spring for polluted continental particles [82]. Our reported Ångström exponent values were quite smaller (0.62, 0.65, and 1.13 for the pollen cases of ’Pinaceae/Cupressaceae’, ’Cupressaceae’, and ‘Carpinus/Platanus’, respectively), affected by the presence of large pollen aerosols. Furthermore, the depolarization ratio distinguishes spherical particles (low values) from non-spherical ones (high values). The mean depolarization values for polluted continental aerosols are reported to be less than 3.5% according to the three classification methods applied in Mylonaki et al. (2021) [83]. Specifically, the lowest depolarization value was recorded at 2.3% using the neural network aerosol typing algorithm (NAT). The Mahalanobis distance automatic aerosol type classification (MD) resulted in a depolarization value of 2.7%, while the Source Classification Analysis (SCAN) method provided a depolarization value of 3.3%. These values suggest a minimal degree of depolarization, which aligns with the properties of spherical or near-spherical aerosol particles commonly observed in polluted continental settings. For the three above pollen cases, the corresponding depolarization ratio values were found to be 8.70%, 28.30%, and 8.96% respectively, so these higher depolarization values indicate the presence of pollen in the urban environment.

5. Conclusions

The influence of pollen particles on the optical properties within the lowest part of the atmosphere of two urban cities in Greece was examined. Vertically retrieved optical properties by CALIPSO were investigated in the case of three selected events over Athens and Thessaloniki with documented high pollen concentrations.
The meteorological conditions favored pollen dispersion over long distances. Since dust particles significantly depolarize radiation, CALIPSO classified the detected aerosol layers as either pure or mixed dust. Collaborative tools, such as the HYSPLIT backward trajectories and RAMS/ICLAMS model, were used to exclude the presence of other depolarizing aerosol particles, like dust which is a common phenomenon in Greece. Through abductive reasoning, we have concluded that CALIPSO’s layers are misclassified, and their optical retrieved properties have been affected by the presence of pollen within the layers. The results indicate relatively large particles of non-spherical shape, corresponding to the mean optical values of urban aerosol particles with the presence of pollen in Greece.
During the high pollen season and given the absence of other large particles, space-borne lidars are able to identify the presence of pollen. Due to the urban background of the study areas, the aerosol particles cannot be classified as pure pollen. The influence of urban particles in reducing the depolarization ratio is anticipated in all three cases. To our knowledge, this is the first time CALIPSO profiles were used to characterize aerosols in the presence of high pollen concentrations. The CALIPSO Feature Mask classification algorithm does not include pollen among the recognized types of aerosols; thus, the aerosol type may not be correctly characterized in the cases of pollen episodes.

Author Contributions

A.K. analyzed CALIPSO Aerosol Layer Product, combined model simulations and pollen measurements with CALIPSO observation, and wrote the article. E.G. developed the methodology. C.S. performed the model simulation RAMS/ICLAMS. X.S. performed the SILAM simulations. A.K., T.G., E.M. and V.A. performed the CALIPSO Aerosol Profile data analysis. I.P., M.-C.G., A.C., D.V. and A.D. performed atmospheric pollen measurements. All authors participated in scientific discussions on this study and reviewed and edited the article during its preparation process. All authors have read and agreed to the published version of the manuscript.

Funding

The research work was supported by the Hellenic Foundation for Research and Innovation (H.F.R.I.) under the “Basic Research Financing (Horizontal support for all Sciences), National Recovery and Resilience Plan (Greece 2.0)” (Project Acronym: SCOPE, Project Number: 015144). Part of the research was supported by the Hellenic Foundation for Research and Innovation (H.F.R.I.) under the “3rd Call for H.F.R.I. Research Projects to support Post-Doctoral Researchers” (Project Acronym: REVEAL, Project Number: 07222), by the PANGEA4CalVal project (Grant Agreement 101079201) funded by the European Union, and by the CERTAINTY project (Grant Agreement No 101137680) funded by the Horizon Europe programme. No funds to cover publication costs were received.

Institutional Review Board Statement

Not applicable.

Informed Consent Statement

Not applicable.

Data Availability Statement

All data are available upon request from the authors.

Acknowledgments

We thank the CALIPSO (Cloud-Aerosol Lidar and Infrared Pathfinder Satellite Observations) team for making the data freely available on the website (https://asdc.larc.nasa.gov/project/CALIPSO, accessed on 16 January 2025). We are also grateful to the NOAA (National Oceanic and Atmospheric Administration) HYSPLIT (HYbrid Single-Particle Lagrangian Integrated Trajectory) model team for trajectory retrieval (https://www.ready.noaa.gov/hypub-bin/trajtype.pl?runtype=archive, accessed on 16 January 2025).

Conflicts of Interest

The authors declare no conflicts of interest.

Appendix A

Figure A1. CALIPSO Feature Type (a) and Aerosol Subtype (b) on the 12th of March 2021 in Athens.
Atmosphere 16 00317 g0a1
Figure A2. Profile of backscatter coefficient at 532 nm (a) and 1064 nm (b), and profile of depolarization ratio (c) on the 12th of March 2021 in Athens.
Atmosphere 16 00317 g0a2aAtmosphere 16 00317 g0a2b
Figure A3. CALIPSO Feature Type (a) and Aerosol Subtype (b) on the 2nd of March 2020 in Thessaloniki.
Atmosphere 16 00317 g0a3
Figure A4. Profile of backscatter coefficient at 532 nm (a) and 1064 nm (b), and profile of depolarization ratio (c) on the 2nd of March 2020 in Thessaloniki.
Atmosphere 16 00317 g0a4aAtmosphere 16 00317 g0a4b
Figure A5. CALIPSO Feature Type (a) and Aerosol Subtype (b) on the 10th of April 2020 in Thessaloniki.
Atmosphere 16 00317 g0a5
Figure A6. Profile of backscatter coefficient at 532 nm (a) and 1064 nm (b), and profile of depolarization ratio (c) on the 10th of April 2020 in Thessaloniki.
Atmosphere 16 00317 g0a6

References

  1. IPCC: Climate Change. The Physical Science Basis. In Contribution of Working Group I to the Fifth Assessment Report of the Intergovernmental Panel on Climate Change; Stocker, T.F., Qin, D., Plattner, G.K., Tignor, M., Allen, S.K., Boschung, J., Nauels, A., Xia, Y., Bex, V., Midgley, P.M., Eds.; Cambridge University Press: Cambridge, UK, 2013. [Google Scholar] [CrossRef]
  2. WHO. World Health Report. A Vision for Global Health, Shaping the Future; World Health Organization: Geneva, Switzerland, 2003. [Google Scholar]
  3. Bousquet, J.; Khaltaev, N.; Cruz, A.A.; Denburg, J.; Fokkens, W.J.; Togias, A.; Zuberbier, T.; Baena-Cagnani, C.E.; Canonica, G.W.; Van Weel, C.; et al. Allergic Rhinitis and its Impact on Asthma (ARIA). Allergy 2008, 63, 8–160. [Google Scholar] [CrossRef]
  4. Gisler, A.; Eeftens, M.; de Hoogh, K.; Vienneau, D.; Salem, Y.; Yammine, S.; Jakob, J.; Gorlanova, O.; Decrue, F.; Gehrig, R.; et al. Pollen exposure is associated with risk of respiratory symptoms during the first year of life. Allergy 2022, 77, 3606–3616. [Google Scholar] [CrossRef] [PubMed]
  5. Larson, P.S.; Steiner, A.L.; O’Neill, M.S.; Baptist, A.P.; Gronlund, C.J. Chronic and infectious respiratory mortality and short-term exposures to four types of pollen taxa in older adults in Michigan, 2006–2017. BMC Public Health 2025, 25, 173. [Google Scholar] [CrossRef] [PubMed]
  6. Wisgrill, L.; Fyhrquist, N.; Ndika, J.; Paalanen, L.; Berger, A.; Laatikainen, T.; Karisola, P.; Haahtela, T.; Alenius, H. Bet v 1 triggers antiviral-type immune signalling in birch-pollen-allergic individuals. Clin. Exp. Allergy 2022, 52, 929–941. [Google Scholar] [CrossRef] [PubMed]
  7. Tossavainen, T.; Martikainen, M.-V.; Loukola, H.; Roponen, M. Common Pollen Modulate Immune Responses against Viral-Like Challenges in Airway Coculture Model. J. Immunol. Res. 2023, 2023, 639092. [Google Scholar] [CrossRef]
  8. Schmidt, C.W. Pollen Overload: Seasonal Allergies in a Changing Climate. Environ. Health Perspect. 2016, 124, A70–A75. [Google Scholar] [CrossRef]
  9. Lake, I.R.; Jones, N.R.; Agnew, M.; Goodess, C.M.; Giorgi, F.; Hamaoui-Laguel, L.; Semenov, M.A.; Solomon, F.; Storkey, J.; Vautard, R.; et al. Erratum: “Climate Change and Future Pollen Allergy in Europe. Environ. Health Perspect. 2018, 126, 079002. [Google Scholar] [CrossRef]
  10. Rousseau, D.D.; Schevin, P.; Ferrier, J.; Jolly, D.; Andreasen, T.; Ascanius, S.E.; Hendriksen, S.E.; Poulsen, U. Long-distance pollen transport from North America to Greenland in spring. J. Geophys. Res. Biogeosciences 2008, 113, G02013. [Google Scholar] [CrossRef]
  11. Skjøth, C.A.; Sommer, J.; Stach, A.; Smith, M.; Brandt, J. The long-range transport of birch (Betula) pollen from Poland and Germany causes significant pre-season concentrations in Denmark. Clin. Exp. Allergy 2007, 37, 1204–1212. [Google Scholar] [CrossRef]
  12. Damialis, A.; Kaimakamis, E.; Konoglou, M.; Akritidis, I.; Traidl-Hoffmann, C.; Gioulekas, D. Estimating the abundance of airborne pollen and fungal spores at variable elevations using an aircraft: How high can they fly? Sci. Rep. 2017, 7, 44535. [Google Scholar] [CrossRef]
  13. Szczepanek, K.; Myszkowska, D.; Worobiec, E.; Piotrowicz, K.; Ziemianin, M.; Bielec-Bąkowska, Z. The long-range transport of Pinaceae pollen: An example in Kraków (southern Poland). Aerobiologia 2017, 33, 109–125. [Google Scholar] [CrossRef] [PubMed]
  14. Bayr, D.; Plaza, M.P.; Gilles, S.; Kolek, F.; Leier-Wirtz, V.; Traidl-Hoffmann, C.; Damialis, A. Pollen long-distance transport associated with symptoms in pollen allergics on the German Alps: An old story with a new ending? Sci. Total Environ. 2023, 881, 163310. [Google Scholar] [CrossRef]
  15. Mandrioli, P.; Negrini, M.G.; Cesari, G.; Griffith, M. Evidence for long range transport of biological and anthropogenic aerosol particles in the atmosphere. Grana 1984, 23, 43–52. [Google Scholar] [CrossRef]
  16. von Blohn, N.; Mitra, S.K.; Diehl, K.; Borrmann, S. The ice nucleating ability of pollen: Part III: New laboratory studies in immersion and contact freezing modes including more pollen types. Atmos. Res. 2005, 78, 182–189. [Google Scholar] [CrossRef]
  17. Diehl, K.; Quick, C.; Matthias-Maser, S.; Mitra, S.K.; Jaenicke, R. The ice nucleating ability of pollen Part I: Laboratory studies in deposition and condensation freezing modes. Atmos. Res. 2001, 58, 75–87. [Google Scholar] [CrossRef]
  18. Diehl, K.; Matthias-Maser, S.; Jaenicke, R.; Mitra, S.K. The ice nucleating ability of pollen: Part II. Laboratory studies in immersion and contact freezing modes. Atmos. Res. 2002, 61, 125–133. [Google Scholar] [CrossRef]
  19. Griffiths, P.T.; Borlace, J.S.; Gallimore, P.J.; Kalberer, M.; Herzog, M.; Pope, F.D. Hygroscopic growth and cloud activation of pollen: A laboratory and modeling study. Atmos. Sci. Lett. 2012, 13, 289–295. [Google Scholar] [CrossRef]
  20. Pope, F.D. Pollen grains are efficient cloud condensation nuclei. Environ. Res. Lett. 2010, 5, 044015. [Google Scholar] [CrossRef]
  21. Steiner, A.L.; Brooks, S.D.; Deng, C.; Thornton, D.C.O.; Pendleton, M.W.; Bryant, V. Pollen as atmospheric cloud condensation nuclei. Geophys. Res. Lett. 2015, 42, 3596–3602. [Google Scholar] [CrossRef]
  22. PalDat—A Palynological Database (2000 Onwards). Available online: https://www.paldat.org (accessed on 16 February 2025).
  23. Buters, J.T.M.; Antunes, C.; Galveias, A.; Bergmann, K.C.; Thibaudon, M.; Galán, C.; Schmidt-Weber, C.; Oteros, J. Pollen and spore monitoring in the world. Clin. Transl. Allergy 2018, 8, 9. [Google Scholar] [CrossRef]
  24. Dwarakanath, D.; Milic, A.; Beggs, P.; Wraith, D.; Davies, J. A global survey addressing sustainability of pollen monitoring. World Allergy Organ. J. 2024, 17, 100997. [Google Scholar] [CrossRef]
  25. Hirst, J.M. An automatic volumetric spore trap. Ann. Appl. Biol. 1952, 39, 157–293. [Google Scholar] [CrossRef]
  26. Holt, K.A.; Bennett, K.D. Principles and methods for automated palynology. New Phytol. 2014, 203, 735–742. [Google Scholar] [CrossRef]
  27. Weber, R.W. Pollen Identification. Ann. Allergy Asthma Immunol. 1998, 80, 141–148. [Google Scholar] [CrossRef]
  28. Gabey, A.M.; Gallagher, M.W.; Whitehead, J.; Dorsey, J.R.; Kaye, P.H.; Stanley, W.R. Measurements and comparison of primary biological aerosol above and below a tropical forest canopy using a dual channel fluorescence spectrometer. Atmos. Chem. Phys. 2010, 10, 4453–4466. [Google Scholar] [CrossRef]
  29. Savage, N.J.; Krentz, C.E.; Könemann, T.; Han, T.T.; Mainelis, G.; Pöhlker, C.; Huffman, J.A. Systematic characterization and fluorescence threshold strategies for the wideband integrated bioaerosol sensor (WIBS) using size-resolved biological and interfering particles. Atmos. Meas. Tech. 2017, 10, 4279–4302. [Google Scholar] [CrossRef]
  30. Šauliene, I.; Šukiene, L.; Daunys, G.; Valiulis, G.; Vaitkevicius, L.; Matavulj, P.; Brdar, S.; Panic, M.; Sikoparija, B.; Clot, B.; et al. Automatic pollen recognition with the Rapid-E particle counter: The first-level procedure, experience and next steps. Atmos. Meas. Tech. 2019, 12, 3435–3452. [Google Scholar] [CrossRef]
  31. Oteros, J.; Pusch, G.; Weichenmeier, I.; Heimann, U.; Möller, R.; Röseler, S.; Traidl-Hoffmann, C.; Schmidt-Weber, C.; Buters, J.T.M. Automatic and Online Pollen Monitoring. Int. Arch. Allergy Imm. 2015, 167, 158–166. [Google Scholar] [CrossRef]
  32. Sauvageat, E.; Zeder, Y.; Auderset, K.; Calpini, B.; Clot, B.; Crouzy, B.; Konzelmann, T.; Lieberherr, G.; Tummon, F.; Vasilatou, K. Real-time pollen monitoring using digital holography. Atmos. Meas. Tech. 2020, 13, 1539–1550. [Google Scholar] [CrossRef]
  33. Miki, K.; Kawashima, S. Estimation of pollen counts from light scattering intensity when sampling multiple pollen taxa—Establishment of an automated multi-taxa pollen counting estimation system (AME system). Atmos. Meas. Tech. 2021, 14, 685–693. [Google Scholar] [CrossRef]
  34. Bohlmann, S.; Shang, X.; Giannakaki, E.; Filioglou, M.; Saarto, A. Detection and characterization of birch pollen in the atmosphere using a multiwavelength Raman polarization lidar and Hirst-type pollen sampler in Finland. Atmos. Chem. Phys. 2019, 19, 14559–14569. [Google Scholar] [CrossRef]
  35. Noh, Y.M.; Müller, D.; Lee, H.; Choi, T.J. Influence of biogenic pollen on optical properties of atmospheric aerosols observed by lidar over Gwangju, South Korea. Atmos. Environ. 2013, 69, 139–147. [Google Scholar] [CrossRef]
  36. Noh, Y.M.; Lee, H.; Mueller, D.; Lee, K.; Shin, D.; Shin, S.; Choi, T.J.; Choi, Y.J.; Kim, K.R. Investigation of the diurnal pattern of the vertical distribution of pollen in the lower troposphere using LIDAR. Atmos. Chem. Phys. 2013, 13, 7619–7629. [Google Scholar] [CrossRef]
  37. Sassen, K. Boreal tree pollen sensed by polarization lidar: Depolarizing biogenic chaff. Geophys. Res. Lett. 2008, 35, L18810. [Google Scholar] [CrossRef]
  38. Sicard, M.; Izquierdo, R.; Alarcón, M.; Belmonte, J.; Comerón, A.; Baldasano, J.M. Near-surface and columnar measurements with a micro pulse lidar of atmospheric pollen in Barcelona, Spain. Atmos. Chem. Phys. 2016, 16, 6805–6821. [Google Scholar] [CrossRef]
  39. Bohlmann, S.; Shang, X.; Vakkari, V.; Giannakaki, E.; Leskinen, A.; Lehtinen, K.E.J.; Pätsi, S.; Komppula, M. Lidar depolarization ratio of atmospheric pollen at multiple wavelengths. Atmos. Chem. Phys. 2021, 21, 7083–7097. [Google Scholar] [CrossRef]
  40. Mona, L.; Liu, Z.; Müller, D.; Omar, A.; Papayannis, A.; Pappalardo, G.; Sugimoto, N.; Vaughan, M. Lidar measurements for desert dust characterization: An overview. Adv. Meteorol. 2012, 36, 356265. [Google Scholar] [CrossRef]
  41. Guo, J.; Lou, M.; Miao, Y.; Wang, Y.; Zeng, Z.; Liu, H.; He, J.; Xu, H.; Wang, F.; Min, M.; et al. Trans-Pacific transport of dust aerosols from East Asia: Insights gained from multiple observations and modeling. Environ. Pol. 2017, 230, 1030–1039. [Google Scholar] [CrossRef]
  42. Senghor, H.; Machu, É.; Hourdin, F.; Gaye, A.T. Seasonal cycle of desert aerosols in western Africa: Analysis of the coastal transition with passive and active sensors. Atmos. Chem. Phys. 2017, 17, 8395–8410. [Google Scholar] [CrossRef]
  43. Wu, Y.; Han, Y.; Voulgarakis, A.; Wang, T.; Li, M.; Wang, Y.; Xie, M.; Zhuang, B.; Li, S. An agricultural biomass burning episode in eastern China: Transport, optical properties, and impacts on regional air quality. J. Geophys. Res.-Atmos. 2017, 122, 2304–2324. [Google Scholar] [CrossRef]
  44. Song, Q.; Zhang, Z.; Yu, H.; Ginoux, P.; Shen, J. Global dust optical depth climatology derived from CALIOP and MODIS aerosol retrievals on decadal timescales: Regional and interannual variability. Atmos. Chem. Phys. 2021, 21, 13369–13395. [Google Scholar] [CrossRef]
  45. Gui, L.; Tao, M.; Wang, Y.; Wang, L.; Chen, L.; Lin, C.; Tao, J.; Wang, J.; Yu, C. Climatology of aerosol types and their vertical distribution over East Asia based on CALIPSO lidar measurements. Int. J. Climatol. 2022, 42, 6042–6054. [Google Scholar] [CrossRef]
  46. Banerjee, T.; Anchule, A.; Sorek-Hamer, M.; Latif, M.T. Vertical stratification of aerosols over South Asian cities. Environ. Pollut. 2022, 309, 119776. [Google Scholar] [CrossRef] [PubMed]
  47. Shukurov, K.A.; Simonenkov, D.V.; Nevzorov, A.V.; Rashki, A.; Hamzeh, N.H.; Abdullaev, S.F.; Shukurova, L.M.; Chkhetiani, O.G. CALIOP-Based Evaluation of Dust Emissions and Long-Range Transport of the Dust from the Aral−Caspian Arid Region by 3D-Source Potential Impact (3D-SPI) Method. Remote Sens. 2023, 15, 2819. [Google Scholar] [CrossRef]
  48. Kudo, R.; Higurashi, A.; Oikawa, E.; Fujikawa, M.; Ishimoto, H.; Nishizawa, T. Global 3-D distribution of aerosol composition by synergistic use of CALIOP and MODIS observations. Atmos. Meas. Tech. 2023, 16, 3835–3863. [Google Scholar] [CrossRef]
  49. Richardson, S.C.; Mytilinaios, M.; Foskinis, R.; Kyrou, C.; Papayannis, A.; Pyrri, I.; Giannoutsou, E.; Adamakis, I.D. Bioaerosol detection over Athens, Greece using the laser induced fluorescence technique. Sci. Total Environ. 2019, 696, 133906. [Google Scholar] [CrossRef]
  50. Apostolou, E.K.; Yannitsaros, A.G. Atmospheric pollen in the area of Athens. Acta Allergol. 1977, 32, 109–117. [Google Scholar] [CrossRef]
  51. Gioulekas, D.; Balafoutis, C.; Damialis, A.; Papakosta, D.; Gioulekas, G.; Patakas, D. Fifteen years’ record of airborne allergenic pollen and meteorological parameters in Thessaloniki, Greece. Int. J. Biometeorol. 2004, 48, 128–136. [Google Scholar] [CrossRef]
  52. ELSTAT: Resident Population Census. Hellenic Statistical Authority. 2021. Available online: https://elstat-outsourcers.statistics.gr/census_results_2022_en.pdf (accessed on 16 January 2025).
  53. Pielke, R.A.; McNider, R.T.; Segal, M.; Mahrer, Y. The use of a mesoscale numerical model for evaluations of pollutant transport and diffusion in coastal regions and over irregular terrain. Bull. Am. Meteorol. Soc. 1983, 64, 243–249. [Google Scholar] [CrossRef]
  54. Kassomenos, P.; Kotroni, V.; Kallos, G. Analysis of climatological and air quality observations from Greater Athens Area. Atmos. Environ. 1995, 29, 3671–3688. [Google Scholar] [CrossRef]
  55. Drosoglou, T.; Koukouli, M.E.; Raptis, I.P.; Kazadzis, S.; Pseftogkas, A.; Eleftheratos, K.; Zerefos, C. Nitrogen dioxide spatiotemporal variations in the complex urban environment of Athens, Greece. Atmos. Environ. 2023, 314, 120115. [Google Scholar] [CrossRef]
  56. Pateraki, S.; Fameli, K.M.; Assimakopoulos, V.; Bairachtari, K.; Zagkos, A.; Stavraka, T.; Bougiatioti, A.; Maggos, T.; Mihalopoulos, N. Differentiation of the Athens Fine PM Profile during Economic Recession (March of 2008 Versus March of 2013): Impact of Changes in Anthropogenic Emissions and the Associated Health Effect. Atmosphere 2020, 11, 1121. [Google Scholar] [CrossRef]
  57. Varotsos, C.; Ondov, J.; Efstathiou, M. Scaling properties of air pollution in Athens, Greece and Baltimore, Maryland. Atmos. Environ. 2005, 39, 4041–4047. [Google Scholar] [CrossRef]
  58. Economopoulou, A.A.; Economopoulos, A.P. Air Pollution in Athens Basin and Health Risk Assessment. Environ. Monit. Assess. 2002, 80, 277–299. [Google Scholar] [CrossRef]
  59. Touloumi, G.; Samoli, E.; Katsouyanni, K. Daily mortality and “winter type” air pollution in Athens, Greece—A time series analysis within the APHEA project. J. Epidemiol. Community Health 1996, 50 (Suppl. S1), S47–S51. [Google Scholar] [CrossRef]
  60. Flocas, H.; Kelessis, A.; Helmis, C.; Petrakakis, M.; Zoumakis, M.; Pappas, K. Synoptic and local scale atmospheric circulation associated with air pollution episodes in an urban Mediterranean area. Theor. Appl. Climatol. 2009, 95, 265–277. [Google Scholar] [CrossRef]
  61. Helmis, C.G.; Tombrou, M.; Asimakopoulos, D.N.; Soilemes, A.; Güsten, H.; Moussiopoulos, N.; Hatzaridou, A. Thessaloniki 91 field measurement campaign. I. Wind field and atmospheric boundary layer structure over greater Thessaloniki area under light background flow. Atmos. Environ. 1997, 31, 1101–1114. [Google Scholar] [CrossRef]
  62. Moussiopoulos, N.; Vlachokostas, C.H.; Tsilingiridis, G.; Douros, I.; Hourdakis, E.; Naneris, C.; Sidiropoulos, C. Air quality status in Greater Thessaloniki Area and the emission reductions needed for attaining the EU air quality legislation. Sci. Total Environ. 2009, 407, 1268–1285. [Google Scholar] [CrossRef]
  63. Shang, X.; Giannakaki, E.; Bohlmann, S.; Filioglou, M.; Saarto, A.; Ruuskanen, A. Optical characterization of pure pollen types using a multi-wavelength Raman polarization lidar. Atmos. Chem. Phys. 2020, 20, 15323–15339. [Google Scholar] [CrossRef]
  64. Schwendemann, A.B.; Wang, G.; Mertz, M.L.; McWilliams, R.T.; Thatcher, S.L.; Osborn, J.M. Aerodynamics of saccate pollen and its implications for wind pollination. Am. J. Bot. 2007, 94, 1371–1381. [Google Scholar] [CrossRef]
  65. Akhondnezhad, S.; Nejadsattari, T.; Sattarian, A.; Asri, Y.; Bagheriieh, N.M. Pollen morphology of the genus Carpinus L. (Corylaceae) in Iran. Iran. J. Bot. 2011, 17, 233–237. [Google Scholar] [CrossRef]
  66. Bricchi, E.; Frenguelli, G.; Mincigrucci, G. Experimental results about Platanus pollen deposition. Aerobiologia 2000, 16, 347–352. [Google Scholar] [CrossRef]
  67. Winker, D.M.; Pelon, J.; Coakley, J.A., Jr.; Ackerman, S.A.; Charlson, R.J.; Colarco, P.R.; Flamant, P.; Fu, Q.; Hoff, R.M.; Kittaka, C.; et al. The CALIPSO mission: A global 3D view of aerosols and clouds. Bull. Am. Meteorol. Soc. 2010, 91, 1211–1229. [Google Scholar] [CrossRef]
  68. Vaughan, M.; Powell, K.; Kuehn, R.; Young, S.; Winker, D.; Hostetler, C.; Hunt, W.; Liu, Z.; McGill, M.; Getzewich, B. Fully Automated Detection of Cloud and Aerosol Layers in the CALIPSO Lidar Measurements. J. Atmos. Ocean. Technol. 2009, 26, 2034–2050. [Google Scholar] [CrossRef]
  69. Liu, Z.; Vaughan, M.; Winker, D.; Kittaka, C.; Getzewich, B.; Kuehn, R.; Omar, A.; Powell, K.; Trepte, C.; Hostetler, C. The CALIPSO lidar cloud and aerosol discrimination: Version 2 algorithm and initial assessment 15 of performance. J. Atmos. Ocean. Technol. 2009, 26, 1198–1213. [Google Scholar] [CrossRef]
  70. Omar, A.H.; Winker, D.M.; Kittaka, C.; Vaughan, M.A.; Liu, Z.; Hu, Y.; Trepte, C.R.; Rogers, R.R.; Ferrare, R.A.; Lee, K.P.; et al. The CALIPSO automated aerosol classification and lidar ratio selection algorithm. J. Atmos. Ocean. Technol. 2009, 26, 1994–2014. [Google Scholar] [CrossRef]
  71. Kim, M.; Omar, A.H.; Tackett, J.L.; Vaughan, M.A.; Winker, D.M.; Trepte, C.R.; Hu, Y.; Liu, Z.; Poole, L.R.; Pitts, M.C.; et al. The CALIPSO version 4 automated aerosol classification and lidar ratio selection algorithm. Atmos. Chem. Phys. 2018, 11, 6107–6135. [Google Scholar] [CrossRef]
  72. Draxler, R.R.; Hess, G.D. Description of the HYSPLIT 4 Modeling System; NOAA Technical Memorandum ERL ARL-224; NOAA: Silver Spring, MD, USA, 1997.
  73. Draxler, R.R.; Hess, G.D. An overview of the hysplit_4 modeling system for trajectories, dispersion, and deposition. Aust. Meteorol. Mag. 1998, 47, 295–308. [Google Scholar]
  74. Pielke, R.A.; Cotton, W.R.; Walko, R.L.; Tremback, C.J.; Lyons, W.A.; Grasso, L.D.; Nicholls, M.E.; Moran, M.D.; Wesley, D.A.; Lee, T.J.; et al. A Comprehensive Meteorological Modeling System RAMS, Meteorol. Atmos. Phys. 1992, 49, 69–91. [Google Scholar] [CrossRef]
  75. Solomos, S.; Kallos, G.; Kushta, J.; Astitha, M.; Tremback, C.; Nenes, A.; Levin, Z. An integrated modeling study on the effects of mineral dust and sea salt particles on clouds and precipitation. Atmos. Chem. Phys. 2011, 11, 873–892. [Google Scholar] [CrossRef]
  76. Tsyro, S.; Aas, W.; Soares, W.; Sofiev, M.; Berge, H.; Spindler, G. Modelling of sea salt concentrations over Europe: Key uncertainties and comparison with observations. Atmos. Chem. Phys. 2011, 11, 10367–10388. [Google Scholar] [CrossRef]
  77. Manders, A.M.M.; Schaap, M.; Querol, X.; Albert, M.F.M.A.; Vercauteren, J.; Kuhlbusch, T.A.J.; Hoogerbrugge, R. Sea salt concentrations across the European continent. Atmos. Environ. 2010, 44, 2434–2442. [Google Scholar] [CrossRef]
  78. Gong, S.L.; Barrie, L.A.; Prospero, J.M.; Savoie, D.L.; Ayers, G.P.; Blanchet, J.-P.; Spacek, L. Modeling sea-salt aerosols in the atmosphere: 2. Atmospheric concentrations and fluxes. J. Geophys. Res. 1997, 102, 3819–3830. [Google Scholar] [CrossRef]
  79. Cao, X.; Roy, G.A.; Bernier, R. Lidar polarization discrimination of bioaerosols. Opt. Eng. 2010, 49, 116201. [Google Scholar] [CrossRef]
  80. Cholleton, D.; Rairoux, P.; Miffre, A. Laboratory Evaluation of the (355, 532) nm Particle Depolarization Ratio of Pure Pollen at 180.0° Lidar Backscattering Angle. Remote Sens. 2022, 14, 3767. [Google Scholar] [CrossRef]
  81. Eck, T.F.; Holben, B.N.; Reid, J.S.; Dubovik, O.; Smirnov, A.; O’neill, N.T.; Slutsker, I.; Kinne, S. Wavelength dependence of the optical depth of biomass burning, urban and desert dust aerosols. J. Geophys. Res. 1999, 104, 31333–31350. [Google Scholar] [CrossRef]
  82. Siomos, N.; Balis, D.S.; Voudouri, K.A.; Giannakaki, E.; Filioglou, M.; Amiridis, V.; Papayannis, A.; Fragkos, K. Are EARLINET and AERONET climatologies consistent? The case of Thessaloniki, Greece. Atmos. Chem. Phys. 2018, 18, 11885–11903. [Google Scholar] [CrossRef]
  83. Mylonaki, M.; Giannakaki, E.; Papayannis, A.; Papanikolaou, C.-A.; Komppula, M.; Nicolae, D.; Papagiannopoulos, N.; Amodeo, A.; Baars, H.; Soupiona, O. Aerosol type classification analysis using EARLINET multiwavelength and depolarization lidar observations. Atmos. Chem. Phys. 2021, 21, 2211–2227. [Google Scholar] [CrossRef]
Figure 1. Satellite map of Greece with study areas in Athens and Thessaloniki (Source: Basemap: Esri Imagery, created with ArcGIS Pro 3.4).
Atmosphere 16 00317 g001
Figure 2. Microscopy images of Pinaceae (a), Cupressaceae (b), Carpinus (c), and Platanus (d) pollen grains in their typical form.
Atmosphere 16 00317 g002aAtmosphere 16 00317 g002b
Figure 3. Taxa contributing airborne pollen and their concentration in Athens, on the 12th of March 2021.
Atmosphere 16 00317 g003
Figure 4. CALIPSO Feature Type (a) and Aerosol Subtype (b) on the 12th of March 2021 in Athens.
Atmosphere 16 00317 g004
Figure 5. Profile of backscatter coefficient at 532 nm (a) and 1064 nm (b) and profile of depolarization ratio (c) on the 12th of March 2021 in Athens.
Atmosphere 16 00317 g005aAtmosphere 16 00317 g005b
Figure 6. Four-day backward trajectories at 12:00 UTC on 12 March 2021 in Athens, Greece. The arrival heights are set to 500, 750, and 1000 m (a) and 1250, 1500, and 1750 m (b).
Atmosphere 16 00317 g006
Figure 7. Dust surface mass concentration (a) and simulation of sea-salt (blue line) and dust (red line) mass concentration profiles (b) from RAMS/ICLAMS models for 12 March 2021, 12 UTC.
Atmosphere 16 00317 g007
Figure 8. Simulated wind speed (a), temperature (b), and relative humidity (c) meteorological profile on 12 March 2021, at 12 UTC for Athens Physics Department (orange line) and CALIPSO overpass (green line).
Atmosphere 16 00317 g008
Figure 9. Taxa contributing airborne pollen and their concentration in Thessaloniki on the 2nd of March 2020.
Atmosphere 16 00317 g009
Figure 10. CALIPSO Feature Type (a) and Aerosol Subtype (b) on the 2nd of March 2020 in Thessaloniki.
Atmosphere 16 00317 g010
Figure 11. Profile of backscatter coefficient at 532 nm (a) and 1064 nm (b), and profile of depolarization ratio (c) on the 2nd of March 2020 in Thessaloniki.
Atmosphere 16 00317 g011aAtmosphere 16 00317 g011b
Figure 12. Dust surface mass concentration (a) and simulation of sea-salt (blue line) and dust (red line) mass concentration profiles (b) from RAMS/ICLAMS models on 2 March 2020 at 12 UTC.
Atmosphere 16 00317 g012
Figure 13. Simulated wind speed (a), temperature (b), and relative humidity (c) meteorological profile on 2 March 2020 at 12 UTC for Thessaloniki Biology Department (orange line) and CALIPSO overpass (green line).
Atmosphere 16 00317 g013
Figure 14. Taxa contributing airborne pollen and its concentration in Thessaloniki on the 9th and 10th of April 2020.
Atmosphere 16 00317 g014
Figure 15. CALIPSO Feature Type (a) and Aerosol Subtype (b) on the 10th of April 2020 in Thessaloniki.
Atmosphere 16 00317 g015
Figure 16. Profile of backscatter coefficient at 532 nm (a) and 1064 nm (b), and profile of depolarization ratio (c) on the 10th of April 2020 in Thessaloniki.
Atmosphere 16 00317 g016
Figure 17. Dust surface mass concentration (a) and simulation of sea-salt (blue line) and dust (red line) mass concentration profiles (b) from RAMS/ICLAMS models on 10 April 2020 at 01 UTC.
Atmosphere 16 00317 g017
Figure 18. Simulated wind speed (a), temperature (b), and relative humidity (c) meteorological profile on 10 April 2020 at 01 UTC for Thessaloniki Biology Department (orange line) and CALIPSO overpass (green line).
Atmosphere 16 00317 g018
Table 1. Selected pollen events in Greece during CALIPSO (Cloud-Aerosol Lidar and Infrared Pathfinder Satellite Observations) overpass.
RegionDateTime CALIPSO Overpass (UTC)Max Time Pollen (UTC)Max Total Pollen Concentration (Grains m−3)Dominant PollenType(s)
Athens
(37.97° N, 23.78° E)
12 March 202112:12:4010–12409Pinaceae 69%
Cupressaceae 24%
Thessaloniki
(40.63° N, 22.96° E)
2 March 202012:03:588–10424Cupressaceae 97%
10 April 202001:01:3823 (9/4)–01 (10/4)464Carpinus 76%
Platanus 15%
Table 2. Data from CALIPSO Aerosol Layer and Profile Product for Athens and Thessaloniki.
RegionDateLayer Base Altitude (km)Layer Top Altitude (km)Depolarization Ratio (%)Color RatioFeature Optical Depth 532 nmFeature Optical Depth 1064 nm
Athens
(37.97° N, 23.78° E)
12 March 20210.0831.3708.70 ± 6.260.652 ± 0.1940.047 ± 0.0120.034 ± 0.014
Thessaloniki
(40.63° N, 22.96° E)
2 March 20200.8011.34028.30 ± 14.160.638 ± 0.3620.030 ± 0.0090.019 ± 0.007
10 April 20200.7112.7778.96 ± 6.870.456 ± 0.2840.105 ± 0.0440.039 ± 0.035
Disclaimer/Publisher’s Note: The statements, opinions and data contained in all publications are solely those of the individual author(s) and contributor(s) and not of MDPI and/or the editor(s). MDPI and/or the editor(s) disclaim responsibility for any injury to people or property resulting from any ideas, methods, instructions or products referred to in the content.

