

Climate Change Mitigation Through Forest Quality Enhancement and Socio-Ecological Symbiosis: Evidence from China


Abstract
1. Introduction
1.1. Impact of Forest Land on Economic Development
1.2. Forest Land and Low-Carbon Economic Development
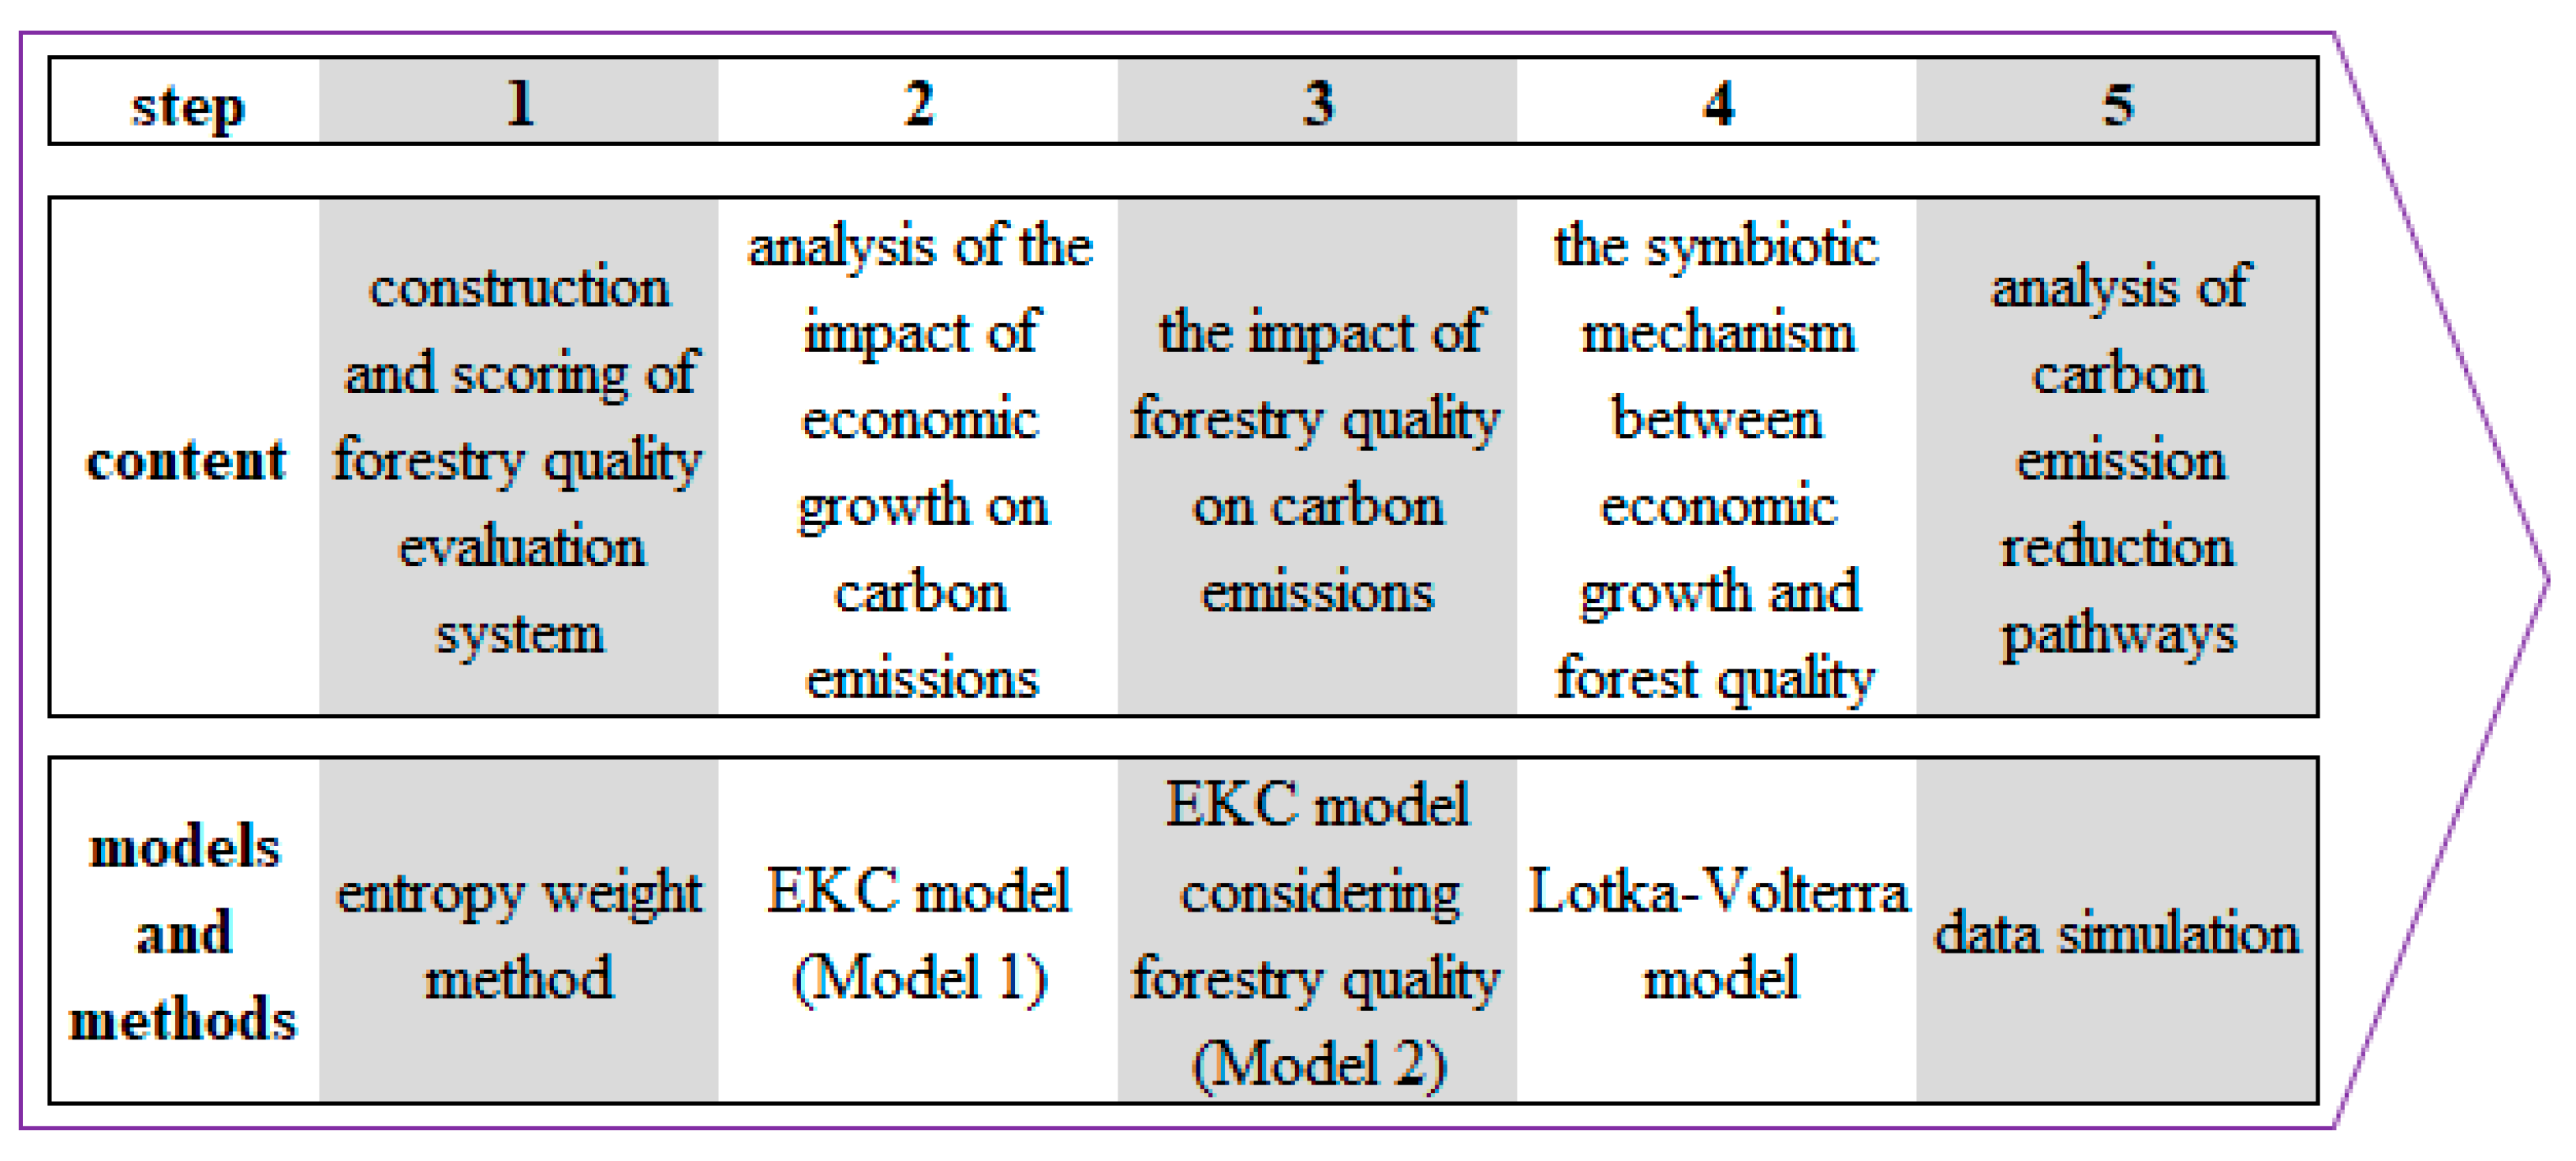
2. Methods and Materials
2.1. EKC Modeling of Carbon Emissions Under the Perspective of Forest–Economy Symbiosis
2.2. Forest Quality Evaluation Based on Entropy Weight Method
3. Results
3.1. Tests for the Econometric Analysis
3.2. Environmental Kuznets Curve (EKC) Analysis of Carbon Emissions
- (1)
- The Basic EKC Model for Carbon Emissions (fixed effects model)
- (2)
- Carbon emissions EKC taking into account forestry impacts
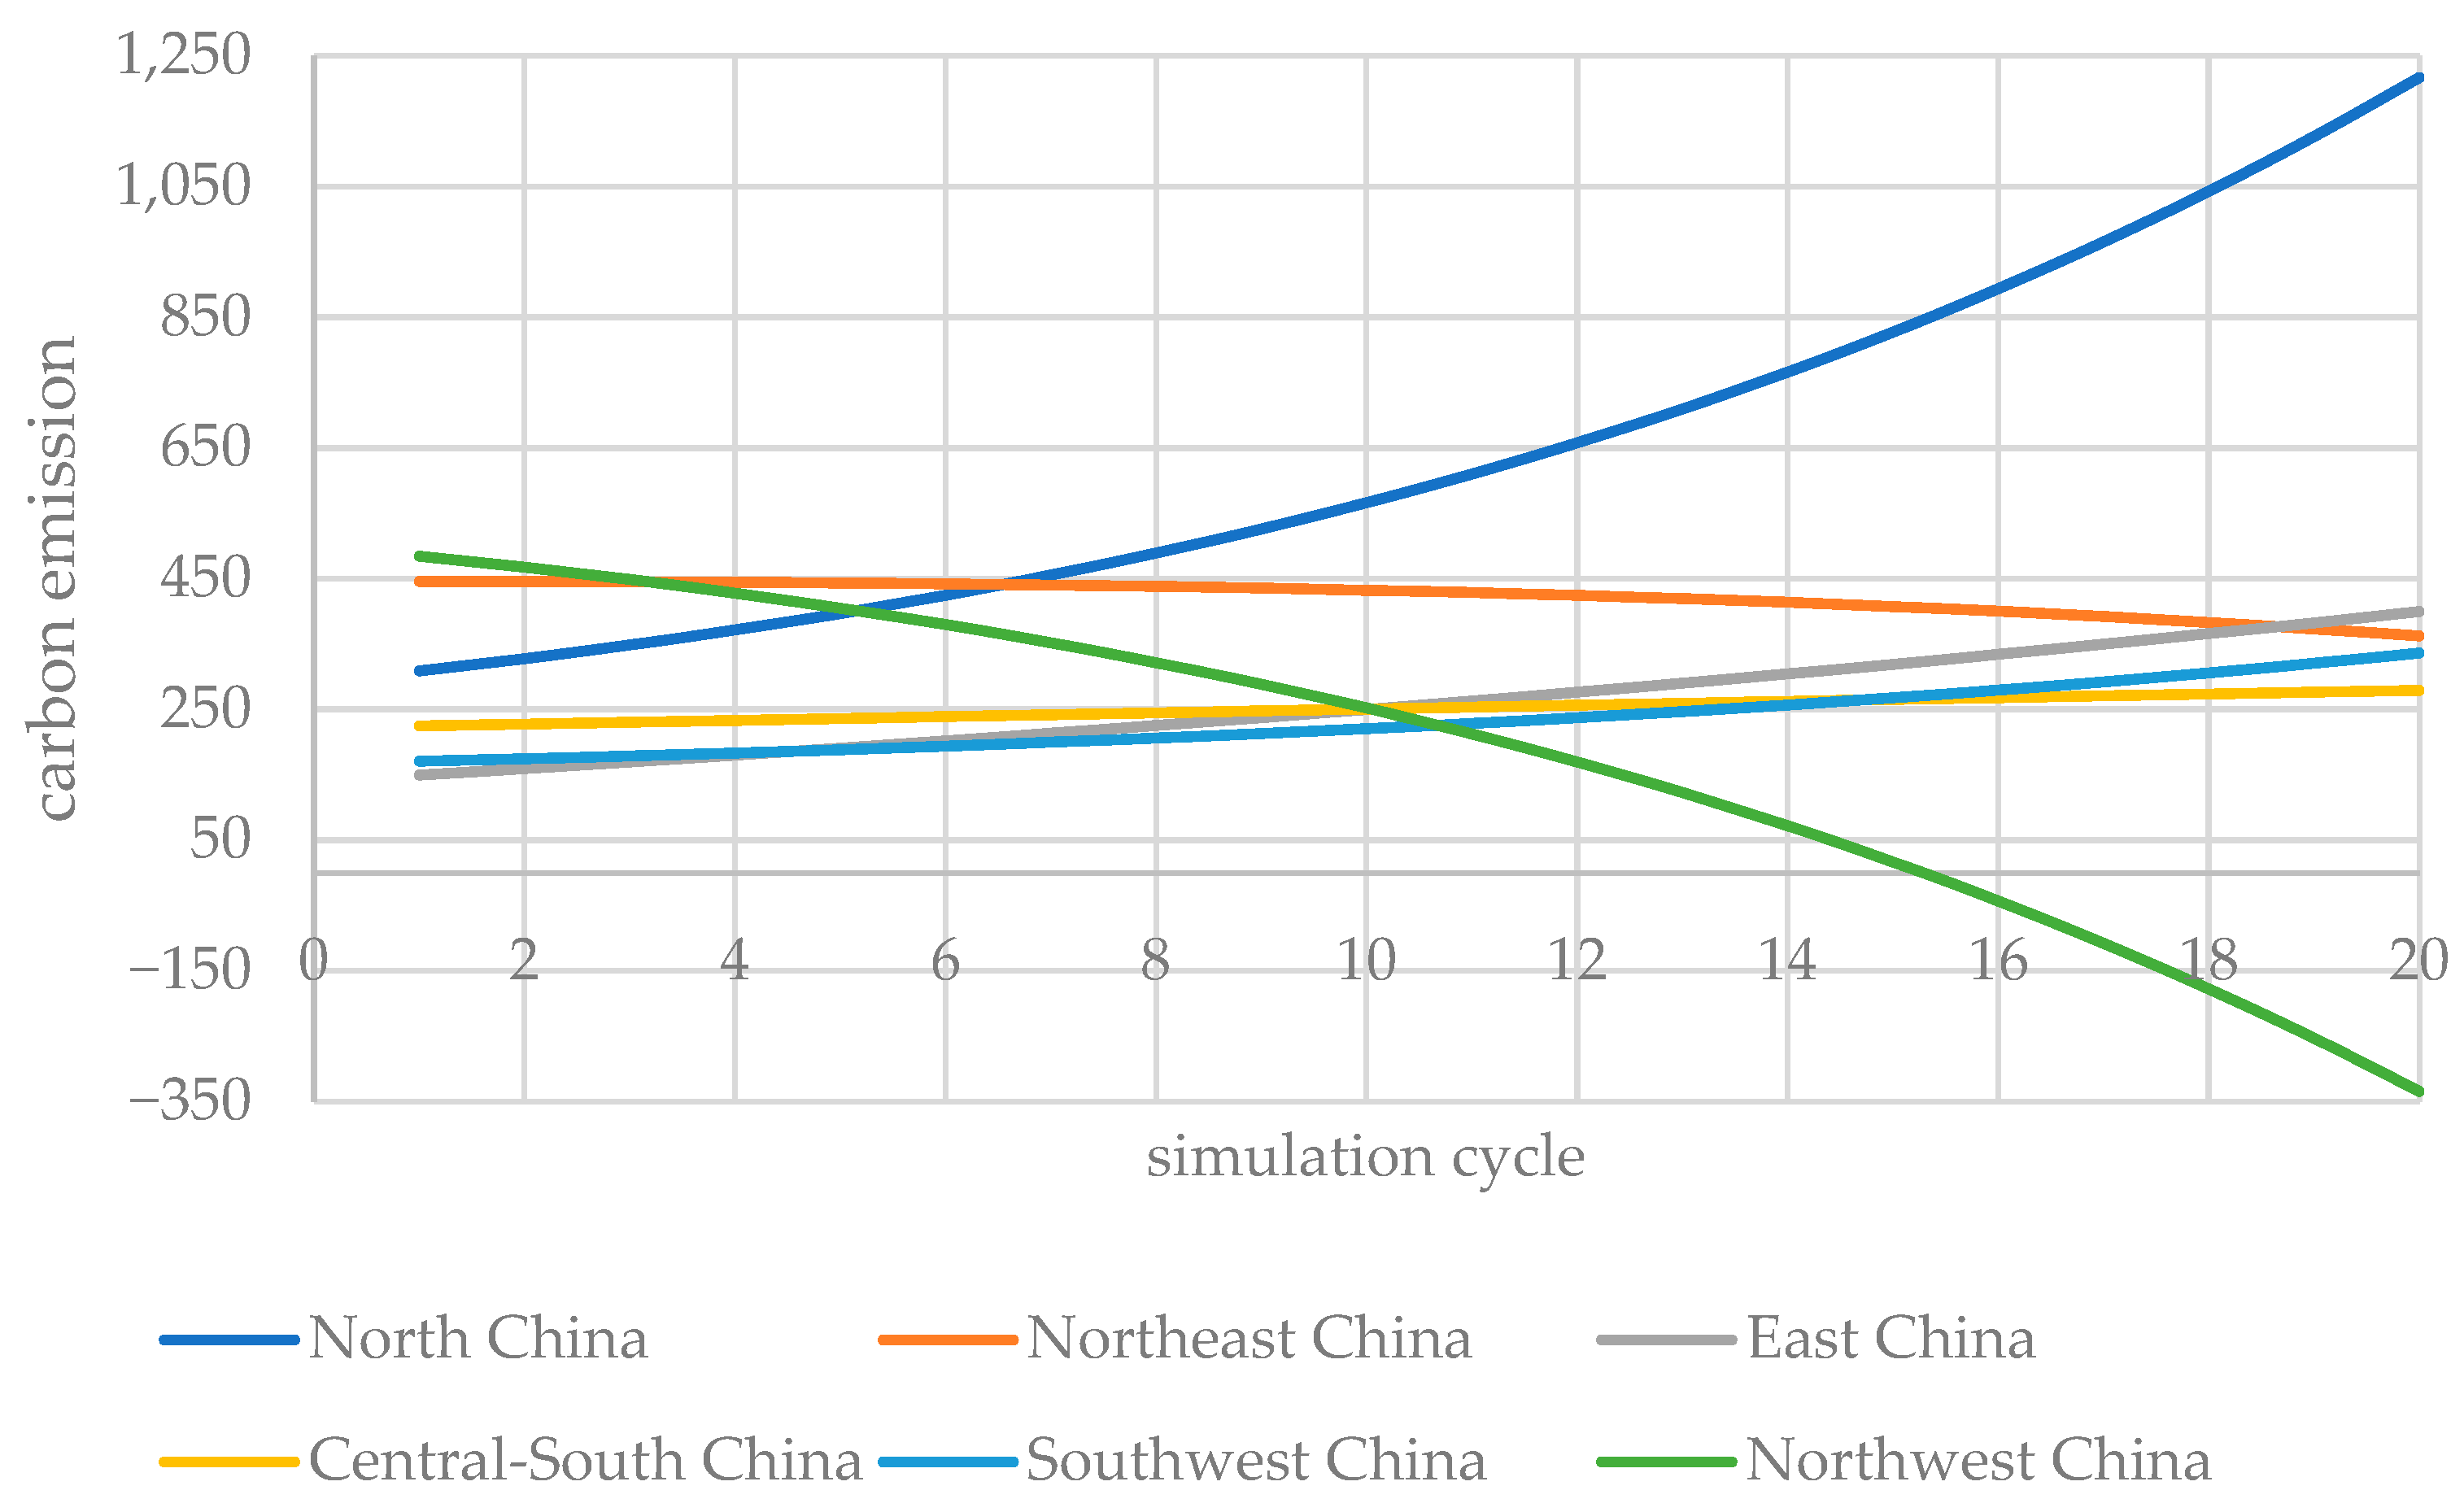
3.3. Symbiotic Mechanisms of Economic Growth and Forest Quality
3.4. Robustness Analysis of EKC Model
3.5. Discussion
3.6. Policy Implications
4. Conclusions
Author Contributions
Funding
Institutional Review Board Statement
Informed Consent Statement
Data Availability Statement
Conflicts of Interest
References
- Dudley, N.; Schlaepfer, R.; Jackson, W. Forest Quality: Assessing Forests at a Landscape Scale; Earthscan: London, UK; Sterling, VA, USA, 2006. [Google Scholar]
- Brower, L.P.; Castilleja, G.; Peralta, A. Quantitative changes in Forest quality in a principal overwintering area of the monarch butterfly in Mexico, 1971–1999. Conserv. Biol. 2010, 16, 346–359. [Google Scholar] [CrossRef]
- Tadesse, T.; Teklay, G.; Mulatu, D.W. Forest benefits and willingness to pay for sustainable forest management. Forest Policy Econ. 2022, 138, 102721. [Google Scholar] [CrossRef]
- Ali, A.; Ramakrishnan, S. Financial development and natural resources. Is there a stock market resource curse? Resour. Policy 2022, 75, 102457. [Google Scholar] [CrossRef]
- Leonard, A.; Ahsan, A.; Charbonnier, F. The Resource Curse in Renewable Energy: A Framework for Risk Assessment. Energy Strateg. Rev. 2022, 41, 100841. [Google Scholar] [CrossRef]
- Culas, R.J. Deforestation and the environmental Kuznets curve: An institutional perspective. Ecol. Econ. 2007, 61, 429–437. [Google Scholar] [CrossRef]
- Wang, S.; Liu, C.; Wilson, B. Is China in a later stage of a U-shaped forest resource curve? A re-examination of empirical evidence. Forest Policy Econ. 2007, 10, 1–6. [Google Scholar] [CrossRef]
- Wildberg, J.; Möhring, B. Empirical analysis of the economic effect of tree species diversity based on the results of a forest accountancy data network. Forest Policy Econ. 2019, 109, 101982. [Google Scholar] [CrossRef]
- Knoke, T.; Gosling, E.; Thom, D. Economic losses from natural disturbances in Norway spruce forests—A quantification using Monte-Carlo simulations. Ecol. Econ. 2021, 185, 107046. [Google Scholar] [CrossRef]
- Taye, F.A.; Folkersen, M.V.; Fleming, C.M. The economic values of global forest ecosystem services: A meta-analysis. Ecol. Econ. 2021, 189, 107145. [Google Scholar] [CrossRef]
- Amirnejad, H.; Mehrjo, A.; Satari Yuzbashkandi, S. Economic growth and air quality influences on energy sources depletion, forest sources and health in MENA. Environ. Chall. 2021, 2, 100011. [Google Scholar] [CrossRef]
- Gibson, J. Forest loss and economic inequality in the solomon islands: Using small-area estimation to link environmental change to welfare outcomes. Ecol. Econ. 2018, 148, 66–76. [Google Scholar] [CrossRef]
- Li, Y.; Mei, B.; Linhares-Juvenal, T. The economic contribution of the world’s forest sector. Forest Policy Econ. 2019, 100, 236–253. [Google Scholar] [CrossRef]
- Razafindratsima, O.H.; Kamoto, J.F.M.; Sills, E.O. Reviewing the evidence on the roles of forests and tree-based systems in poverty dynamics. Forest Policy Econ. 2021, 131, 102576. [Google Scholar] [CrossRef]
- Kim, J.S.; Lee, T.J.; Hyun, S.S. Estimating the economic value of urban forest parks: Focusing on restorative experiences and environmental concerns. J. Destin. Mark. Manag. 2021, 20, 100603. [Google Scholar] [CrossRef]
- van Kooten, G.C.; Nijnik, M.; Bradford, K. Can carbon accounting promote economic development in forest-dependent, indigenous communities? Forest Policy Econ. 2018, 100, 68–74. [Google Scholar] [CrossRef]
- Näyhä, A. Transition in the Finnish forest-based sector: Company perspectives on the bioeconomy, circular economy and sustainability. J. Clean. Prod. 2018, 209, 1294–1306. [Google Scholar] [CrossRef]
- Chachu, D.O.; Nketiah-Amponsah, E. The Fiscal resource curse: What’s China’s natural resource appetite got to do with it? Int. Rev. Appl. Econ. 2022, 36, 129–146. [Google Scholar] [CrossRef]
- Ajide, K.B. Is natural resource curse thesis an empirical regularity for economic complexity in Africa? Resour. Policy 2022, 76, 102755. [Google Scholar] [CrossRef]
- Gutiérrez, D.S.; Paz, M.J.; Vite, A.M. Industrialization of natural resources as a strategy to avoid the natural resource curse: Case of Chilean copper. Extract. Ind. Soc. 2022, 11, 101133. [Google Scholar] [CrossRef]
- Viccaro, M.; Cozzi, M.; Fanelli, L. Spatial modelling approach to evaluate the economic impacts of climate change on forests at a local scale. Ecol. Indic. 2019, 106, 105523. [Google Scholar] [CrossRef]
- Grebner, D.L.; Bettinger, P.; Siry, J.P. Introduction to Forestry and Natural Resources; Academic Press: Pittsburgh, PA, USA, 2013. [Google Scholar]
- Santos, A.; Carvalho, A.; Barbosa-Póvoa, A. An economic and environmental comparison between forest wood products—Uncoated woodfree paper, natural cork stoppers and particle boards. J. Clean. Prod. 2021, 296, 126469. [Google Scholar] [CrossRef]
- Belavenutti, P.; Chung, W.; Ager, A.A. The economic reality of the forest and fuel management deficit on a fire prone western US national forest. J. Environ. Manag. 2021, 293, 112825. [Google Scholar] [CrossRef] [PubMed]
- Kallio, A.M.I.; Solberg, B.; Käär, L. Economic impacts of setting reference levels for the forest carbon sinks in the EU on the European forest sector. Forest Policy Econ. 2018, 92, 193–201. [Google Scholar] [CrossRef]
- Zhang, K.; Song, C.; Zhang, Y. Natural disasters and economic development drive forest dynamics and transition in China. Forest Policy Econ. 2017, 76, 56–64. [Google Scholar] [CrossRef]
- Lin, B.; Ge, J. Does institutional freedom matter for global forest carbon sinks in the face of economic development disparity? China Econ. Rev. 2021, 65, 101563. [Google Scholar] [CrossRef]
- Lin, B.; Ge, J. Valued forest carbon sinks: How much emissions abatement costs could be reduced in China. J. Clean. Prod. 2019, 224, 455–464. [Google Scholar] [CrossRef]
- Grossman, G.M.; Krueger, A.B. Environmental impacts of a North American Free Trade Agreement. CEPR Discuss. Pap. 1992, 8, 223–250. [Google Scholar] [CrossRef]
- Caravaggio, N. Economic growth and the forest development path: A theoretical reassessment of the environmental Kuznets curve for deforestation. Forest Policy Econ. 2020, 118, 102259. [Google Scholar] [CrossRef]
- Turner, J.A.; Buongiorno, J.; Zhu, S. An economic model of international wood supply, forest stock and forest area change. Scand. J. For. Res. 2006, 21, 73–86. [Google Scholar] [CrossRef]
- Cuaresma, J.C.; Danylo, O.; Fritz, S.; McCallum, I.; Obersteiner, M.; See, L.; Walsh, B. Economic development and forest cover: Evidence from satellite data. Sci. Rep. 2017, 7, 40678. [Google Scholar] [CrossRef]
- Joshi, P.; Beck, K. Environmental Kuznets curve for deforestation: Evidence using GMM estimation for OECD and non-OECD regions. iForest 2017, 10, 196–203. [Google Scholar] [CrossRef]
- Nguyen-Van, P.; Azomahou, T. Nonlinearities and heterogeneity in environmental quality: An empirical analysis of deforestation. J. Dev. Econ. 2007, 84, 291–309. [Google Scholar] [CrossRef]
- Rodríguez García, V.; Caravaggio, N.; Gaspart, F.; Meyfroidt, P. Long- and Short-Run Forest Dynamics: An Empirical Assessment of Forest Transition, Environmental Kuznets Curve and Ecologically Unequal Exchange Theories. Forests 2021, 12, 431. [Google Scholar] [CrossRef]
- Prakash, N.; Jaana, K.; Prestemon, J.P.; Cubbage, F.W. Projecting Global and Regional Forest Area Under the Shared Socioeconomic Pathways Using an Updated Environmental Kuznets Curve Model. Forests 2019, 10, 387. [Google Scholar] [CrossRef]
- Hao, Y.; Xu, Y.; Zhang, J. Relationship between forest resources and economic growth: Empirical evidence from China. J. Clean. Prod. 2019, 214, 848–859. [Google Scholar] [CrossRef]
- Shahbaz, M.; Sinha, A. Environmental Kuznets curve for CO2 emissions: A literature survey. J. Econ. Stud. 2018, 46, 106–168. [Google Scholar] [CrossRef]
- Lv, D.H.; Wang, R.R.; Zhang, Y. Sustainability Assessment Based on Integrating EKC with Decoupling: Empirical Evidence from China. Sustainability 2021, 13, 655. [Google Scholar] [CrossRef]
- Rajan, P.; Omkar, J.; Tek, M. Incorporating Forests, Agriculture, and Energy Consumption in the Framework of the Environmental Kuznets Curve: A Dynamic Panel Data Approach. Sustainability 2019, 11, 2688. [Google Scholar] [CrossRef]
- Wang, S.Y.; Chen, W.M.; Wu, X.L. Competition Analysis on Industry Populations Based on a Three-Dimensional Lotka–Volterra Model. Discret. Dyn. Nat. Soc. 2021, 2021, 9935127. [Google Scholar] [CrossRef]
- Wang, S.Y.; Chen, W.M.; Wang, R.; Zhao, T. Study on the Coordinated Development of Urbanization and Water Resources Utilization Efficiency in China. Water Supply 2022, 22, 749–765. [Google Scholar] [CrossRef]
- Wang, S. Exploring the Sustainability of China’s New Energy Vehicle Development: Fresh Evidence from Population Symbiosis. Sustainability 2022, 14, 10796. [Google Scholar] [CrossRef]
- Gu, L.; Gong, Z.; Bu, Y. Forest quality Dynamic Change and Its Driving Factors Accompanied by Forest Transition in China. Forests 2021, 12, 733. [Google Scholar] [CrossRef]
- Wu, J.Z.; Zhong, Y.D.; Deng, J.Y. Assessing and Mapping Forest Landscape Quality in China. Forests 2019, 10, 684. [Google Scholar] [CrossRef]
- Tan, J.; Su, X.; Wang, R. Exploring the Measurement of Regional Forestry Eco-Efficiency and Influencing Factors in China Based on the Super-Efficient DEA-Tobit Two Stage Model. Forests 2023, 14, 300. [Google Scholar] [CrossRef]
- Chen, J.; Gao, M.; Cheng, S.; Hou, W.; Song, M.; Liu, X.; Liu, Y.; Shan, Y. County-level CO2 emissions and sequestration in China during 1997–2017. Sci. Data 2020, 7, 391. [Google Scholar] [CrossRef] [PubMed]
- Hafezalkotob, A.; Hafezalkotob, A. Extended MULTIMOORA method based on Shannon entropy weight for materials selection. J. Ind. Eng. Int. 2016, 12, 1–13. [Google Scholar] [CrossRef]
- Lotfi, F.H.; Fallahnejad, R. Imprecise Shannon’s entropy and multi attribute decision making. Entropy 2010, 12, 53–62. [Google Scholar] [CrossRef]
- Grossman, G.M.; Krueger, A.B. Economic growth and the environment. Q. J. Econ. 1995, 110, 353–377. [Google Scholar] [CrossRef]
- Apergis, N.; Ozturk, I. Testing Environmental Kuznets Curve Hypothesis in Asian Countries. Ecol. Indic. 2015, 52, 16–22. [Google Scholar] [CrossRef]
- Alam, M.M.; Murad, M.W.; Noman, A.H.M.; Ozturk, I. Relationships Among Carbon Emissions, Economic Growth, Energy Consumption and Population Growth: Testing Environmental Kuznets Curve Hypothesis for Brazil, China, India and Indonesia. Ecol. Indic. 2016, 70, 466–479. [Google Scholar] [CrossRef]
- Ahmad, A.; Zhao, Y.H.; Shahbaz, M.; Bano, S.; Zhang, Z.H.; Wang, S.; Liu, Y. Carbon Emissions, Energy Consumption and Economic Growth: An Aggregate and Disaggregate Analysis of the Indian Economy. Energ. Policy 2016, 96, 131–143. [Google Scholar] [CrossRef]
- Churchill, S.A.; Inekwe, J.; Ivanovski, K.; Smyth, R. The Environmental Kuznets Curve Across Australian States and Territories. Energ. Econ. 2020, 90, 104869. [Google Scholar] [CrossRef]
- Galeotti, M.; Lanza, A.; Pauli, F. Reassessing the environmental Kuznets curve for CO2 emissions: A robustness exercise. Ecol. Econ. 2006, 57, 152–163. [Google Scholar] [CrossRef]
- Friedl, B.; Getzner, M. Determinants of CO2 Emissions in a Small Open Economy. Ecol. Econ. 2003, 45, 133–148. [Google Scholar] [CrossRef]
- Kang, Y.Q.; Zhao, T.; Yang, Y.Y. Environmental Kuznets Curve for CO2 Emissions in China: A Spatial Panel Data Approach. Ecol. Indic. 2016, 63, 231–239. [Google Scholar] [CrossRef]
- Shahbaz, M.; Haouas, I.; Hoang, T.H.V. Economic Growth and Environmental Degradation in Vietnam: Is the Environmental Kuznets Curve a Complete Picture? Emerg. Mark. Rev. 2019, 38, 197–218. [Google Scholar] [CrossRef]
- MartíNez-Zarzoso, I.; Bengochea-Morancho, A. Pooled mean group estimation of an environmental Kuznets curve for CO2. Econ. Lett. 2004, 82, 121–126. [Google Scholar] [CrossRef]
- Ajmi, A.N.; Hammoudeh, S.; Nguyen, D.K.; Sato, J.R. On the Relationships Between CO2 Emissions, Energy Consumption and Income: The Importance of Time Variation. Energ. Econ. 2015, 49, 629–638. [Google Scholar] [CrossRef]
- Al-Mulali, U.; Saboori, B.; Ozturk, I. Investigating the Environmental Kuznets Curve Hypothesis in Vietnam. Energ. Policy 2015, 76, 123–131. [Google Scholar] [CrossRef]
- Kaika, D.; Zervas, E. The Environmental Kuznets Curve (EKC) Theory—Part A: Concept, Causes and the CO2 Emissions Case. Energ. Policy 2013, 62, 1392–1402. [Google Scholar] [CrossRef]
- Richmond, A.K.; Kaufmann, R.K. Is there a turning point in the relationship between income and energy use and/or carbon emissions? Ecol. Econ. 2006, 56, 176–189. [Google Scholar] [CrossRef]
- Han, Y.J.; Lu, Y. The Relationship Between Economic Growth and Environmental Quality: An Empirical Teston the Environmental Kuznets Curve of CO2. Econ. Theory Bus. Manag. 2009, 3, 5–11. [Google Scholar] [CrossRef]
- He, J.; Richard, P. Environmental Kuznets Curve for CO2 in Canada. Ecol. Econ. 2010, 69, 1083–1093. [Google Scholar] [CrossRef]
- Erdogan, S.; Adedoyin, F.F.; Bekun, F.V.; Sarkodie, S.A. Testing the Transport-induced Environmental Kuznets Curve Hypothesis: The Role of Air and Railway Transport. J. Air Transp. Manag. 2020, 89, 101935. [Google Scholar] [CrossRef]
- Koirala, B.S.; Mysami, R.C. Investigating the Effect of Forest Per Capita on Explaining the EKC Hypothesis for CO2 in the US. J. Environ. Econ. Polic. 2015, 4, 304–314. [Google Scholar] [CrossRef]
- Usama, A.M.; Solarin, S.A.; Salahuddin, M. The Prominence of Renewable and Non-renewable Electricity Generation on the Environmental Kuznets Curve: A Case Study of Ethiopia. Energy 2020, 211, 118665. [Google Scholar] [CrossRef]
- Erdogan, S. Analyzing the Environmental Kuznets Curve Hypothesis: The Role of Disaggregated Transport Infrastructure Investments. Sustain. Cities Soc. 2020, 61, 102338. [Google Scholar] [CrossRef]
- Zhang, Y.; Chen, X.; Wu, Y.; Shuai, C.Y.; Shen, L.Y. The Environmental Kuznets Curve of CO2 Emissions in the Manufacturing and Construction Industries: A Global Empirical Analysis. Environ. Impact Assess. Rev. 2019, 79, 106303. [Google Scholar] [CrossRef]
- Xu, B.; Lin, B.Q. Reducing CO2 Emissions in China’s Manufacturing Industry: Evidence from Nonparametric Additive Regression Models. Energy 2016, 101, 161–173. [Google Scholar] [CrossRef]
- Xu, B.; Lin, B.Q. Assessing CO2 Emissions in China’s Iron and Steel Industry: A Nonparametric Additive Regression Approach. Renew. Sustain. Energy Rev. 2017, 72, 325–337. [Google Scholar] [CrossRef]
- Hidemichi, F.; Kazuyuki, I.; Andrew, C.; Shigemi, K.; Shunsuke, M. An Analysis of Urban Environmental Kuznets Curve of CO2 Emissions: Empirical Analysis of 276 Global Metropolitan Areas. Appl. Energ. 2018, 228, 1561–1568. [Google Scholar] [CrossRef]

| aij | Index | Index Units | Index Type |
|---|---|---|---|
| forestry output value | 100 million RMB yuan | economy | |
| forestry investment | 100 million RMB yuan | economy, ecology, and society | |
| forestry land area | 10,000 hectares | ecology | |
| forest coverage | 10,000 hectares | ecology | |
| prevention and control of forestry pests | prevention and control rate (%) | ecology | |
| forest stock | 10,000 cubic meters | economy, ecology, and society |
| Indicators | ||||||
|---|---|---|---|---|---|---|
| 0.163 | 0.169 | 0.175 | 0.173 | 0.174 | 0.146 |
| Region | Year | Mean | |||||||||
|---|---|---|---|---|---|---|---|---|---|---|---|
| 2022 | 2021 | 2020 | 2019 | 2018 | 2017 | 2016 | 2015 | 2014 | 2013 | ||
| Beijing | 5.031 | 5.075 | 5.189 | 5.198 | 5.170 | 4.939 | 4.893 | 4.892 | 5.033 | 4.950 | 5.037 |
| Tianjin | 3.347 | 3.376 | 3.614 | 3.843 | 3.531 | 3.552 | 3.337 | 3.372 | 3.264 | 3.159 | 3.439 |
| Hebei | 6.106 | 6.138 | 6.171 | 6.148 | 6.160 | 6.007 | 5.941 | 5.871 | 5.856 | 5.785 | 6.018 |
| Shanxi | 5.940 | 5.926 | 5.926 | 5.852 | 5.863 | 5.786 | 5.777 | 5.732 | 5.740 | 5.703 | 5.825 |
| Neimenggu | 6.903 | 6.892 | 6.893 | 6.989 | 6.900 | 6.869 | 6.852 | 6.846 | 6.796 | 6.798 | 6.874 |
| Liaoning | 5.986 | 5.933 | 5.931 | 5.923 | 5.995 | 5.931 | 5.935 | 6.064 | 6.112 | 6.136 | 5.994 |
| Jilin | 6.266 | 6.267 | 6.268 | 6.268 | 6.282 | 6.245 | 6.276 | 6.260 | 6.185 | 6.228 | 6.254 |
| Heilongjiang | 7.003 | 6.947 | 7.089 | 6.891 | 6.903 | 6.875 | 6.887 | 6.877 | 6.832 | 6.842 | 6.915 |
| Shanghai | 3.219 | 3.307 | 3.466 | 3.478 | 3.393 | 3.187 | 3.202 | 3.139 | 3.062 | 2.993 | 3.245 |
| Jiangsu | 5.305 | 5.433 | 5.454 | 5.429 | 5.436 | 5.495 | 5.437 | 5.453 | 5.486 | 5.427 | 5.435 |
| Zhejiang | 6.095 | 6.081 | 6.140 | 6.162 | 6.116 | 6.080 | 6.059 | 6.060 | 6.061 | 6.070 | 6.093 |
| Anhui | 6.068 | 6.219 | 6.126 | 6.088 | 6.082 | 6.028 | 5.986 | 6.007 | 5.987 | 5.945 | 6.054 |
| Fujian | 6.523 | 6.470 | 6.445 | 6.565 | 6.609 | 6.614 | 6.624 | 6.628 | 6.637 | 6.620 | 6.574 |
| Jiangxi | 6.586 | 6.566 | 6.578 | 6.625 | 6.536 | 6.528 | 6.452 | 6.314 | 6.389 | 6.339 | 6.491 |
| Shandong | 5.692 | 5.885 | 5.900 | 5.798 | 5.936 | 5.898 | 5.887 | 5.864 | 5.875 | 5.820 | 5.855 |
| Henan | 5.908 | 5.955 | 5.939 | 6.069 | 5.892 | 5.867 | 5.893 | 5.918 | 5.918 | 5.905 | 5.926 |
| Hubei | 6.318 | 6.466 | 6.412 | 6.513 | 6.395 | 6.356 | 6.294 | 6.225 | 6.122 | 6.036 | 6.314 |
| Hunan | 6.518 | 6.630 | 6.644 | 6.453 | 6.682 | 6.567 | 6.593 | 6.569 | 6.578 | 6.521 | 6.576 |
| Guangdong | 6.599 | 6.514 | 6.481 | 6.136 | 6.431 | 6.346 | 6.308 | 6.298 | 6.207 | 6.226 | 6.355 |
| Guangxi | 6.925 | 6.915 | 6.820 | 6.741 | 6.792 | 6.686 | 6.720 | 6.754 | 6.805 | 6.683 | 6.784 |
| Hainan | 5.015 | 5.088 | 5.073 | 5.686 | 5.068 | 5.034 | 4.976 | 4.952 | 5.006 | 4.979 | 5.088 |
| Chongqing | 5.915 | 5.916 | 5.856 | 5.832 | 5.825 | 5.666 | 5.463 | 5.563 | 5.446 | 5.422 | 5.690 |
| Sichuan | 7.117 | 7.130 | 7.090 | 7.052 | 7.079 | 7.043 | 6.970 | 6.930 | 6.930 | 6.787 | 7.013 |
| Guizhou | 6.592 | 6.518 | 6.580 | 6.562 | 6.524 | 6.331 | 6.089 | 6.048 | 5.965 | 5.883 | 6.309 |
| Yunnan | 7.121 | 7.106 | 7.090 | 7.056 | 7.091 | 7.016 | 6.959 | 6.977 | 6.920 | 6.923 | 7.026 |
| Xizang | 5.877 | 5.872 | 5.866 | 5.812 | 5.686 | 5.871 | 5.840 | 5.793 | 5.738 | 5.785 | 5.814 |
| Shaanxi | 6.252 | 6.289 | 6.344 | 6.311 | 6.343 | 6.290 | 6.249 | 6.223 | 6.217 | 6.172 | 6.269 |
| Gansu | 5.961 | 5.923 | 5.946 | 5.946 | 5.925 | 5.843 | 5.785 | 5.756 | 5.731 | 5.723 | 5.854 |
| Qinghai | 5.353 | 5.282 | 5.279 | 5.306 | 5.246 | 5.178 | 5.123 | 4.998 | 4.955 | 4.859 | 5.158 |
| Ningxia | 4.311 | 4.253 | 4.226 | 4.247 | 4.179 | 4.135 | 4.143 | 4.216 | 4.133 | 4.138 | 4.198 |
| Xinjiang | 6.133 | 6.230 | 6.172 | 6.195 | 6.220 | 6.103 | 6.053 | 6.058 | 5.911 | 5.881 | 6.096 |
| Variable | Description | Unit | Mean | SD |
|---|---|---|---|---|
| C | CO2emissions | ten thousand tons | 342 | 223 |
| G | GDP deflator | billion RMB yuan | 14,956 | 11,390 |
| F | forestry quality evaluation score | evaluation score | 5.889 | 0.910 |
| Variable | VIF | 1/VIF |
|---|---|---|
| GDP | 10.81 | 0.092538 |
| GDP2 | 10.81 | 0.092538 |
| Mean VIF | 10.81 | |
| GDP | 11.59 | 0.086289 |
| GDP2 | 11.46 | 0.087269 |
| Forest | 1.06 | 0.947512 |
| Mean VIF | 8.03 |
| EKC Model | Area | Chi2 | Prob > Chi2 | Fe or Re |
|---|---|---|---|---|
| EKC 1 | Nationwide | 0.65 | 0.4202 | RE |
| North China | 0.52 | 0.4726 | RE | |
| Northeast China | 32.15 | 0.0000 | FE | |
| East China | 0.54 | 0.4600 | RE | |
| Central-South China | 5.04 | 0.0247 | FE | |
| Southwest China | 2.66 | 0.1026 | RE | |
| Northwest China | 19.54 | 0.0000 | FE | |
| EKC 2 | Nationwide | 7.66 | 0.0210 | FE |
| North China | 4.35 | 0.1130 | RE | |
| Northeast China | 34.31 | 0.0000 | FE | |
| East China | 9.13 | 0.0104 | FE | |
| Central-South China | 8.24 | 0.0162 | FE | |
| Southwest China | 21.98 | 0.0000 | FE | |
| Northwest China | 24.86 | 0.0000 | FE |
| Area | α0 | α1 | α2 | Shape of EKC |
|---|---|---|---|---|
| North China | 541.206 (2.49) *** | −8.93 × 10⁻⁴ (−4.386) | −4.61 × 10⁻⁷ (2.758) | linear decrease |
| Northeast China | 401.864 (8.36) *** | −6.40 × 10⁻³ (−0.82) | 4.65 × 10⁻⁹ (0.02) | U shape |
| East China | 91.496 (1.20) | 0.013 (3.58) *** | 3.43 × 10⁻⁸ (0.60) | linear increase |
| Central-South China | 182.901 (4.49) *** | 5.80 × 10⁻³ (1.85) * | 5.51 × 10⁻⁸ (1.32) | linear increase |
| Southwest China | 161.608 (6.71) *** | 5.27 × 10⁻³ (1.58) | 9.88 × 10⁻⁸ (0.85) | linear increase |
| Northwest China | −465.630 (−7.25) *** | 0.19 (9.24) *** | −7.20 × 10⁻⁶ (−6.82) *** | Inverted U shape |
| Nationwide | 106.364 (5.06) *** | 0.019 (8.118) *** | −1.29 × 10⁻⁷ (−2.71) *** | Inverted U shape |
| Area | α0 | α1 | α2 | α3 | Shape of EKC |
|---|---|---|---|---|---|
| North China | 511.409 (1.49) * | −0.203 (−3.703) *** | 8.027×10⁻⁶ (3.828) *** | 204.987 (9.167) *** | U shape |
| Northeast China | 293.941 (0.775) | 0.060 (2.421) ** | −1.499×10⁻⁶ (−1.491) * | −59.632 (−1.225) | Inverted U shape |
| East China | −173.177 (−1.448) | 0.015 (2.185) ** | 5.118×10⁻⁸ (0.414) | 33.551 (2.425) ** | Monotone increasing |
| Central-South China | 102.405 (1.323) | 0.026 (14.391) *** | −2.867×10⁻⁷ (−9.167) *** | −21.784 (−1.555)* | Inverted U shape |
| Southwest China | 168.866 (1.961) ** | −0.028 (−3.727) *** | 1.243×10⁻⁶ (4.742) *** | 31.499 (2.805) *** | U shape |
| Northwest China | 302.298 (2.809) *** | 0.133 (7.750) *** | −7.238×10⁻⁶ (−6.949) *** | −84.803 (−3.269) | Inverted U shape |
| Nationwide | −104.502 (−1.600) * | 0.014 (4.969) *** | −5.624×10⁻⁸ (−0.976) | 43.543 (3.920) *** | Monotone increasing |
| Cycle | North China | Northeast China | East China | Central-South China | South West China | North West China | G1 | Forestry Quality |
|---|---|---|---|---|---|---|---|---|
| 1 | 309.0 | 445.9 | 149.7 | 224.8 | 170.7 | 484.5 | 10,000 | 5.0 |
| 2 | 327.8 | 445.8 | 159.5 | 227.6 | 174.6 | 467.6 | 10,300 | 5.2 |
| 3 | 348.6 | 445.4 | 169.7 | 230.4 | 178.8 | 448.8 | 10,609 | 5.3 |
| 4 | 371.6 | 444.8 | 180.2 | 233.3 | 183.4 | 428.0 | 10,927 | 5.5 |
| 5 | 397.0 | 443.8 | 190.9 | 236.1 | 188.4 | 405.1 | 11,255 | 5.6 |
| 6 | 425.0 | 442.4 | 202.1 | 239.0 | 193.9 | 379.9 | 11,593 | 5.8 |
| 7 | 455.8 | 440.6 | 213.5 | 241.9 | 199.8 | 352.1 | 11,941 | 6.0 |
| 8 | 489.5 | 438.4 | 225.4 | 244.8 | 206.2 | 321.7 | 12,299 | 6.1 |
| 9 | 526.3 | 435.8 | 237.6 | 247.8 | 213.1 | 288.5 | 12,668 | 6.3 |
| 10 | 566.6 | 432.6 | 250.1 | 250.7 | 220.6 | 252.2 | 13,048 | 6.5 |
| 11 | 610.5 | 428.9 | 263.1 | 253.7 | 228.7 | 212.6 | 13,439 | 6.7 |
| 12 | 658.2 | 424.5 | 276.5 | 256.6 | 237.5 | 169.5 | 13,842 | 6.9 |
| 13 | 710.2 | 419.6 | 290.3 | 259.5 | 246.9 | 122.7 | 14,258 | 7.1 |
| 14 | 766.5 | 413.9 | 304.5 | 262.4 | 257.0 | 71.8 | 14,685 | 7.3 |
| 15 | 827.7 | 407.5 | 319.2 | 265.3 | 268.0 | 16.7 | 15,126 | 7.6 |
| 16 | 893.9 | 400.4 | 334.3 | 268.2 | 279.7 | −43.1 | 15,580 | 7.8 |
| 17 | 965.6 | 392.3 | 349.9 | 271.0 | 292.4 | −107.7 | 16,047 | 8.0 |
| 18 | 1043.1 | 383.3 | 366.0 | 273.8 | 306.0 | −177.6 | 16,528 | 8.3 |
| 19 | 1126.8 | 373.4 | 382.6 | 276.5 | 320.6 | −253.1 | 17,024 | 8.5 |
| 20 | 1217.2 | 362.3 | 399.7 | 279.2 | 336.2 | −334.6 | 17,535 | 8.8 |
| Area | Symbiotic Mechanism | ||||||
|---|---|---|---|---|---|---|---|
| North China | 1.001 (16.569) *** | −4.146 × 10⁻⁷ (−0.175) | −1.021 × 10⁻⁴ (−0.010) | 1.006 (51.010) *** | −1.320 × 10⁻³ (−0.455) | 4.203 × 10⁻⁷ (0.644) | Laterality |
| Northeast China | 1.302 (3.347) *** | −6.815 × 10⁻⁶ (−1.531) * | −0.043 (−0.770) | 1.020 (25.968) *** | −1.625 × 10⁻³ (−0.291) | −9.502 × 10⁻⁷ (−1.556) * | Competition |
| East China | 1.039 (25.582) *** | −5.154 × 10⁻⁷ (−1.338) | −7.795 × 10⁻⁴ (−0.119) | 1.025 (67.991) *** | −3.079 × 10⁻³ (−1.353) | −2.605 × 10⁻⁷ (−1.962) * | Competition |
| Central-South China | 0.954 (10.876) *** | 1.023 × 10⁻⁷ (0.459) | 9.834 × 10⁻³ (0.703) | 1.035 (23.831) *** | −5.779 × 10⁻³ (−0.821) | 1.444 × 10⁻⁷ (0.574) | Synergy |
| Southwest China | 0.984 (11.549) *** | −1.568 × 10⁻⁶ (−1.179) | 0.010 (0.745) | 1.055 (46.556) *** | −7.227 × 10⁻³ (−1.951) * | −3.049 × 10⁻⁸ (−0.081) | Laterality |
| Northwest China | 0.877 (5.991) *** | −7.414 × 10⁻⁷ (−0.282) | 0.024 (0.917) | 1.012 (65.601) *** | −6.573 × 10⁻⁴ (−0.213) | −6.079 × 10⁻⁷ (−1.146) | Laterality |
| Nationwide | 0.988 (44.230) *** | 1.949 × 10⁻⁷ (1.172) | 0.003 (0.940) | 1.016 (118.637) *** | −1.961 × 10⁻³ (−1.424) | −1.026 × 10⁻⁷ (−1.191) | Laterality |
| Cycle | GDP (G1) | Forestry Quality | Carbon Emission (Ct) | ||||
|---|---|---|---|---|---|---|---|
| BASIC Model | 2 Times the Carbon Emission Inhibition Coefficient | 4 Times the Carbon Emission Inhibition Coefficient | 1.1 Times the Forestry Proportion | 1.1 Times the Forestry Proportion and 4 Times the Carbon Emission Inhibition Coefficient | |||
| 1 | 10,000.0 | 5.0 | 224.8 | 196.1 | 138.8 | 213.9 | 127.9 |
| 2 | 10,228.7 | 5.2 | 226.2 | 196.2 | 136.2 | 214.9 | 125.0 |
| 3 | 10,462.6 | 5.3 | 227.5 | 196.1 | 133.3 | 215.9 | 121.8 |
| 4 | 10,701.9 | 5.5 | 228.8 | 196.0 | 130.3 | 216.9 | 118.4 |
| 5 | 10,946.6 | 5.6 | 230.1 | 195.7 | 127.0 | 217.8 | 114.7 |
| 6 | 11,196.9 | 5.8 | 231.3 | 195.4 | 123.5 | 218.7 | 110.9 |
| 7 | 11,452.9 | 6.0 | 232.5 | 194.9 | 119.7 | 219.5 | 106.7 |
| 8 | 11,714.8 | 6.1 | 233.7 | 194.3 | 115.6 | 220.3 | 102.3 |
| 9 | 11,982.7 | 6.3 | 234.8 | 193.6 | 111.3 | 221.0 | 97.5 |
| 10 | 12,256.8 | 6.5 | 235.9 | 192.8 | 106.7 | 221.7 | 92.5 |
| 11 | 12,537.2 | 6.7 | 236.9 | 191.9 | 101.7 | 222.3 | 87.1 |
| 12 | 12,824.2 | 6.9 | 237.9 | 190.8 | 96.5 | 222.8 | 81.4 |
| 13 | 13,117.8 | 7.1 | 238.8 | 189.5 | 90.8 | 223.3 | 75.3 |
| 14 | 13,418.3 | 7.3 | 239.7 | 188.1 | 84.8 | 223.7 | 68.9 |
| 15 | 13,725.8 | 7.6 | 240.5 | 186.5 | 78.5 | 224.0 | 62.0 |
| 16 | 14,040.5 | 7.8 | 241.2 | 184.7 | 71.7 | 224.3 | 54.7 |
| 17 | 14,362.7 | 8.0 | 241.9 | 182.8 | 64.5 | 224.4 | 47.0 |
| 18 | 14,692.5 | 8.3 | 242.5 | 180.6 | 56.8 | 224.5 | 38.8 |
| 19 | 15,030.1 | 8.5 | 243.0 | 178.2 | 48.7 | 224.4 | 30.1 |
| 20 | 15,375.8 | 8.8 | 243.4 | 175.6 | 40.1 | 224.3 | 21.0 |
| Area | α0 | α1 | α2 | α3 | Shape of EKC |
|---|---|---|---|---|---|
| North China | 164.919 (2.132) ** | −33.787 (−2.048) ** | 1.770 (2.014) ** | 0.488 (6.532) *** | U shape |
| Northeast China | 30.175 (1.238) | −6.151 (−1.162) | 0.374 (1.314) | 0.085 (0.731) | U shape |
| East China | 22.531 (2.206) ** | −4.450 (−2.177) ** | 0.272 (2.667) *** | 0.124 (5.961) *** | U shape |
| Central-South China | −19.056 (−16.663) *** | 4.551 (17.956) *** | −0.196 (−14.233) *** | −0.165 (−5.465) *** | Inverted U shape |
| Southwest China | 55.652 (7.354) *** | −11.261 (−6.883) *** | 0.619 (7.039) *** | 0.163 (5.081) *** | U shape |
| Northwest China | −22.869 (−3.088) *** | 6.211 (3.523) *** | −0.351 (−3.479) *** | 0.288 (1.346) | Inverted U shape |
| Nationwide | −3.671 (−1.730) * | 1.368 (2.904) *** | −0.041 (−1.596) * | 0.027 (1.087) | Inverted U shape |
Disclaimer/Publisher’s Note: The statements, opinions and data contained in all publications are solely those of the individual author(s) and contributor(s) and not of MDPI and/or the editor(s). MDPI and/or the editor(s) disclaim responsibility for any injury to people or property resulting from any ideas, methods, instructions or products referred to in the content. |
© 2025 by the authors. Licensee MDPI, Basel, Switzerland. This article is an open access article distributed under the terms and conditions of the Creative Commons Attribution (CC BY) license (https://creativecommons.org/licenses/by/4.0/).
Share and Cite
Zhang, Y.; Wu, X.; Wang, S. Climate Change Mitigation Through Forest Quality Enhancement and Socio-Ecological Symbiosis: Evidence from China. Atmosphere 2025, 16, 311. https://doi.org/10.3390/atmos16030311
Zhang Y, Wu X, Wang S. Climate Change Mitigation Through Forest Quality Enhancement and Socio-Ecological Symbiosis: Evidence from China. Atmosphere. 2025; 16(3):311. https://doi.org/10.3390/atmos16030311
Chicago/Turabian StyleZhang, Yuwen, Xiaolan Wu, and Shengyuan Wang. 2025. "Climate Change Mitigation Through Forest Quality Enhancement and Socio-Ecological Symbiosis: Evidence from China" Atmosphere 16, no. 3: 311. https://doi.org/10.3390/atmos16030311
APA StyleZhang, Y., Wu, X., & Wang, S. (2025). Climate Change Mitigation Through Forest Quality Enhancement and Socio-Ecological Symbiosis: Evidence from China. Atmosphere, 16(3), 311. https://doi.org/10.3390/atmos16030311