
Climatological and Hydrological Extremes of the Andaman and Nicobar Islands, India, and Its Database for Public Users

 , and
, and
Abstract
1. Introduction
2. Materials and Methods
2.1. Study Area
2.2. Analysis and Data Used
2.3. Precipitation Variability
2.4. Precipitation Categorization
2.5. Trend Analysis
2.6. Extreme Precipitation Events and Indices
3. Results and Discussions
3.1. Precipitation Dynamics
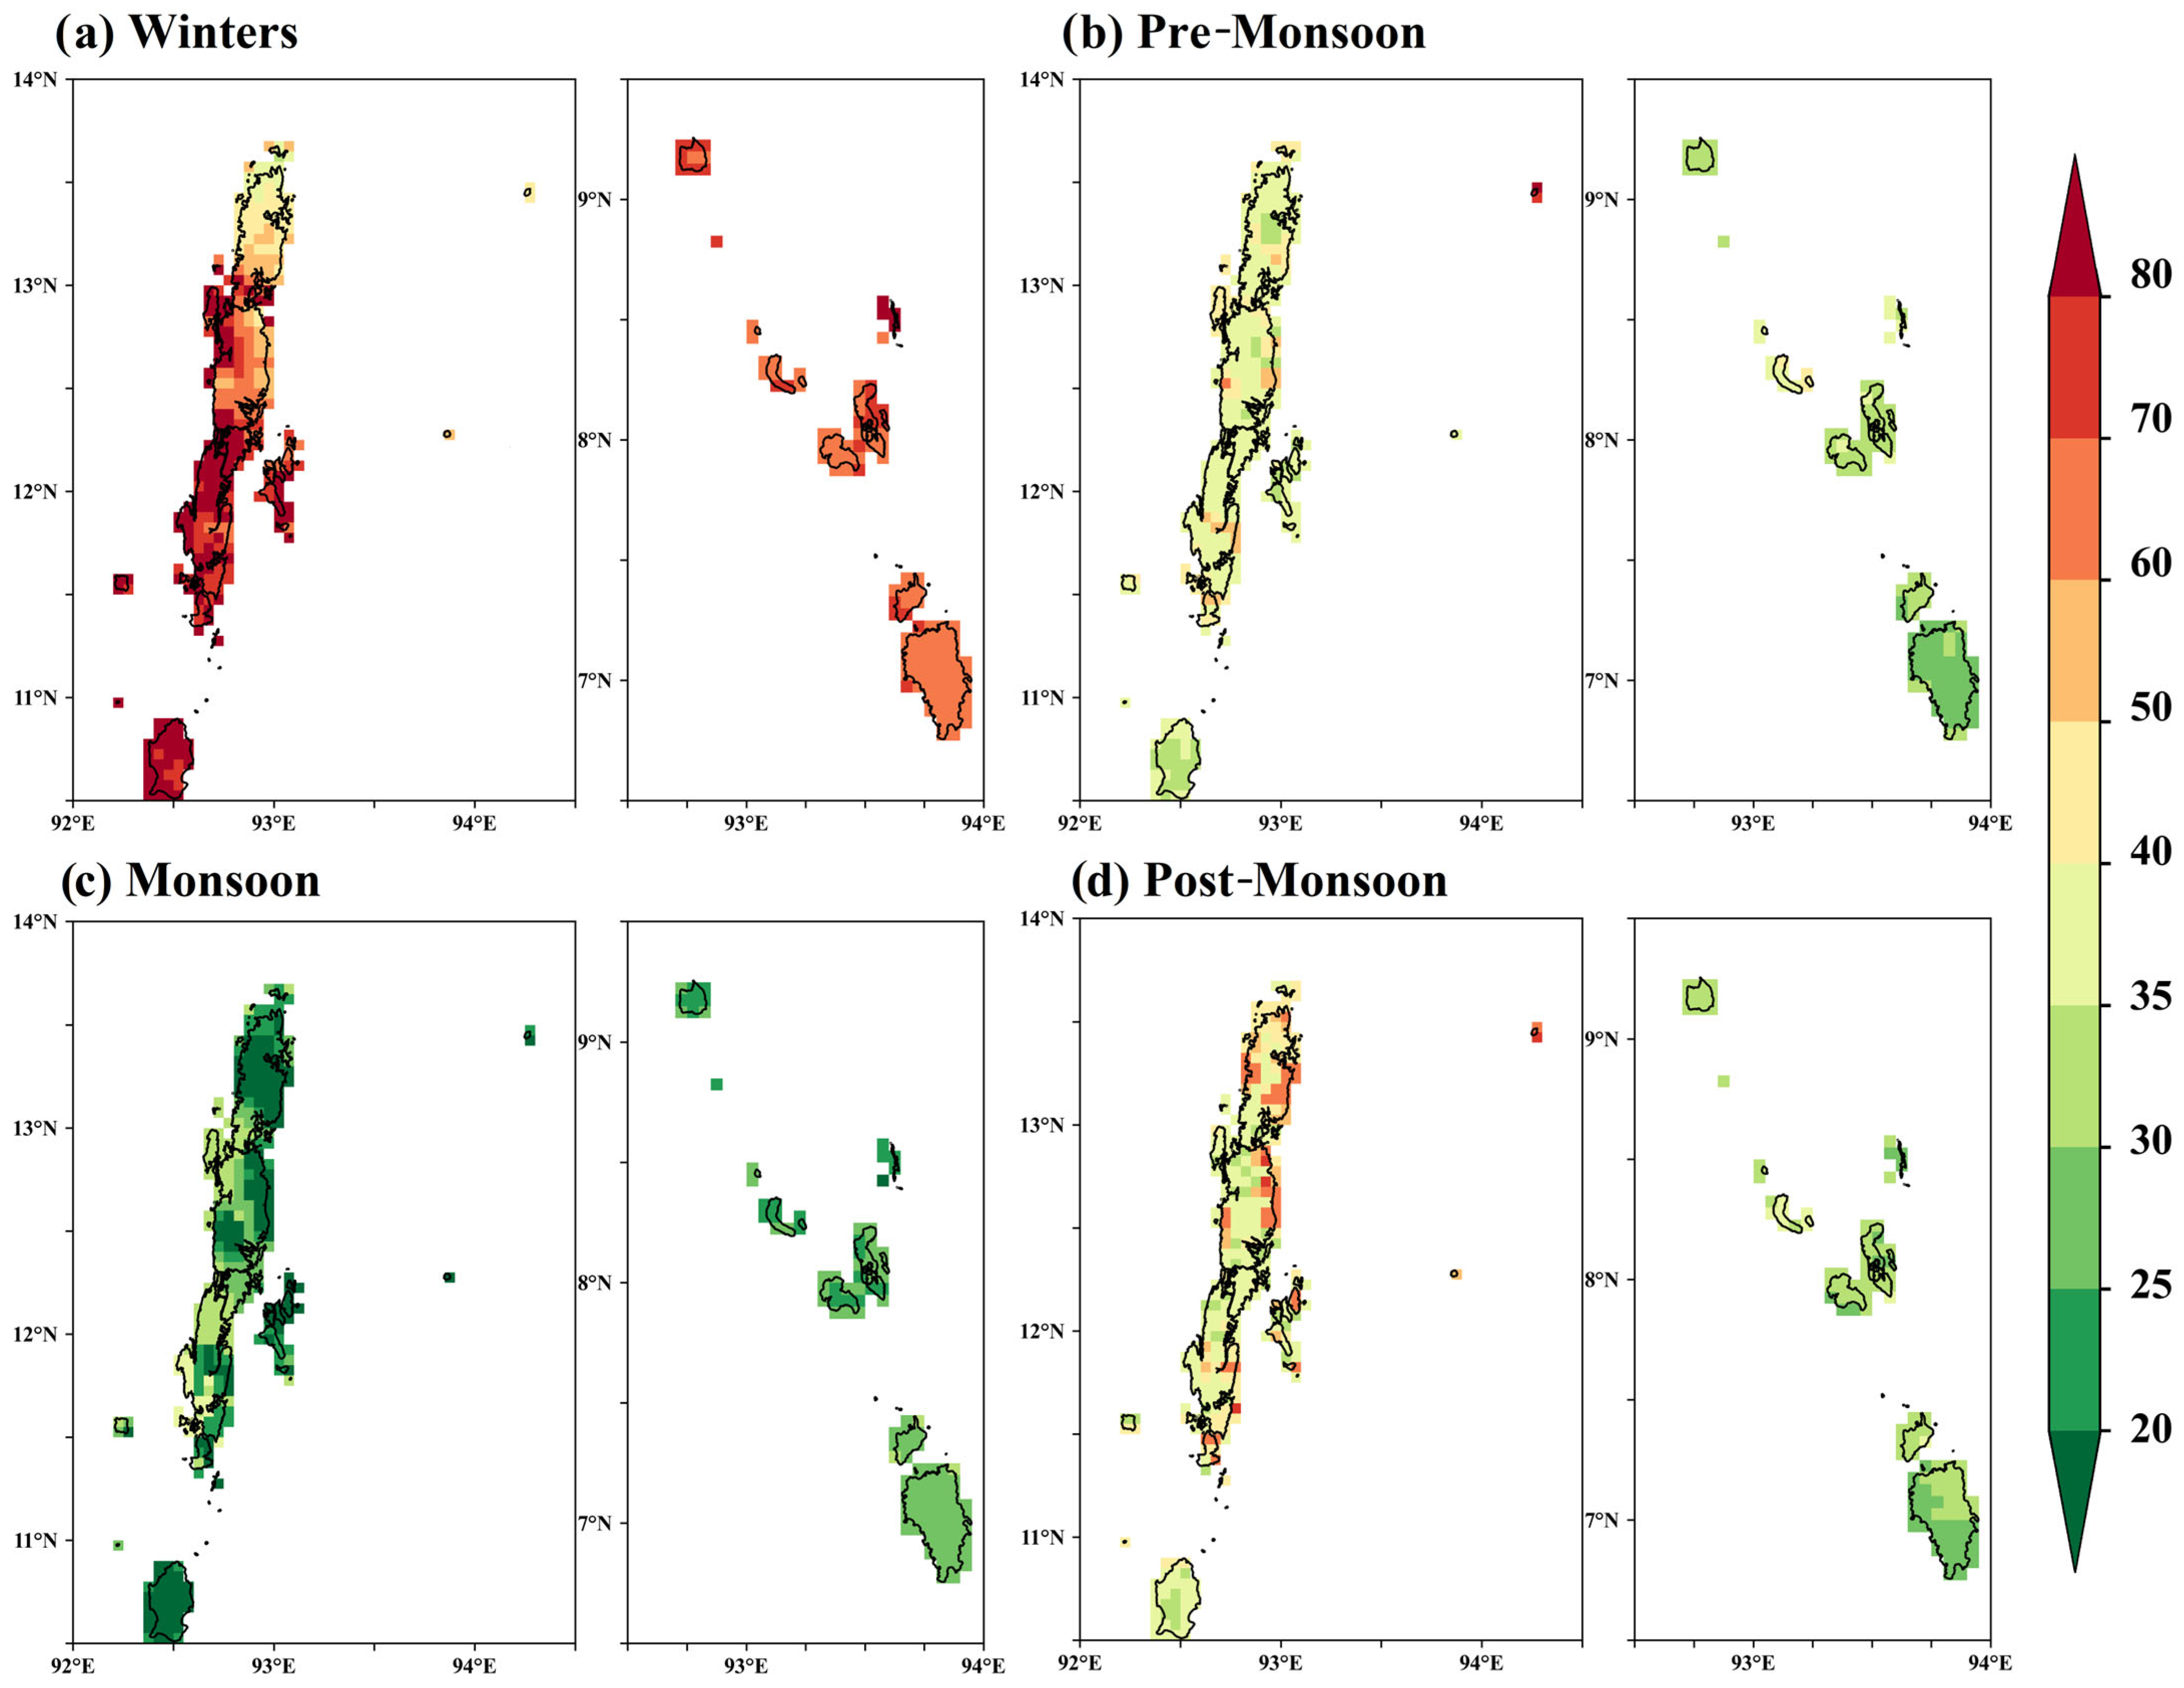
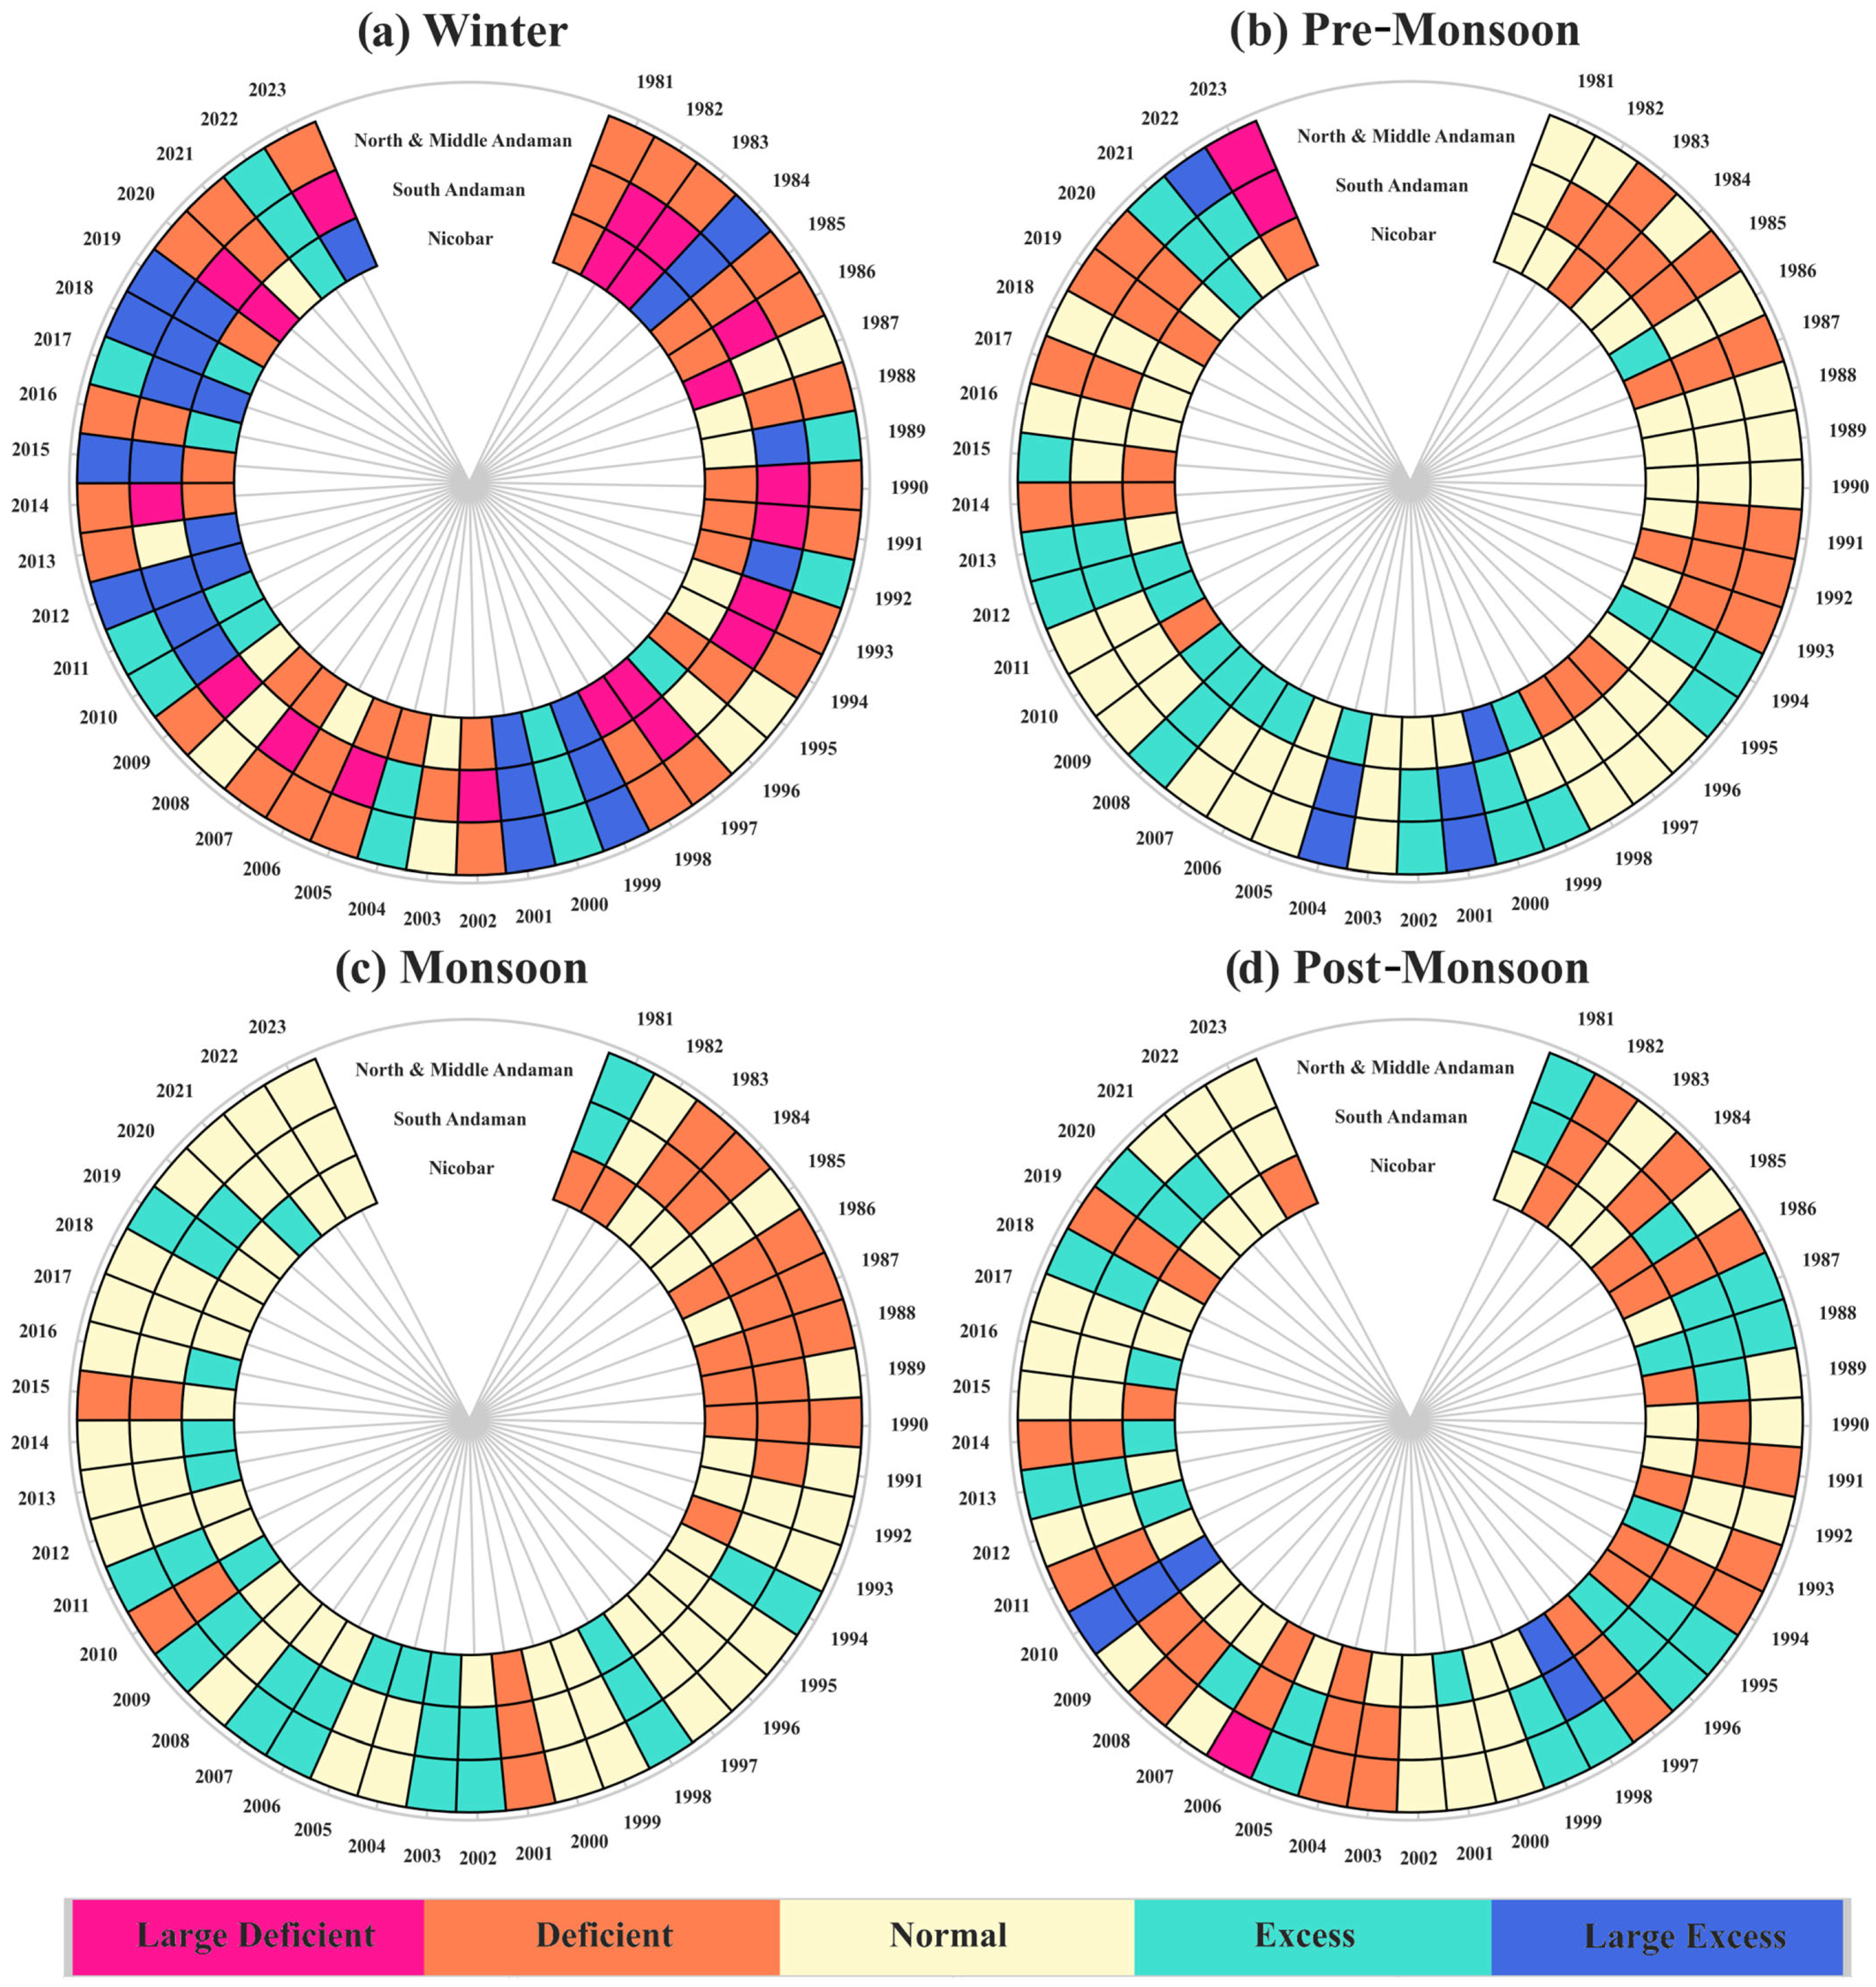
3.2. Precipitation Variability
3.3. Precipitation Categorization
3.4. Seasonal Precipitation Trends
3.5. Annual Precipitation Trends (PRCPTOT)
3.6. Total Annual Rainy Days
3.7. Intensity-Based Indices
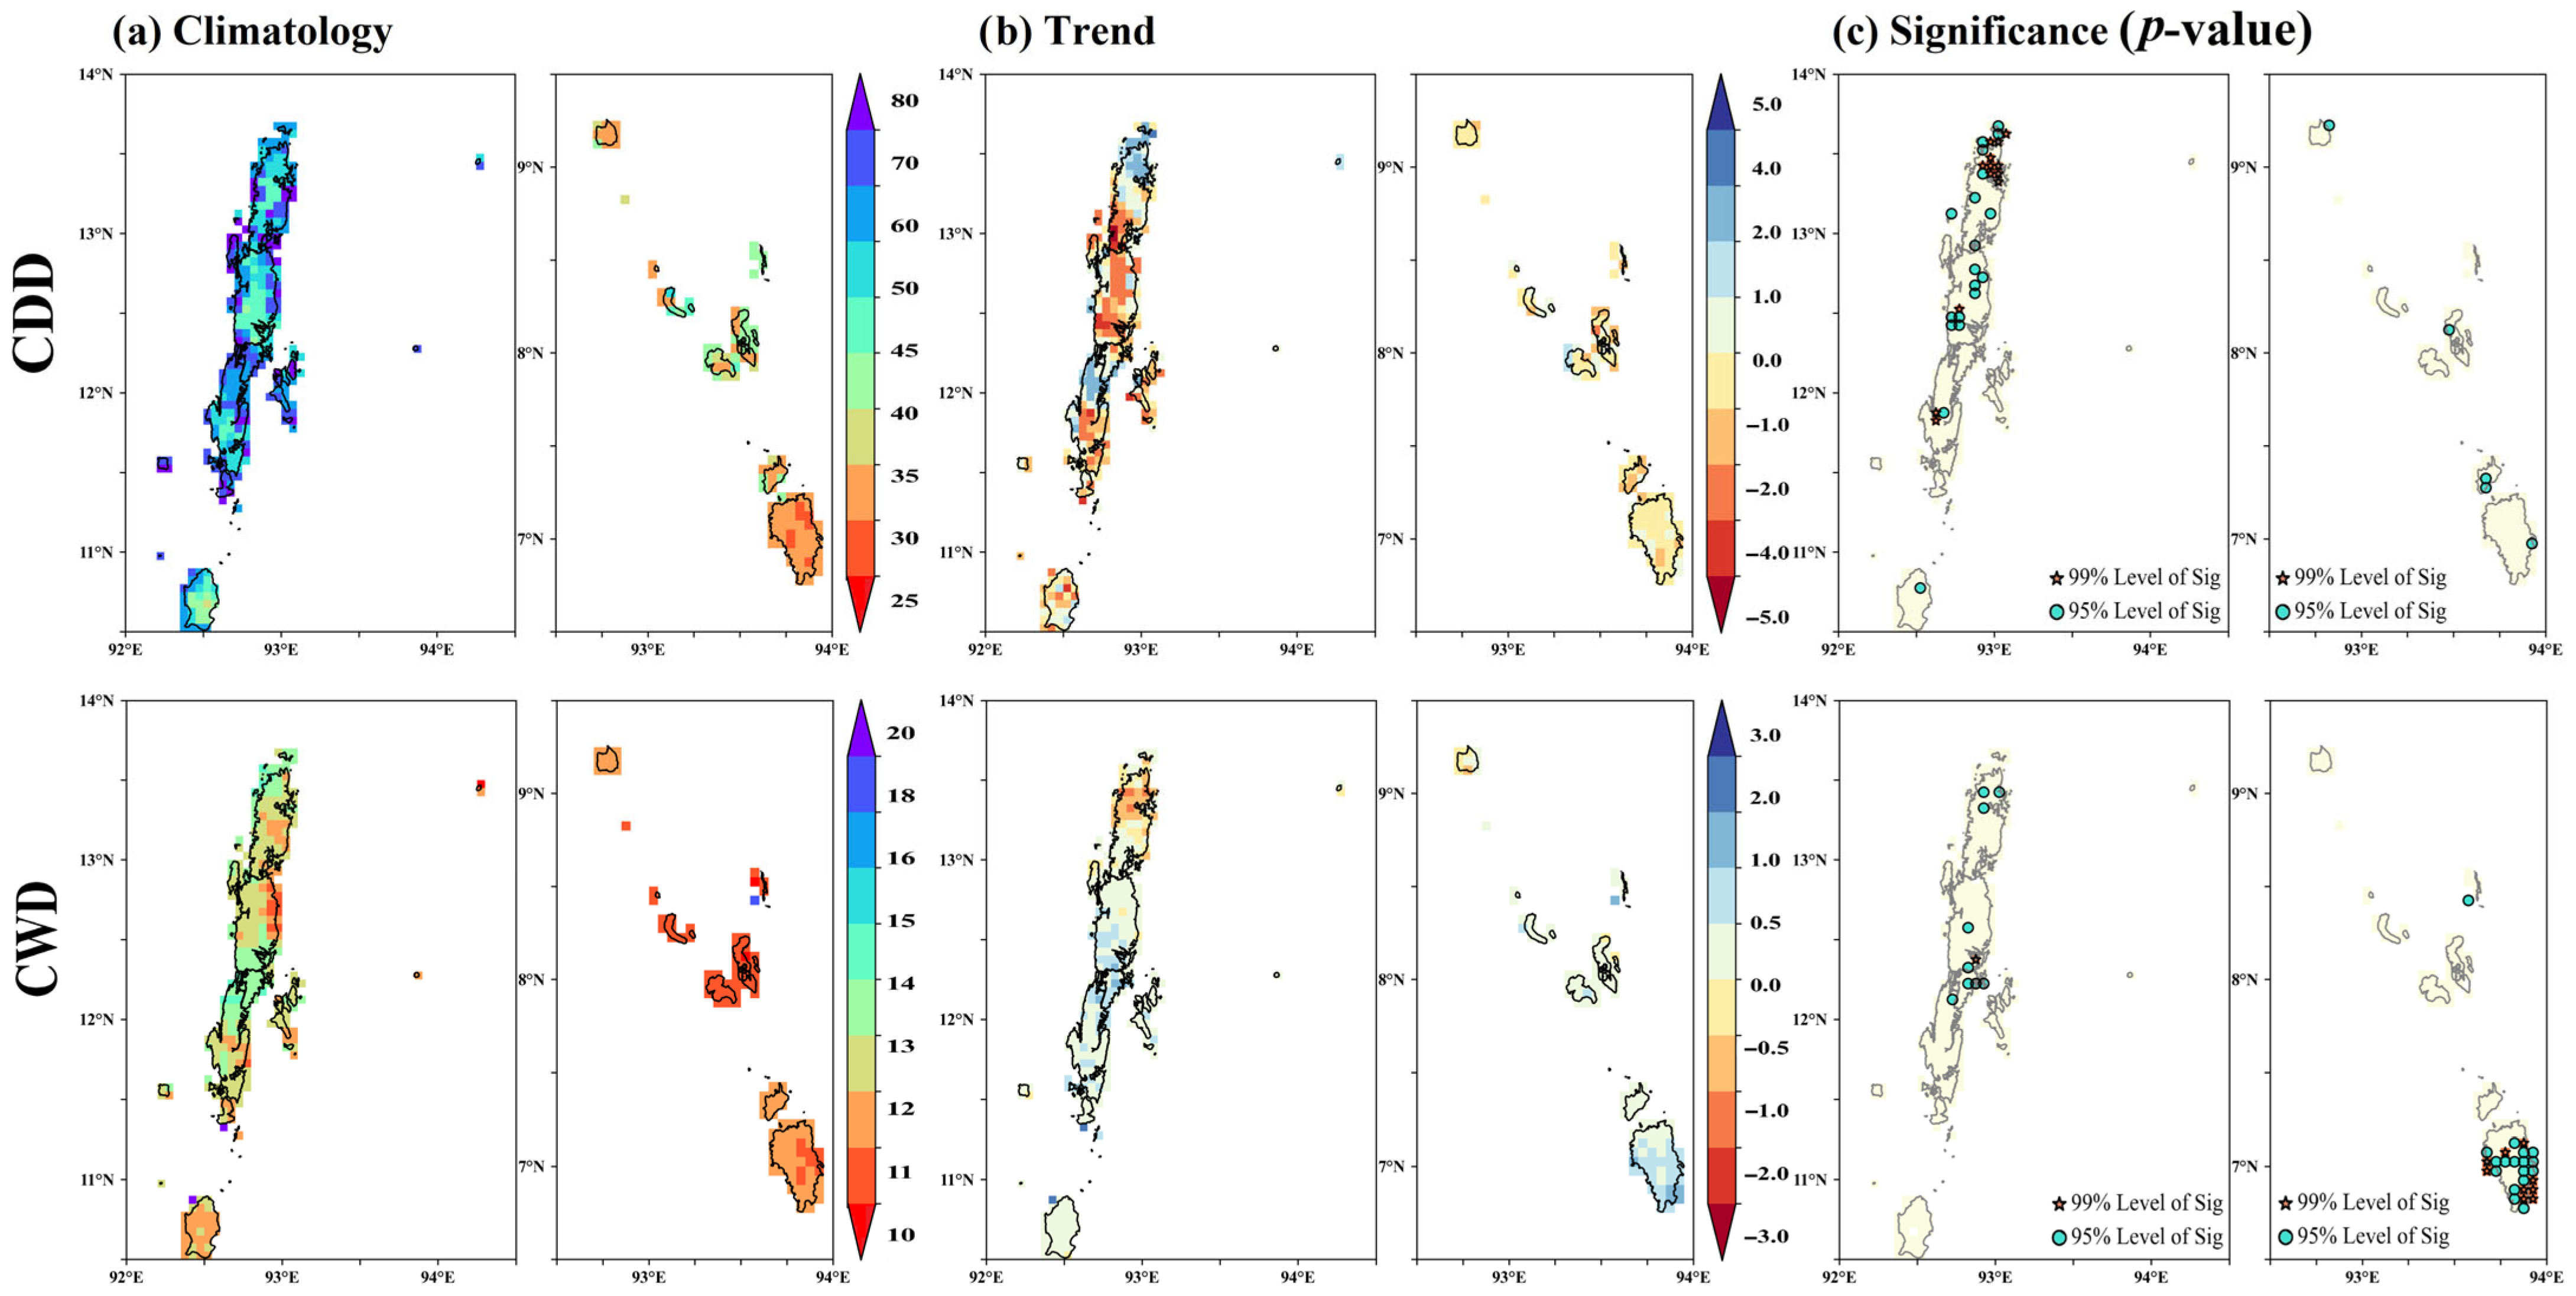
3.8. Persistence and Duration Indices (CDDs and CWDs)
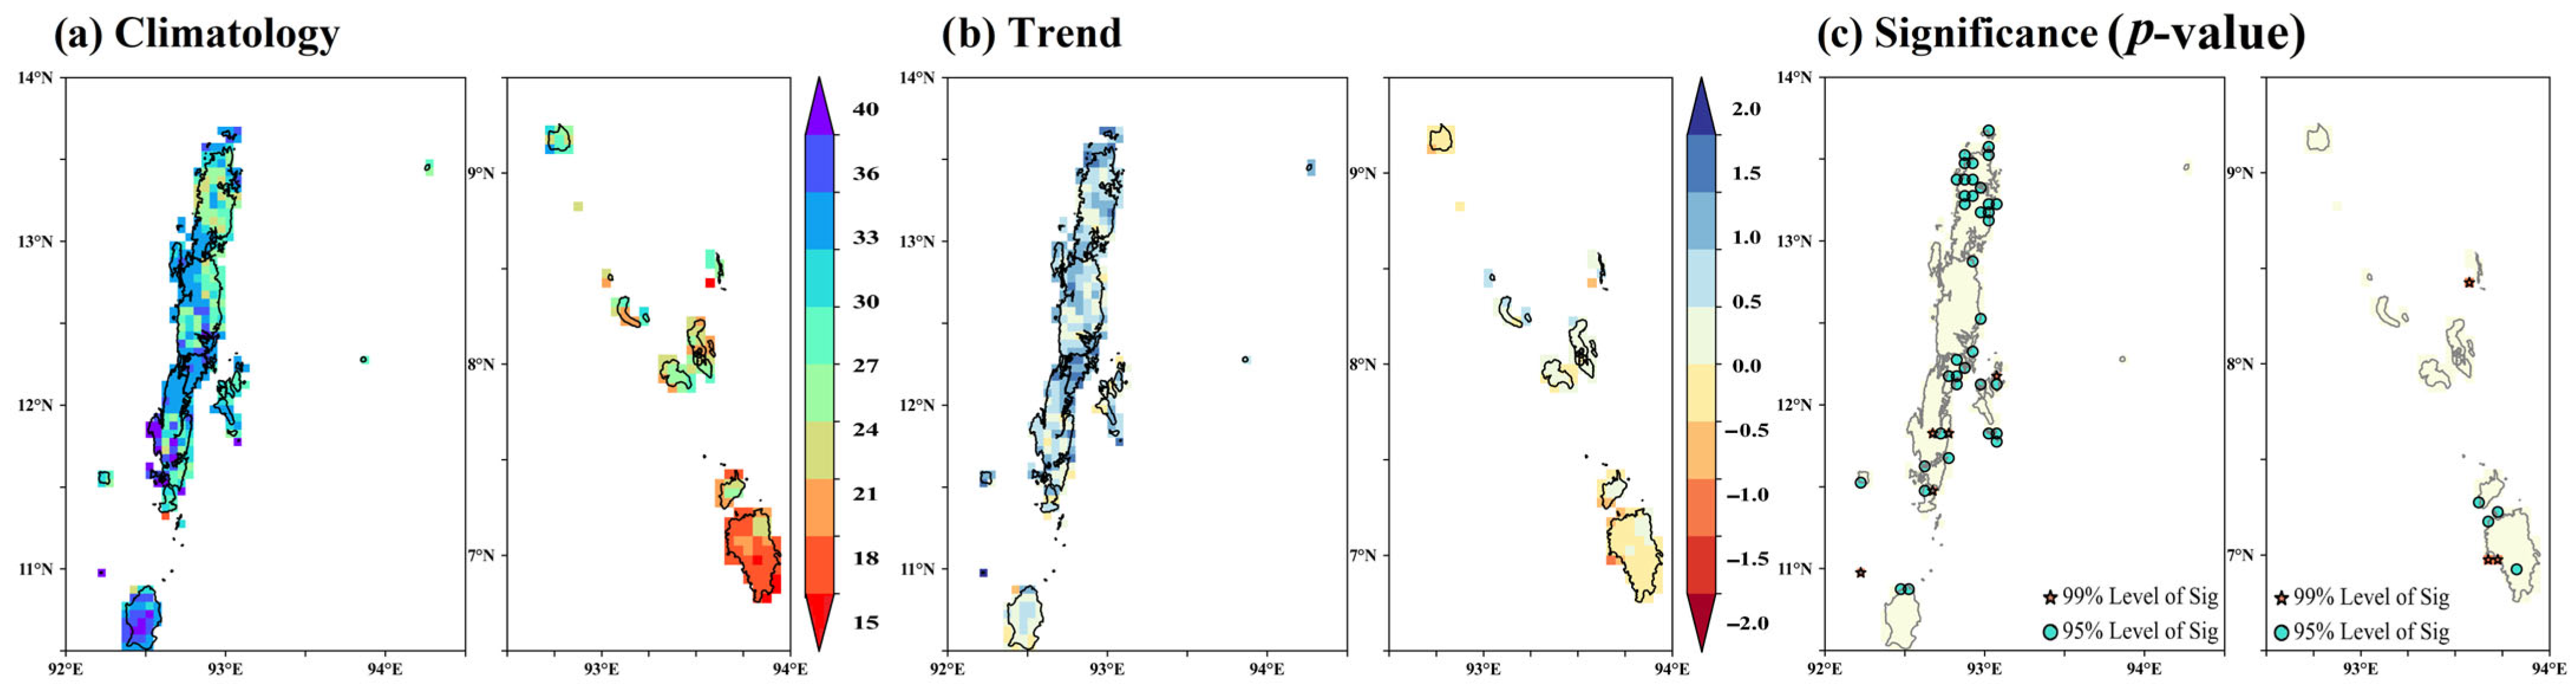
3.9. Magnitude and Distribution Indices (Rx1day, Rx5day, and SDII)
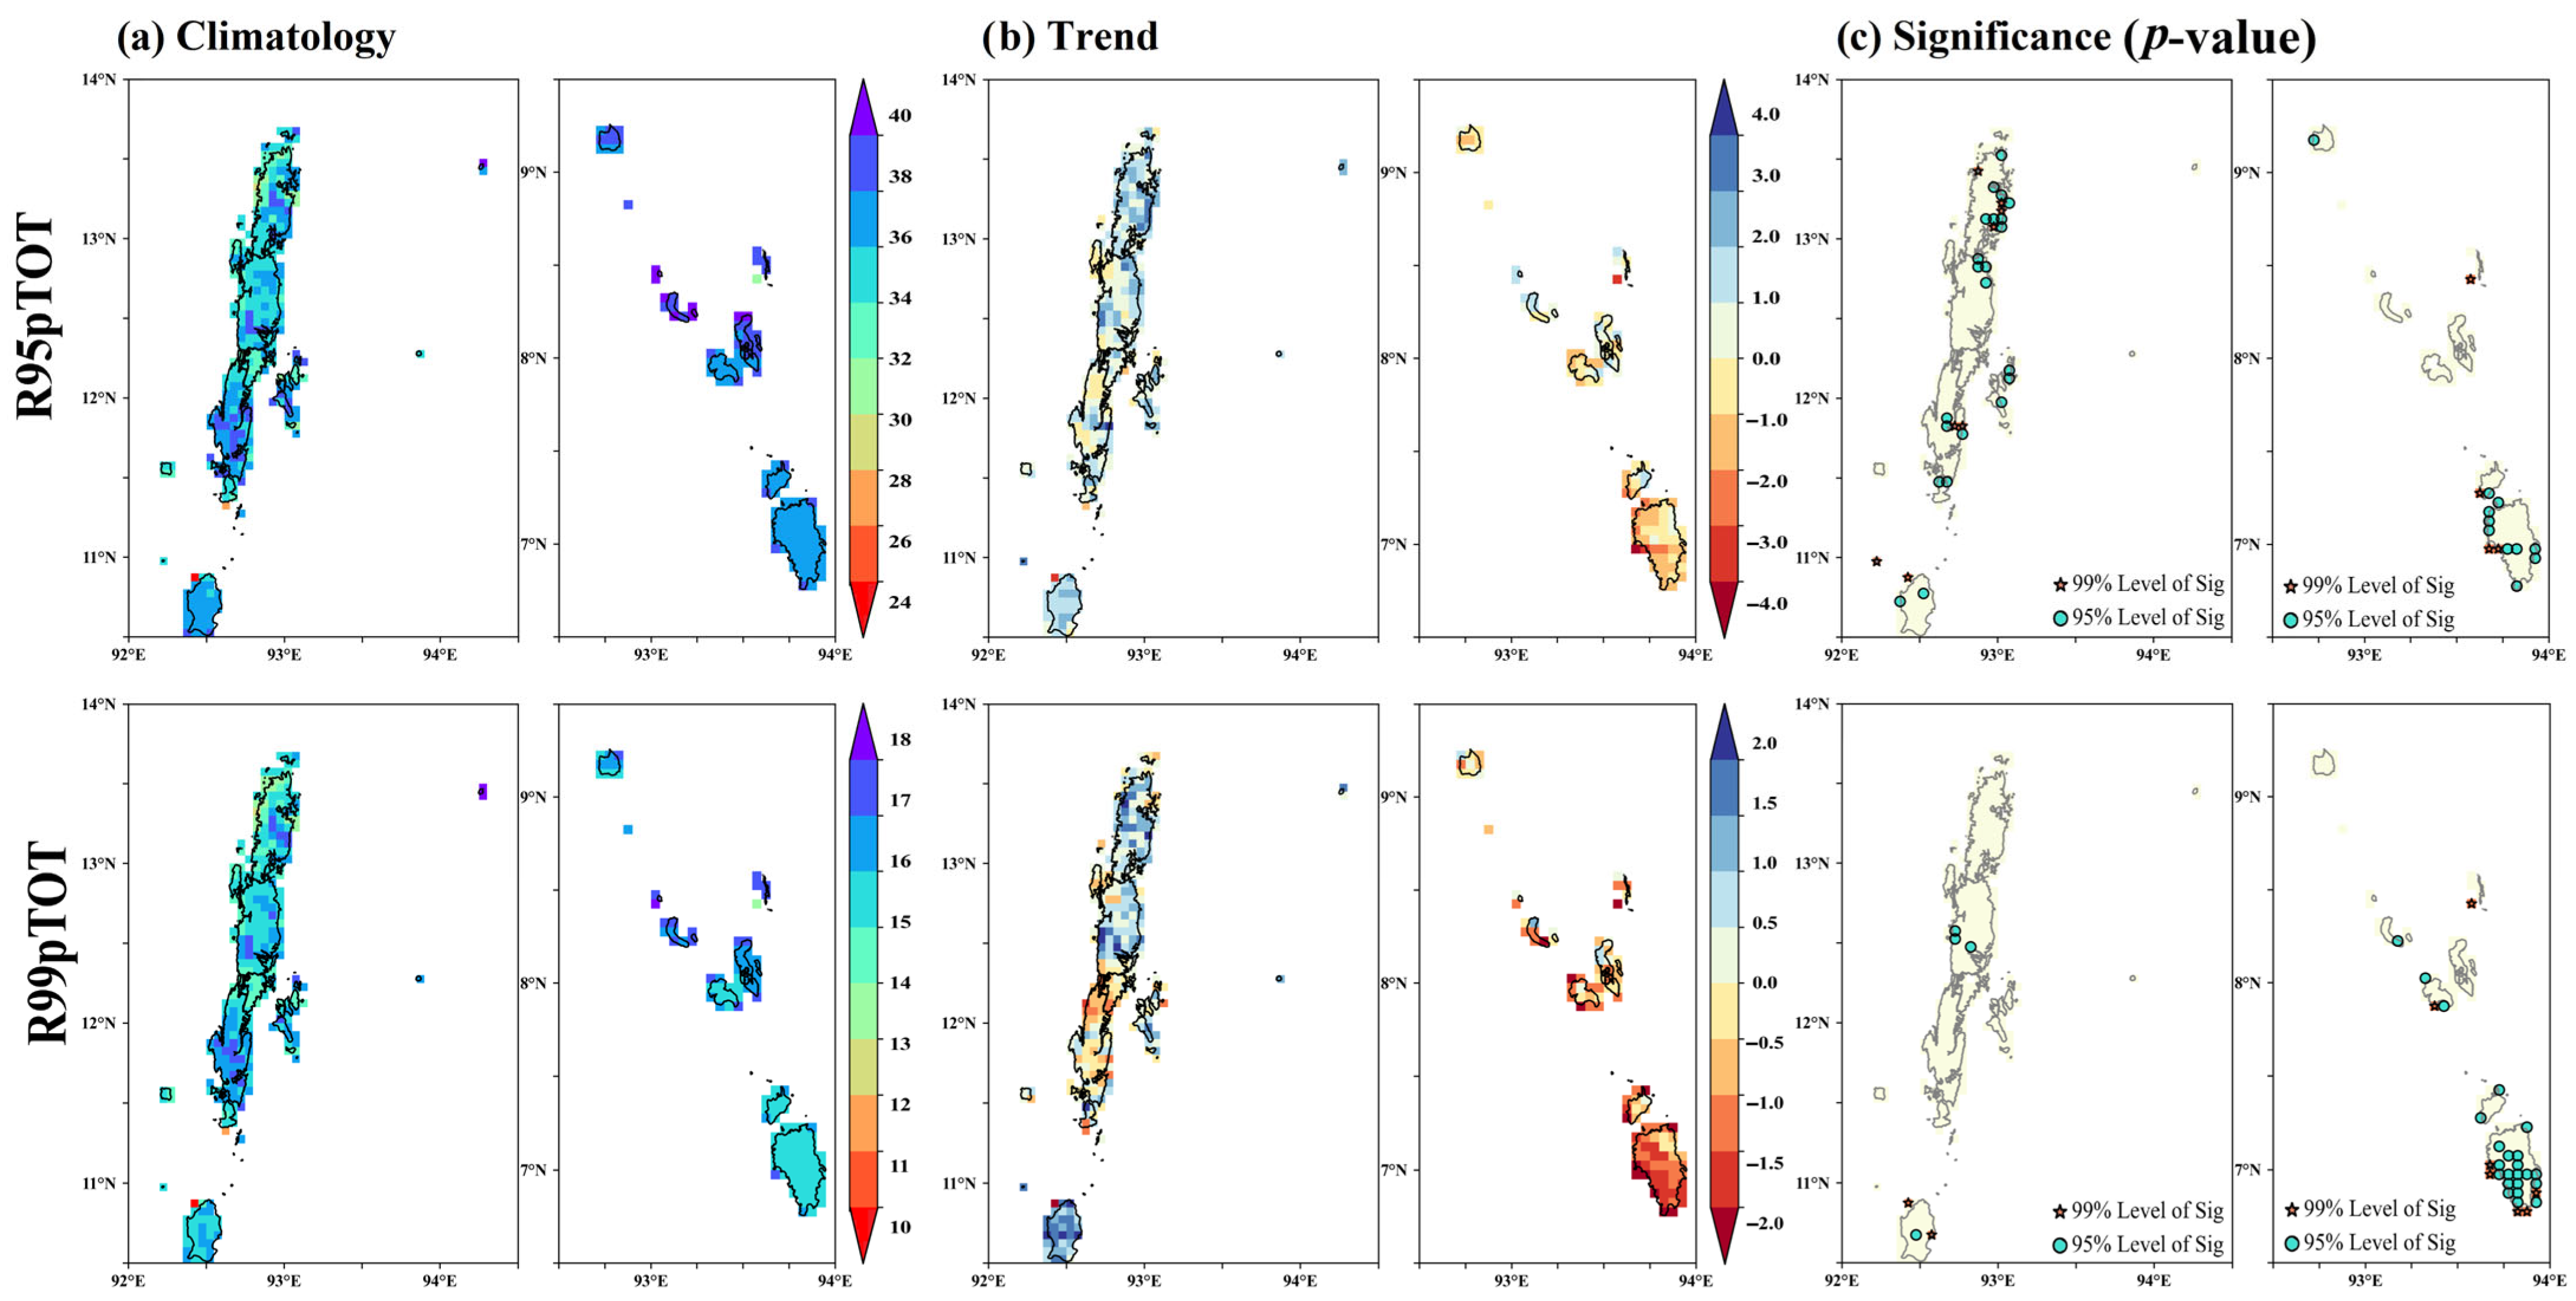
3.10. Percentile Threshold Indices (R95pTOT and R99pTOT)
4. Conclusions
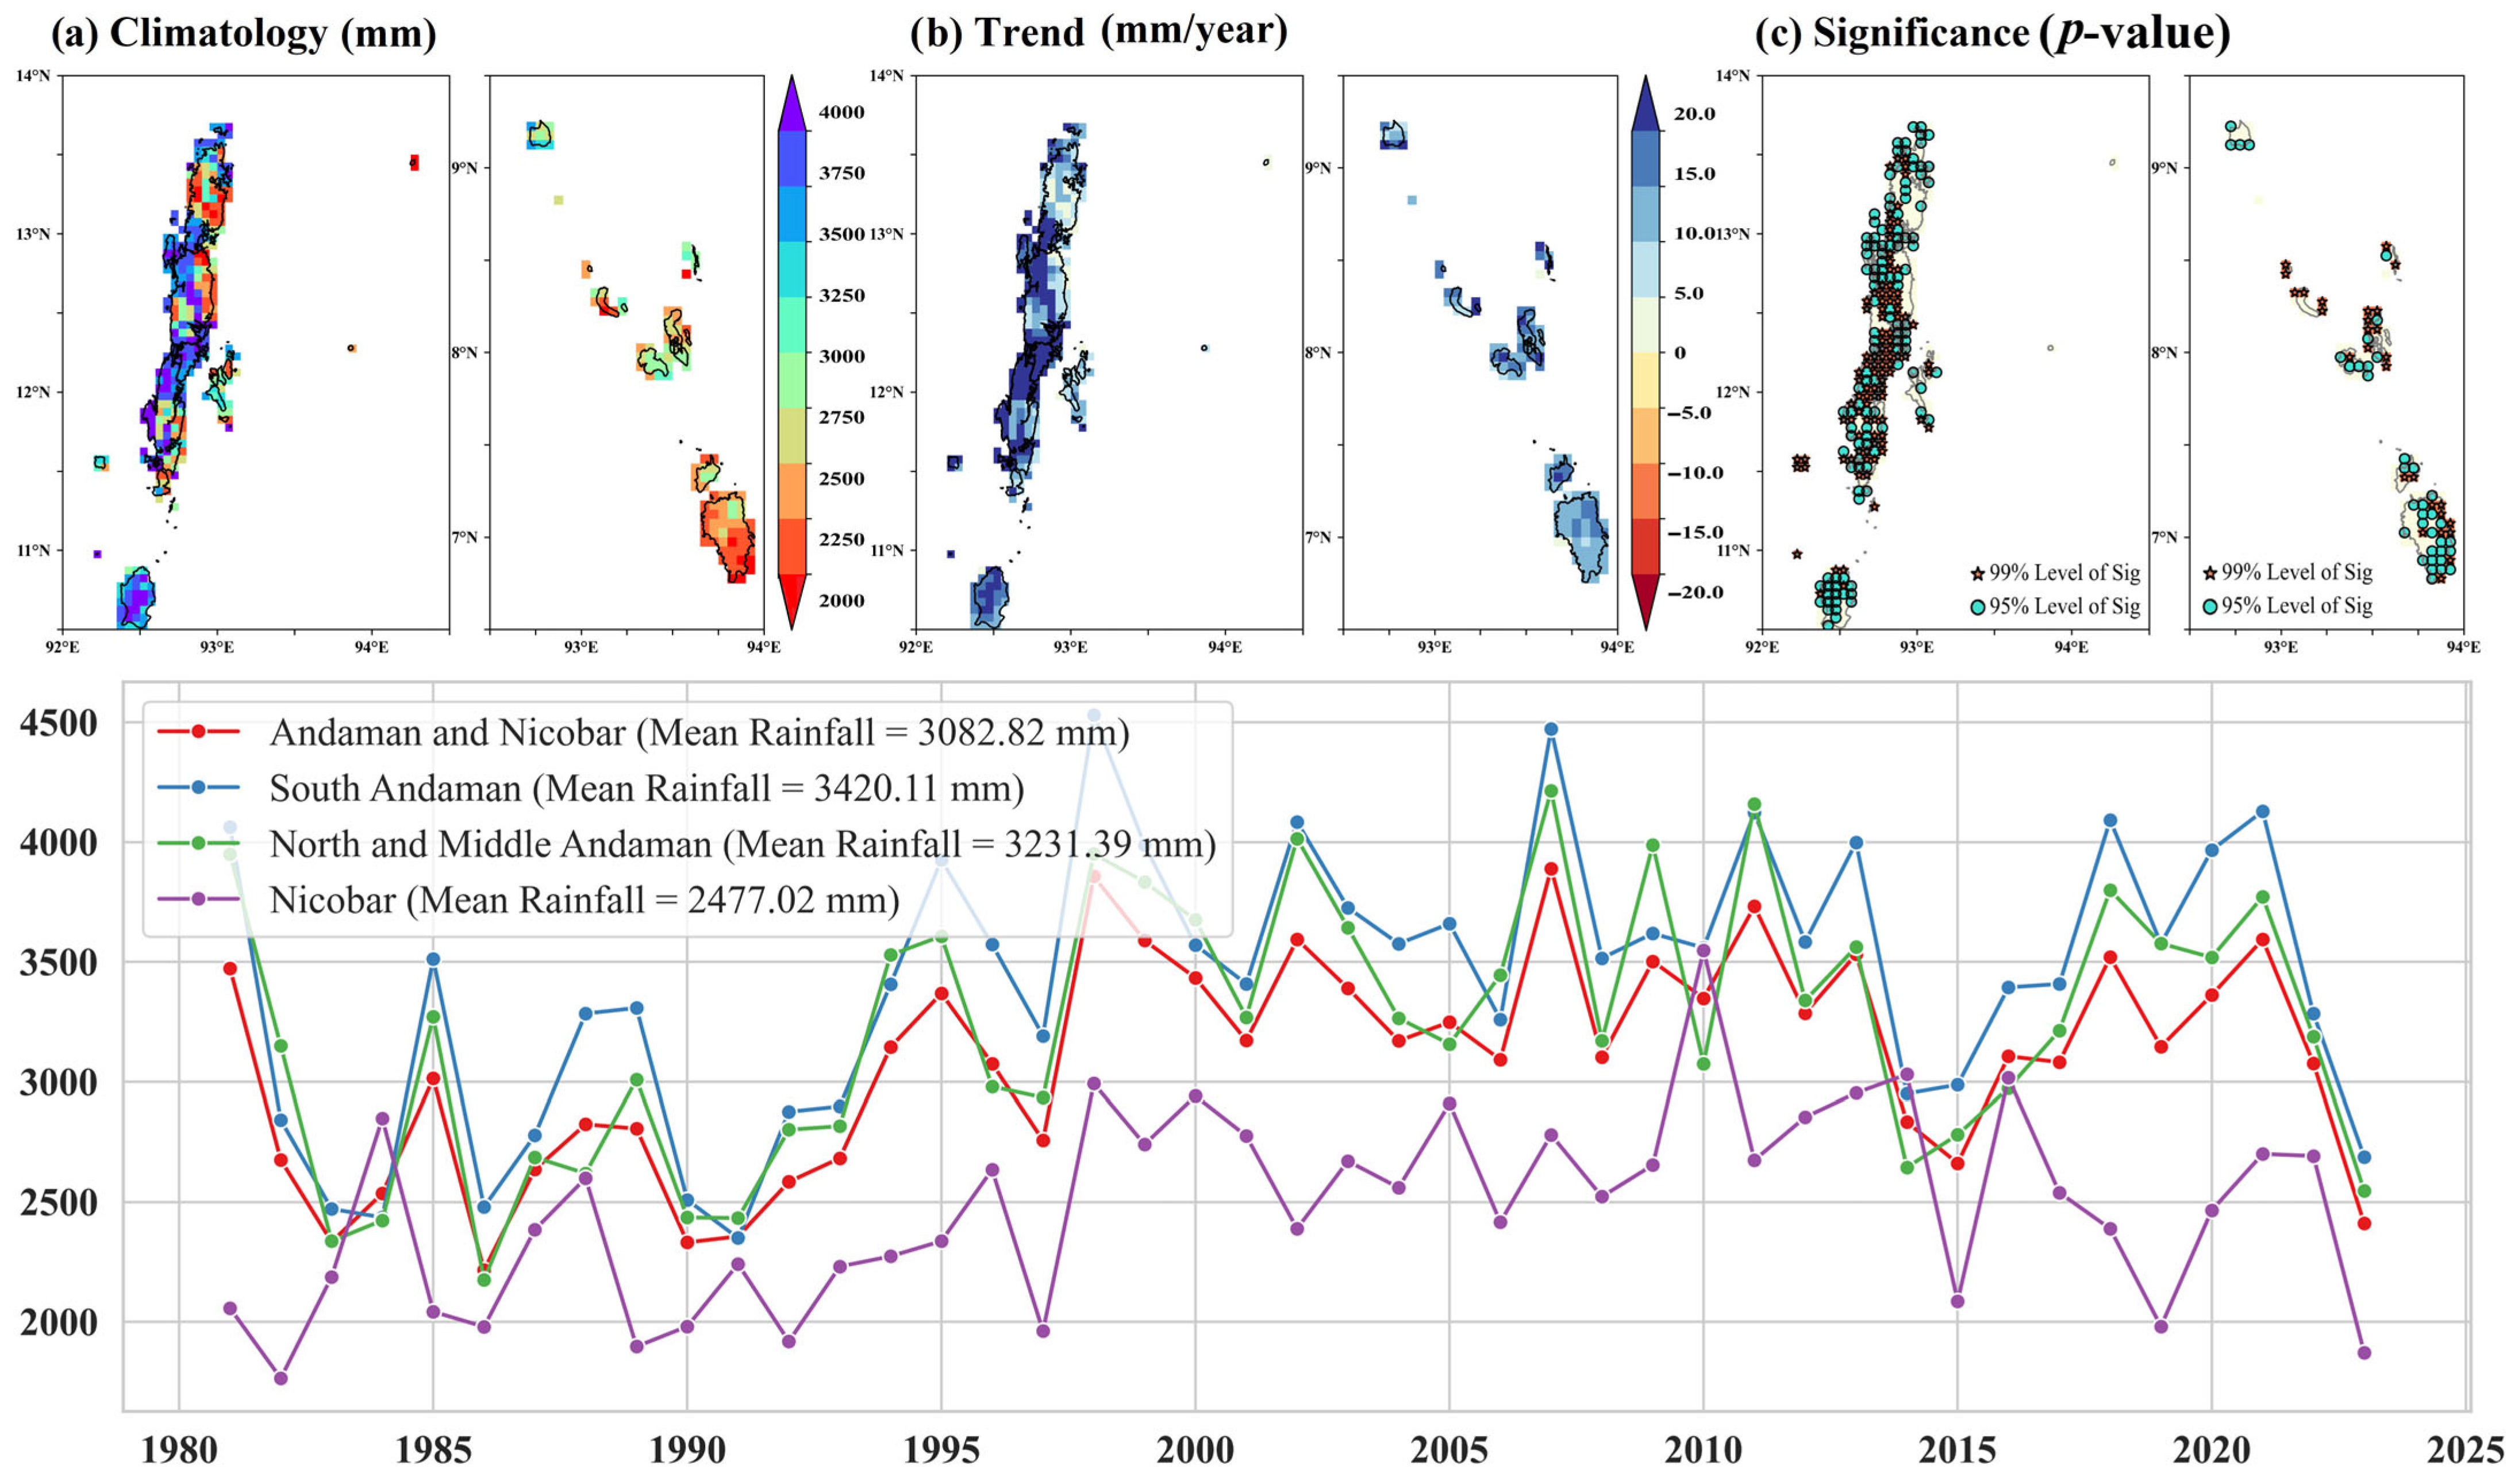
- Significant increasing trends in mean precipitation are found over most parts of Nicobar during the winter and post-monsoon seasons, as well as over most parts of Andaman during the monsoon season. Additionally, some parts of the islands exhibited increasing trends in mean precipitation during all other seasons. On an annual timescale, most parts of Andaman and Nicobar showed significant increasing trends in mean precipitation and the number of rainy days (precipitation ≥ 1 mm).
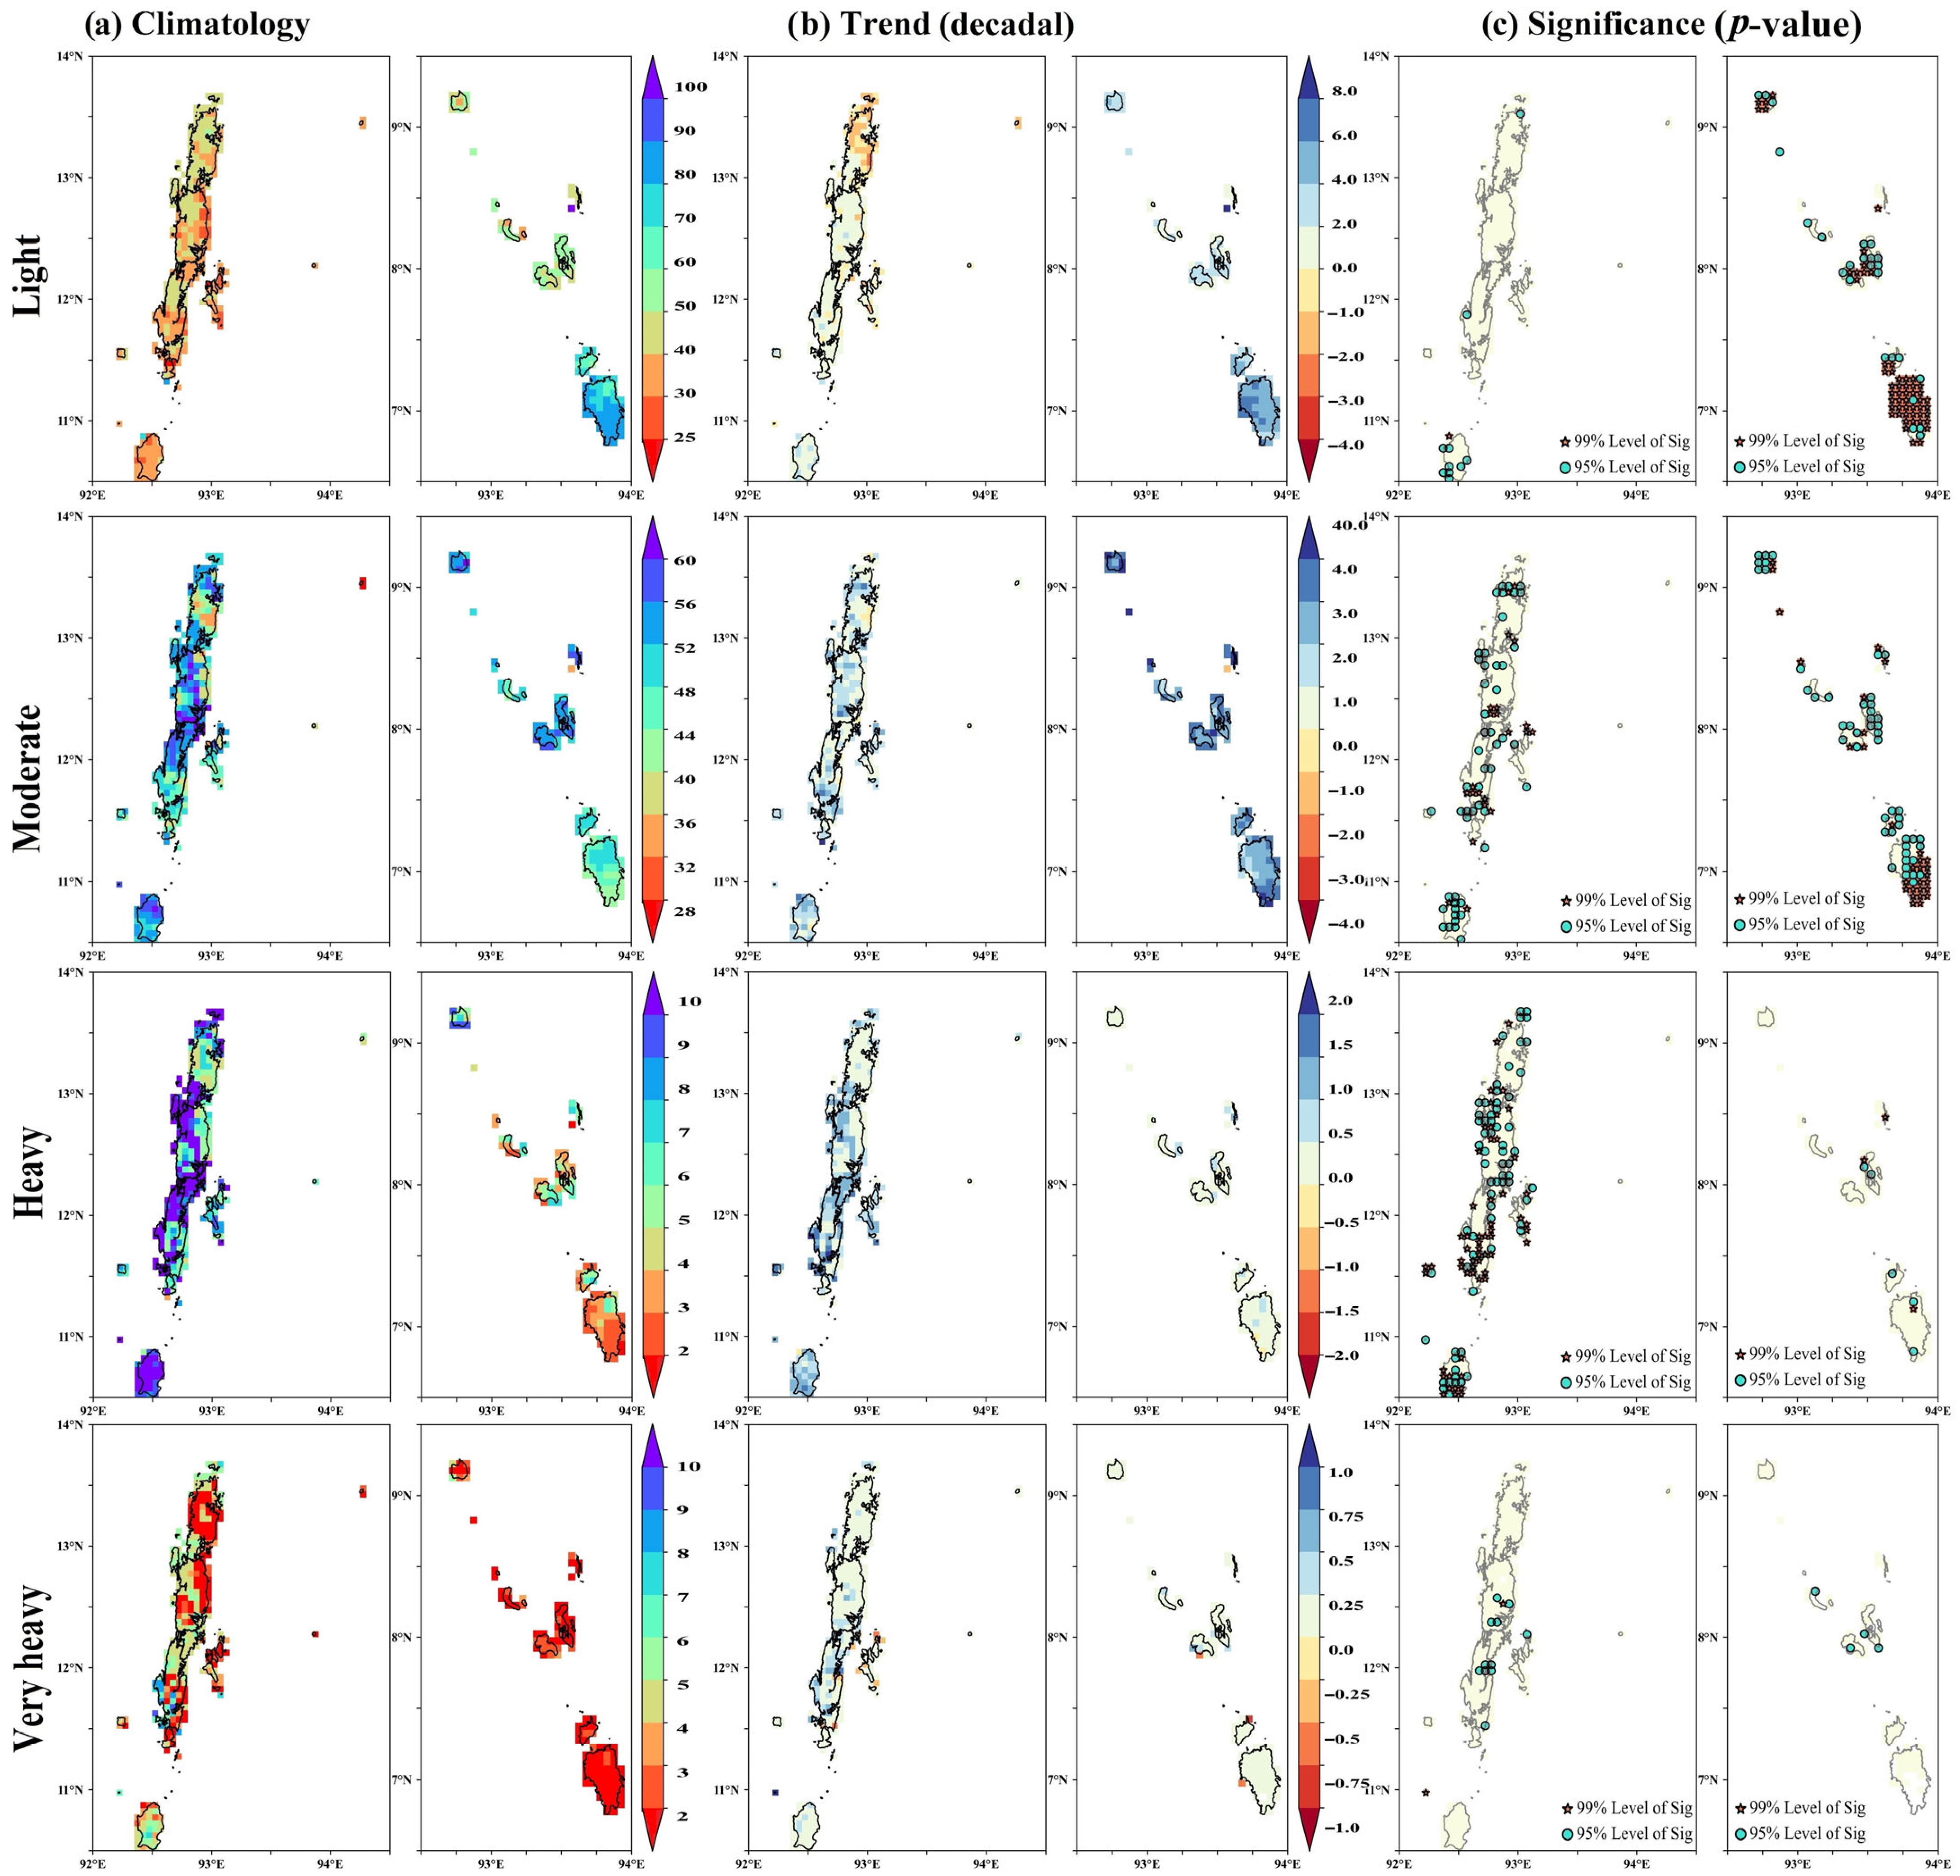
- It is observed that the light-to-moderate precipitation events occur more frequently than heavy precipitation events across the islands, although heavy precipitation is more frequent in Andaman than in Nicobar.
- A significant increase in the frequency of light-to-moderate precipitation (i.e., between 2.5 mm and 64.4 mm) events is noted across most of Nicobar, while parts of Andaman showed a rise in the frequency of moderate-to-heavy precipitation (i.e., between 64.4 mm and 115.5 mm) events. Additionally, some areas of central Andaman and Nicobar experienced a significant rise in the frequency of very heavy precipitation (precipitation ≥ 115.6 mm) events.
- In general, Andaman experienced a higher intensity of extreme precipitation (i.e., Rx1day and Rx5day) compared to Nicobar, although only a few parts of Andaman (mostly in central Andaman) and Nicobar (mostly in southern Nicobar) showed increases in precipitation during both indices.
Author Contributions
Funding
Institutional Review Board Statement
Informed Consent Statement
Data Availability Statement
Acknowledgments
Conflicts of Interest
Abbreviations
| Lat | Latitude |
| Lon | Longitude |
| CDDs | Cumulative Dry Days |
| CWDs | Cumulative Wet Days |
| Rx1day | Annual wettest 1-day precipitation |
| Rx5day | Annual wettest 5-day precipitation |
| SDII | Simple precipitation intensity index |
| R95pTOT | Annual total precipitation when daily precipitation > 95th percentile |
| R99pTOT | Annual total precipitation when daily precipitation > 99th percentile |
| Sig | Significance |
References
- Adamala, S.; Velmurugan, A. Trend Analysis of Rainfall and Air Temperature in Andaman & Nicobar Islands, India. J. Indian Soc. Coast. Agric. Res. 2020, 38. [Google Scholar]
- Sridhar, R. Coastal Zones of Islands: Comparative Reflections between Two Oceanic Island Groups from Bay of Bengal and Arabian Sea, India. Int. J. Ecol. Environ. Sci. 2018, 44, 145–153. [Google Scholar]
- Shankar, S.V.; Dharanirajan, K.; Narshimulu, G. Cyclone Vulnerability Zonation of Southern Part of South Andaman, India Using Multi-Criteria Weighted Overlay Analysis Techniques; NISCAIR-CSIR: New Delh, India, 2015; Volume 44, pp. 1181–1190. [Google Scholar]
- Tripathi, P. The Vulnerable Andaman and Nicobar Islands: A Study of Disasters and Response; Routledge: Delhi, India, 2018; ISBN 1351059475. [Google Scholar]
- Sivaperuman, C.; Velmurugan, A.; Singh, A.K.; Jaisankar, I. Biodiversity and Climate Change Adaptation in Tropical Islands; Academic Press: Cambridge, MA, USA, 2018; ISBN 0128130652. [Google Scholar]
- Marks, E.; Hickman, C.; Pihkala, P.; Clayton, S.; Lewandowski, E.R.; Mayall, E.E.; Wray, B.; Mellor, C.; van Susteren, L. Young People’s Voices on Climate Anxiety, Government Betrayal and Moral Injury: A Global Phenomenon. Gov. Betrayal Moral Inj. Glob. Phenom. 2021, 5, e863–e873. [Google Scholar]
- Brunsell, N.A.; Jones, A.R.; Jackson, T.L.; Feddema, J.J. Seasonal Trends in Air Temperature and Precipitation in IPCC AR4 GCM Output for Kansas, USA: Evaluation and Implications. Int. J. Climatol. 2010, 30, 1178–1193. [Google Scholar] [CrossRef]
- Chauhan, A.S.; Singh, S.; Maurya, R.K.S.; Danodia, A. Impact of Monsoon Teleconnections on Regional Rainfall and Vegetation Dynamics in Haryana, India. Environ. Monit. Assess. 2022, 194, 485. [Google Scholar] [CrossRef]
- Chauhan, A.S.; Singh, S.; Maurya, R.K.S.; Rani, A.; Danodia, A. Spatio-Temporal Trend Analysis and Future Projections of Precipitation at Regional Scale: A Case Study of Haryana, India. J. Water Clim. Change 2022, 13, 2143–2170. [Google Scholar] [CrossRef]
- Machiwal, D.; Gupta, A.; Jha, M.K.; Kamble, T. Analysis of Trend in Temperature and Rainfall Time Series of an Indian Arid Region: Comparative Evaluation of Salient Techniques. Theor. Appl. Climatol. 2019, 136, 301–320. [Google Scholar] [CrossRef]
- Praveenkumar, C.; Jothiprakash, V. Spatio-Temporal Trend and Homogeneity Analysis of Gridded and Gauge Precipitation in Indravati River Basin, India. J. Water Clim. Change 2020, 11, 178–199. [Google Scholar] [CrossRef]
- Bisht, D.S.; Chatterjee, C.; Raghuwanshi, N.S.; Sridhar, V. Spatio-Temporal Trends of Rainfall across Indian River Basins. Theor. Appl. Climatol. 2018, 132, 419–436. [Google Scholar] [CrossRef]
- Chang, X.; Xu, Z.; Zhao, G.; Cheng, T.; Song, S. Spatial and Temporal Variations of Precipitation during 1979–2015 in Jinan City, China. J. Water Clim. Change 2018, 9, 540–554. [Google Scholar] [CrossRef]
- Dandodia, A.; Sastri, A.S. Impact of Rainfall Variability on Water Resources of Chhattisgarh State with Special Reference of Mann-Kendall Test Statistics on the Context of Climate Change. Ecol. Environ. Conserv. 2015, 21, 125–132. [Google Scholar]
- Yadav, R.E.H.; Tripathi, S.K.; Pranuthi, G.; Dubey, S.K. Trend Analysis by Mann-Kendall Test for Precipitation and Temperature for Thirteen Districts of Uttarakhand. J. Agrometeorol. 2014, 16, 164–171. [Google Scholar] [CrossRef]
- Adarsh, S.; Reddy, M.J. Trend Analysis of Rainfall in Four Meteorological Subdivisions of Southern India Using Nonparametric Methods and Discrete Wavelet Transforms. Int. J. Climatol. 2015, 35. [Google Scholar] [CrossRef]
- Deshpande, N.R.; Kothawale, D.R.; Kulkarni, A. Changes in Climate Extremes over Major River Basins of India. Int. J. Climatol. 2016, 36, 4548–4559. [Google Scholar] [CrossRef]
- Dubey, S.K.; Sharma, D. Spatio-Temporal Trends and Projections of Climate Indices in the Banas River Basin, India. Environ. Process. 2018, 5, 743–768. [Google Scholar] [CrossRef]
- Rao, G.V.; Reddy, K.V.; Srinivasan, R.; Sridhar, V.; Umamahesh, N.V.; Pratap, D. Spatio-Temporal Analysis of Rainfall Extremes in the Flood-Prone Nagavali and Vamsadhara Basins in Eastern India. Weather Clim. Extrem. 2020, 29, 100265. [Google Scholar]
- Vittal, H.; Karmakar, S.; Ghosh, S. Diametric Changes in Trends and Patterns of Extreme Rainfall over India from Pre-1950 to Post-1950. Geophys. Res. Lett. 2013, 40, 3253–3258. [Google Scholar] [CrossRef]
- Kundu, S.K.; Mondal, T.K. Analysis of Long-Term Rainfall Trends and Change Point in West Bengal, India. Theor. Appl. Climatol. 2019, 138, 1647–1666. [Google Scholar] [CrossRef]
- Malik, A.; Kumar, A.; Guhathakurta, P.; Kisi, O. Spatial-Temporal Trend Analysis of Seasonal and Annual Rainfall (1966–2015) Using Innovative Trend Analysis Method with Significance Test. Arab. J. Geosci. 2019, 12, 328. [Google Scholar] [CrossRef]
- Malik, A.; Kumar, A. Spatio-Temporal Trend Analysis of Rainfall Using Parametric and Non-Parametric Tests: Case Study in Uttarakhand, India. Theor. Appl. Climatol. 2020, 140, 183–207. [Google Scholar] [CrossRef]
- Sridhar, L.; Pai, D.S. Analysis of Long-Term Trends of Rainfall and Extreme Rainfall Events over Andaman & Nicobar and Lakshadweep Islands of India. MAUSAM 2024, 75, 479–500. [Google Scholar] [CrossRef]
- Kumar, N.; Yadav, B.P.; Tyagi, A.; Jaswal, A.K. Trend and Spatial Distribution of Rainfall & Rainy Days over Andaman & Nicobar Islands. Nat. Hazards 2012, 63, 575–587. [Google Scholar]
- Velmurugan, A.; Roy, S.D.; Krishnan, P.; Swarnam, T.P.; Jaisankar, I.; Singh, A.K.; Biswas, T.K. Climate Change and Nicobar Islands: Impacts and Adaptation Strategies. J. Andaman Sci. Assoc. 2015, 20, 7–18. [Google Scholar]
- Roy, S.; Chakravarty, N. Rainfall Analysis by Using Mann-Kendall Trend, Sen’s Slope and Variability at Six Stations of Andaman & Nicobar Islands. 2021. [Google Scholar] [CrossRef]
- Zhang, T.; Cheng, C.; Wu, X. Mapping the Spatial Heterogeneity of Global Land Use and Land Cover from 2020 to 2100 at a 1 Km Resolution. Sci. Data 2023, 10, 748. [Google Scholar] [CrossRef]
- CHIRPS: Rainfall Estimates from Rain Gauge and Satellite Observations. Available online: https://www.chc.ucsb.edu/data/chirps (accessed on 18 January 2025).
- Paredes-Trejo, F.J.; Barbosa, H.A.; Lakshmi Kumar, T.V. Validating CHIRPS-Based Satellite Precipitation Estimates in Northeast Brazil. J. Arid. Environ. 2017, 139, 26–40. [Google Scholar] [CrossRef]
- Shen, Z.; Yong, B.; Gourley, J.J.; Qi, W.; Lu, D.; Liu, J.; Ren, L.; Hong, Y.; Zhang, J. Recent Global Performance of the Climate Hazards Group Infrared Precipitation (CHIRP) with Stations (CHIRPS). J. Hydrol. 2020, 591, 125284. [Google Scholar] [CrossRef]
- Bai, L.; Shi, C.; Li, L.; Yang, Y.; Wu, J. Accuracy of CHIRPS Satellite-Rainfall Products over Mainland China. Remote Sens. 2018, 10, 362. [Google Scholar] [CrossRef]
- Du, H.; Tan, M.L.; Zhang, F.; Chun, K.P.; Li, L.; Kabir, M.H. Evaluating the Effectiveness of CHIRPS Data for Hydroclimatic Studies. Theor. Appl. Climatol. 2024, 155, 1519–1539. [Google Scholar] [CrossRef]
- Dinku, T.; Funk, C.; Peterson, P.; Maidment, R.; Tadesse, T.; Gadain, H.; Ceccato, P. Validation of the CHIRPS Satellite Rainfall Estimates over Eastern Africa. Q. J. R. Meteorol. Soc. 2018, 144, 292–312. [Google Scholar] [CrossRef]
- Katsanos, D.; Retalis, A.; Michaelides, S. Validation of a High-Resolution Precipitation Database (CHIRPS) over Cyprus for a 30-Year Period. Atmos. Res. 2016, 169, 459–464. [Google Scholar] [CrossRef]
- Kothawale, D.R.; Munot, A.A. Probabilities of Excess and Deficient Southwest Monsoon Rainfall over Different Meteorological Sub-Divisions of India. J. Earth Syst. Sci. 1998, 107, 107–119. [Google Scholar] [CrossRef]
- Mann, H.B. Nonparametric Tests Against Trend. Econometrica 1945, 13, 245. [Google Scholar] [CrossRef]
- Kendall, M.G. Rank Correlation Measures; The University of Michigan: London, UK, 1975; Volume 202. [Google Scholar]
- Sen, P.K. Estimates of the Regression Coefficient Based on Kendall’s Tau. J. Am. Stat. Assoc. 1968, 63, 1379–1389. [Google Scholar] [CrossRef]
- Karl, T.R.; Nicholls, N.; Ghazi, A. Clivar/GCOS/WMO Workshop on Indices and Indicators for Climate Extremes Workshop Summary. Weather Clim. Extrem. Changes Var. Perspect. Insur. Ind. 1999, 42, 3–7. [Google Scholar]
- Frich, P.; Alexander, L.V.; Della-Marta, P.; Gleason, B.; Haylock, M.; Tank, A.M.G.K.; Peterson, T. Observed Coherent Changes in Climatic Extremes during the Second Half of the Twentieth Century. Clim. Res. 2002, 19, 193–212. [Google Scholar] [CrossRef]
- Velmurugan, A.; Subramani, T.; Swarnam, T.P.; Biswas, T.K.; Pandey, S.K. Climate of Andaman and Nicobar Islands: Long-Term Pattern Analysis. J. Andaman Sci. Assoc. 2018, 23, 1–7. [Google Scholar]
- Sharma, P.J.; Loliyana, V.D.; Resmi, S.R.; Timbadiya, P.V.; Patel, P.L. Spatiotemporal Trends in Extreme Rainfall and Temperature Indices over Upper Tapi Basin, India. Theor. Appl. Climatol. 2018, 134, 1329–1354. [Google Scholar] [CrossRef]


| Station ID | Station Name | Station Coordinates | Daily Precipitation Correlation | Monthly Precipitation Correlation | Annual Precipitation Correlation | |
|---|---|---|---|---|---|---|
| Lat (°N) | Lon (°E) | |||||
| 43309 | Mayabunder | 12.92 | 92.92 | 0.308 | 0.682 | 0.867 |
| 43310 | Long Island | 12.42 | 92.93 | 0.298 | 0.701 | 0.805 |
| 43333 | Port Blair | 11.67 | 92.72 | 0.379 | 0.772 | 0.662 |
| 43364 | HutBay | 10.74 | 92.55 | 0.260 | 0.597 | 0.886 |
| 43367 | Car Nicobar | 9.17 | 92.83 | 0.327 | 0.736 | 0.754 |
| 43382 | Nancowry | 7.98 | 93.53 | 0.244 | 0.537 | 0.938 |
| Serial Number | Index | Definition |
|---|---|---|
| Intensity-Based Indices | ||
| 1 | Annual count of days when precipitation is 2.5 mm to 15.5 mm for light precipitation | Let RRij be the daily precipitation amount on day i in period j. Count the number of days where 2.5 mm ≤ RRij ≥ 15.5 mm |
| 2 | Annual count of days when precipitation is 15.6 mm to 64.4 mm for moderate precipitation | Let RRij be the daily precipitation amount on day i in period j. Count the number of days where 15.6 mm ≤ RRij ≥ 64.4 mm |
| 3 | Annual count of days when precipitation is 64.5 mm to 115.5 mm for heavy precipitation | Let RRij be the daily precipitation amount on day i in period j. Count the number of days where 64.5 mm ≤ RRij ≥ 115.5 mm |
| 4 | Annual count of days when precipitation is greater than 115.6 mm for very Heavy precipitation | Let RRij be the daily precipitation amount on day i in period j. Count the number of days where RRij ≥ 115.6 mm |
| Persistence and Duration Indices | ||
| 5 | Cumulative Dry Days (CDDs) showing maximum length of dry spell, maximum number of consecutive days with daily precipitation less than 2.5 mm | Let RRij be the daily precipitation amount on day i in period j. Count the largest number of consecutive days where RRij < 2.5 mm |
| 6 | Cumulative Wet Days (CWDs) showing maximum length of wet spell, maximum number of consecutive days with daily precipitation greater than or equal to 2.5 mm | Let RRij be the daily precipitation amount on day i in period j. Count the largest number of consecutive days where RRij ≥ 2.5 mm |
| Magnitude and Distribution Indices | ||
| 7 | Annual wettest 1-day precipitation (Rx1day) | Let RRij be the daily precipitation amount on day i in period j. The maximum 1-day value for period j is Rx1dayj = max(RRij) |
| 8 | Wettest consecutive 5-day precipitation (Rx5day) | Let RRkj be the precipitation amount for the 5-day interval ending k, period j. Then, maximum 5-day values for period j are Rx5dayj = max(RRkj) |
| 9 | Simple precipitation intensity index (SDII) | Let RRwj be the daily precipitation amount on wet days, w (RR ≥ 2.5 mm), in period j. If W represents the number of wet days in j, then |
| Percentile Threshold Indices | ||
| 10 | Annual total precipitation when daily precipitation is greater than the 95th percentile (R95pTOT) or contribution to total annual precipitation from very wet days | Let RRwj be the daily precipitation amount on a wet day, ‘w’, (RR ≥ 2.5 mm) in period i, and let RRwn95 be the 95th percentile of precipitation on wet days in the 1981–2023 period. If W represents the number of wet days in the period, then and, |
| 11 | Annual total precipitation when daily precipitation is greater than the 99th percentile (R99pTOT) or contribution to total precipitation from extremely wet days | Let RRwj be the daily precipitation amount on a wet day, ‘w’, (RR ≥ 2.5 mm) in period i, and let RRwn99 be the 99th percentile of precipitation on wet days in the 1981–2023 period. If W represents the number of wet days in the period, then and, |
Disclaimer/Publisher’s Note: The statements, opinions and data contained in all publications are solely those of the individual author(s) and contributor(s) and not of MDPI and/or the editor(s). MDPI and/or the editor(s) disclaim responsibility for any injury to people or property resulting from any ideas, methods, instructions or products referred to in the content. |
© 2025 by the authors. Licensee MDPI, Basel, Switzerland. This article is an open access article distributed under the terms and conditions of the Creative Commons Attribution (CC BY) license (https://creativecommons.org/licenses/by/4.0/).
Share and Cite
Abhilash; Satpathi, A.; Harshangkumar, T.; Subramani, T.; Jaisankar, I.; Shahi, N.K. Climatological and Hydrological Extremes of the Andaman and Nicobar Islands, India, and Its Database for Public Users. Atmosphere 2025, 16, 301. https://doi.org/10.3390/atmos16030301
Abhilash, Satpathi A, Harshangkumar T, Subramani T, Jaisankar I, Shahi NK. Climatological and Hydrological Extremes of the Andaman and Nicobar Islands, India, and Its Database for Public Users. Atmosphere. 2025; 16(3):301. https://doi.org/10.3390/atmos16030301
Chicago/Turabian StyleAbhilash, Anurag Satpathi, Talaviya Harshangkumar, Thangavel Subramani, Iyyappan Jaisankar, and Namendra Kumar Shahi. 2025. "Climatological and Hydrological Extremes of the Andaman and Nicobar Islands, India, and Its Database for Public Users" Atmosphere 16, no. 3: 301. https://doi.org/10.3390/atmos16030301
APA StyleAbhilash, Satpathi, A., Harshangkumar, T., Subramani, T., Jaisankar, I., & Shahi, N. K. (2025). Climatological and Hydrological Extremes of the Andaman and Nicobar Islands, India, and Its Database for Public Users. Atmosphere, 16(3), 301. https://doi.org/10.3390/atmos16030301