Article

Influence of Climate and Solar Variability on Growth Rings of Araucaria angustifolia in Três Barras National Forest (Brazil)

by
Daniela Oliveira Silva Muraja
,
Virginia Klausner
*,
Alan Prestes
,
Aline Conceição da Silva
and
Cecília Leite Lemes
Laboratório de Registros Naturais, Instituto de Pesquisa e Desenvolvimento, Universidade do Vale do Paraíba, São José dos Campos 12244-390, SP, Brazil
*
Author to whom correspondence should be addressed.
Atmosphere 2025, 16(3), 287; https://doi.org/10.3390/atmos16030287
Submission received: 28 January 2025 / Revised: 11 February 2025 / Accepted: 24 February 2025 / Published: 27 February 2025
(This article belongs to the Section Climatology)

Abstract

:
This research applies continuous wavelet analysis and seasonal correlation analysis to tree-ring data from Três Barras National Forest (FLONA Três Barras), revealing diverse influences on growth, including climate, solar activity, and external factors. The methodology involved tree-ring collection and subsequent wavelet and seasonal analyses to unveil the non-stationary characteristics of and multifaceted influences on growth. Key findings include the subtle effects of El Niño events on tree-ring development, the sensitivity of Araucaria angustifolia to temperature changes, the significant influence of precipitation during drought periods, and the intricate relationship between tree growth and solar cycles. The El Niño–Southern Oscillation (ENSO) emerges as a primary climatic driver during specific intervals, with external factors (precipitation, temperature, and solar cycle–solar irradiance) influencing tree response between 1936 and 1989. Additionally, the seasonal correlation analysis highlighted the importance of sub-annual climate variability, capturing specific intervals, such as a 3-month season ending in March of the previous year, that significantly impacted tree-ring growth. The study underscores the importance of protecting the endangered Araucaria angustifolia for climatic studies and local communities. Historically, in Brazil, Araucaria angustifolia seeds played a vital role in sustaining indigenous populations, which in turn helped to disperse and propagate forests, creating anthropogenic landscapes that highlight the interconnected relationship between humans and the preservation of these forests.

1. Introduction

To better understand, analyze, and predict the Earth’s climate, it is crucial to comprehend the following three main factors: (1) the amount of solar energy received by the climate system; (2) how this energy is absorbed and distributed on Earth’s surface; and (3) the interaction processes between different components of the climate system [1]. Additionally, past climate studies are essential for identifying events that are part of a region’s climatic cycle and those that are unusual, raising awareness of global warming and climate change [2]. Paleoclimatic information can be obtained from ice cores, corals, and tree growth rings and can be used to analyze variations within periods spanning from seasons to centuries. These studies also contribute to predicting future climate, improving forecasts, and validating models [3,4,5,6,7,8].
Dendrochronology has been widely employed to investigate the relationship between the Sun, the Earth, and climate in specific regions. Several studies have explored the response of tree species to local climate variations in southern Brazil [9,10,11,12], contributing to the development of specialized software that enhances the reliability and accuracy of dendrochronological analyses. These include tools for dendrochronology (DPL—Dendrochronology Program Library, developed by Richard Holmes) and CRUST [13]), dendroclimatology (Precon 5.1, Precon 6, developed by Hal Fritts; DENDROCLIM2002 [14]; and the DendroTools R package [15]), and paleoclimatology (Treeclim [16]).
To illustrate the broader impact of global climate systems on local environments, dendrochronological methods can be employed to decode climate signals embedded in tree-ring data, as demonstrated by [17,18,19]. In this context, research by [20] has shown that geophysical and climatic phenomena, such as El Niño and La Niña, influence regions far beyond South America. In Brazil, El Niño is typically associated with drought conditions in northern regions and heavy rainfall in the south, whereas La Niña tends to produce the opposite effect, leading to droughts in the south and increased precipitation in the north [21].
Research by [9,10,11,22,23,24,25,26,27,28,29,30,31] has demonstrated significant correlations between tree growth and solar cycles, including the Schwabe (∼11-year period), Hale (∼22-year period), Gleissberg (∼80-year period), and Suess (∼200-year period) cycles. These solar cycles, which are magnetic in nature, arise from complex processes within the Sun and are governed by the solar dynamo (for further details, see [32] and references therein). A typical solar cycle spans approximately 11 years and is characterized by fluctuations in solar activity. During periods of solar maximum, heightened solar activity results in increased ultraviolet and X-ray emissions, which, in turn, affect the Earth’s upper atmosphere by raising both temperature and density.
The interaction of cosmic rays with Earth’s stratosphere, where N 14 and O 16 are present, leads to the production of radioisotopes such as C 14 and Be 10 . As C 14 oxidizes to form C O 2 , trees incorporate this carbon into their annual growth rings. Consequently, variations in the solar cycle influence the amount of C 14 isotope fixed by trees, directly affecting the characteristics of each tree ring [33]. Additionally, indirect changes in regional temperature—modulated by Earth’s relative position to the Sun—can further impact tree growth. However, as studies on solar variability remain predominantly observational, there are still limitations in fully understanding the Sun’s direct and indirect effects on climate, long-term climate predictions, and tree growth.
Although solar variation is not the sole driver of climate change, it is important to study and comprehend its relationship with climatic and geophysical phenomena and integrate this information with other mechanisms that influence climate. This approach is necessary to distinguish between climatic changes caused by humans, such as greenhouse gas emissions, and those driven by natural cycles [18,34]. In this context, dendrochronology serves as a valuable tool for studying the connection between climate and tree growth. However, not all species are suitable for dendrochronological research, particularly in tropical regions like Brazil, where species diversity is vast [35]. For a tree to be useful in such studies, the following specific criteria must be met: the tree must form visible annual rings that respond to climatic variations, and there must be availability of centenarian trees, specifically for paleoclimatic research.
The Araucaria angustifolia (Bertol.) Kuntze species is a subtropical and tropical conifer native to South America, which is influenced by climatic parameters and has been extensively studied by dendrochronologists [18,36,37,38,39,40]. This species is dioecious, with male and female trees exhibiting distinct reproductive structures. Female trees produce abundant fruit periodically, which may inhibit cambial activity during high-fruiting years. Earlywood and latewood formation occur seasonally, with earlywood typically developing in the spring and latewood in the summer, driven by temperature and precipitation conditions.
Araucaria individuals can reach diameters exceeding 2 m and are commonly found in the Atlantic Forest biome, primarily in the southern and southeastern regions of Brazil, as well as in smaller areas of Argentina and Paraguay [41,42]. This species has become a symbol of local history and culture, particularly in the state of Paraná, due to its grandeur and dominance [43,44]. However, it is now threatened with extinction as a result of extensive logging in Brazil over recent decades [45]. Recent studies have reported spatial and temporal variations in its climate-growth response, likely influenced by climate change, which could hinder its application in dendrochronological studies aimed at reconstructing past climates [18,40,46,47].
Beyond its scientific value, Araucaria angustifolia holds significant cultural, economic, and ecological importance. For many local communities, it provides essential resources, including edible seeds (“pinhão”) [48] and timber [49], while also playing a crucial role in maintaining biodiversity within its native forest ecosystems. Today, A. angustifolia occupies only a fraction of its original range, with just 23.5% of plots in the Araucaria Forest region containing the species and a mere 0.5% of the canopy dominated by it [50]. This drastic decline reflects severe habitat loss due to agricultural expansion and deforestation [49]. Historically, Araucaria seeds were vital for sustaining indigenous populations, who played a key role in its dispersal and propagation, shaping anthropogenic landscapes that exemplify the deep connection between human activity and forest conservation [51].
Despite the challenges of habitat loss and population decline, the cambial activity of individual Araucaria angustifolia trees in southeastern South America remains active from October to April, enabling researchers to detect climate signals in their tree rings. Recent studies have applied wavelet techniques to identify time-dependent cause–effect relationships, revealing a significant influence of precipitation and temperature on tree-ring development.
The growth rings of Araucaria angustifolia have been shown to reflect signals of short solar cycles in relation to El Niño and La Niña events, as demonstrated by several studies [17,18,23,27,28,52]. These findings underscore the species’ potential for dendrochronological research in southeastern Brazil, particularly in studies investigating solar activity and climatological phenomena. Therefore, this study aims to investigate the influence of climatic variability, El Niño and La Niña events, and solar activity on the growth rings of Araucaria angustifolia sampled from the Três Barras National Forest (FLONA Três Barras) in southern Brazil.

2. Materials and Methods

Araucaria angustifolia samples (Figure 1) were collected at FLONA Três Barras ( 26 11  S, 50 20 W; Alt: 772 m), located on the boundary between the cities of Três Barras and Canoinhas, within the Atlantic Forest biome in the state of Santa Catarina, Brazil (Figure 2). This species is native to Brazil and is widely distributed, particularly in the South and Southeast, exhibiting a distinct gene pool among local breeds and ecotypes [53,54].
Belonging to the Araucariaceae family and the order Coniferae, Araucaria angustifolia is one of the most ancient conifer groups still in existence [55]. It has strong dendrochronological potential due to its well-defined growth rings (Figure 3), which feature clearly distinguishable earlywood and latewood [56,57]. However, locating old and healthy individuals is increasingly difficult, as this species is classified as endangered due to extensive logging and habitat loss [49,58].
FLONA Três Barras, a National Forest governed by a Forest Management Plan [59], has a minimum altitude of 725 m above sea level (a.s.l) and spans a total area of 43.85 km2. The forest exhibits diverse physiognomies, including mixed ombrophilous forest, commonly known as “Araucaria Forest” [60]. The site consists of 29.77% wilding pines, 17.23% Araucaria angustifolia, 18.41% floodplain, 14.23% reforested Araucaria angustifolia, and 14.23% ciliary forest. The remaining areas comprise non-forest zones, including infrastructure such as buildings, recreational spaces, roads, and firebreaks, contributing to vegetation fragmentation [61].
Geologically, the area is composed of Quaternary sediments, which have led to the formation of various hydromorphic and alluvial soil types, including Gleisols, Organosols, Alluvial Neosols, Oxisols, Cambisols, Argisols, and Litholic Neosols [61].
A comparable study was conducted by [17], which analyzed 13 chronologies (1876–1991) derived from Araucaria angustifolia samples collected in Concórdia, Brazil ( 27 11  S, 51 59  W, Alt: 640 m). Their methodology involved processing digitized images of tree-ring slices processed using the Interactive Treatment of Tree-Ring Images method. In contrast, our study investigates 14 chronologies from Araucaria angustifolia samples collected at FLONA Três Barras, employing a different data acquisition approach, as detailed in a subsequent section. Although the sites are geographically close, less than 200 km apart, they encompass distinct local ecotypes and environmental conditions, each characterized by unique gene pools and specific adaptations [62,63]. Such genetic diversity and ecological variability may influence growth responses to climatic factors.

2.1. Regional Climate

FLONA Três Barras has a subtropical highland climate (Cfb) according to the Köppen classification; it is characterized by constant humidity, no dry season, cool summers, and frequent frosts. The mean temperature in the coldest month (July) falls below 11 °C, while the warmest month (January) reaches 22 °C. Rainfall is well-distributed throughout the year, with an annual average of 1588.5 mm. October is the wettest month (197.5 mm), while April is the driest (90.1 mm) [61]. Although the region lacks a defined periodic cycle, it is susceptible to both floods and droughts [59]. The average annual insolation is 1698.4 h, and the relative humidity averages 79.66%. Additionally, due to the climatic characteristics of the North Plateau, the area is prone to wildfires, particularly between August and September [61].
The FLONA Três Barras region is influenced by both the Atlantic and Pacific Oceans. The South Atlantic Ocean indirectly affects the region’s climate through the South Atlantic Anticyclone (SAA), which gives rise to the Tropical Maritime Air Mass from the Atlantic Ocean and the Polar Maritime Air Mass from Antarctica. These air masses transport moisture into the continent, causing abundant precipitation during spring and summer [64]. Meanwhile, interactions between the Pacific Ocean and the lower atmosphere drive the El Niño–Southern Oscillation (ENSO), which can result in extreme rainfall and flooding in FLONA Três Barras [24].
The ENSO has a significant influence on global and regional climate patterns, impacting precipitation and temperature variability in the Atlantic Forest biome. Historical records document at least 30 El Niño events between 1900 and 2024, including six “Super” El Niño events, as follows: 1877–1878, 1888–1889, 1972–1973, 1982–1983, 1997–1998, and 2015–2016 [65]. More recent El Niño events occurred in 2002–2003, 2009–2010, and 2023–2024 [66].

2.2. Data Acquisition

We collected a total of 72 samples from 18 Araucaria angustifolia trees using a Pressler increment borer (Figure 4), with core lengths of 40 and 80 cm. The cores were extracted perpendicular to the trunk at breast height (1.30 m). During sampling, each tree was carefully inspected for signs of disease or pest infestation. Notably, Araucaria angustifolia has evolved to adapt to its environment over many years, making it highly resistant to pest and disease damage.
Due to the presence of numerous missing or false rings, likely caused by abrupt weather variations, only 28 samples from 14 individual trees were deemed suitable for analysis and crossdating, ensuring the statistical robustness of the study. Of these, 10 samples (from 5 trees) were collected from an area near the city of Canoinhas, while 18 samples (from 9 trees) were collected from an adjacent area near the city of Três Barras. Both sampling locations belong to a single, cohesive site within FLONA Três Barras, positioned along the geographic boundary between these two cities. The site covers an area of ∼2500 m2. Although the samples were collected from opposite sides of this shared border, the ecological and environmental conditions remain consistent across the site, justifying their combined analysis as a single sampling area.
The samples were air-dried under shaded conditions, followed by sequential polishing of the transverse surface using sandpaper with grits ranging from 50 to 600. As shown in Figure 5, the samples were prepared before and after polishing. To facilitate accurate visualization during the measurement process, the growth rings were marked with a pencil after polishing.
We measured the tree rings using a VELMEX measuring table with a precision of 0.001 mm, dating each ring from bark to pith to generate individual time series. These series were crossdated to prevent chronological errors. The quality of the measurements and crossdating was verified using the COFECHA software [67]. Some samples were collected in 2005, with the last ring formed in 2004, while others were collected in 2011, where the last ring corresponded to 2010. Consequently, the tree-ring mean chronology was only calculated for up to 2004, due to the reduced sample depth between 2005 and 2010.
The Expressed Population Signal (EPS) obtained was 0.85, indicating reliable statistical confidence despite the reduction in sample size [68]. Additionally, we performed a descriptive statistical analysis of the tree-ring series of Araucaria angustifolia, employing Pearson’s correlation (r), squared Pearson’s correlation (r2), p-values, and cross-wavelet analysis to further examine the relationships within the data.

2.3. Detrending

The tree-ring time series were detrended using a 67% smoothing spline with a 50% frequency cutoff, preserving no more than half of the variance at wavelengths equal to two-thirds of the series length, ensuring minimal distortion of long-term trends in the resulting indices [69]. To standardize the tree-ring series, a common practice is to divide or subtract the fitted 67% spline from the original tree-ring measurements [70]. Here, the indices were computed as residuals, allowing for a more accurate representation of growth trends while accounting for variance. The computation of the mean-value index (Arithmetic Mean, Biweight Robust Mean, or Mean-Values from a Mixture of Normal Distributions) is easily achieved with the tree-ring indices [71]. However, if the autocorrelation within each series is high, a more statistically efficient estimate of the mean-value index can often be obtained through time series modeling and prewhitening techniques [71]. Nevertheless, this is not the case for our dataset, as autocorrelation levels were not found to compromise the statistical reliability of the indices.
In this sense, the tree-ring index (chronology) was calculated by averaging the ensemble of detrended tree-ring series for each year using Tukey’s biweight robust mean, which effectively minimizes the influence of outliers in individual series and enhances the quality of the common signal [71,72]. It is well established that the variance of the mean chronology depends on the number of series being averaged. As discussed in [71], intervals with fewer samples exhibit increased variance compared to intervals with a larger number of samples. To address this issue, a statistical adjustment method proposed in [73] was applied in this study, which normalizes variance fluctuations caused by changes in sample size over time.
It is generally assumed that long tree-ring index series should exhibit an approximately normal distribution [13]. Although our series is not particularly long, we evaluated the normality of the distribution using the Lilliefors test for exponential distribution [74].

2.4. Climatic and Geophysical Data

We used monthly and annual time series of temperature, precipitation, the Southern Oscillation Index (SOI), and sunspot numbers as climatic and geophysical data (Figure 6). Temperature and precipitation data were sourced from weather stations located within a 150 km radius of our collection sites in Irati and Ivaí, as shown in Figure 2. These datasets were obtained from the National Institute of Meteorology (Instituto Nacional de Meteorologia (INMET), https://portal.inmet.gov.br/dadoshistoricos, accessed on 8 August 2024). When data gaps were present in the series from the closest station (Irati), missing values were supplemented with data from Ivaí, as both stations fall within the same climatic zone (Cfb) as FLONA Três Barras. It is worth noting that gaps and missing data in the meteorological parameters from the Irati station were addressed using linear regression analysis, similar to the approach applied in [75].
The SOI, which reflects atmospheric pressure variations related to climate activity, was retrieved from the Australian Bureau of Meteorology’s website (http://www.bom.gov.au/climate/enso/soi/, accessed on 5 February 2024), and the sunspot number series was acquired from the Sunspot Index Data Center in Brussels (https://www.sidc.be/SILSO/datafiles, accessed on 5 March 2024).

2.5. Continuous Wavelet Transform

In this study, the continuous wavelet transform (CWT) algorithm from [76] was employed to analyze the tree-ring index, using the Morlet wavelet as the mother wavelet. The algorithm is available at the following link: https://github.com/chris-torrence/wavelets (accessed on 28 November 2024).
The Morlet wavelet, with an angular frequency of 2 π and a standard deviation of 1, offers an optimal balance between time and frequency resolution, as dictated by Heisenberg’s uncertainty principle [76,77].
To assess the time-varying relationship between the tree-ring index and climatic or geophysical series, we applied the cross-wavelet transform (XWT) technique introduced in [76]. This method involves computing the wavelet coefficients for both the tree-ring index and the climatic or geophysical time series, followed by calculating the cross-wavelet spectrum between the two. Mathematically, the XWT is defined using the wavelet coefficients W n X ( s ) and W n Y ( s ) of the tree-ring index X and the climatic/geophysical series Y, respectively, as follows:
W n X Y ( s ) = W n X ( s ) W n Y * ( s ) ,
where W n Y * ( s ) represents the complex conjugate of W n Y ( s ) . The cross-wavelet power is then given by the modulus, i.e., W n X Y ( s ) . Notably, the cone of influence was not applied, as the border effects were treated using the symmetrization method, which has proven effective in previous studies [18].
To complement the wavelet analysis, a band-pass Butterworth filter of order 10 was applied to isolate frequencies corresponding to periods within the 2–8-year band, a range strongly linked to climatic phenomena such as the ENSO. The Butterworth filter was specifically selected for its smooth frequency response, which ensures minimal distortion within the passband, effectively removing high-frequency noise while preserving the dominant periodicities most relevant to the analysis.
To achieve a zero-phase shift in the filtered signal, the filter coefficients were computed using the MATLAB R2019a version function butter(), and the filtering was performed using the filtfilt() function. The filtfilt() function applies the filter in both the forward and reverse directions, resulting in a filtered signal without phase distortion.

3. Development of the Tree-Ring Index

Here, we illustrate the step-by-step use of spline for tree-ring series detrending by considering the 67% spline with a 50% frequency cutoff as the natural growth trend of the tree. Figure 7 shows 14 chronologies from Três Barras FLONA. The blue lines represent the raw tree-ring series, while the red lines depict the detrended series obtained using a 67% smoothing spline. The last panel displays the average tree-ring series for all samples, referred to as the Três Barras index, providing an aggregated view of the growth trends after detrending.
Figure 8 presents the tree-ring index derived from 14 Araucaria angustifolia samples, illustrating the effects of changing sample size on variance. The solid black line represents the series with variance correction, effectively reducing variance fluctuations caused by sample-size changes, while the dashed line shows the uncorrected series. The blue line depicts the number of trees (sample size) over time. The variance contraction observed in the corrected series, particularly below a sample size of 10, emphasizes the impact of small sample sizes on variance stability.
Table 1 presents the statistical parameters of the tree-ring index, including the Expressed Population Signal (EPS). The EPS quantifies the strength of the common signal in the index by comparing the variance of the index to the variance of the average individual tree-ring series. An EPS value greater than 0.85 is considered indicative of a robust, coherent signal at the stand level. In our study, the EPS surpasses 0.85 with as few as five trees, demonstrating a strong and reliable signal in the index, despite the total sample consisting of only 14 individual trees.
It is important to note that, according to [78], a typical tree-ring index should include data from at least ten trees per site to ensure reliable results when reconstructing past climatic variability. In this study, we utilized 14 trees per site and achieved a strong EPS value, indicating that our index provides a robust and reliable record of past climatic conditions.
Figure 9 illustrates the statistical probability distribution of our index, demonstrating a good fit for the normal distribution. The null hypothesis of normality was accepted, confirming that the data conforms to a normal distribution. While this condition is generally critical for long series, its verification is not essential for shorter series like ours. However, establishing normality is particularly important for ensuring the reliability of statistical analyses, such as the Pearson correlation performed between the index and the climatic and geophysical time series, as shown in Table 2.
Table 2 presents the results of the Pearson correlation coefficient (r) analysis, which measures the strength and direction of the linear relationship between the tree-ring index and each climatic and geophysical parameter. Additionally, the table provides the coefficient of determination ( r 2 ), representing the proportion of variance in tree-ring growth explained by each parameter. However, the p-values indicate that none of these correlations are statistically significant over the full study period.
Although this result may seem unexpected, it is common in climate research due to the complexity of tree growth responses to environmental conditions. The interaction between tree growth and climate is often influenced by various factors, including site-specific conditions, species-specific responses, and different temporal scales, leading to variability in the strength and significance of observed relationships. As noted by [79], tree growth–climate relationships are frequently non-stationary, challenging the assumption of a consistent, stationary response.
Given these challenges, annual correlation methods may fail to capture the climatic influence on tree growth when responses vary seasonally. To further investigate this relationship, we conducted a detailed seasonal correlation analysis using the Seascorr software [80], which enables the identification of specific periods of the year (months) during which temperature and precipitation significantly influence tree growth. The results are presented in Figure 10 and reveal significant negative correlations between tree growth and precipitation during specific seasonal intervals, such as a 1-month season ending in January ( r = 0.47 , α < 0.05 ), a 3-month season ending in March of the previous year ( r = 0.52 , α < 0.05 ), and a 6-month season ending in January of the previous year ( r = 0.45 , α < 0.05 ). However, in the partial correlation analysis where the temperature is controlled for precipitation (bottom panel), none of the correlations reached statistical significance at α = 0.05 or at α = 0.01 .
These results confirm that, while annual correlations do not capture significant relationships, seasonal correlation analysis reveals strong climate signals that influence Araucaria angustifolia growth. This justifies the continued investigation beyond the results of Table 2 and emphasizes the importance of evaluating climate-tree growth interactions at different temporal scales.

4. Wavelet Analysis of Climate and Tree-Ring Relationships

To address the issue of the lack of significant correlation between the index and the climatic and geophysical time series, we employed the cross-wavelet transform (XWT) approach, which has been successfully used in previous studies [18,19,81]. The XWT allowed us to analyze how well the time series of the tree-ring index and the climatic and geophysical parameters match and identify the exact points at which the best match occurs.
Our index analysis using CWT (Figure 11) revealed significant variability in the 2–7-year band, which appears intermittently throughout the length of the index. We also observed similar intermittent periodicities around the 11-year and 22-year bands, corresponding to the solar cycles of Schwabe and Hale, as reported in previous studies [82]. Additionally, we found variability around the 30–35-year band, which matches the Brückner climatic cycle, as reported in [83,84]. However, we must note that the bandwidths of 22 years and 30–35 years fall within the confidence level, which spans between 14 and 38 years, due to the uncertainty principle of Heisenberg [76,77]. Overall, the XWT approach allowed us to identify significant periodicities in the index that were not apparent from the Pearson correlation analyses. The observed intermittent variability in the 2–7-year band, along with the correspondence to solar and climatic cycles, suggests that external drivers, such as solar radiation and climate variability, may influence tree growth.
To further investigate the relationship between the tree-ring index and climatic data, we employed XWT to identify the interdependence of the two-time series in terms of cause and effect. The results, shown in Figure 12, reveal significant cross-wavelet power in the 2–8-year band between the tree-ring index and the SOI during the intervals of approximately 1896–1925, 1949–1979, and 1993–2004. These periods highlight the intervals where strong correlations between tree growth and ENSO activity are evident, suggesting that the ENSO significantly influences tree-ring formation during these times.
The El Niño events exhibit considerable variability in both intensity and periodicity, which may account for the non-stationary response of the index to the climatic system. Additionally, southern Brazil, as a subtropical region, is particularly affected by such events [21], further supporting the observed influence of the SOI on tree rings in this region. This relationship was similarly observed in [17], who reported significant cross-wavelet power in the 2–8-year band, with these periodicities occurring sporadically and in a non-stationary manner, consistent with our findings.
Interestingly, a notable cross-wavelet power, though not statistically significant, is observed in the 33-year bandwidth between 1980 and 2000, while a 17–33-year periodicity is evident between 1925 and 1960. This is followed by an 8–17-year periodicity between 1960 and 1992, further emphasizing the non-stationarity of the system. Overall, the XWT results provide valuable information about the complex relationship between the tree-ring index and climatic data and highlight the importance of considering non-stationarity in studying past climatic variability.
Following the analysis of the global wavelet spectrum (Figure 12), we applied a band-pass filter (Figure 13) to isolate the most significant energy within the 2–8-year band, removing higher frequencies while preserving the significant cross-wavelet power values. The 4–8-year band is notably associated with El Niño and La Niña events. Our analysis visually indicates that the tree-ring index and the SOI were in phase during the periods 1910–1935 and 1990–2004 (Figure 13), while they were predominantly in anti-phase between 1890 and 1910. For the remaining periods, a slight lag of one to two years was observed between the two series. These findings suggest that ENSO was a dominant climatic driver during 1910–1935 and 1990–2004. From 1936 to 1989, anthropogenic influences in the region may have affected the tree growth response. However, it is important to note that, in general, very old trees like those studied here (all over 150 years old, with the youngest exceeding 150 years) do not increase their radial growth, even when they remain standing after selective logging.
It is important to note that southern Brazil experienced a significant increase in logging activities between 1900 and 1944, with government regulation of forest exploitation only beginning with Decree-Law No. 313 on 4 July 1938. The FLONA Três Barras area, however, did not receive its first Management Plan until January 1987, marking its designation as a forest conservation area. This historical context may have contributed to the complex tree growth responses observed in the region during the period from 1875 to 2004. Additionally, the findings of [85] revealed an anti-correlation between the tree-ring index and the SOI index, with a notable 2-year lag.
In line with this, our analysis indicates that the tree-ring index and the SOI index were in phase from 1910 until approximately 1935, suggesting that tree growth was positively correlated with El Niño events during this period. This is consistent with the increased water availability in southern Brazil during El Niño summers, which likely promoted enhanced growth. However, as previously mentioned, FLONA Três Barras was not designated as a conservation area until 3 October 1944 (A Notícia, Joinville, 19-10-2004), following years of extensive wood extraction. The observed anti-correlation in the tree-ring data during this period may therefore be attributed to anthropogenic activities, such as logging, which likely disrupted the natural growth patterns of the trees.
In Figure 14, a significant correlation between precipitation and Araucaria angustifolia growth is observed within the 5–7-year band from 1970 to 1978 and the 3–5-year band from 1986 to 1990. Notably, these periods coincide with documented drought events in the region, suggesting that the trees are highly sensitive to fluctuations in precipitation during such dry conditions. This sensitivity underscores the role of water availability as a critical factor in tree growth, particularly during times of climatic stress. However, it is worth noting that the smallest precipitation recorded in 1980 is not expressively reflected in the tree-ring chronology, indicating that other factors, such as the solar cycle, may modulate the growth response during extreme events.
Furthermore, the increase in cross-wavelet power observed in the 11–17-year band, corresponding to the Hale and Schwabe solar cycles, suggests that solar activity may also influence the growth of Araucaria angustifolia. This aligns with previous findings by [12], who detected signals of the Schwabe and Hale cycles in low-frequency data from southern Brazil. Notably, a nearly synchronous or slightly delayed increase in precipitation, along with the widening of tree-ring widths, is observed between 1968 and 1986, further supporting the influence of solar cycles. Our results are consistent with the research of [12], reinforcing the idea of a complex interplay between precipitation, solar activity, and tree growth, highlighting the need for further investigation into the underlying mechanisms driving these relationships.
Tree growth is influenced by multiple factors, including temperature and precipitation, which can leave distinct imprints in the tree-ring structure. Variations in these climatic elements are often linked to cyclical events, such as the ENSO. For instance, severe winters and intense summers can cause noticeable changes in tree-ring width, either accelerating or slowing down growth, as noted in [26].
In the present study, the growth index of Araucaria angustifolia did not show a significant response to the average annual temperature of Irati, except for periods with elevated cross-wavelet power observed in 1961–1970 and after 1999 (Figure 15). These findings suggest that the trees were sensitive to temperature fluctuations only during periods of lower (1961–1970) and higher (post-2002) temperatures, likely due to deviations from their optimal temperature threshold. Interestingly, reduced tree-ring growth appears to have begun around 1991, nearly a decade earlier, yet no clear correlation between tree-ring growth and temperature was observed during the 1991–1999 period. This discrepancy indicates that other factors, such as microclimatic variations, may have played a role in influencing tree growth, particularly since the temperature data do not originate from the exact collection region.
To deepen the analysis of Araucaria angustifolia’s sensitivity to temperature, we correlated the tree-ring index with both maximum (Figure 16) and minimum (Figure 17) annual temperatures. Significant cross-wavelet power was detected between the tree-ring index and both temperature series during 1997–2004, a period characterized by hot summers (299.15 K) and mild winters (287.65 K). This suggests that the trees were highly responsive to these climatic conditions, with growth slowing or ceasing in response to the elevated temperatures, indicating a clear sensitivity to warmer weather during this interval.
Our study detected a predominant periodicity of approximately 11 years in the tree’s response to solar variability, as illustrated in Figure 18. This periodicity was observed during the intervals ∼1822–1893, ∼1900–1930, and ∼1942–2004. Solar cycles, which are characterized by an 11-year period, are typically monitored through sunspot numbers [1]. High cross-wavelet power was observed between solar activity and tree growth during periods of increased sunspot activity, while lower correlations were noted during times of reduced sunspot numbers.
The 11-year band was significant throughout the entire study period. This finding aligns with the results of [86], who observed a strong 12.7-year periodicity in the tree-rings of two German Miocene conifers, which they attributed to the ongoing 11-year cycle of solar variation. Similar periodicities were also identified in [28], a study conducted in Severiano de Almeida, Southern Brazil, further supporting the influence of solar cycles on tree growth.
Additionally, our study detected significant cross-wavelet power in the 25–58 year bandwidth during the periods of 1804–1849 and 1965–2004. This finding suggests an association with the 4th harmonic of the Suess cycle (∼50 years), which falls within the 25–58-year bandwidth. The global wavelet spectra revealed the cycles of Schwabe (∼11 years), Hale (∼22 years), and Gleissberg (70 to 90 years).
The 4th harmonic of the Suess cycle was previously observed in a tree-ring index in [18,87]. Our findings suggest that solar variability plays a significant role in the growth of Araucaria angustifolia trees and that their response to solar cycles is reflected in the periodicity observed in their tree rings.

5. Seasonal Correlation Analysis of Climate and Tree Growth

The application of seasonal correlation analysis (Figure 10) effectively addresses the limitations inherent in annual correlation methods, including simple correlation and wavelet analysis, which rely on yearly data and may overlook important sub-annual climatic influences. By employing this approach, we identified the specific months during which temperature and precipitation exert statistically significant effects on tree-ring growth, capturing both pre-growth and growth-season climatic signals.
Our investigation revealed that the influence of precipitation on tree growth extends beyond the immediate growing season. Notably, precipitation from a 3-month season ending in March of the previous year and a 6-month season ending in January of the previous year exhibited the strongest negative correlations with tree-ring width. This result emphasizes the delayed response of Araucaria angustifolia to climate variability, highlighting the importance of pre-growth seasonal moisture availability in determining tree-ring formation.
Additionally, our results indicate that precipitation exerts a more dominant influence on tree growth variability in the study region. In contrast, temperature alone does not significantly explain variations in growth when the effects of precipitation are removed. This suggests that water availability is more important than temperature fluctuations in driving tree growth dynamics in this ecosystem.

6. Final Remarks

The wavelet analysis of tree rings from samples collected in FLONA Três Barras revealed that tree-ring growth is influenced by a variety of factors, including climate, solar activity, and other external drivers. The non-stationary nature of each time series was identified, with the main results summarized as follows:
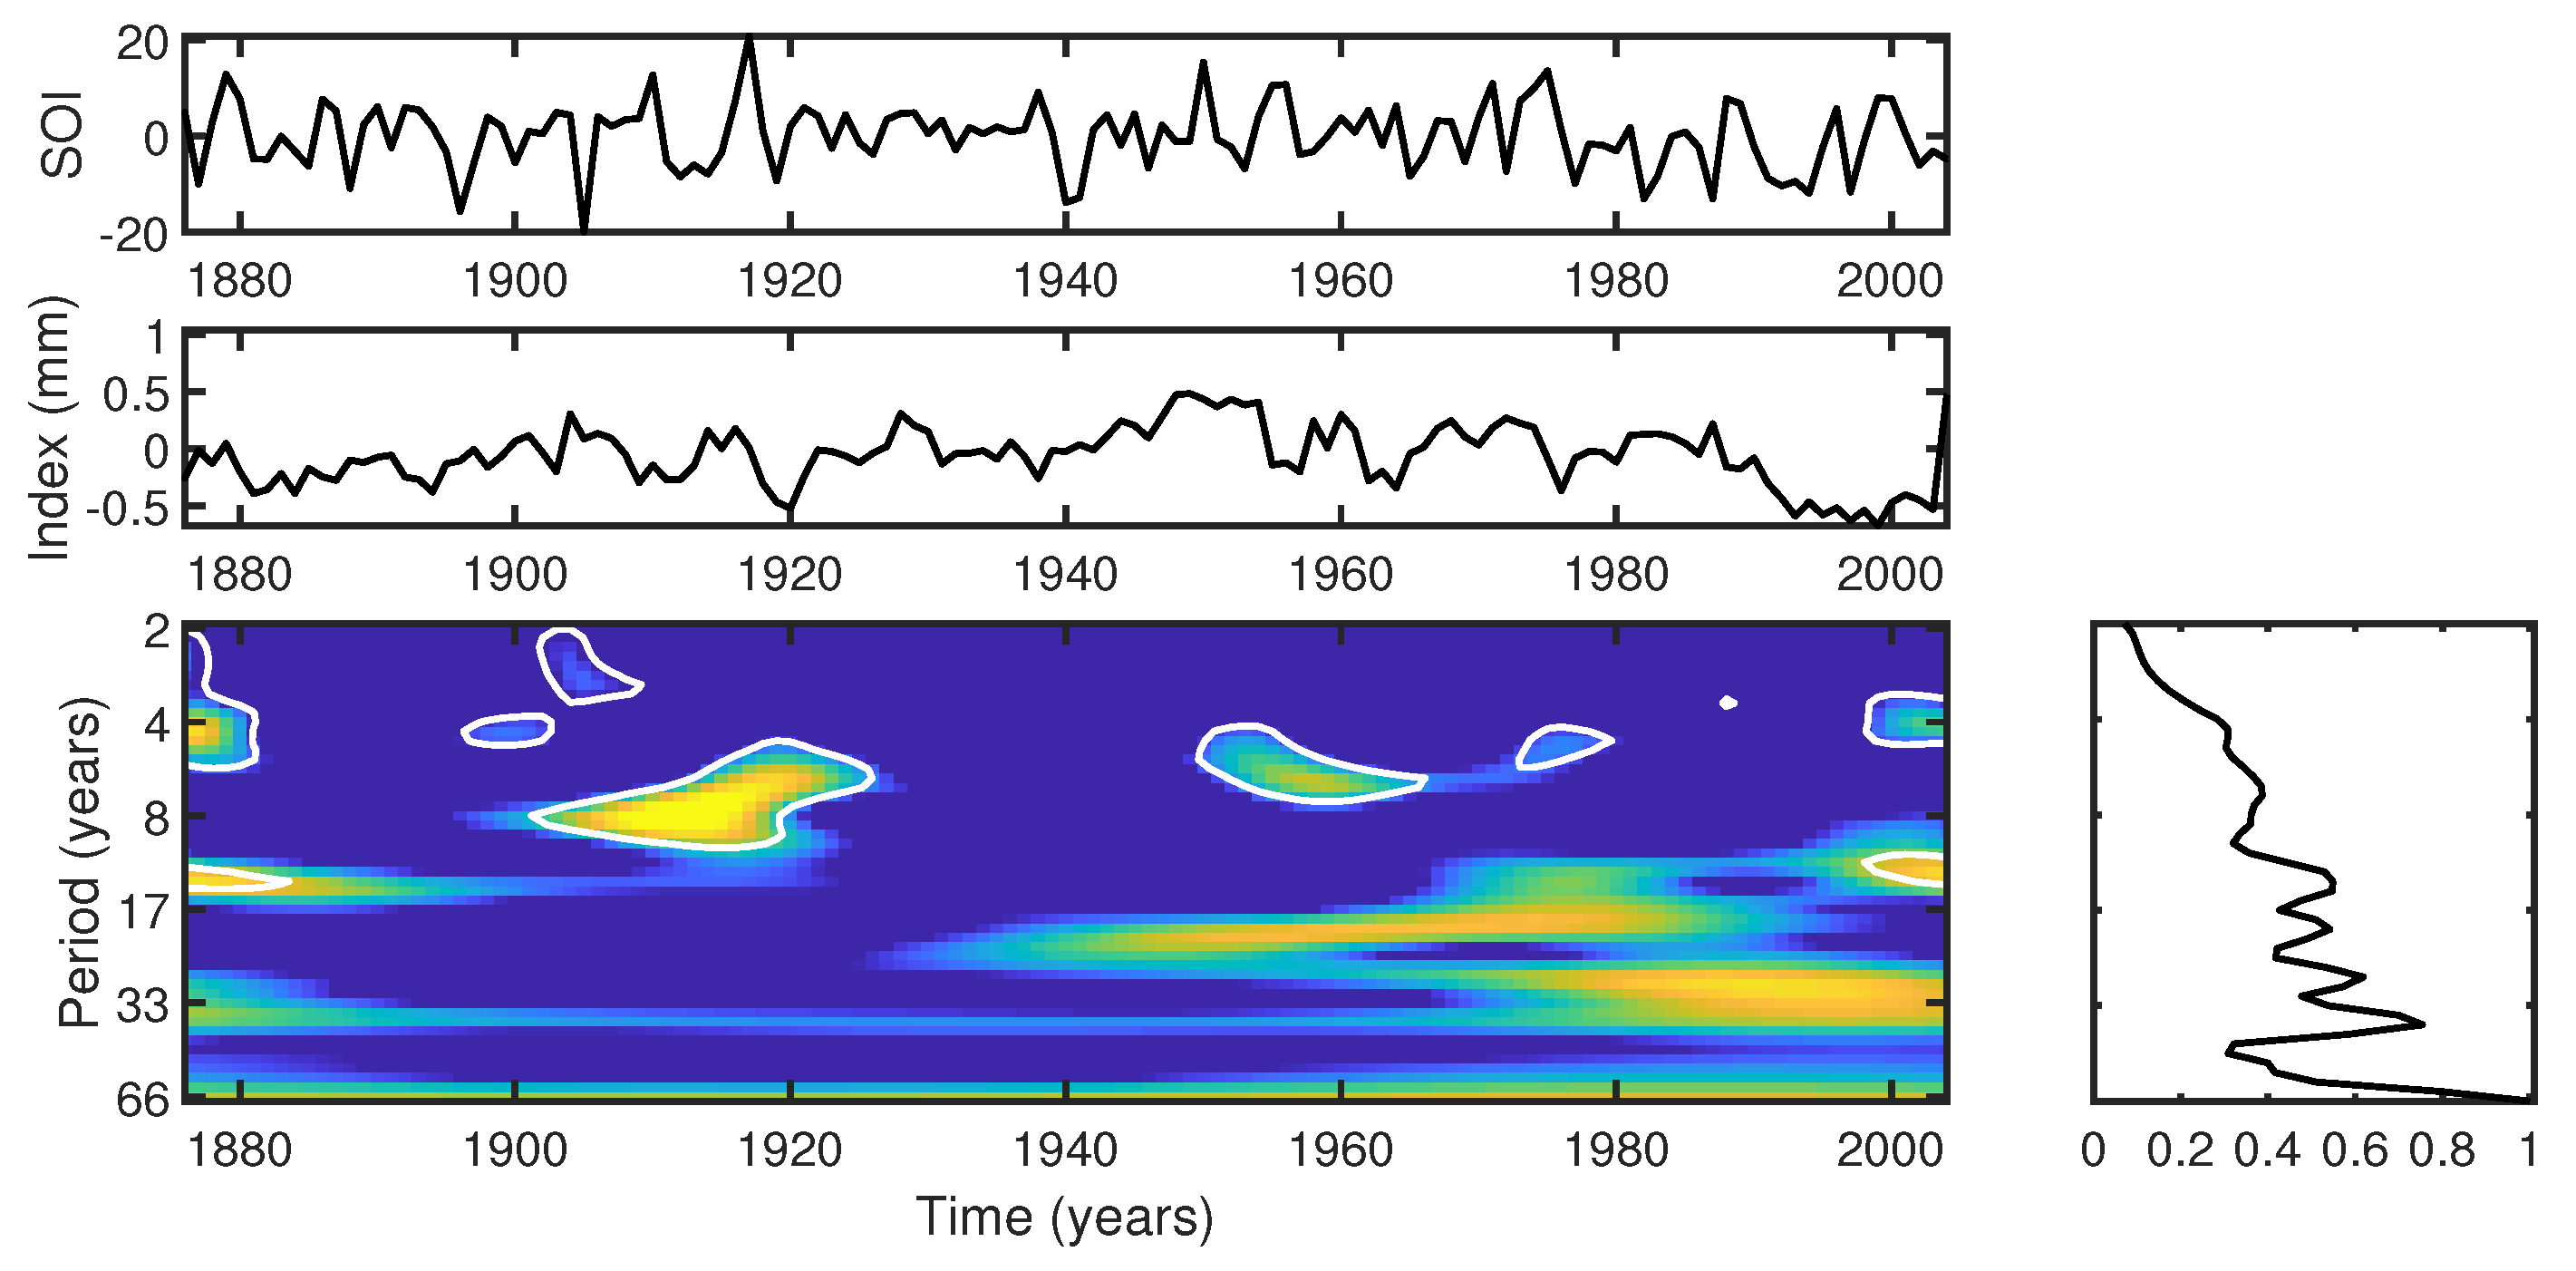
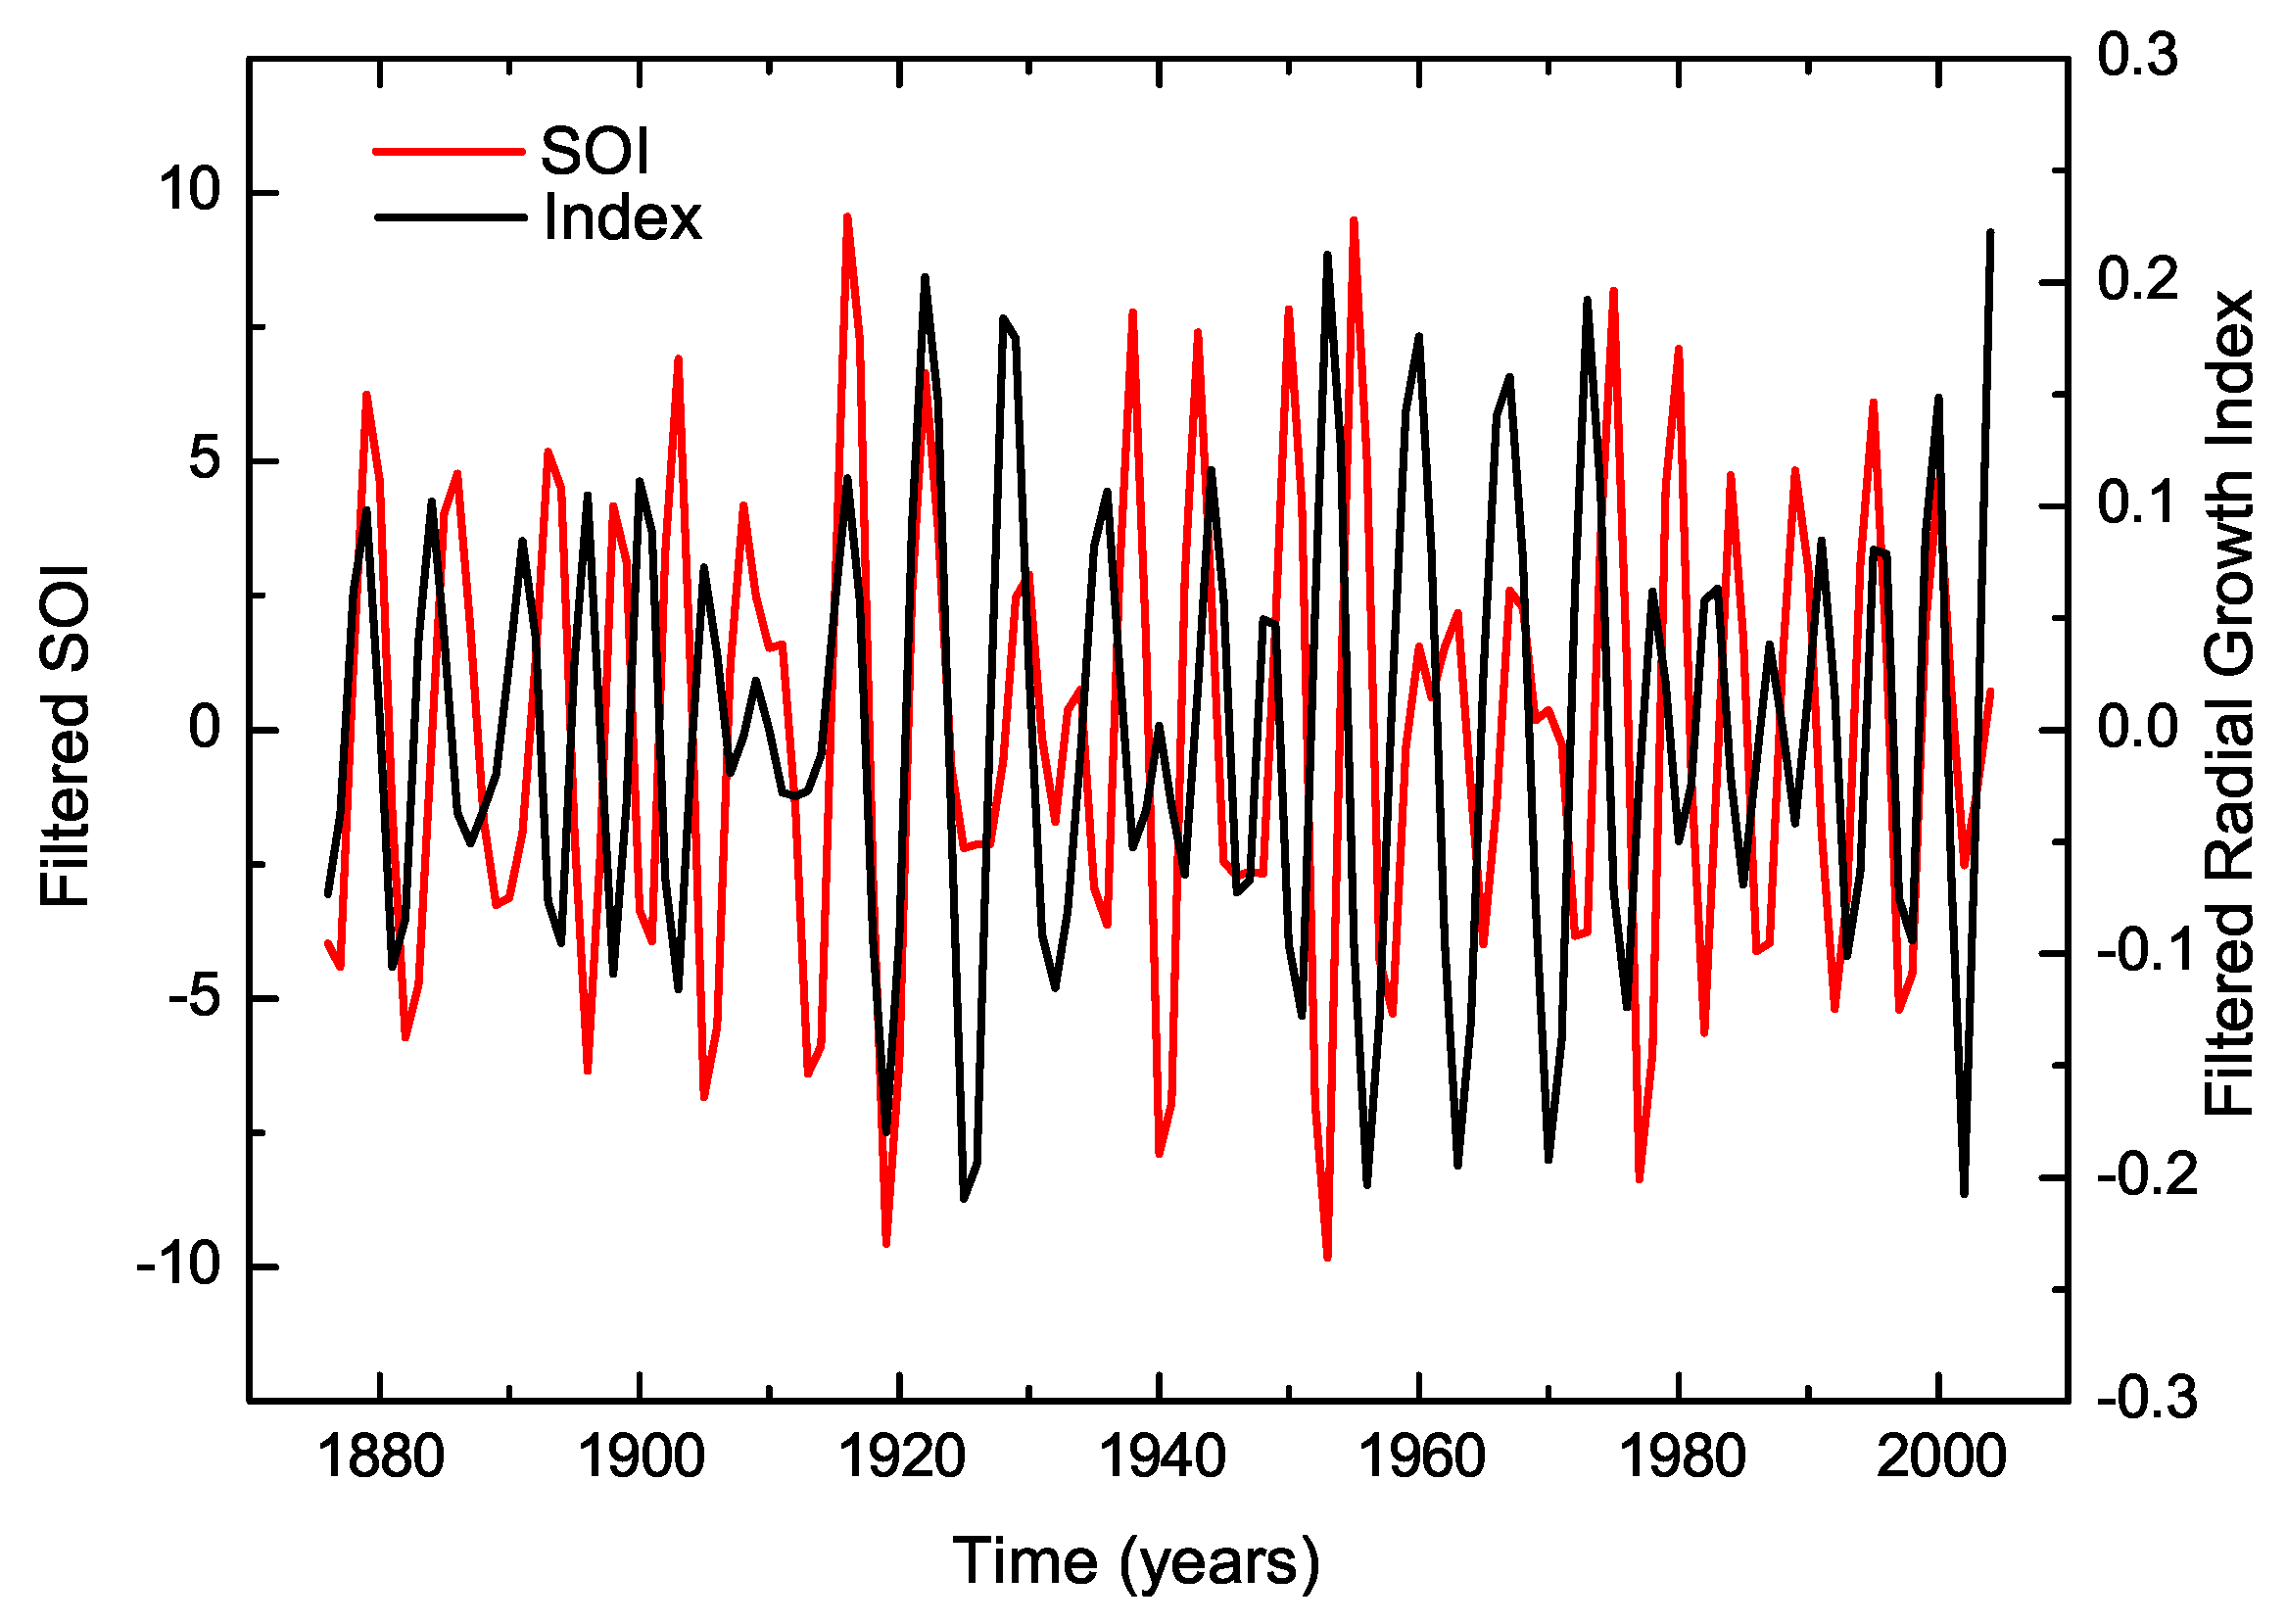
  • The ENSO events exhibit a complex influence on the tree-ring index. Cross-wavelet analysis indicates significant power in the 2–8-year band during specific intervals, suggesting interdependence between the tree-ring index and the SOI. Intense El Niño events, such as those in 1982–1983 and 1997–1998, might disrupted the correlation between the index and SOI, highlighting the non-stationary response of trees to climatic fluctuations.
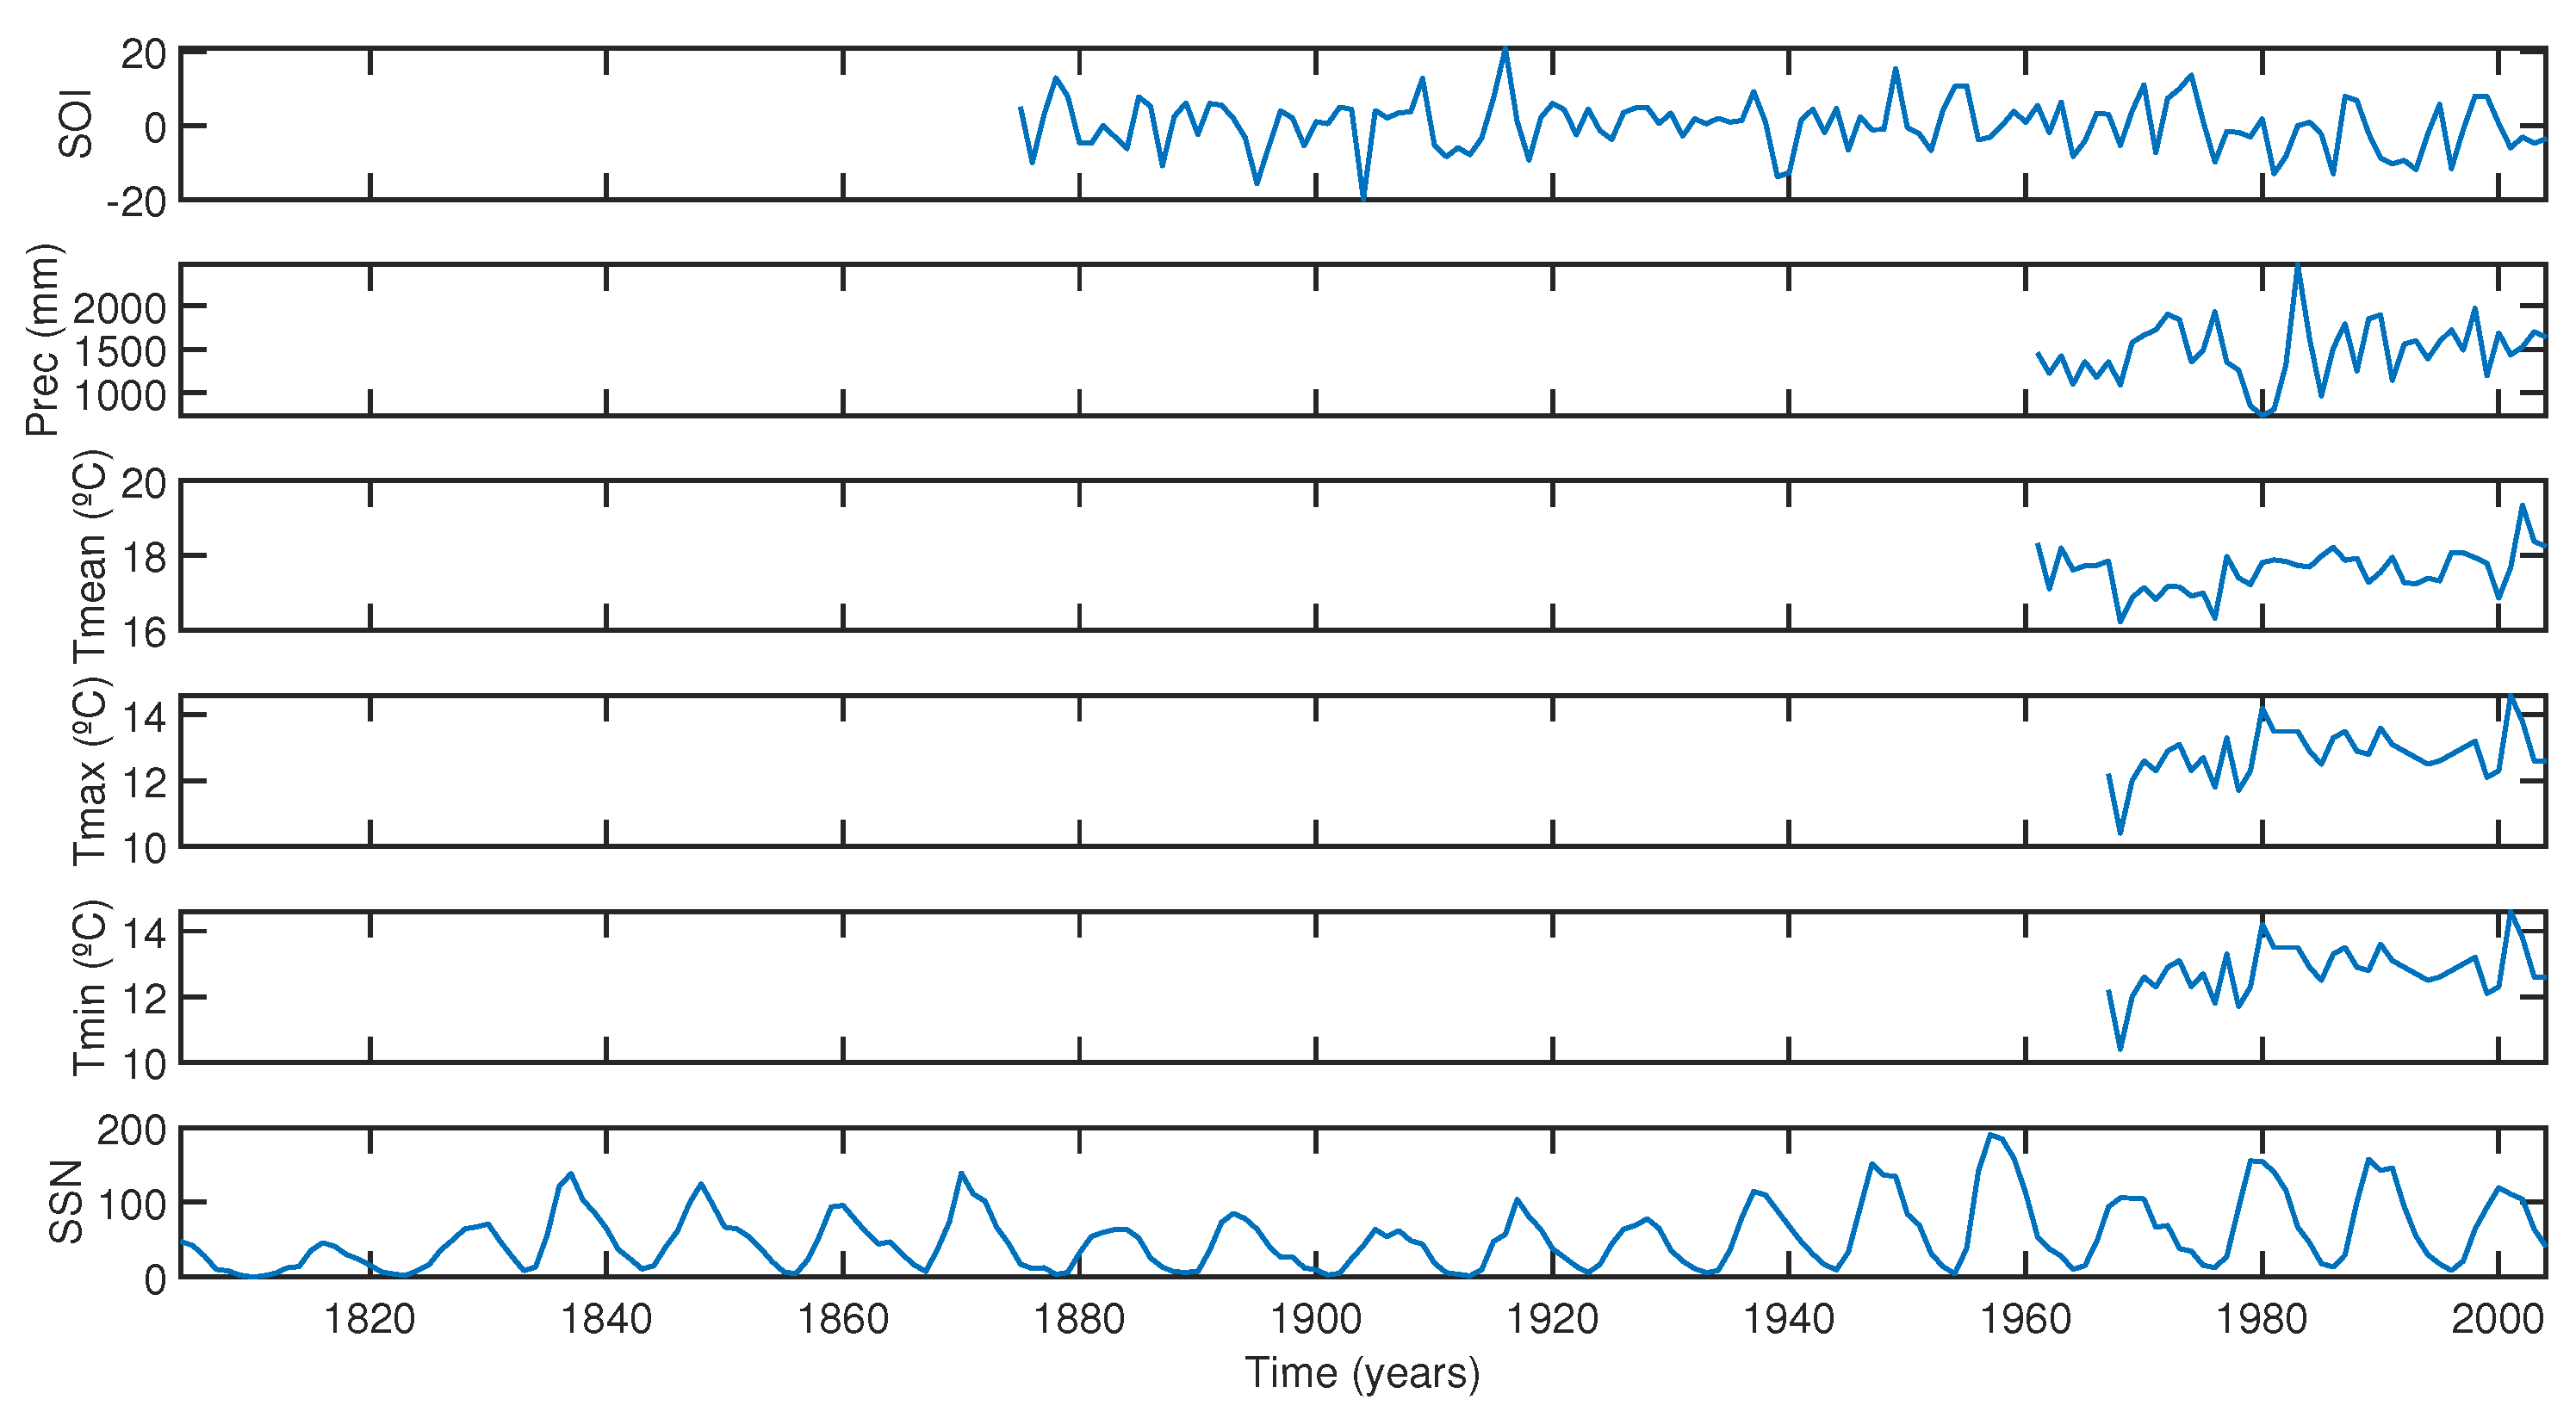
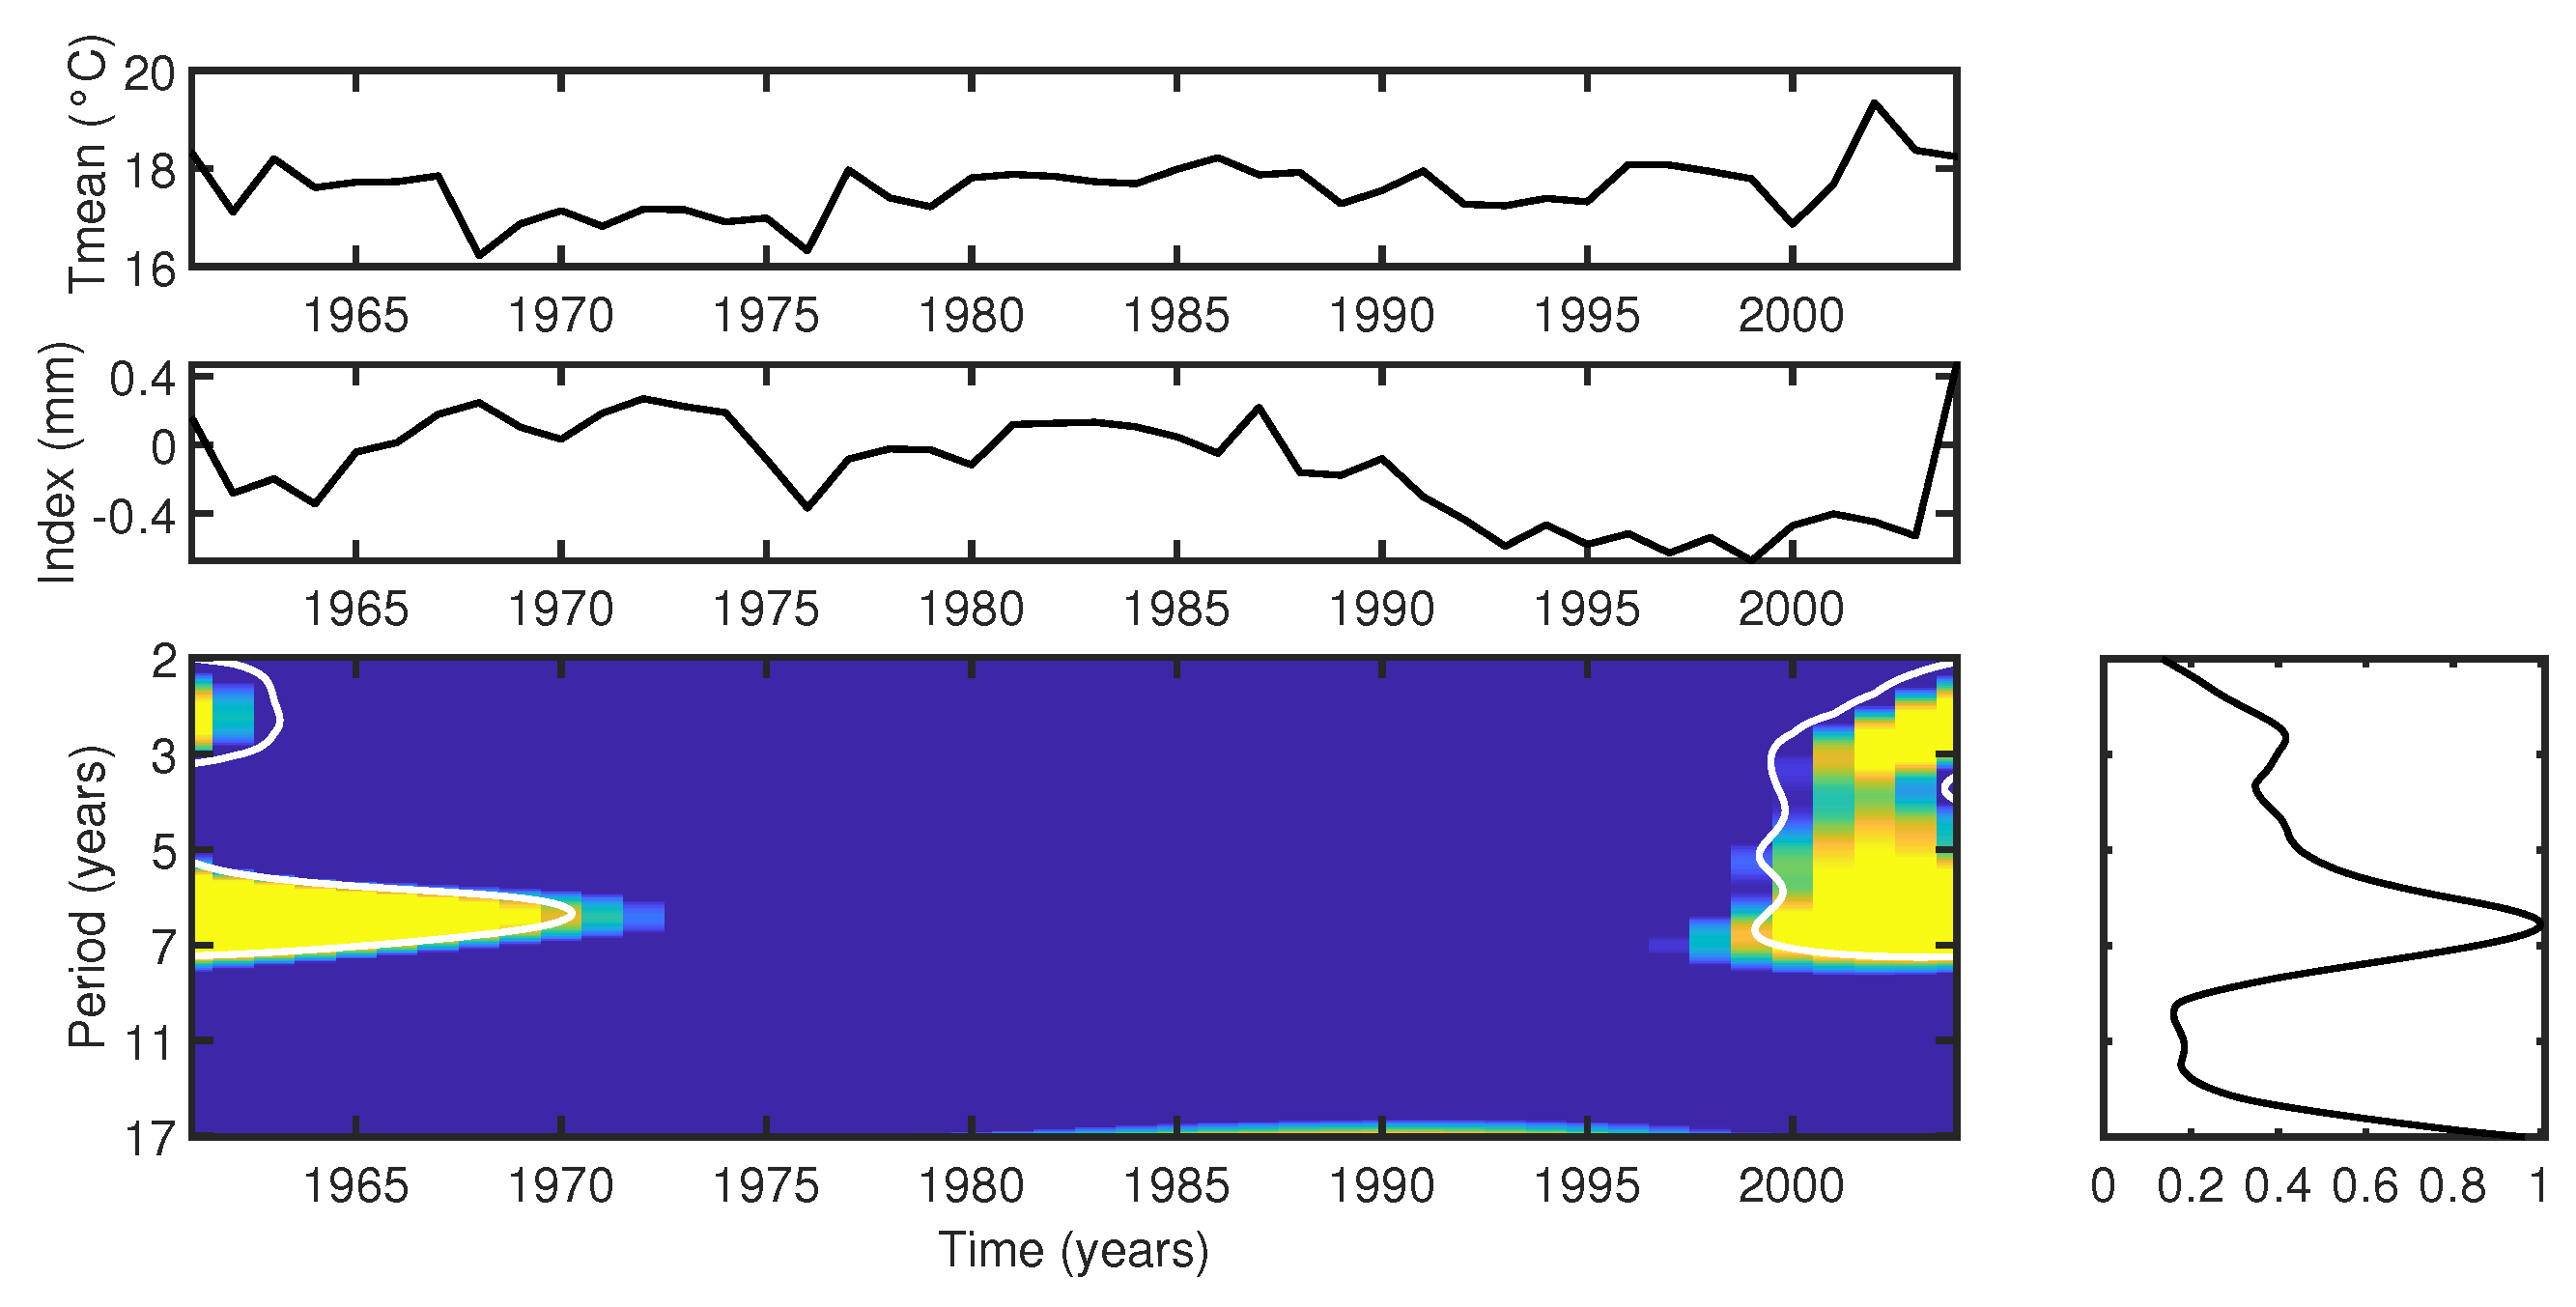
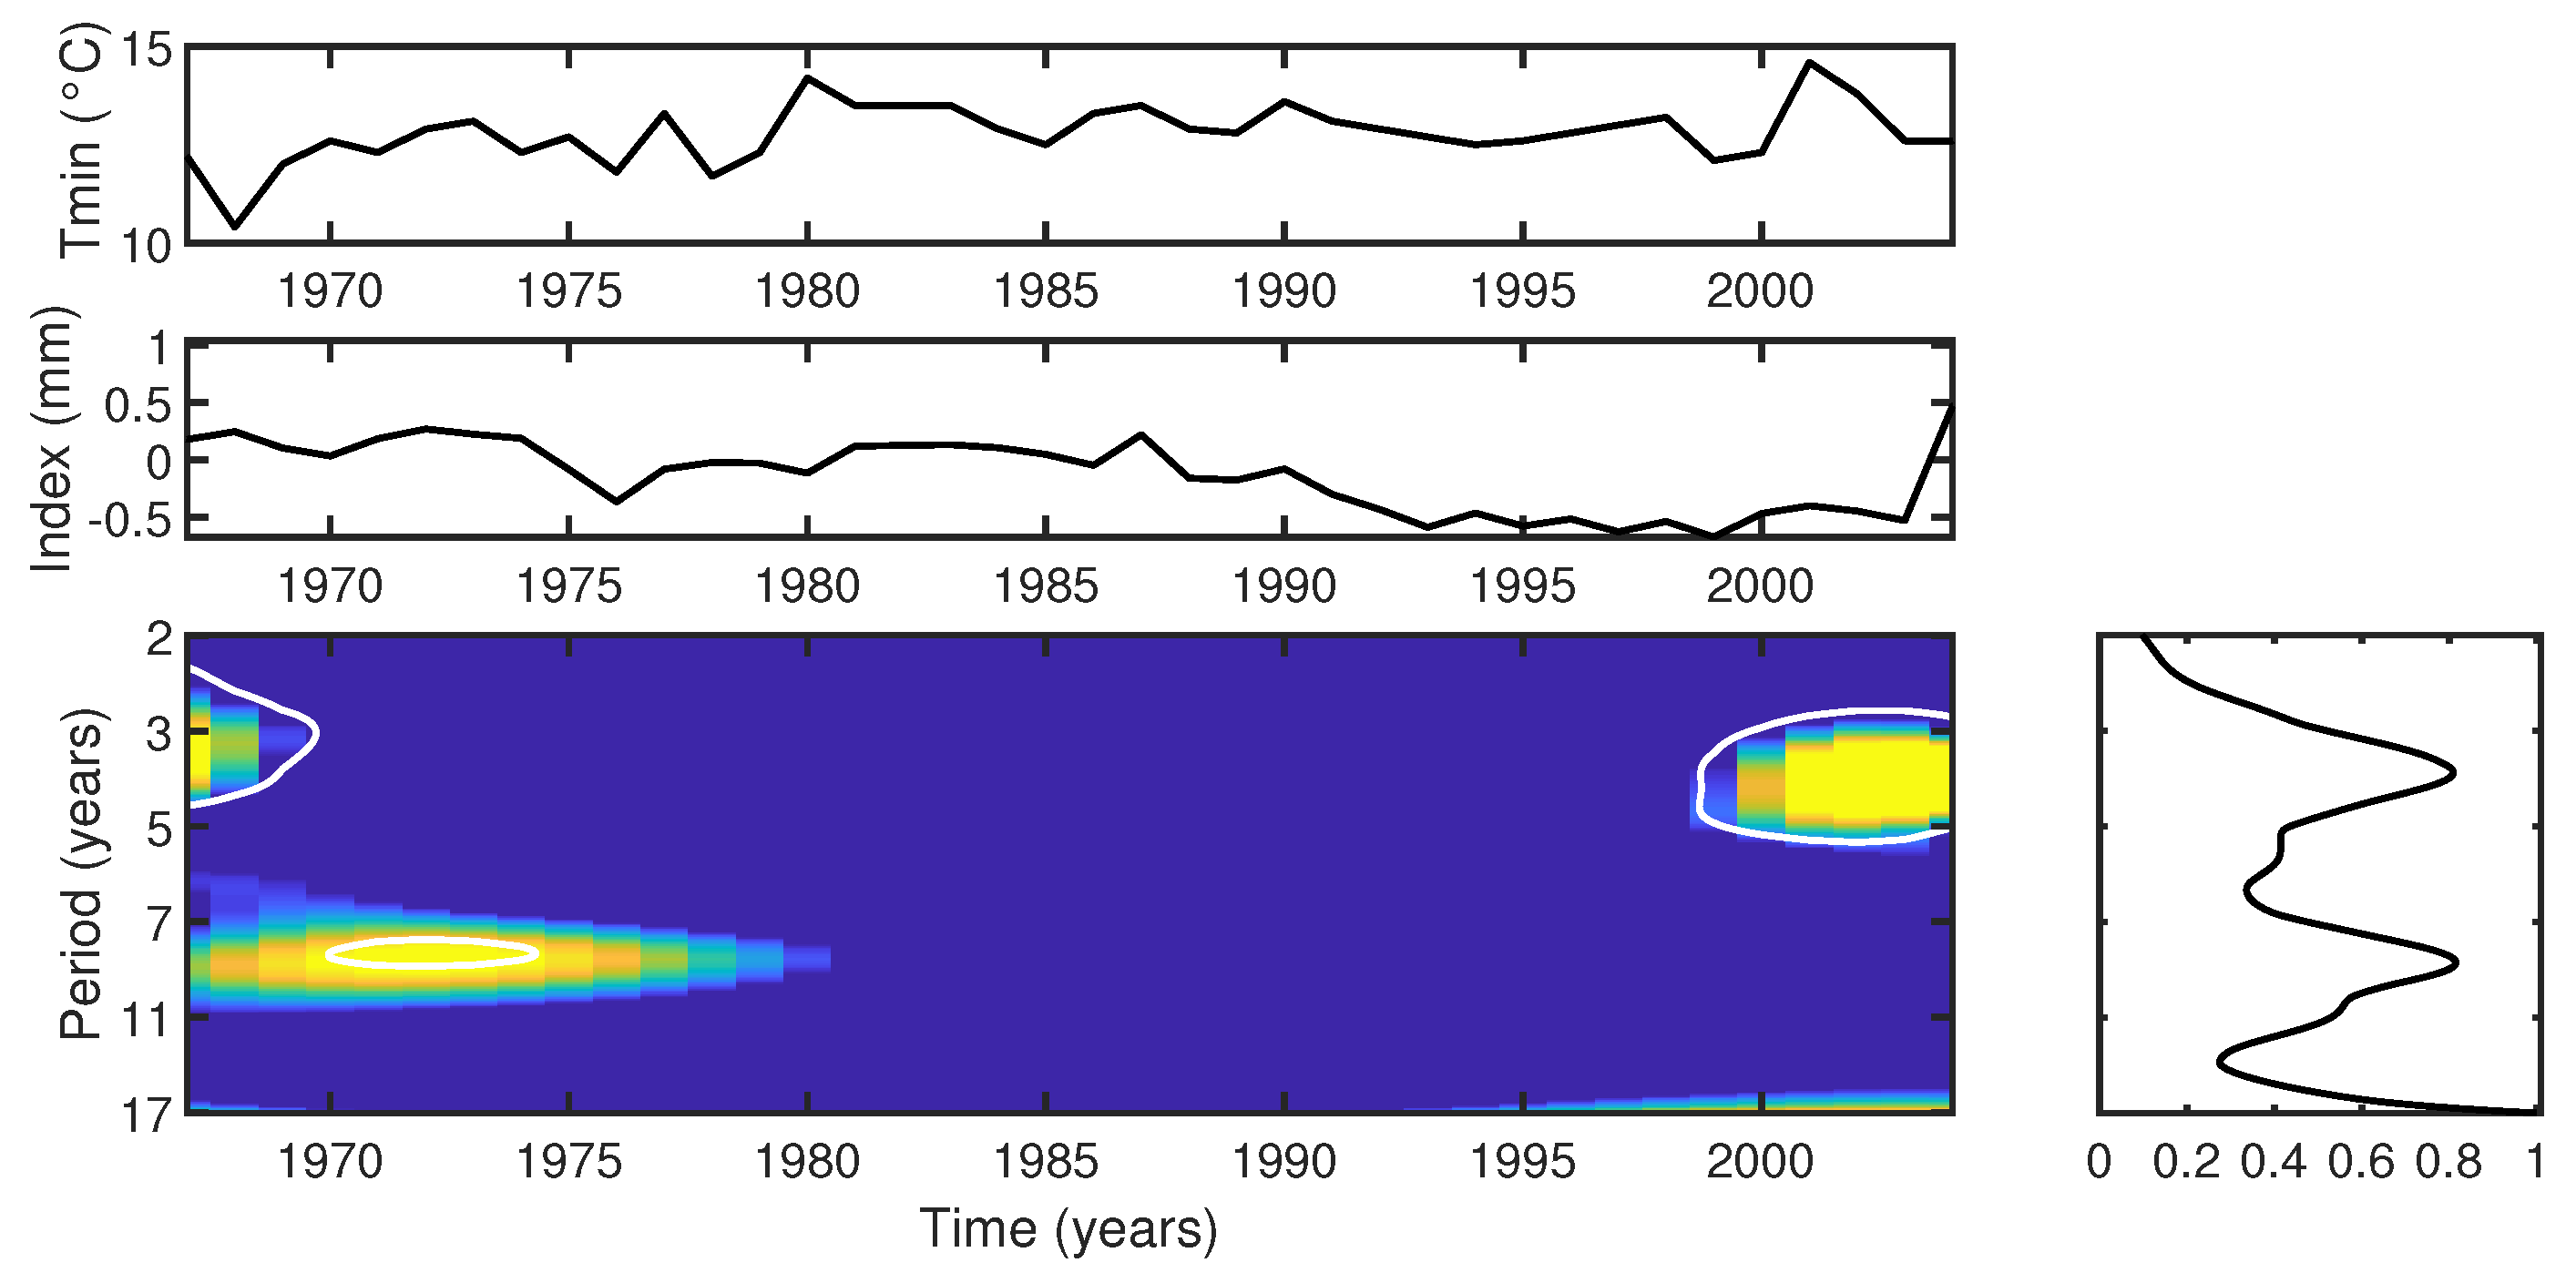
  • Cross-wavelet analysis shows that the Araucaria angustifolia tree-ring index from FLONA Três Barras is highly responsive to temperature fluctuations, particularly during periods of cooler temperatures (mean of 17 °C, years 1961–1970) and warmer conditions (mean of 19 °C, post-2002). The trees demonstrated a notable sensitivity to temperature variability, with pronounced growth responses during hot summers and mild winters. However, the period of reduced growth observed between 1991 and 1999 shows no correlation with temperature changes, suggesting that other factors, such as local microclimatic variations (e.g., humidity, soil moisture, or local temperature anomalies), may have played a role in influencing tree growth during this interval.
  • The analysis underscores the significant impact of precipitation on Araucaria angustifolia, particularly during drought periods (5–7-year and 3–5-year bands in 1970–1978 and 1986–1990, respectively). The trees demonstrate greater responsiveness to precipitation variability during these dry periods, emphasizing the intricate relationship between tree growth and rainfall patterns.
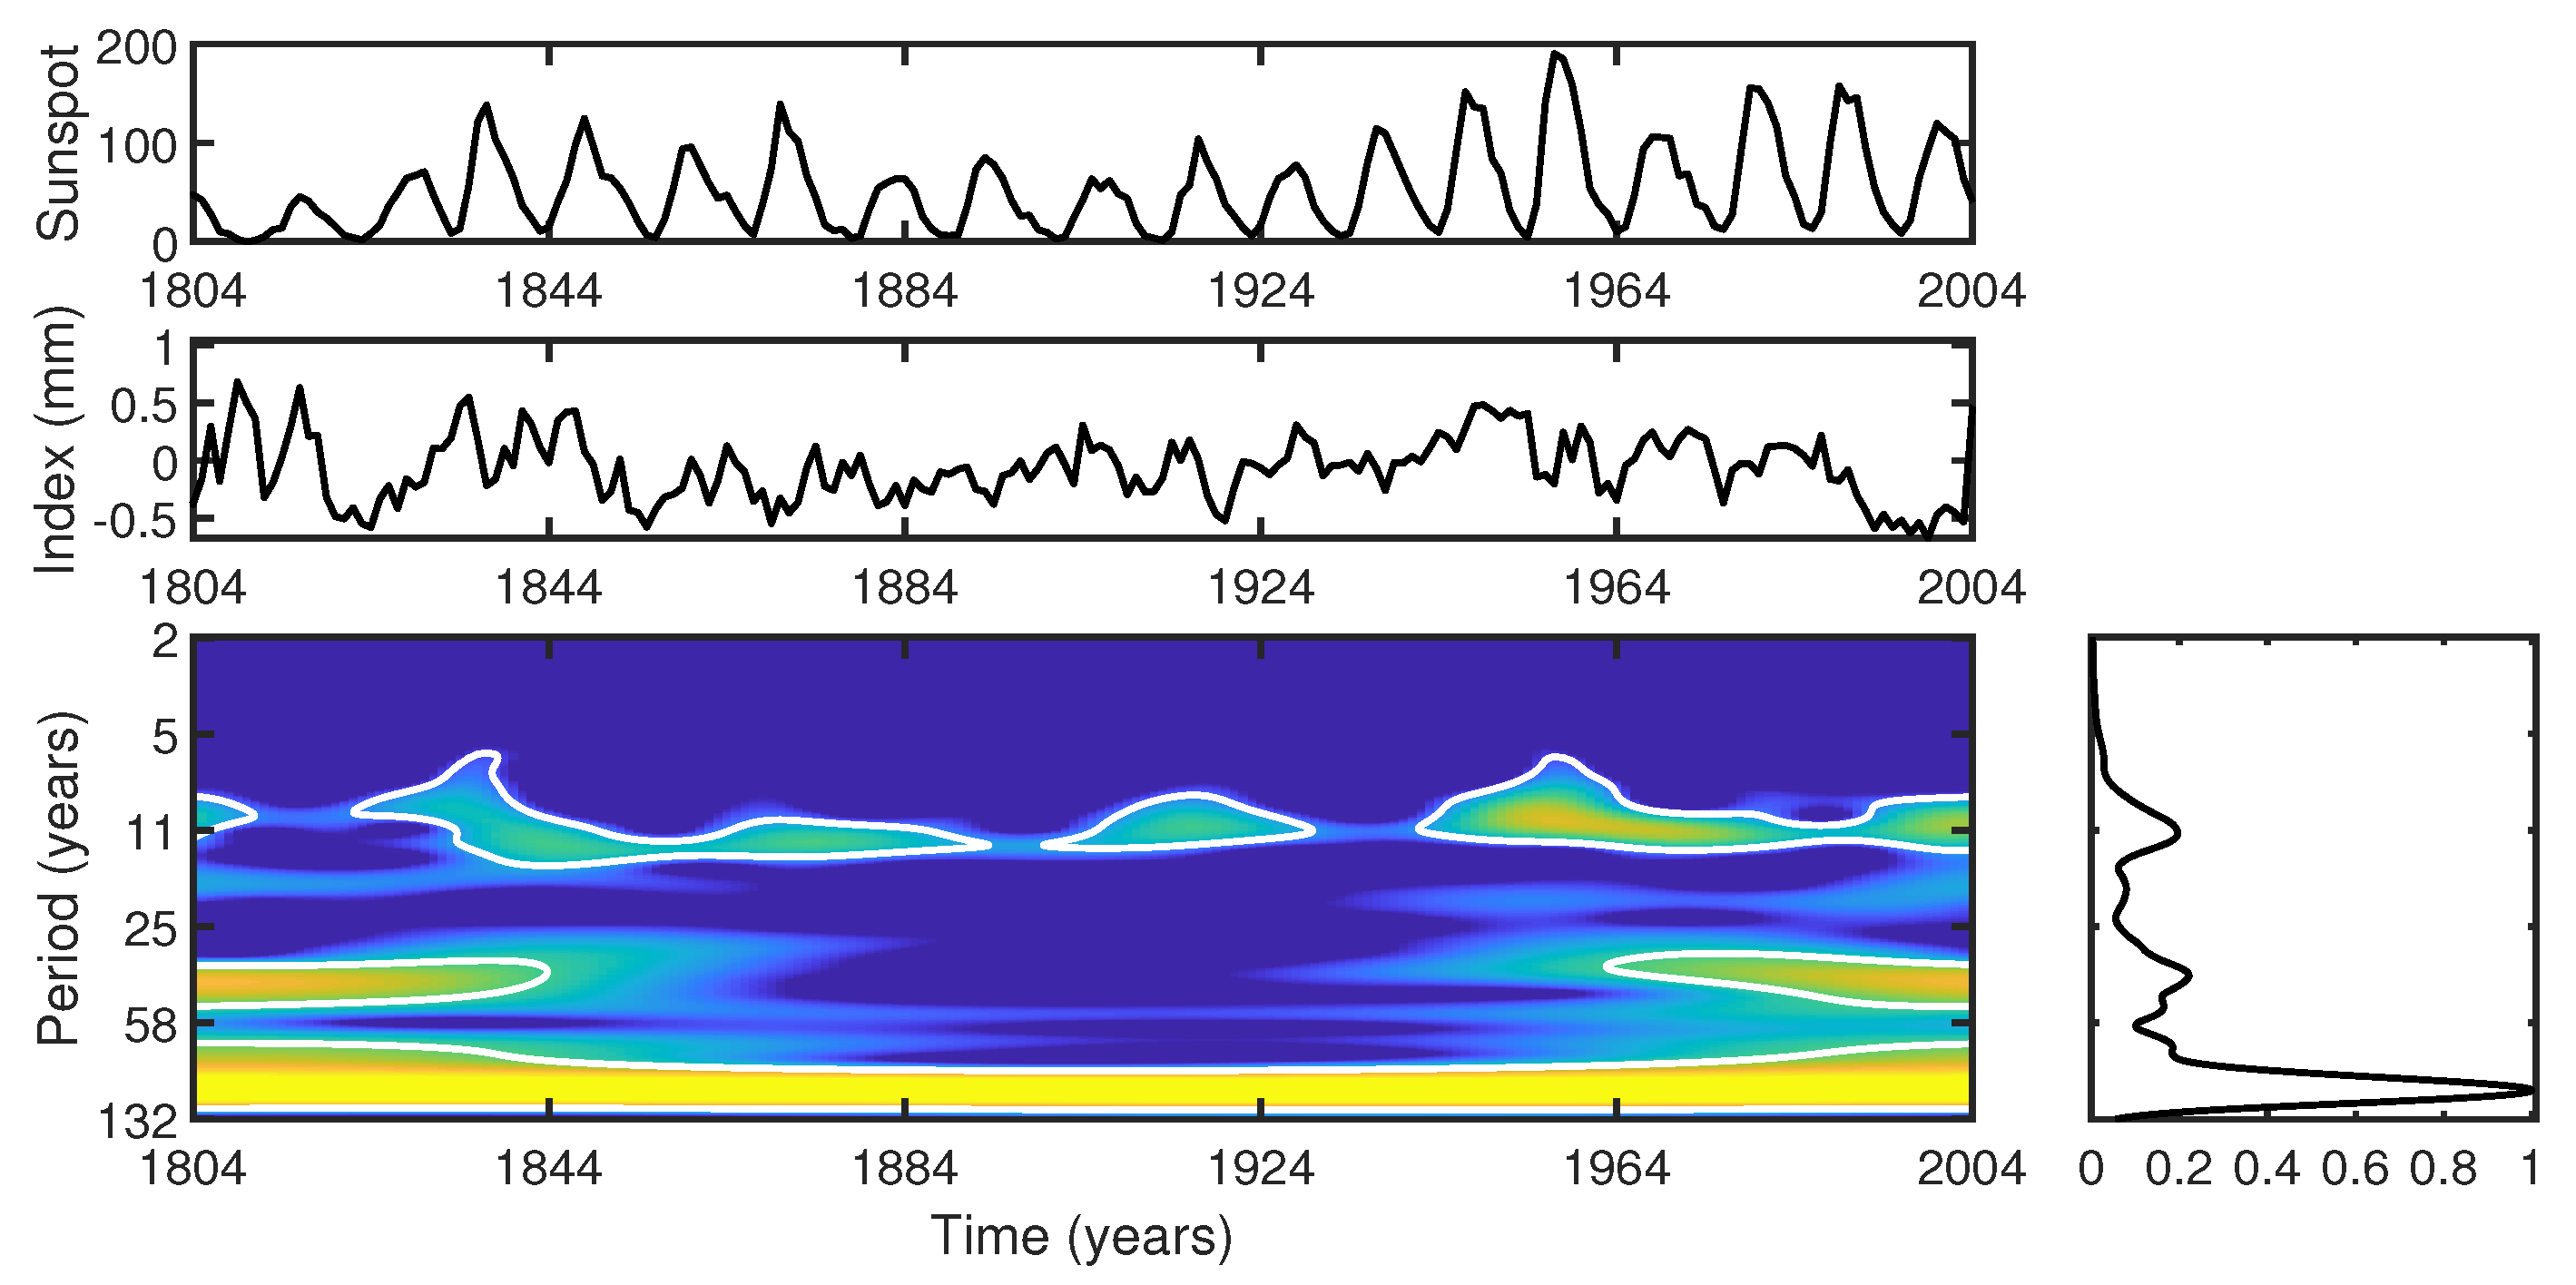
  • Cross-wavelet analysis reveals a dominant periodicity of around 11 years, corresponding to the Schwabe solar cycle. Furthermore, significant cross-wavelet power in the 25–58-year band suggests an association with longer-term solar cycles such as the Hale and Gleissberg cycles, and possibly the fourth harmonic of the Suess cycle, indicating the complex interaction between solar cycles and tree growth.
  • ENSO was identified as the primary climatic forcing driving tree-ring growth between 1910–1935 and 1990–2004, based on significant cross-wavelet power in the 4–8-year band. Between 1936 and 1989, other external factors influenced tree response, possibly indicating anthropogenic impacts or localized microclimate effects.
  • Seasonal correlation analysis revealed specific seasonal intervals, such as 1-month, 3-month, and 6-month periods, during which temperature and precipitation significantly influenced tree growth. For example, a negative correlation was observed for a 3-month season ending in March of the previous year ( r = 0.52 , α < 0.05 ) and a 6-month season ending in January of the previous year ( r = 0.45 , α < 0.05 ). This seasonal perspective addresses the inherent limitations of our wavelet analysis, which relied on an annual dataset and, due to the Nyquist criterion, can only resolve periodicities greater than two years. Seasonal correlation analysis complements the wavelet approach by filling this gap and capturing sub-annual variations in climate-tree growth interactions. Furthermore, since wavelet phase analysis primarily focuses on the temporal alignment of signals, it does not capture lagged influences shorter than two years, such as the impact of climatic conditions from the previous year. As a result, this aspect was not addressed in the present study.
  • Araucaria angustifolia emerges as a valuable species for studying the past climate in southern Brazil, given its highly responsive to climatic variations. Due to its endangered status, protective measures are essential not only for continued scientific inquiry into past environmental conditions but also to safeguard the livelihoods of local communities who rely on its seeds and timber for economic sustenance. Ensuring the conservation of this species is crucial for maintaining both ecological integrity and socio-economic stability in the region.
The interplay between precipitation and temperature reveals a complex interaction that significantly affects tree growth. These environmental factors are critical to the photosynthesis process and, consequently, tree development. Long-term climate cycles, such as ENSO, simultaneously shape temperature and precipitation conditions in a region, while droughts coupled with high temperatures can negatively impact growth. Seasonality also plays an important role, as a lack of precipitation during specific seasons can limit growth, even under otherwise favorable temperatures. The response is often species-specific, underscoring the importance of considering local conditions and temporal variability when interpreting the relationship between climate and tree growth.

Author Contributions

Conceptualization, V.K. and A.P.; methodology, V.K. and A.P.; validation, D.O.S.M., A.C.d.S. and C.L.L.; formal analysis, V.K. and A.P.; investigation, V.K., A.P., D.O.S.M., A.C.d.S. and C.L.L.; resources, V.K. and A.P.; data curation, A.C.d.S.; writing—original draft preparation, A.P. and A.C.d.S.; writing—review and editing, V.K. and A.P.; visualization, V.K. and A.P.; supervision, A.P.; project administration. D.O.S.M. contributed to the introduction and discussion sections and assisted in obtaining the INMET dataset. A.C.d.S. played a key role in developing the mean chronology. All authors have read and agreed to the published version of the manuscript.

Funding

This research received no external funding.

Institutional Review Board Statement

Not applicable.

Informed Consent Statement

Not applicable.

Data Availability Statement

To obtain the data for this study, please contact the authors via email.

Acknowledgments

The authors express their gratitude to FAPESP (Fundação de Amparo à Pesquisa do Estado de São Paulo) for its support through the Prestes A. FAPESP project (2009/02907-8), and to CNPq (Conselho Nacional de Desenvolvimento Científico e Tecnológico) for the funding provided under grant 308258/2021-5 (Klausner V.)

Conflicts of Interest

The authors declare no conflicts of interest.

References

  1. Hoyt, D.V.; Schatten, K.H. The Role of the Sun in Climate Change; Oxford University Press: Oxford, UK, 1997. [Google Scholar]
  2. Stute, M.; Clement, A.; Lohmann, G. Global climate models: Past, present, and future. Proc. Natl. Acad. Sci. USA 2001, 98, 10529–10530. [Google Scholar] [CrossRef]
  3. Thompson, L. Climate change: The evidence and our options. Behav. Anal. 2010, 33, 153–170. [Google Scholar] [CrossRef]
  4. Roe, G.; Baker, M.; Herla, F. Centennial glacier retreat as categorical evidence of regional climate change. Nat. Geosci. 2017, 10, 95–99. [Google Scholar] [CrossRef]
  5. Stevens-Rumann, C.S.; Kemp, K.B.; Higuera, P.E.; Harvey, B.J.; Rother, M.T.; Donato, D.C.; Morgan, P.; Veblen, T.T. Evidence for declining forest resilience to wildfires under climate change. Ecol. Lett. 2018, 21, 243–252. [Google Scholar] [CrossRef] [PubMed]
  6. Neukom, R.; Steiger, N.; Gómez-Navarro, J.J.; Wang, J.; Werner, J.P. No evidence for globally coherent warm and cold periods over the preindustrial Common Era. Nature 2019, 571, 550–554. [Google Scholar] [CrossRef] [PubMed]
  7. Dubreuil, V.; Fante, K.P.; Planchon, O.; Sant’Anna Neto, J.L. Climate change evidence in Brazil from Köppen’s climate annual types frequency. Int. J. Climatol. 2019, 39, 1446–1456. [Google Scholar] [CrossRef]
  8. Averchenkova, A.; Fankhauser, S.; Finnegan, J.J. The impact of strategic climate legislation: Evidence from expert interviews on the UK Climate Change Act. Clim. Policy 2021, 21, 251–263. [Google Scholar] [CrossRef]
  9. Nordemann, D.; Rigozo, N.; Faria, H. Solar activity and El-Niño signals observed in Brazil and Chile tree ring records. Adv. Space Res. 2005, 35, 891–896. [Google Scholar] [CrossRef]
  10. Rigozo, N.; Nordemann, D.; Echer, E.; Vieira, L.; Pereira de Souza Echer, M.; Prestes, A. Tree-ring width wavelet and spectral analysis of solar variability and climatic effects on a Chilean cypress during the last two and a half millennia. Clim. Past Discuss. 2005, 1, 121–135. [Google Scholar] [CrossRef]
  11. Rigozo, N.; Nordemann, D.; Echer, E.; Evangelista, H.; Pereira de Souza Echer, M.; Prestes, A. Solar and climate imprint differences in tree ring width from Brazil and Chile. J. Atmos. Sol.-Terr. Phys. 2007, 69, 449–458. [Google Scholar] [CrossRef]
  12. Rampelotto, P.H.; Rigozo, N.R.; da Rosa, M.B.; Prestes, A.; Frigo, E.; Souza Echer, M.P.; Nordemann, D.J.R. Variability of rainfall and temperature (1912–2008) parameters measured from Santa Maria (2941 S, 5348 W) and their connections with ENSO and solar activity. J. Atmos. Sol.-Terr. Phys. 2012, 77, 152–160. [Google Scholar] [CrossRef]
  13. Melvin, T.M.; Briffa, K.R. CRUST: Software for the implementation of Regional Chronology Standardisation: Part 2. Further RCS options and recommendations. Dendrochronologia 2014, 32, 343–356. [Google Scholar] [CrossRef]
  14. Biondi, F.; Waikul, K.K. DENDROCLIM2002: A C++ program for statistical calibration of climate signals in tree-ring chronologies. Comput. Geosci. 2004, 30, 303–311. [Google Scholar] [CrossRef]
  15. Jevsenak, J.; Levanič, T. dendroTools: R package for studying linear and nonlinear responses between tree-rings and daily environmental data. Dendrochronologia 2018, 48, 32–39. [Google Scholar] [CrossRef]
  16. Zang, C.S.; Biondi, F. treeclim: An R package for the numerical calibration of proxy-climate relationships. Ecography 2015, 38, 431–436. [Google Scholar] [CrossRef]
  17. Rigozo, N.R.; Viieira, L.E.A.; Echer, E.; Nordemann, D.J.R. Wavelet analysis of Solar-ENSO imprints in tree ring data from southern brazil in the last century. Clim. Chang. 2003, 60, 329–340. [Google Scholar] [CrossRef]
  18. Prestes, A.; Klausner, V.; Rojahn da Silva, I.; Ojeda-González, A.; Lorensi, C. Araucaria growth response to solar and climate variability in South Brazil. Ann. Geophys. 2018, 36, 717–729. [Google Scholar] [CrossRef]
  19. Muraja, D.; Klausner, V.; Prestes, A.; Rojahn da Silva, I. Ocean–atmosphere interaction identified in tree-ring time series from southern Brazil using cross-wavelet analysis. Theor. Appl. Climatol. 2023, 153, 1177–1189. [Google Scholar] [CrossRef]
  20. Kogan, F. Satellite-Observed Sensitivity of World Land Ecosystems to El Niño/La Niña. Remote Sens. Environ. 2000, 74, 445–462. [Google Scholar] [CrossRef]
  21. Grimm, A.M.; Ferraz, S.E.T.; Gomes, J. Precipitation anomalies in Southern Brazil associated with El Niño and La Niña events. J. Clim. 1998, 11, 2863–2880. [Google Scholar] [CrossRef]
  22. Stuiver, M.; Quay, P.D. Changes in Atmospheric Carbon-14 Attributed to a Variable Sun. Science 1980, 207, 11–19. [Google Scholar] [CrossRef] [PubMed]
  23. Rigozo, N.; Nordemann, D.; Echer, E.; Zanandrea, A.; Gonzalez, W. Solar Variability Effects Studied by Tree-Ring Data Wavelet Analysis. Adv. Space Res. 2002, 29. [Google Scholar] [CrossRef]
  24. Nordemann, D.J.R.; Rigozo, N.R.; Echer, E.; Vieira, L.E.A. Solar activity and El Ninõ effects on Southern Brazil Araucaria ring widths (1955–1997). In Proceedings of the International Conference on Dendrochronology, Quebec, QC, Canada, 22–27 August 2002. [Google Scholar]
  25. Nordemann, D.J.R.; Rigozo, N.R. Árvores Contam uma História do Sol. Sci. Am. 2003, 2, 30–37. [Google Scholar]
  26. Rigozo, N.; Evangelista, H.; Nordemann, D.; Echer, E.; Pereira de Souza Echer, M.; Prestes, A. The Medieval and Modern Maximum solar activity imprints in tree ring data from Chile and stable isotope records from Antarctica and Peru. J. Atmos. Sol.-Terr. Phys. 2008, 70, 1012–1024. [Google Scholar] [CrossRef]
  27. Prestes, A. Relação Sol-Terra Estudada Através de Anéis de Crescimento de Coníferas do Holoceno Recente e Triássico. 2009. Ph.D. Thesis, Instituto Nacional de Pesquisas Espaciais, São José dos Campos, Brazil, 2009. [Google Scholar]
  28. Prestes, A.; Rigozo, N.R.; Nordemann, D.J.R.; Wrasse, C.M.; Souza Echer, M.P.; Echer, E.; da Rosa, M.B.; Rampelotto, P.H. Sun-earth relationship inferred by tree growth rings in conifers from Severiano de Almeida, Southern Brazil. J. Atmos. Sol.-Terr. Phys. 2011, 73, 1587–1593. [Google Scholar] [CrossRef]
  29. Rigozo, N.; Lisi, C.; Filho, M.; Prestes, A.; Nordemann, D.; Pereira de Souza Echer, M.; Echer, E.; Evangelista, H.; Rigozo, V. Solar-Terrestrial Signal Record in Tree Ring Width Time Series from Brazil. Pure Appl. Geophys. 2012, 169, 2181–2191. [Google Scholar] [CrossRef]
  30. Li, Q.; Liu, Y.; Deng, R.; Liu, R.; Song, H.; Wang, Y.; Li, G. Combination of Tree Rings and Other Paleoclimate Proxies to Explore the East Asian Summer Monsoon and Solar Irradiance Signals: A Case Study on the North China Plain. Atmosphere 2020, 11, 1180. [Google Scholar] [CrossRef]
  31. Opała-Owczarek, M.; Galstyan, H.; Owczarek, P.; Sayadyan, H.; Vardanyan, T. Dendrochronological Potential of Drought-Sensitive Tree Stands in Armenia for the Hydroclimate Reconstruction of the Lesser Caucasus. Atmosphere 2021, 12, 153. [Google Scholar] [CrossRef]
  32. Charbonneau, P. Dynamo models of the solar cycle. Living Reviews in Solar Physics. Living Rev. Sol. Phys. 2010, 7, 3. [Google Scholar] [CrossRef]
  33. Hathaway, D.H. The solar cycle. Living Rev. Sol. Phys. 2015, 12, 4. [Google Scholar] [CrossRef] [PubMed]
  34. Solanki, S.K.; Fligge, M. Solar irradiance since 1874 revisited. Geophys. Res. Lett. 1998, 25, 341–344. [Google Scholar] [CrossRef]
  35. Fontana, C.; Reis-Avila, G.; Nabais, C.; Botosso, P.; Oliveira, J.M. Dendrochronology and climate in the Brazilian Atlantic Forest: Which species, where and how. Neotrop. Biol. Conserv. 2018, 13, 321–333. [Google Scholar] [CrossRef]
  36. Silva, D.O.; Prestes, A.; Klausner, V.; de Souza, T.G.G. Climate Influence in Dendrochronological Series of Araucaria angustifolia from Campos do Jordão, Brazil. Atmosphere 2021, 12, 957. [Google Scholar] [CrossRef]
  37. Oliveira, J.; Adenesky, E.F.; Quadros, K. Avaliação do crescimento do lenho de Araucaria angustifolia No Planalto Norte De Santa Catarina. Floresta 2017, 47, 155–164. [Google Scholar] [CrossRef]
  38. Albiero-Júnior, A.; Venegas-González, A.; Rodríguez-Catón, M.; Oliveira, J.M.; Longhi-Santos, T.; Galvão, F.; Temponi, L.G.; Botosso, P.C. Edge Effects Modify the Growth Dynamics and Climate Sensitivity of Araucaria angustifolia Trees. Tree-Ring Res. 2020, 76, 11–26. [Google Scholar] [CrossRef]
  39. Scipioni, M.C.; Fontana, C.; Oliveira, J.M.; Santini Junior, L.; Roig, F.A.; Tomazello-Filho, M. Effects of cold conditions on the growth rates of a subtropical conifer. Dendrochronologia 2021, 68, 125858. [Google Scholar] [CrossRef]
  40. das Neves Brandes, A.F.; Albuquerque, R.P.; Lisi, C.S.; de Lemos, D.N.; Nicola, L.R.M.; Melo, A.L.F.; Barros, C.F. The growth responses of Araucaria angustifolia to climate are adjusted both spatially and temporally at its northern distribution limit. For. Ecol. Manag. 2021, 487, 119024. [Google Scholar] [CrossRef]
  41. Scipioni, M.C.; Dobner, M., Jr.; Longhi, S.J.; Vibrans, A.C.; Schneider, P.R. The last giant Araucaria trees in southern Brazil. Sci. Agric. 2019, 76, 220–226. [Google Scholar] [CrossRef]
  42. Magnanini, A.; Magnanini, C. Árvores gigantescas da Terra e as Maiores Assinaladas no Brasil; CNRBMA: São Paulo, Brazil, 2002; 20p. [Google Scholar]
  43. Maack, R. Geografia Física do Estado do Paraná; José Olympio: Curitiba, Brazil, 1968. [Google Scholar]
  44. Lindmann, C.A. A Vegetação no Rio Grande do Sul; EDUSP: Belo Horizonte, Brazil, 1974. [Google Scholar]
  45. Castro, M.; Barbosa, A.; Pompeu, P.; Eisenlohr, P.V.; Pereira, G.d.A.; Apgaua, D.M.G.; Pires-Oliveira, J.C.; Barbosa, J.P.R.A.D.; Fontes, M.A.L.; dos Santos, R.M.; et al. Will the emblematic southern conifer Araucaria angustifolia survive to climate change in Brazil? Biodivers. Conserv. 2020, 29, 291–607. [Google Scholar] [CrossRef]
  46. Mundo, I.; Juñent, F.R.R.; Villalba, R.; Kitzberger, T.; Barrera, M. Araucaria araucana tree-ring chronologies in Argentina: Spatial growth variations and climate influences. Trees 2011, 26, 443–458. [Google Scholar] [CrossRef]
  47. Silva, D.O.; Klausner, V.; Prestes, A.; Macedo, H.G.; Aakala, T.; Silva, I.R. Principal Components Analysis: An Alternative Way for Removing Natural Growth Trends. Pure Appl. Geophys. 2021, 178, 3131–3149. [Google Scholar] [CrossRef]
  48. Avila, B.P.; Henzel, A.; Foesch, M.D.S.; Almeida, E.W.D.; Molina, A.; Guarino, E. Importance of Pinhao in the Conservation of Araucaria Forests and the Social Role of the Consumer Market. Floresta 2023, 53, 413–422. [Google Scholar] [CrossRef]
  49. Marchioro, C.A.; Santos, K.L.; Siminski, A. Present and future of the critically endangered Araucaria angustifolia due to climate change and habitat loss. Forestry 2020, 93, 401–410. [Google Scholar] [CrossRef]
  50. Wilson, O.J.; Mayle, F.E. A conservation assessment of Brazil’s iconic and threatened Araucaria Forest-Campos mosaic. Biol. Conserv. 2024, 296, 110650. [Google Scholar] [CrossRef]
  51. Behling, H.; Verissimo, N.; Bauermann, S.G.; Bordignon, S.A.; Evaldt, A.C.P. Late Holocene Vegetation History and Early Evidence of Araucaria angustifolia in Caçapava do Sul in the Lowland Region of Rio Grande do Sul State, Southern Brazil. Braz. Arch. Biol. Technol. 2016, 59, e16150264. [Google Scholar] [CrossRef]
  52. Rigozo, N.R.; Nordemann, D.J.R.; Echer, E.; Vieira, L.E.A. Search for Solar Periodicities in Tree-ring Widths from Concórdia (S.C., Brazil). Pure Appl. Geophys. 2004, 161, 221–233. [Google Scholar] [CrossRef]
  53. Gurgel, J.; Gurgel Filho, O. Evidências de raças geográficas no pinheiro-brasileiro, Araucaria angustifolia (Bert.) O. Ktze. Ciência E Cult. 1965, 17, 33–39. [Google Scholar]
  54. de Oliveira, J.R.; Filho, E.A.; de Quadros, K.E. Avaliação do crescimento do lenho de Araucaria angustifolia no planalto norte de Santa Catarina. Floresta 2017, 47, 155–164. [Google Scholar] [CrossRef]
  55. Dutra, T.L.; Stranz, A. História das Araucariaceae: A contribuição dos fósseis para o entendimento das adaptações modernas da família, com vistas a seu manejo e conservação. In Tecnologia, Diagnóstico e Planejamento Ambiental; Ronchi, L., Wöhl, O., Eds.; Unissinos: São Leopoldo, Brazil, 2003; pp. 293–351. [Google Scholar]
  56. Santarosa, E.; de Oliveira, J.M.; Roig, F.A.; Pillar, V.D. Crescimento Sazonal em Araucaria angustifolia: Evidências anatômicas. Rev. Bras. De Biociências 2007, 5, 618–620. [Google Scholar]
  57. Oliveira, J.M.; Roig, F.A.; Pillar, V.D. Climatic signals in tree-rings of Araucaria angustifolia in the southern Brazilian highlands. Austral Ecol. 2010, 35, 134–147. [Google Scholar] [CrossRef]
  58. Brasil, M.d.M.A. Portaria MMA n∘ 443, de 17 de dezembro de 2014, dispõem sobre as espécies da flora brasileira ameaçadas de extinção. 2014. Available online: http://cncflora.jbrj.gov.br/portal/static/pdf/portaria_mma_443_2014.pdf (accessed on 6 December 2021).
  59. MMA/ICMBIO. Plano de Manejo da Floresta Nacional de trêS Barras—Volume I—Diagnóstico; Technical Report; Instituto Chico Mendes de ConservaçãO da Biodiversidade: Brasília, Brazil, 2016.
  60. Rizzini, C.T. Tratado de fitogeografia do Brasil: Aspectos Ecológicos; Hucitec/Edusp: São Paulo, Brazil, 1979. [Google Scholar]
  61. da Cunha Marques, A. Planejamento da paisagem da floresta nacional de Três Barras (Três Barras—SC): Subsídios ao plano de manejo. Rev. Geogr. 2007, 1. [Google Scholar] [CrossRef]
  62. Stefenon, V.M.; Gailing, O.; Finkeldey, R. Genetic structure of Araucaria angustifolia (Araucariaceae) populations in Brazil: Implications for the in situ conservation of genetic resources. Plant Biol. 2007, 94, 516–525. [Google Scholar] [CrossRef]
  63. de Sousa, V.A.; Reeves, P.; Reilley, A.; de Aguiar, A.V.; Stefenon, V.M.; Richards, C. Genetic diversity and biogeographic determinants of population structure in Araucaria angustifolia (Bert.) O. Ktze. Conserv. Genet. 2020, 21, 217–229. [Google Scholar] [CrossRef]
  64. Nimer, E. Climatologia do Brasil; IBGE: Rio de Janeiro, Brazil, 1989.
  65. Webb, E.; Magi, B. The Ensemble Oceanic Niño Index. Int. J. Climatol. 2022, 42, 5321–5341. [Google Scholar] [CrossRef]
  66. Suhadi, S.; Putri, J.K.; Iskandar, I.; Supari, S.; Irfan, M.; Ariska, M.; Akhsan, H. Morlet’S Wavelet Analysis on El NiñO Southern Oscillation (Enso) and the Indian Ocean Dipole (IOD) For 84 Years: 1940–2023. Indones. Phys. Rev. 2024, 7, 552–561. [Google Scholar] [CrossRef]
  67. Grissino-Mayer, H. Evaluating Crossdating Accuracy: A Manual and Tutorial for the Computer Program COFECHA. Tree-Ring Res. 2001, 57, 205–221. [Google Scholar]
  68. Wigley, T.M.L.; Briffa, K.R.; Jones, P.D. On the Average Value of Correlated Time Series, with Applications in Dendroclimatology and Hydrometeorology. J. Appl. Meteorol. Climatol. 1984, 23, 201–213. [Google Scholar] [CrossRef]
  69. Helama, S.; Lindholm, M.; Timonen, M.; Eronen, M. Detection of climate signal in dendrochronological data analysis: A comparison of tree-ring standardization methods. Theor. Appl. Climatol. 2004, 79, 239–254. [Google Scholar] [CrossRef]
  70. Fowler, A.M. Variance Stabilization Revisited: A Case For Analysis Based On Data Pooling. Tree-Ring Res. 2009, 65, 129–145. [Google Scholar] [CrossRef]
  71. Cook, E.; Kairiukstis, L. Methods of Dendrochronology—Applications in the Environmental Sciences; Springer Netherlands: Dordrecht, The Netherlands, 1990. [Google Scholar]
  72. Fritts, H.C. Tree Rings and Climate; The University of Arizona Press: Tucson, AZ, USA, 1976. [Google Scholar]
  73. Shiyatov, S.G.; Mazepa, V.S. Some New Approaches in the Consideration of More Reliable Dendroclimatological Series and in the Analysis of Cycle Components; Methods of Dendrochronology; Kairiukstis, L., Cook, E.R., Eds.; International Institute for Applied Systems Analysis: Laxenburg, Austria; Polish Academy of Sciences-System Research Institute: Warsaw, Poland, 1987. [Google Scholar]
  74. Conover, W. Practical Nonparametric Statistics, 2nd ed.; John Wiley & Sons: New York, NY, USA, 1980; p. 493. [Google Scholar]
  75. Silva Muraja, D.O.; Klausner, V.; Prestes, A.; Aakala, T.; Macedo, H.G.; Rojahn da Silva, I. Exploring the Centennial-Scale Climate History of Southern Brazil with Ocotea porosa (Nees & Mart.) Barroso Tree-Rings. Atmosphere 2023, 14, 1463. [Google Scholar] [CrossRef]
  76. Torrence, C.; Compo, G.P. A Practical Guide to Wavelet Analysis. Bull. Am. Meteorol. Soc. 1998, 79, 61–78. [Google Scholar] [CrossRef]
  77. Percival, D.B.; Walden, A.T. Wavelet Methods for Time Series Analysis; Cambridge Series in Statistical and Probabilistic Mathematics; Cambridge University Press: Cambridge, UK, 2000. [Google Scholar] [CrossRef]
  78. Schweingruber, F.H. Tree Rings: Basics and Applications of Dendrochronology; D. Reidel Publishing Company: Dordrecht, The Netherlands, 1988. [Google Scholar]
  79. Wilmking, M.; Maaten-Theunissen, M.; Maaten, E.; Scharnweber, T.; Buras, A.; Biermann, C.; Gurskaya, M.; Hallinger, M.; Lange, J.; Shetti, R.; et al. Global assessment of relationships between climate and tree growth. Glob. Chang. Biol. 2020, 26, 3212–3220. [Google Scholar] [CrossRef] [PubMed]
  80. Meko, D.M.; Touchan, R.; Anchukaitis, K.J. Seascorr: A MATLAB program for identifying the seasonal climate signal in an annual tree-ring time series. Comput. Geosci. 2011, 37, 1234–1241. [Google Scholar] [CrossRef]
  81. Pereira de Souza Echer, M.; Echer, E.; Nordemann, D.; Rigozo, N.; Prestes, A. Wavelet analysis of a centennial (1895–1994) southern Brazil rainfall series (Pelotas, 314619′′ S 522033′′ W). Clim. Chang. 2008, 87, 489–497. [Google Scholar] [CrossRef]
  82. Miyahara, H.; Yokoyama, Y.; Yamaguchi, Y.T. Influence of the Schwabe/Hale solar cycles on climate change during the Maunder Minimum. Proc. Int. Astron. Union 2010, 264, 427–433. [Google Scholar] [CrossRef]
  83. Raspopov, O.M.; Shumilov, O.; Kasatkina, E.A.; Turunen, E.; Lindholm, M. 35-year Climatic Bruckner Cycle - Solar Control of Climate Variability? In Proceedings of the The Solar Cycle and Terrestrial Climate, Solar and Space Weather, Tenerife, Spain, 25–29 September 2000; Wilson, A., Ed.; ESA Special Publication: Paris, France, 2000; Volume 463, p. 517. [Google Scholar]
  84. Raspopov, O.; Dergachev, V.; Shumilov, O.; Kolstrom, T.; Lindholm, M.; Merilainen, J.; Eggertsson, O.; Vasiliev, S.S.; Kuzmin, A.; Yu Kirtsidely, I.; et al. Dendrochonological evidence of long-term variations in solar activity and climate. In International Conference Tree Rrings and People–Abstracts; Kaennel, D.M., Bräker, O.U., Eds.; Swiss Federal Research Institute WSL: Davos Dorf, Switzerland, 2001; pp. 22–26. [Google Scholar]
  85. Dai, A.; Wigley, T.M.L. Global Patterns of ENSO-induced Precipitation. Geophys. Res. Lett. 2000, 27, 1283–1286. [Google Scholar] [CrossRef]
  86. Kurths, J.; Spiering, C.; Muller-Stoll, W.; Striegler, U. Search for solar periodicities in Miocene tree ring widths. Terra Nova 1993, 5, 359–363. [Google Scholar] [CrossRef]
  87. Damon, P.E.; Eastoe, C.J.; Hughes, M.K.; Kalin, R.M.; Long, A.; Peristykh, A.N. Secular Variation of Δ14C During the Medieval Solar Maximum: A Progress Report. Radiocarbon 1997, 40, 343–350. [Google Scholar] [CrossRef]
Figure 1. Individuals of the Araucaria angustifolia species. Source: Natural Records Laboratory (LRN).
Atmosphere 16 00287 g001
Figure 2. Location of the National Forest of Três Barras (yellow color) and the boundary cities where occurred the collections (blue color): Três Barras (sample collection location in 2005) and Canoinhas (sample collection location in 2011). Additionally, the climatic parameters (precipitation and temperature) were obtained from the cities of Ivaí and Irati, which are highlighted in black.
Atmosphere 16 00287 g002
Figure 3. Growth rings of Araucaria angustifolia: (a) growth ring characterized by earlywood and latewood; (b) earlywood (clear cell layer); (c) latewood (dark cell layer). Source: Natural Records Laboratory (LRN).
Atmosphere 16 00287 g003
Figure 4. Sample extraction using a Pressler Probe. Source: Natural Records Laboratory (LRN).
Atmosphere 16 00287 g004
Figure 5. Panel (A) demonstrates the initial state of the cores. The cores extracted by the increment borer are cylindrical in shape, preserving the cross-sectional structure of the tree rings, which allows for accurate dendrochronological analysis after proper preparation and mounting. Panel (B) shows the properly sanded and mounted samples, highlighting the tree-ring boundaries. Source: Natural Records Laboratory (LRN).
Atmosphere 16 00287 g005
Figure 6. Time series of climatic and geophysical parameters used in this study. The panels show the Southern Oscillation Index (SOI), precipitation (Prec), mean temperature (Tmean), maximum temperature (Tmax), minimum temperature (Tmin), and sunspot numbers (SSN) from 1804 to 2004.
Atmosphere 16 00287 g006
Figure 7. Tree-ring series (blue line) and the detrending applied in each series (red line). The last graph is the average tree-ring series.
Atmosphere 16 00287 g007
Figure 8. The corrected index (black line), the change in sample size displayed as the number of trees (blue line), and the uncorrected mean index (light gray line).
Atmosphere 16 00287 g008
Figure 9. Histogram of the tree-ring index with the fitted normal probability density function. Results of the Lilliefors test for normality [74] are displayed in the upper panel (A) and the bottom panel (B).
Atmosphere 16 00287 g009
Figure 10. The figure presents the correlation results between the mean tree-ring index and seasonalized climate variables, specifically precipitation (P, primary climate variable) and temperature (T, secondary climate variable). The top panel shows the simple correlations between the mean chronology (index) and precipitation ( r x , P ), while the bottom panel displays the partial correlations between the index and temperature ( r x , T . P ), controlling for the influence of precipitation. Significance levels are indicated by color coding (blue for precipitation and red for temperature), with thresholds at α = 0.01 and α = 0.05 (dark blue and light blue, respectively, for precipitation, and red and pink, respectively, for temperature). Asterisks (*) denote months from the previous year.
Atmosphere 16 00287 g010
Figure 11. The index of FLONA Três Barras (Index) and its wavelet scalogram, from 1684 to 2004, for periods ranging from 2 to 264 years. Top: Timeline average width of the tree-ring index obtained. Middle: Wavelet scalogram with no cone of influence due to the elimination of the border effects using the symmetrization method. A confidence level of 95% (white outline), using a red-noise background spectrum. The Y-axis represents the scale of the spectrum period, and the X-axis represents time. Bottom: The color scale indicates the normalized energy power (between 0 and 1) for each periodicity at a given time.
Atmosphere 16 00287 g011
Figure 12. Cross-wavelet transform between the tree-ring index and the SOI index. (Top): The SOI index. (Middle): The index. (Bottom): The contour plot represents the significance levels for 95% (red noise α = 0.72 ). The bottom right panel presents the global wavelet spectrum, which is defined as the normalized wavelet coefficients power average for each scale (between 0 and 1).
Atmosphere 16 00287 g012
Figure 13. Annual filtered time series of SOI (red line) and tree-ring index (black line) filtered in 4–8-year bandwidth.
Atmosphere 16 00287 g013
Figure 14. Cross-wavelets between the tree-ring index and annual precipitation of Irati, from 1961 to 2004, with the confidence level of 95% (white outline). The color-coded scale represents the logarithm of the squared modulus of the wavelet coefficients, with yellow indicating the condition where the energy percentage is at its maximum and dark blue representing the condition where the energy percentage is at its minimum.
Atmosphere 16 00287 g014
Figure 15. Cross-wavelets between the tree-ring index and the temperature data with the confidence level of 95% (white outline). The color-coded scale represents the logarithm of the squared modulus of the wavelet coefficients, with yellow indicating the condition where the energy percentage is at its maximum and dark blue representing the condition where the energy percentage is at its minimum.
Atmosphere 16 00287 g015
Figure 16. Cross-wavelets between the tree-ring index and the maximum temperature with the confidence level of 95% (white outline). The color-coded scale represents the logarithm of the squared modulus of the wavelet coefficients, with yellow indicating the condition where the energy percentage is at its maximum and dark blue representing the condition where the energy percentage is at its minimum.
Atmosphere 16 00287 g016
Figure 17. Cross-wavelets between the tree-ring index and the minimum temperature with the 95 confidence level (white outline). The color-coded scale represents the logarithm of the squared modulus of the wavelet coefficients, with yellow indicating the condition where the energy percentage is at its maximum and dark blue representing the condition where the energy percentage is at its minimum.
Atmosphere 16 00287 g017
Figure 18. Cross-wavelets between the tree-ring index and number of Sunspots, with the confidence level of 95% (white outline). The color-coded scale represents the logarithm of the squared modulus of the wavelet coefficients, with yellow indicating the condition where the energy percentage is at its maximum and dark blue representing the condition where the energy percentage is at its minimum.
Atmosphere 16 00287 g018
Table 1. Statistical parameters of the data.
First Year of Expressed Population Signal (EPS) > 0.85Number of Individual Trees (t) Needed for EPS > 0.85Series IntercorrelationSubsample Signal Strength (SSS)Average Mean Sensitivity
180450.550.64–0.700.70
Table 2. Characteristics of the tree-ring width index and the geophysical and climatological series for the common period. The table includes the Pearson correlation coefficient (r), the coefficient of determination ( r 2 ), and the p-values, indicating the statistical significance of the correlations.
ParameterPeriodr r 2 p-Value
SOI1875–20040.090.0080.2733
Precipitation1961–2004−0.0180.0000.9194
Mean Temperature1961–2004−0.1460.0210.6185
Maximum Temperature1967–2004−0.0400.0020.8732
Minimum Temperature1967–2004−0.0430.0020.8322
Sunspots1804–20040.0020.0000.9817
Disclaimer/Publisher’s Note: The statements, opinions and data contained in all publications are solely those of the individual author(s) and contributor(s) and not of MDPI and/or the editor(s). MDPI and/or the editor(s) disclaim responsibility for any injury to people or property resulting from any ideas, methods, instructions or products referred to in the content.

