Article

Potential Health Risk of Dust from Stone Mill Industries

by
Kanokporn Swangjang
1,*,
Arnol Dantrakul
1 and
Kamolchanok Panishkan
2
1
Department of Environmental Science, Faculty of Science, Silpakorn University, Nakorn Pathom 73000, Thailand
2
Department of Statistic, Faculty of Science, Silpakorn University, Nakorn Pathom 73000, Thailand
*
Author to whom correspondence should be addressed.
Atmosphere 2025, 16(2), 230; https://doi.org/10.3390/atmos16020230
Submission received: 14 January 2025 / Revised: 10 February 2025 / Accepted: 13 February 2025 / Published: 18 February 2025
(This article belongs to the Section Air Quality and Health)

Abstract

:
Stone mill operations contribute significantly to air pollution and increase health risks not only for workers but also for nearby communities. This study aimed to assess the health impacts of stone mill industries on nearby residents. The research was conducted in two areas: a primary region with a high number of stone mills and an area without stone mills. A questionnaire-based survey was employed, and potential health risks were evaluated using the hazard quotient (HQ) method. Total suspended particulates (TSPs) and particulate matter-10 micron (PM10) were analyzed as hazard factors based on monitoring data from seven stone mills collected between 2008 and 2021. The study found that residents in major stone mill areas reported higher hazard quotients (HQs) than those living farther from the mills, with a statistically significant association (p < 0.01). Seasonal variations also influenced dust distribution, with the highest TSP and PM10 levels recorded during winter, exacerbating health risks for local populations. This study highlights the need for improved community settlement planning, consideration of meteorological conditions, regulatory interventions by relevant agencies, and enhancements in environmental monitoring systems to mitigate the adverse health effects of stone mill operations.

1. Introduction

The stone milling or mining industry is important for national development. It involves processing stones, gravel, and sand for use in construction and other projects, such as building and road construction and cement production. The production methods typically involve drilling and blasting from mountains. Most materials are used for construction and cement production. Dust pollution from stone mills is a concern, particularly in larger milling operations. The process of grinding grains releases fine particles into the air, leading to airborne particulate matter.
Stone milling contributes significantly to air pollution, emitting particulate matter that can aggravate cardiovascular and respiratory conditions. Long-term exposure to fine particulates has been associated with increased rates of heart disease and premature death in both urban and rural settings [1]. Milling can pose health risks for workers in the milling facility, causing respiratory issues if inhaled over prolonged periods, especially in poorly ventilated environments [2].
Dust emissions and waste products can contaminate local water sources and soil, leading to ecological disturbances that indirectly affect human health [3,4]. Dust particles are also a significant health risk factor [5]. Linking cumulative dust exposure to hospital mortality in patients with systemic sclerosis, suggests a correlation with cardiopulmonary complications, as confirmed by [6].
Globally, the enforcement of environmental laws varies, with international frameworks like the Rio Declaration providing guidelines for sustainable practices. However, enforcement often depends on national policies, and international laws serve more as recommendations than mandatory regulations [7]. In stone mill industries, practices such as dust control and emissions monitoring are guided by both local laws and international standards, such as Global Ambient Air Quality Guidelines set by the World Health Organization (WHO).
In Thailand, the expansion of the domestic economy has led to an increase in the demand for limestone for construction, public utilities, road construction, building construction, and industrial plants [8]. As a middle-income country where mining constitutes a significant economic sector, environmental control measures remain insufficient. This has led to the expansion of the mining industry. As of 2024, a total of 436 stone mill industries were operating in Thailand, with 60 located in Saraburi Province, situated in the central region of the country [9]. Stone mill industries are regulated by NEQA B.E. 2535 (1992) under the Office of Natural Resources and Environmental Policy and Planning (ONEP) [10] and the Mineral Act B.E. 2560 (2017) [11] under the Department of Primary Industries and Mines (DPIM). NEQA 1992 categorizes stone mill industries as requiring environmental impact assessments (EIAs) to control project operations through mitigation and monitoring measures. Empowered by the Mineral Act B.E. 2560 (2017), the DPIM has full authority to control stone mill industry operations under ministerial rules. Pollution abatement is managed through licensing by the responsible agency. However, legislative enforcement for stone mills in Thailand is not managed by a single regulatory agency. Instead, multiple agencies are involved in overseeing the environmental control of project operations. The complexities and gaps in the enforcement of regulations among these agencies remain a significant concern. These also affect the communities near the stone mills where pollution prevention depends on the efficiency of project in controlling its released pollutants. Despite regulations, compliance levels vary, and some projects in Thailand have faced legal challenges due to insufficient pollution mitigation efforts. For example, limits on air pollutants like PM10, common in stone milling, are mandated, but enforcement often involves mandatory installation of pollution control equipment without ensuring consistent adherence. For instance, several projects in Thailand have faced legal challenges due to insufficient pollution mitigation efforts, highlighting the need for stricter enforcement and public accountability [12].
Stone mill operations not only affect workers but also nearby communities. Dust pollution can spread, impacting local air quality and increasing the prevalence of respiratory illnesses among residents. Numerous studies have focused on the health impacts of stone mills on workers [13,14], primarily due to prolonged exposure to stone dust, which has been associated with a high prevalence of chronic obstructive pulmonary diseases [15]. This study examined the health impacts of stone mills on nearby communities, and factors influencing dust distribution. The outcomes could be beneficial to developers as the guidance for industry mitigation measures.

2. Materials and Methods

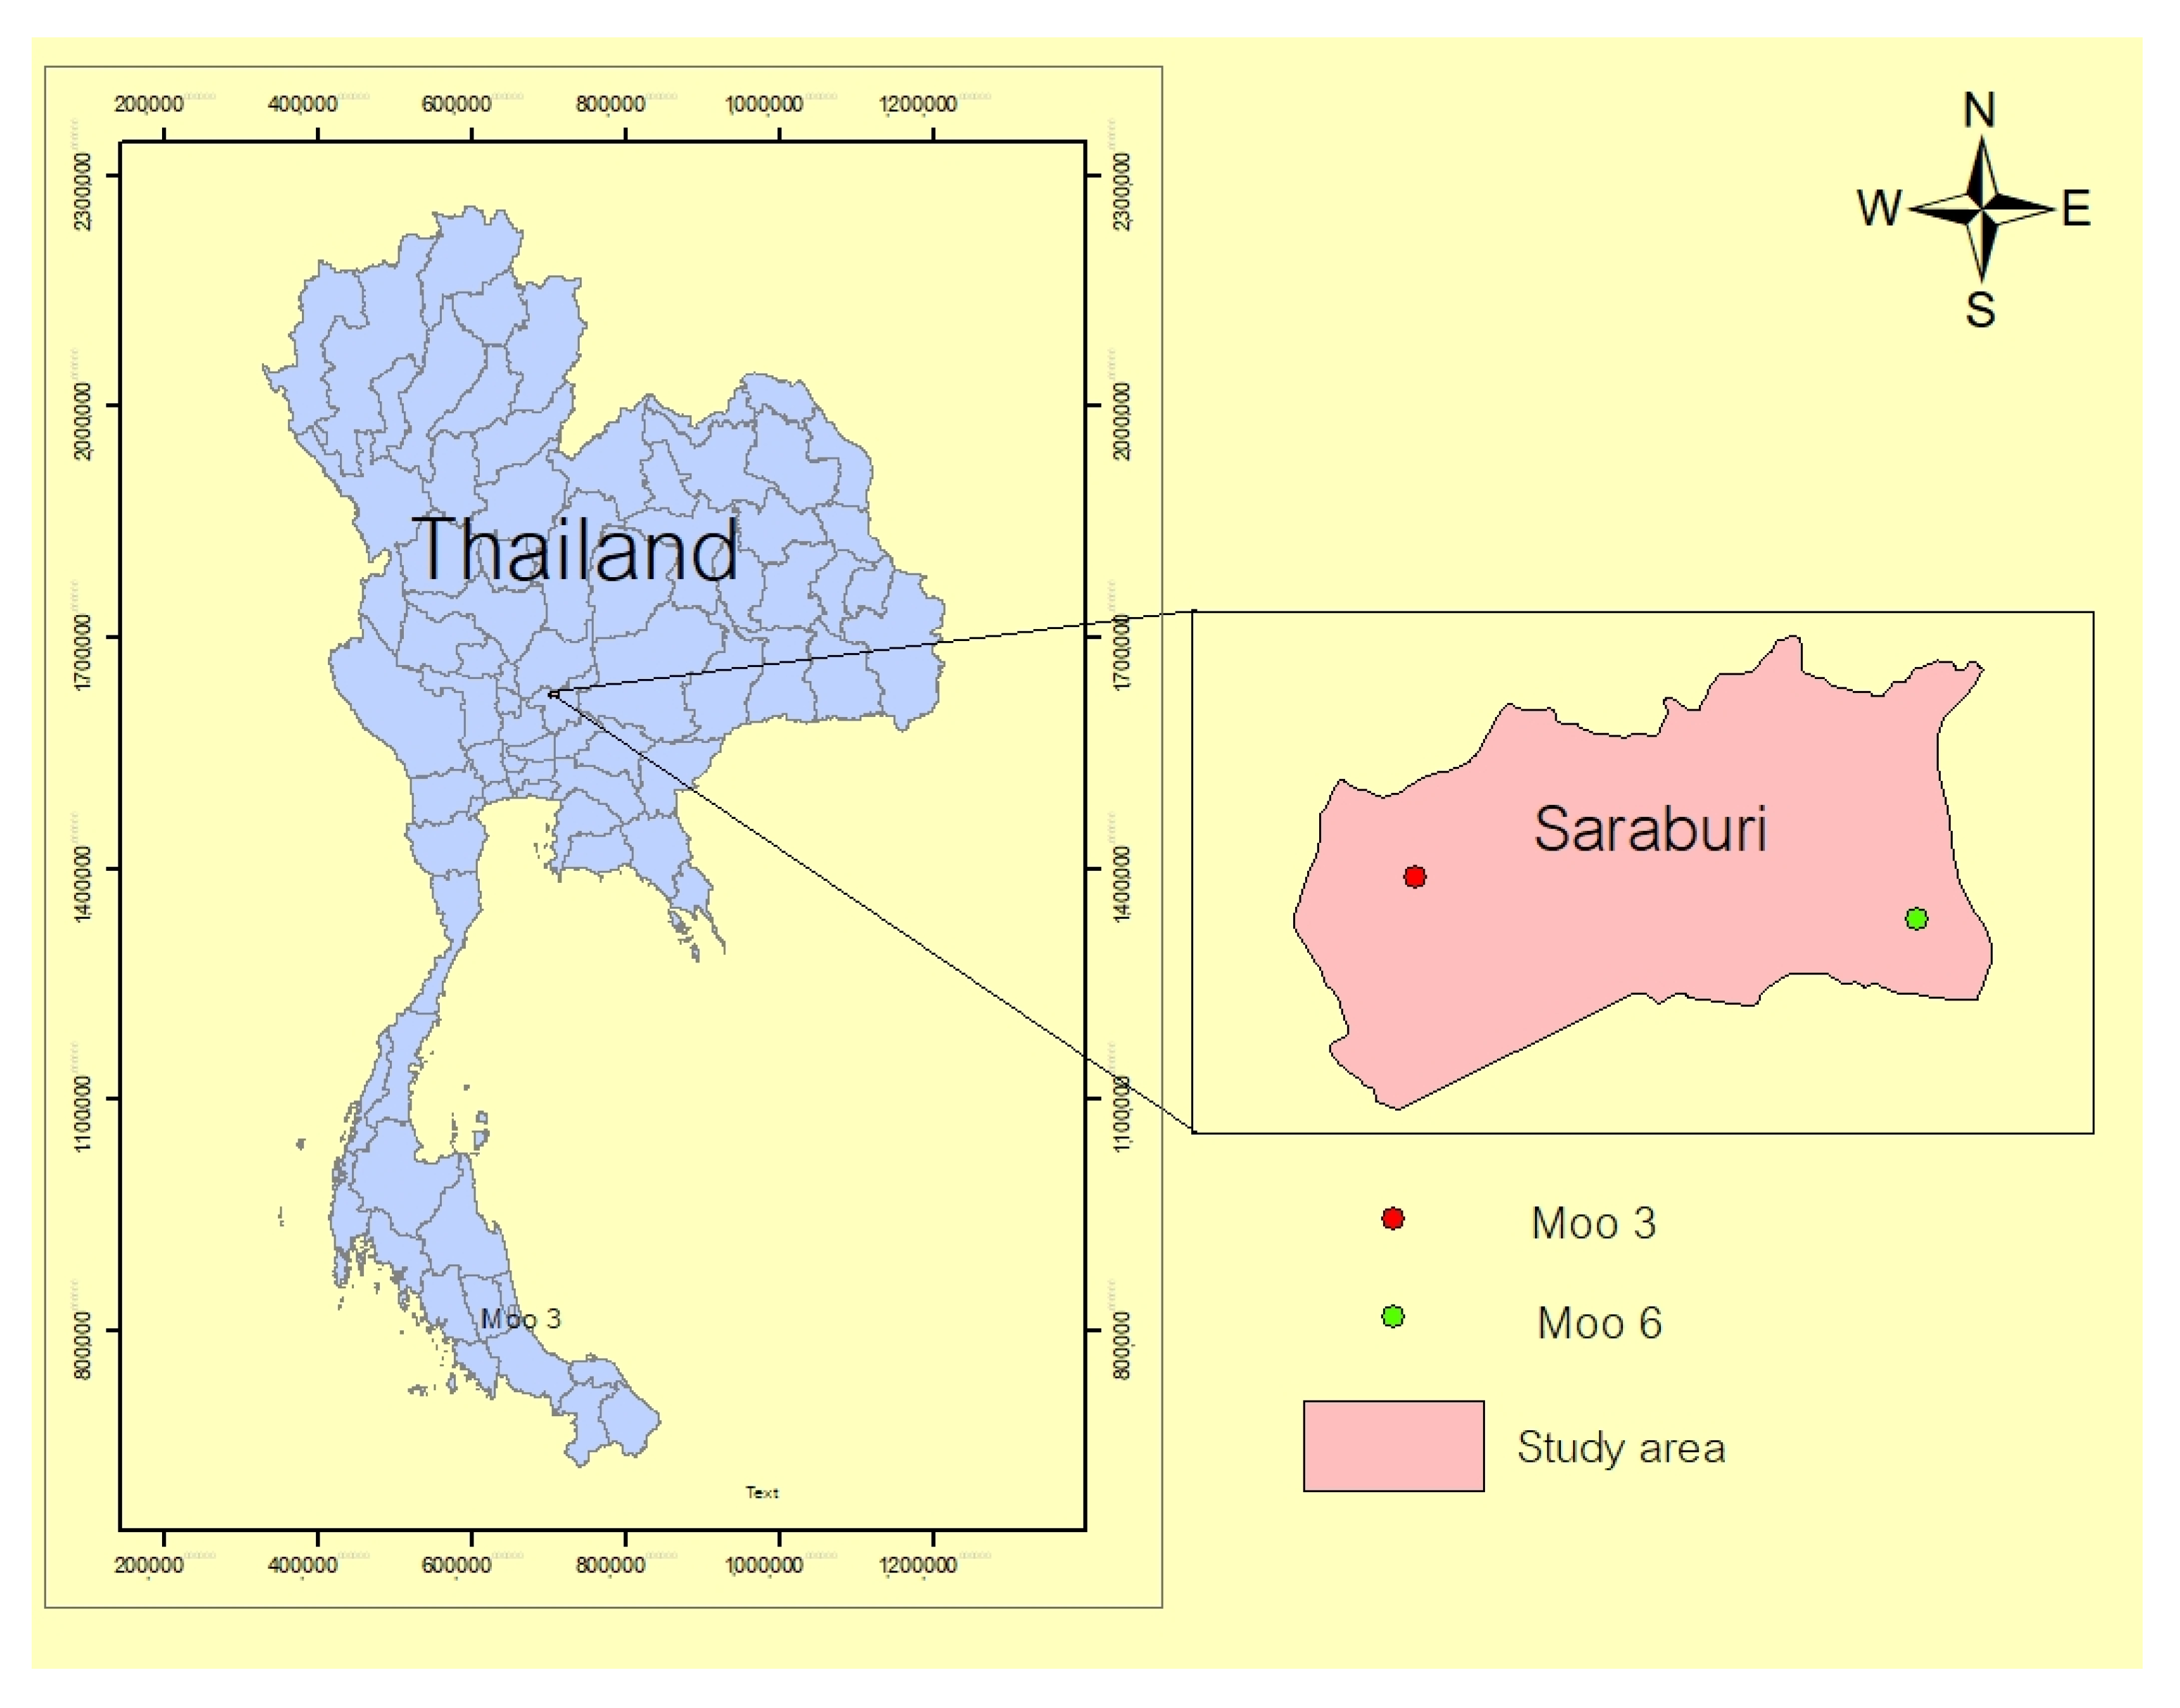
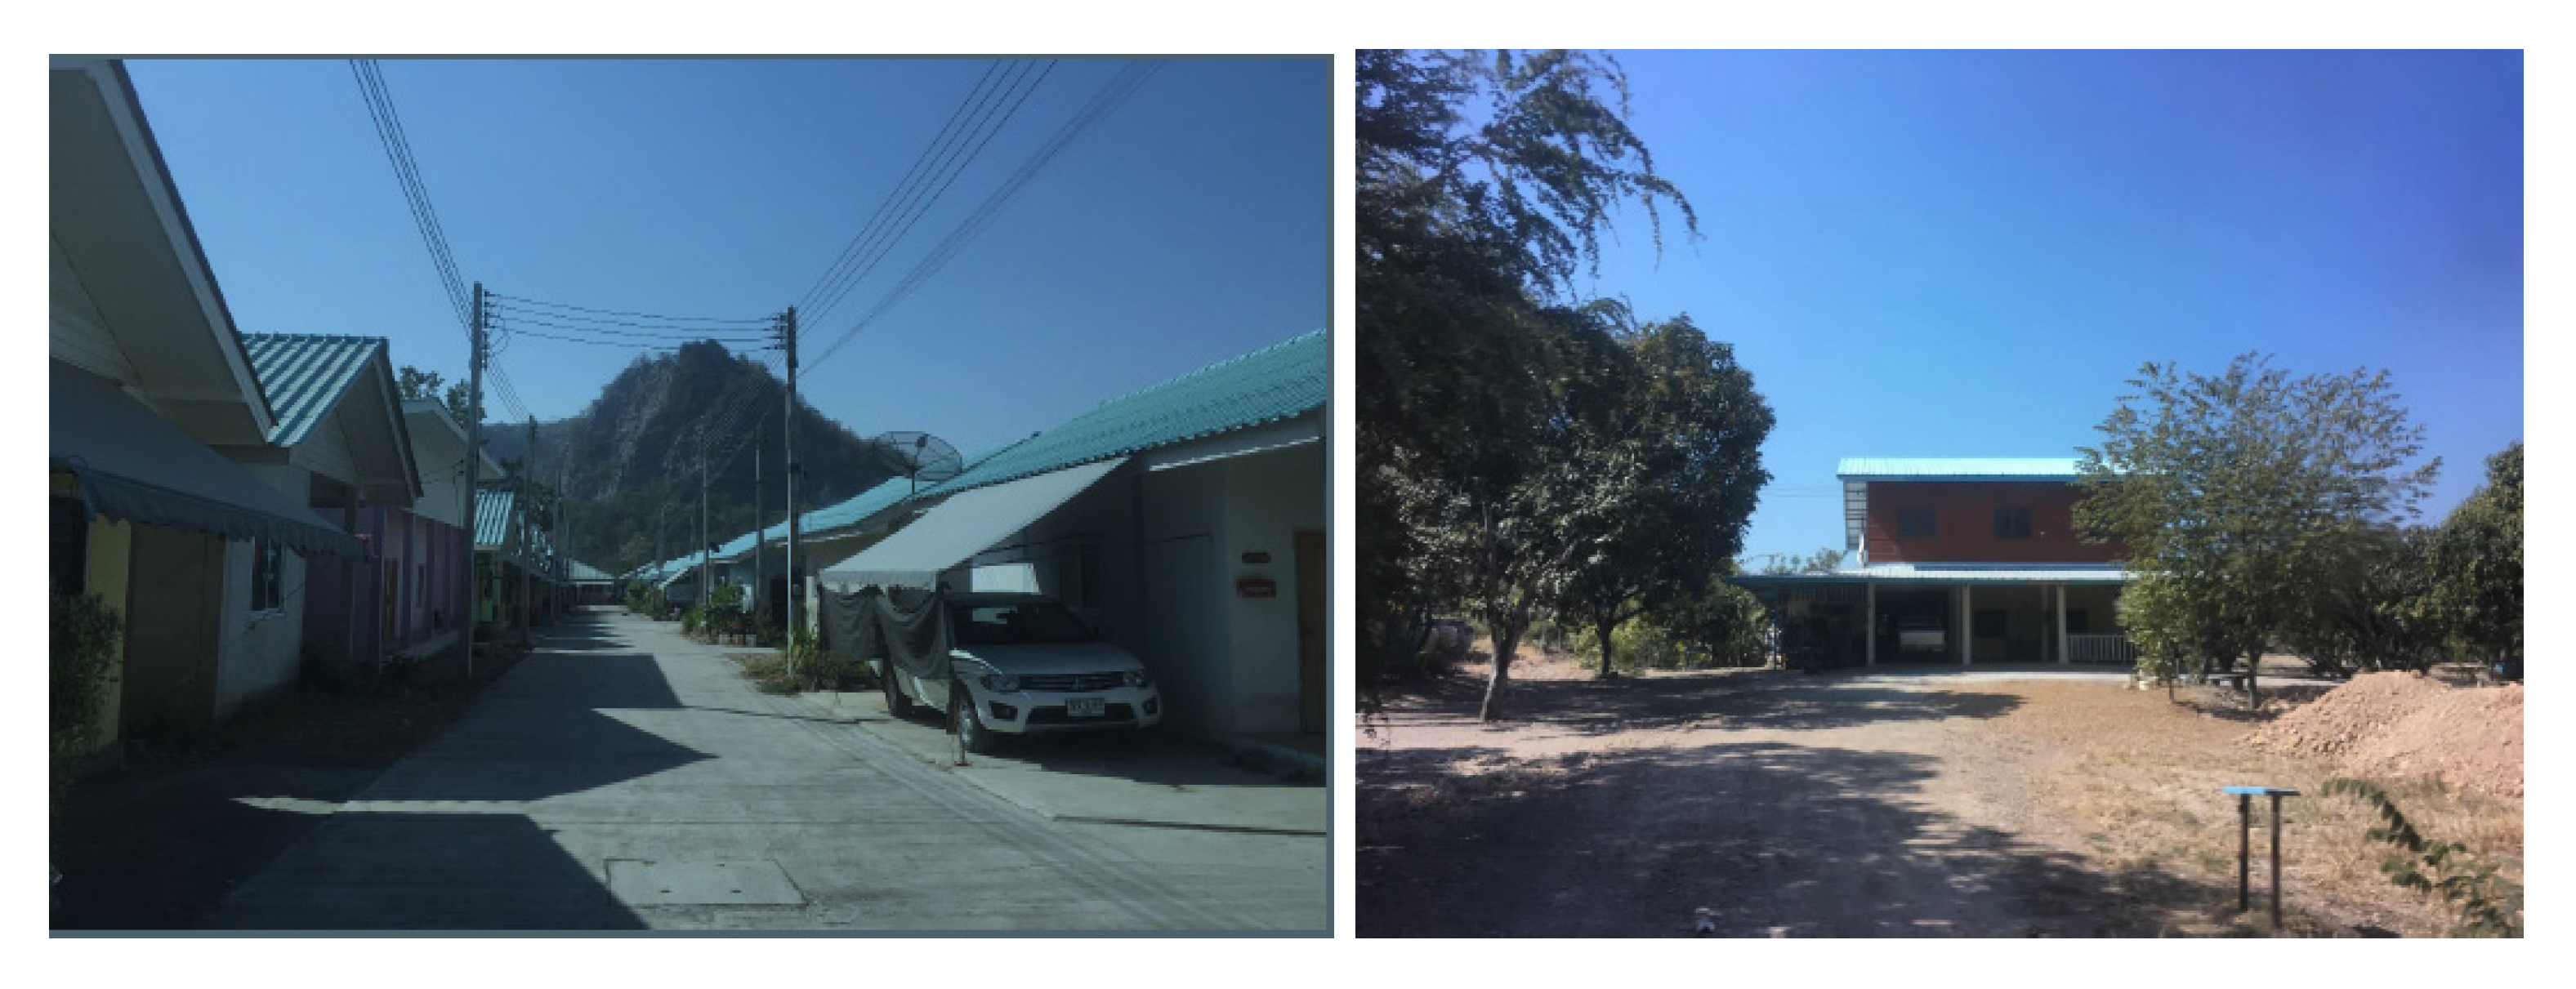
2.1. Study Area and Population Frame

The study area was located in Saraburi province (14°36′9.0″ N, 100°54′5.0″ E), in the central part of Thailand (Figure 1). According to Thailand’s hierarchical administrative system, local administrations are divided from the smallest to the highest units: Moo, Tambon, Amphoe, and Province. In Tambon Chalermprakiet, Saraburi, the main area of stone mill industries, several stone mills are in operation. The topography of the area is mostly plain, with some small hills that do not significantly affect air quality distribution. The selected areas were Moo 3 and Moo 6.
Moo 3 is a major area of stone mill industries, with seven of the total fifteen stone mills located here (Figure 2). The main land use is urban, industrial, and commercial areas.
Moo 6 is a hilly and forested area. The main land use is residential and agricultural (Figure 2). Hence, Moo 6 represents a comparative area.
The population frame consisted of households located in the vicinity of stone grinding mills in Na Phra Lan Subdistrict, Chaloem Phra Kiat District, Saraburi Province. It included Village Moo 3, which had the highest number of stone grinding mills, and Village Moo 6, which had the lowest number. The total population consisted of 542 households. The sample size was determined using the formula in [16], with a sampling error of 0.05 and a confidence level of 95%, resulting in a sample size of 226 households. The sample was then proportionally allocated based on the number of households in each village, resulting in 150 households from Moo 3 and 76 households from Moo 6. The samples were selected using simple random sampling from the population frame.

2.2. Questionnaire

The questionnaire consisted of two main sections. The first section gathered baseline information about the interviewees, including gender, age, occupation, weight, duration of residence in the area, underlying health conditions, and behaviors related to health. The second section focused on environmental factors associated with the respondents’ properties, such as house location, distance from roads and stone mills, road characteristics, potential impacts from stone mill operations, and other nearby activities contributing to TSP.
Each household was represented by a single sample, with only the household head or primary income earner selected as the respondent. The questionnaire and study protocol were reviewed and approved by the Ethics Committee of Silpakorn University in accordance with the Declaration of Helsinki.

2.3. Air Quality Data

The EIA has been enforced for stone mill industries based on NEQA, 1992. According to the EIA legislation, proponents are obligated to implement appropriate measures and monitoring programs as a condition of licensing. The performance of the stone mill industries is monitored through their environmental impact statements (EISs). The number of stations and monitoring frequencies are shown in Table 1. The data for total suspended particulate (TSP) and PM10 used in this study were extracted from monitoring stations represented in monitoring reports of seven stone mill industries, all located in Moo 3. The measurement of TSP and PM10 was conducted using the gravimetric method with a high-volume air sampler. This method complies with the requirements established under Thailand’s Environmental Act (NEQA, 1992). Monitoring has mostly been conducted twice a year (since each stone mill began operations), based on annual wind directions, mainly southwest and northeast monsoons. Thailand is situated in the tropical zone and experiences three distinct seasons: winter (November–February), summer (March–May), and rainy (June–October), as classified by [17] based on the earth’s tilt and axis.
Monitoring data used for this study were from the period 2008–2021. The rationale for utilizing monitoring results for ambient concentration measurements was that these data were continuously collected and encompassed the areas surrounding the stone mills. Additionally, the monitoring stations were established based on impact assessments for each stone mill, thereby reflecting the potential ambient concentration levels to which the local population was exposed. However, factors such as individual lifestyles, property characteristics, and topographical variations may introduce uncertainties in the actual exposure levels experienced by the sampled populations.
Only the highest values of TSP and PM10 from the nearest stations of the sampled population in three seasons (summer, winter, and rainy) were used for risk analysis. Monitoring performance details are provided in Table 1.

2.4. Health Risk Assessment

TSP and PM10 were considered health hazards from stone mill industries due to the operation of the stone mills. The health risk of TSP and PM10 was assessed as a non-carcinogenic risk. The hazard quotient (HQ) is expressed as the ratio of particulate concentrations to their reference concentration (RfC). Health hazard values were calculated using Equation (1) [18]:
Hazard   Quotient   ( HQ ) = CDI RfC
where CDI represents the average daily intake from inhalation (mg/kg/day), and RfC is the inhalation reference concentration. The RfC values used in this study were based on the ambient air quality standards for TSP and PM10 developed by the World Health Organization [19]. CDI reflects exposure to TSP and PM10 per body weight and the approximate time of contact with these particulates. CDI was calculated using Equation (2):
CDI = C × IR × ED × EF × ED AT × BW
where C is the concentration of TSP and PM10 in the study areas. In this study, the maximum concentrations of TSP and PM10 in three annual wind directions of Thailand, extracted from monitoring results of stone mill industries, were used. IR represents the mean of inhalation rate (m3·h−1), with values of 0.83 for adults and 0.208 for young individual (under 15 years) [20]. The ET, EF, ED, BW, and AT factors were specific to each individual [21]. These factors were calculated using respondent data obtained from the questionnaire results. ET is the exposure time (hours per day). EF is exposure frequency (days per year). ED is the exposure duration (years). ET, EF, and ED are specific to each individual and resulted from the responses to the questionnaire. BW represents body weight (kg) of each individual. AT is the average time, calculated as the product of ED and the number of days in one year. The values of each factor were obtained through questionnaires and are provided in Table 2.
For potential non-carcinogenetic risk, if the obtained HQ value is less than 1, it is unlikely that the exposed individual will experience detrimental health impacts. However, if the HQ value exceeds 1, there may be a concern about potential non-carcinogenic impacts. The accepted standard for HQ is 1, at which no health risk is expected. The likelihood of experiencing chronic health risks increases as the HQ value rises above 1 [20].

2.5. Statistical Analysis

Statistical analyses were performed using Pearson’s chi-squared test with SPSS version 29.0 (IBM, Armonk, NY, USA). An association with a p-value less than 0.05 was considered statistically significant.

3. Results

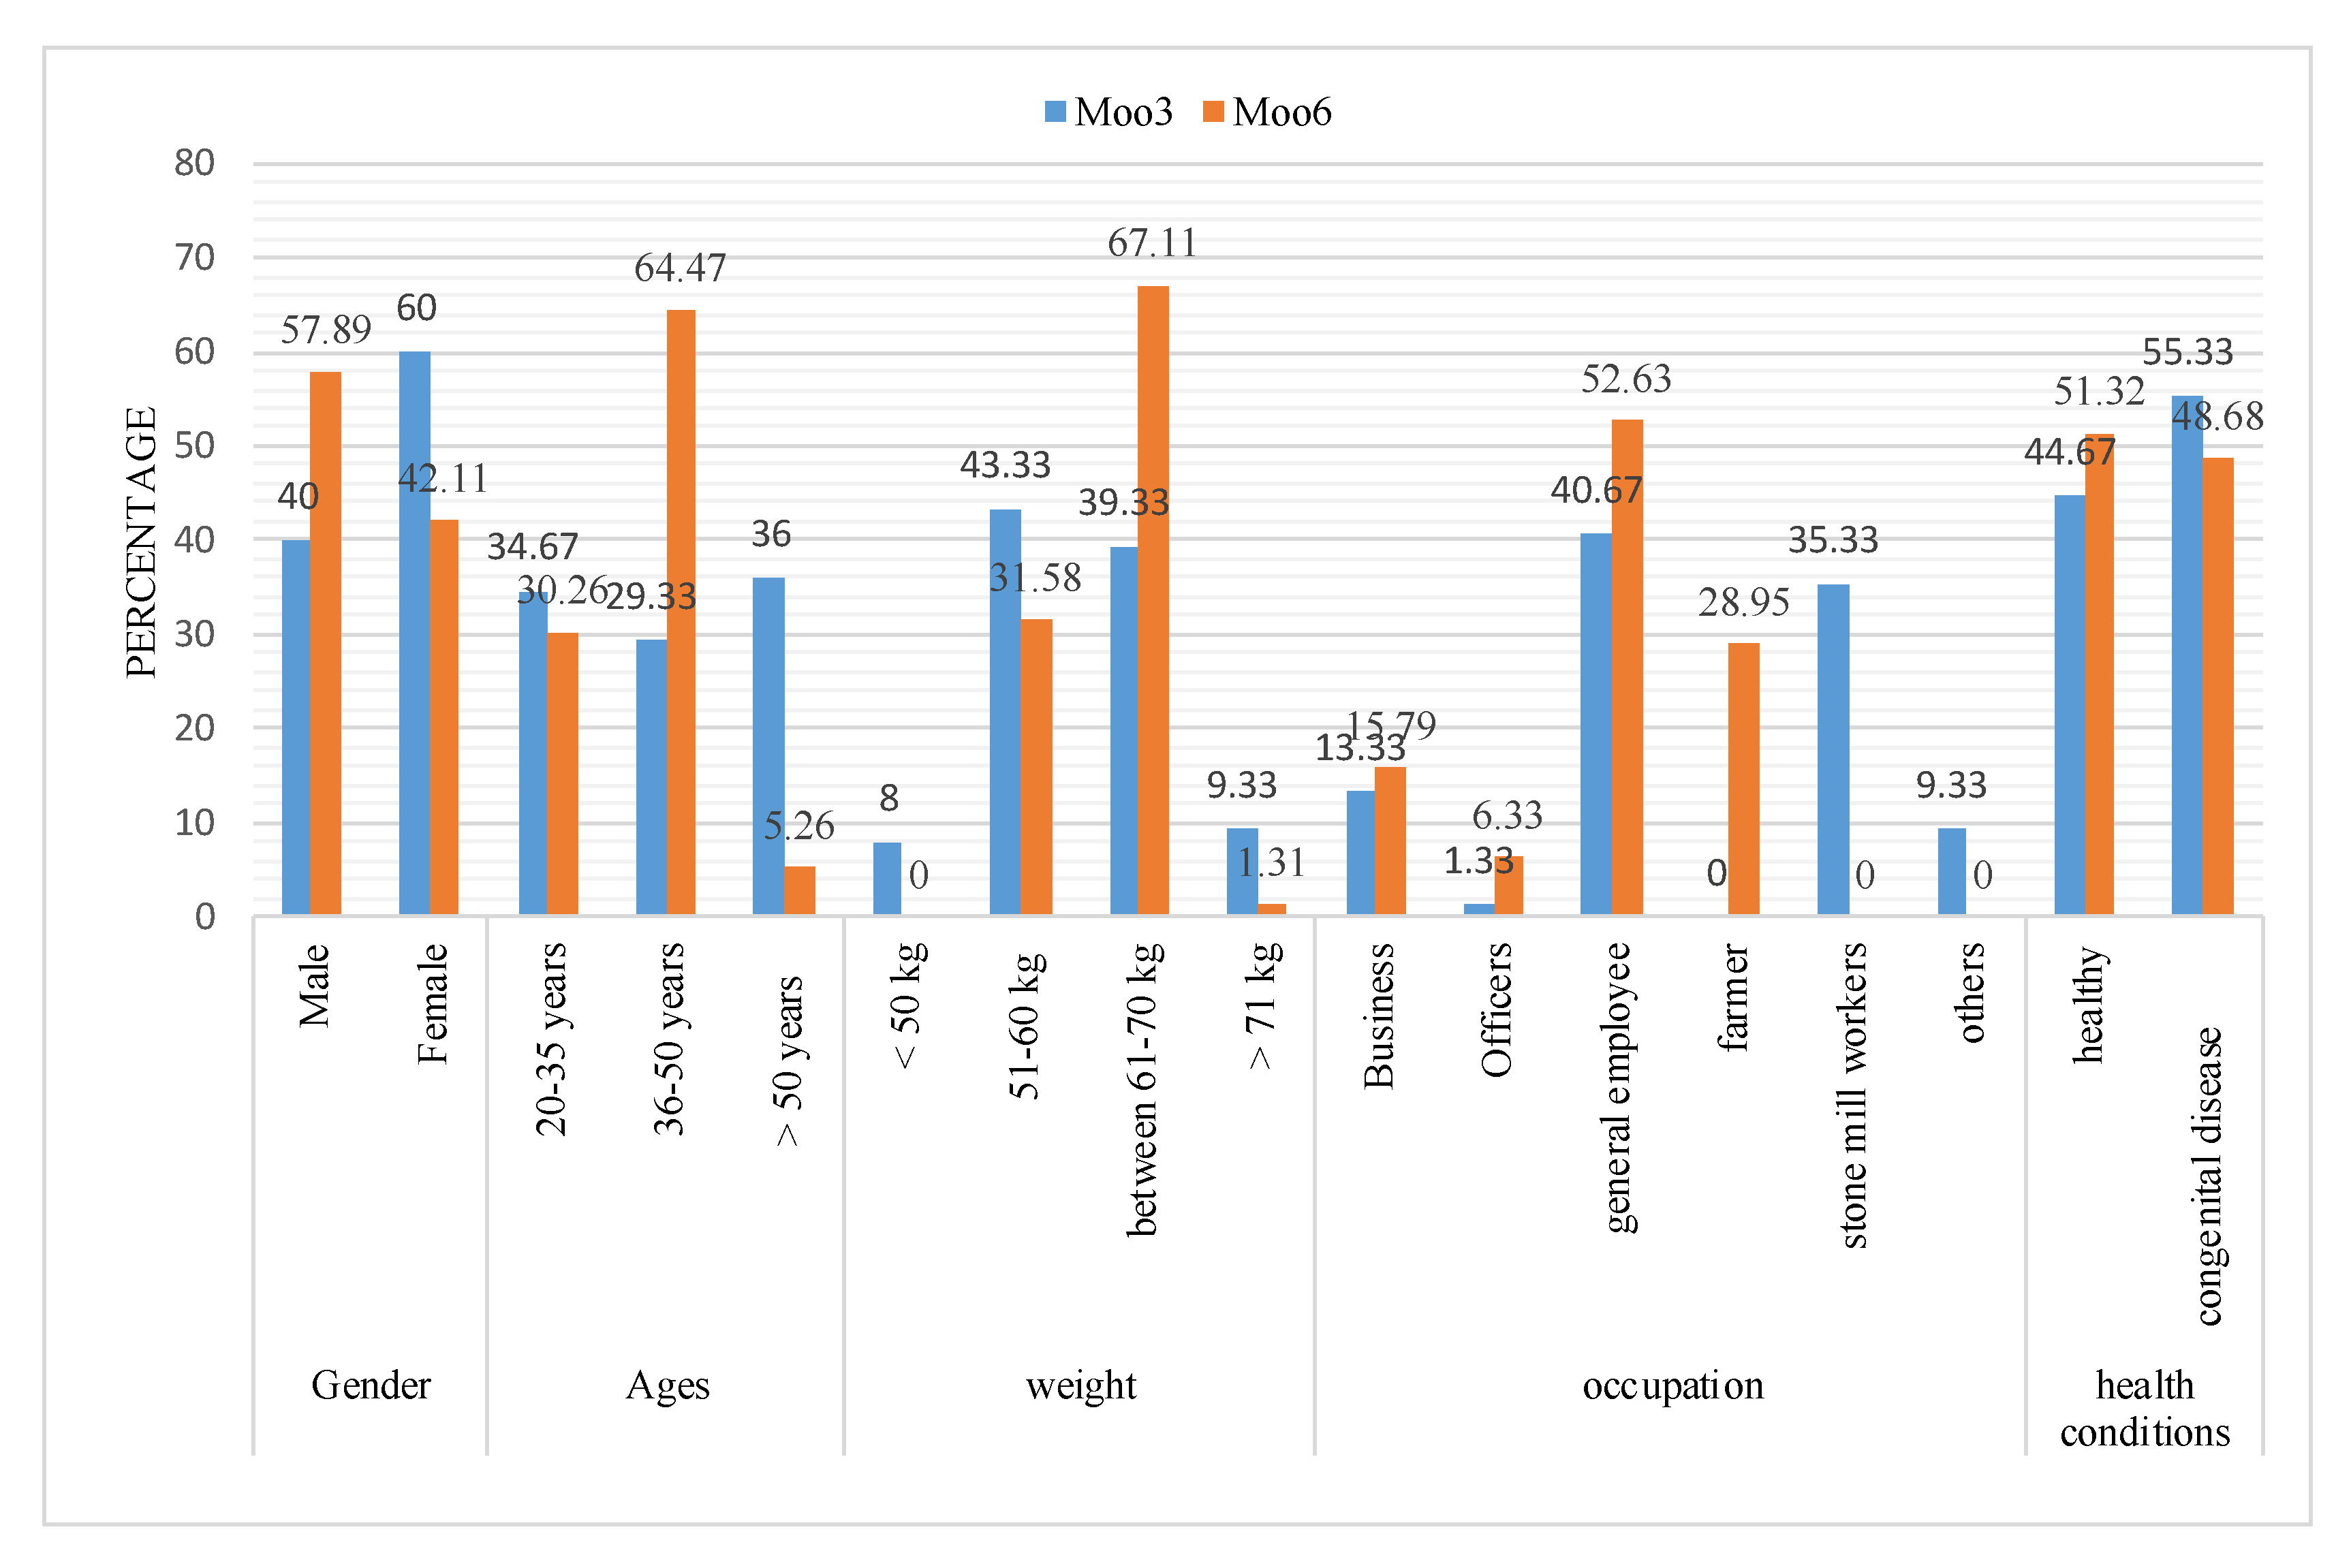
3.1. Population Conditions in the Study Areas

The comprehensive study with statistical confidence included 150 participants in Moo 3 and 76 participants in Moo 6 (Figure 3). The majority of respondents were less than 50 years old and were employed in general labor jobs. In Moo 3, 35.33% of the participants were stone mill workers. Regarding health conditions, the respondents’ weights and health status were also considered. It was found that the majority of respondents in both areas were in normal health. The prevalence of underlying diseases in Moo 3 was not significantly different from that in Moo 6.

3.2. Environment and Personal Behavior Related to Underlying Disease
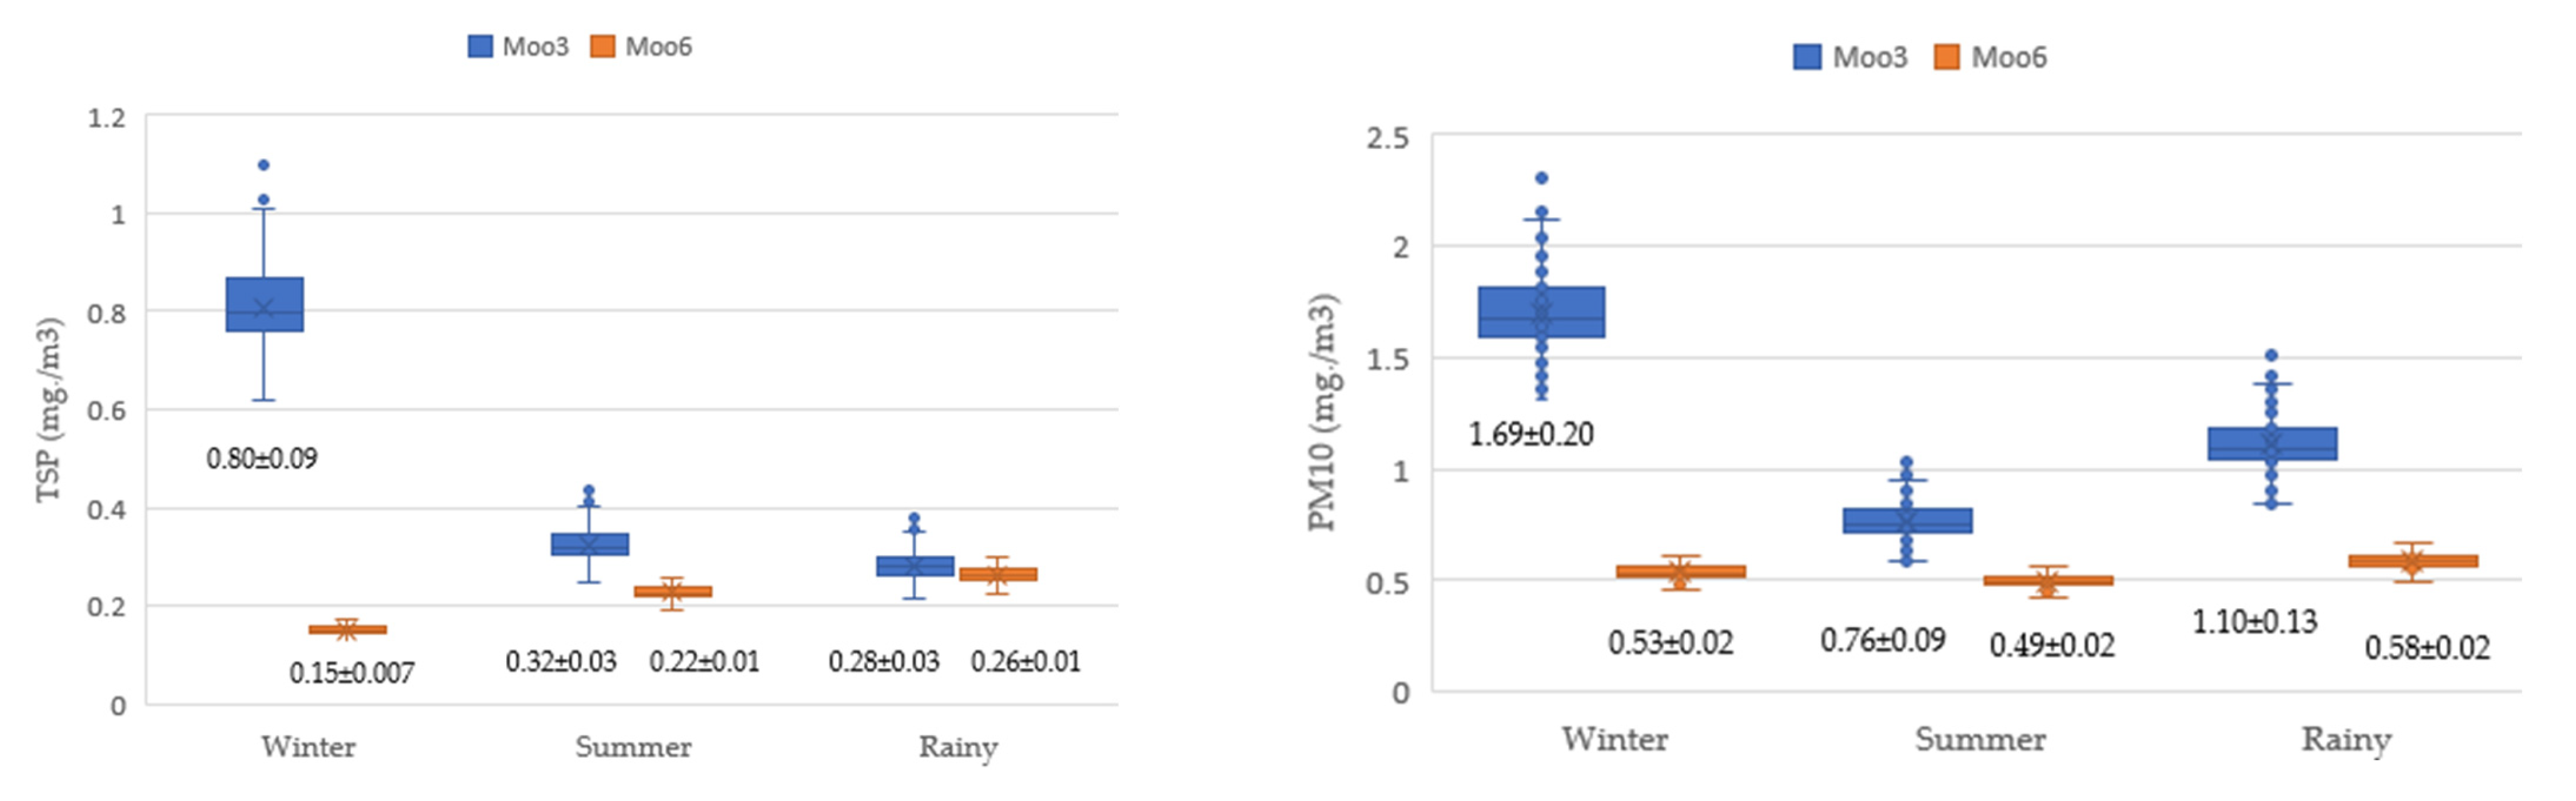
Factors affecting underlying diseases in both areas were examined, including respondents’ lifestyles and health conditions. Although most respondents were generally healthy, lifestyle behaviors may pose future health risks. Factors such as smoking, pollution-prevention measures, distance of households from dust sources, and house characteristics were analyzed (Table 3). A statistical association was found between these factors and underlying diseases (p < 0.01). Smoking and inadequate pollution-prevention measures, such as the inconsistent use of masks and limited time spent indoors, were associated with increased health risks.
Household distance from stone mills was significantly correlated with underlying diseases, but distance from roads was not. Indoor ventilation, a house characteristic, was also a significant factor (p < 0.01) influencing the incidence of underlying diseases.
Comparing Moo 3 and Moo 6 (Table 4), significant differences (p < 0.01) were observed in the distance from stone mills and house characteristics. Houses in Moo 6, located in rural areas, generally had larger spaces, while those in Moo 3 were in a high-density urban area, often single-story and adjacent to each other. However, there was no significant difference in underlying diseases between the two areas due to similar lifestyles. Personal behaviors and pollution-prevention awareness also showed no significant differences between Moo 3 and Moo 6.

3.3. Air Quality

Monitoring data from the stone mill industries for the 2008–2021 period revealed the highest and lowest TSP and PM10 values in both areas across the three seasons (Figure 4). The highest TSP concentration exceeded the standard during winter in Moo 3, reaching 0.818 mg/m3. PM10 concentrations exceeded the standard in all seasons, with the highest levels occurring in winter, followed by summer and rainy seasons. In all seasons, the TSP and PM10 concentrations in Moo 3 were higher than those in Moo 6.

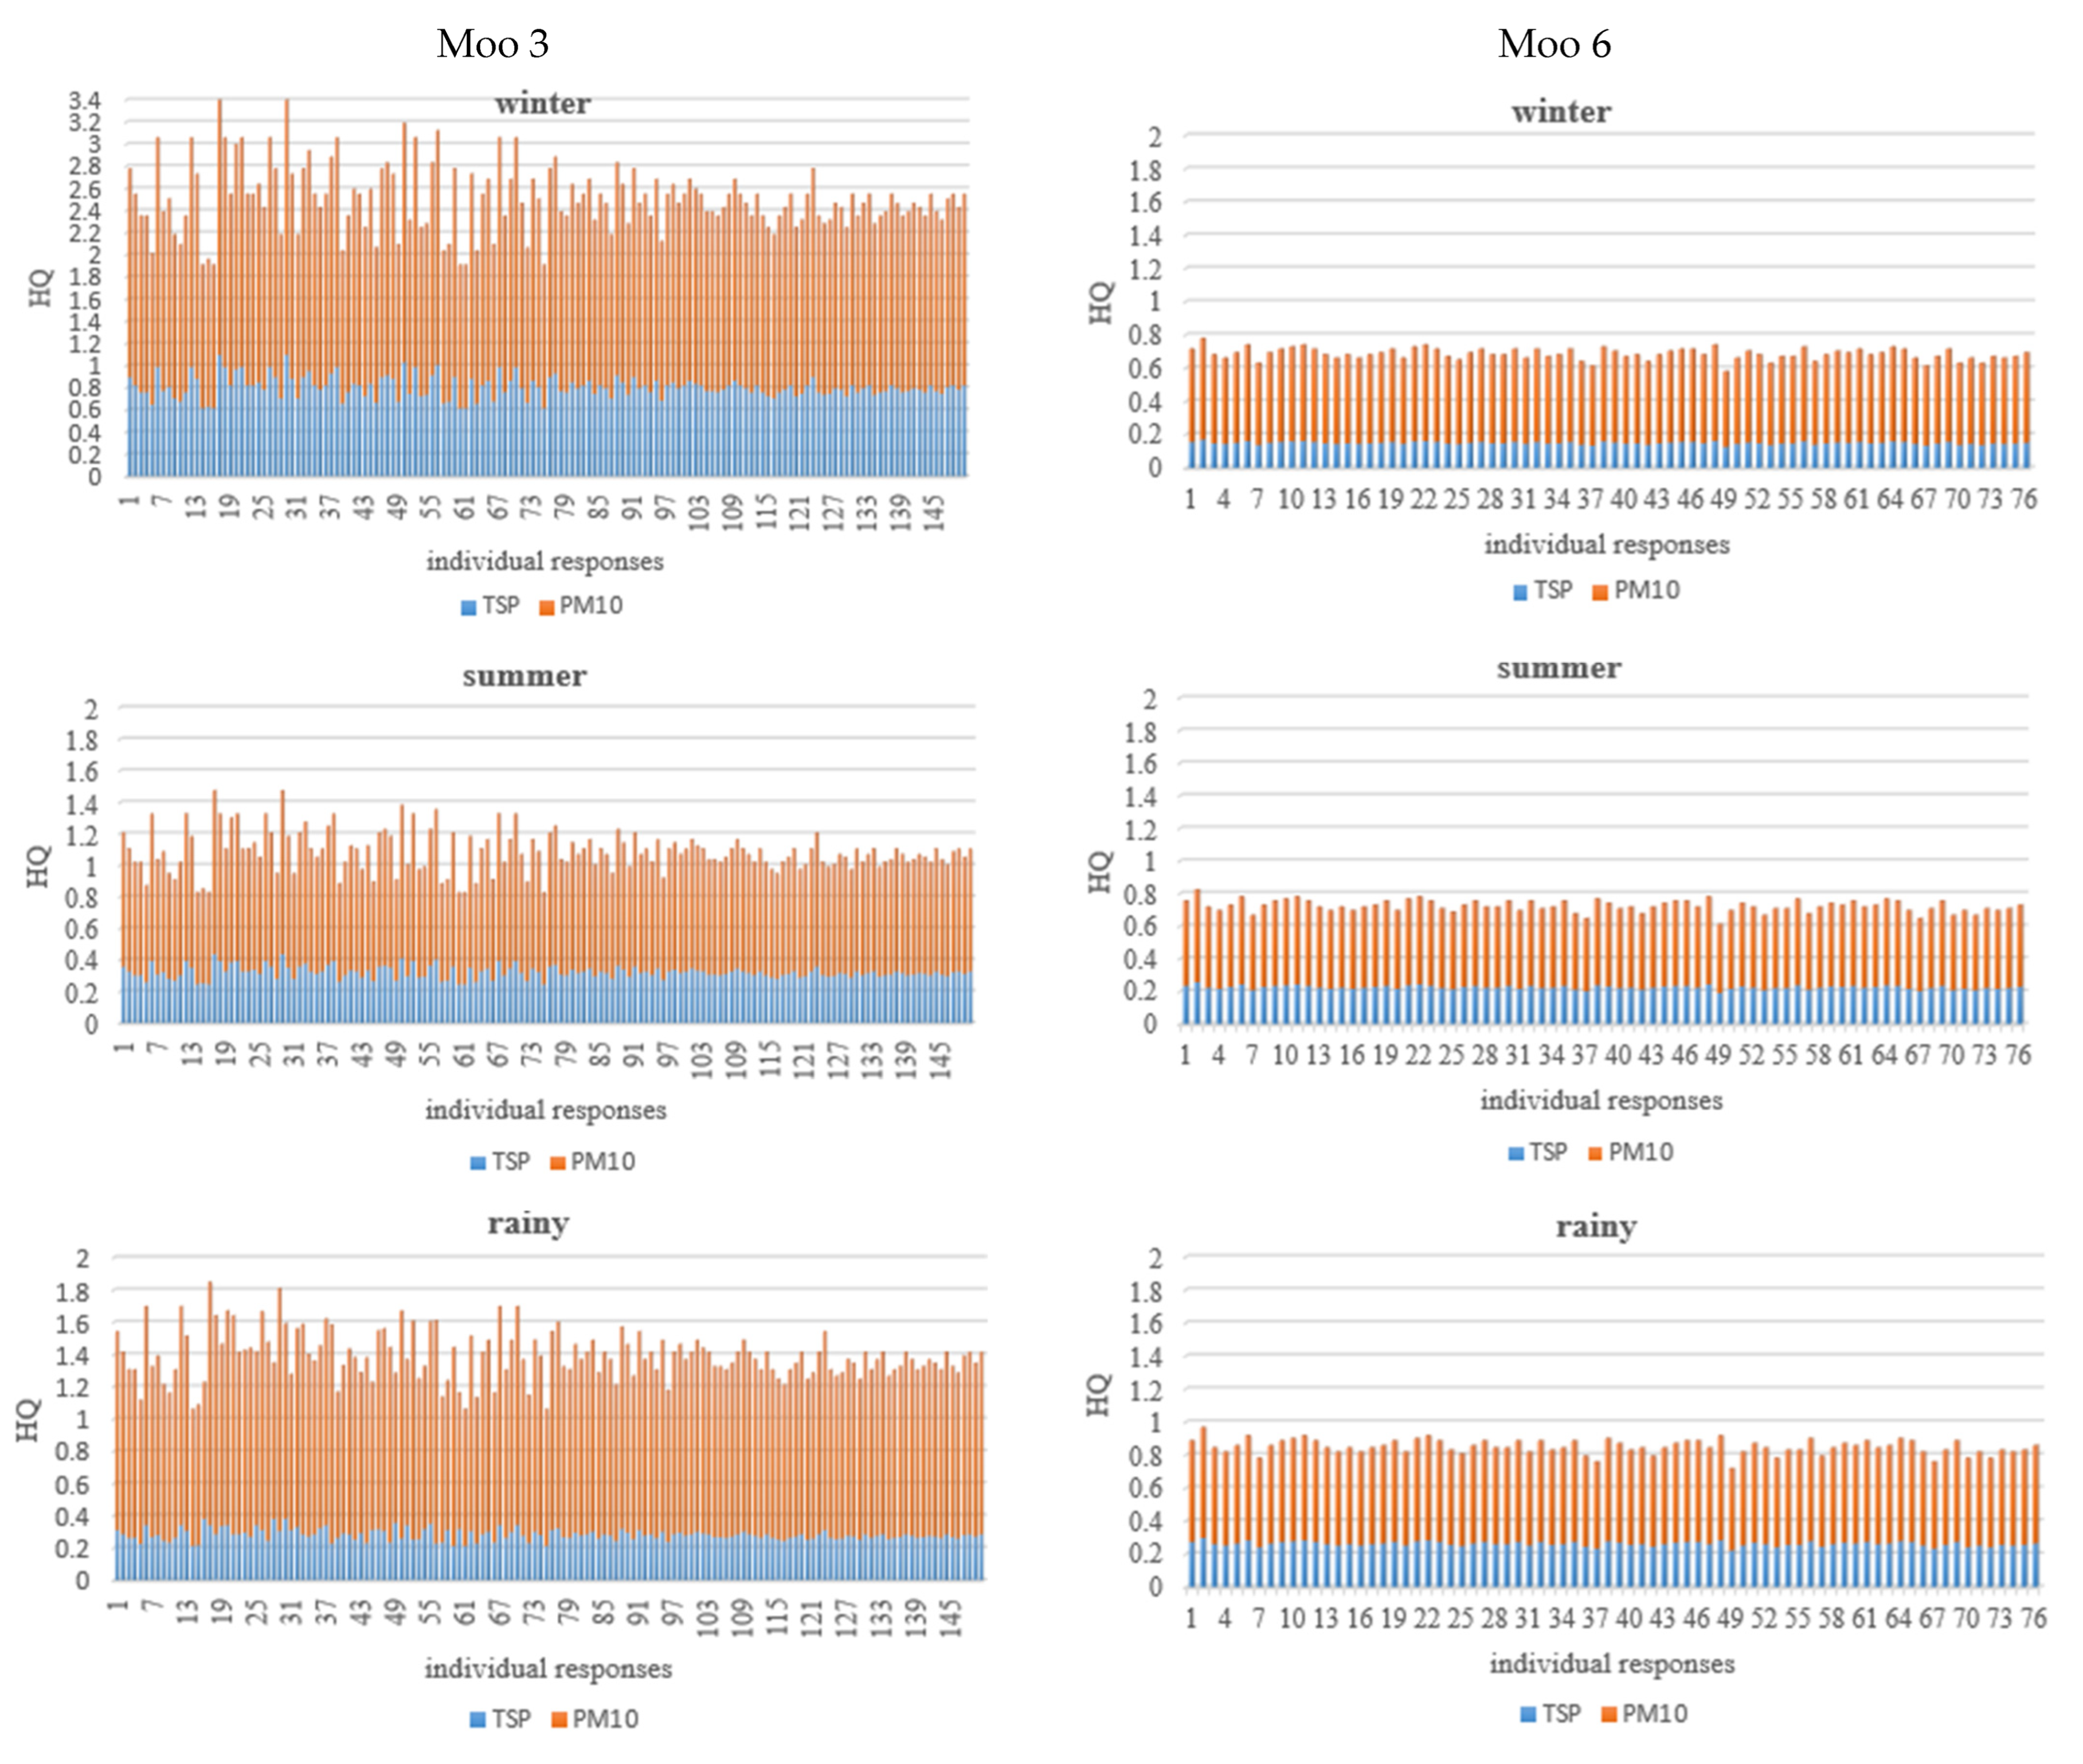
3.4. Health Risk Assessment

Health risk assessments for TSP and PM10 exposure in both areas across three seasons are summarized in Table 5. The HQs for TSP and PM10 in Moo 3 were significantly higher than in Moo 6 for all seasons (p < 0.01). PM10 monitoring in Moo 6 was not conducted during the rainy season; data from the Pollution Control Department (PCD) was used for calculations. The highest HQ values for both TSP and PM10 were observed in winter in Moo 3, with HQTSP values of 0.808 ± 0.097, 0.322 ± 0.038, and 0.281 ± 0.033 in winter, summer, and rainy seasons, respectively. HQPM10 values were 1.696 ± 0.202, 1.108 ± 0.132, and 0.763 ± 0.091 for the same seasons. Overall, PM10 posed a higher risk than TSP. In Moo 6, although PM10 posed a higher risk than TSP, the seasonal variations were less pronounced.
The combined risks of TSP and PM10 are shown in Figure 5. In Moo 3, the HQ exceeded the unacceptable risk level, particularly in winter, and remained above the threshold in summer and rainy seasons. In contrast, Moo 6 had acceptable HQ levels across all seasons.

4. Discussion

The impacts of stone mill industries on local communities were influenced by three main factors: Firstly, community settlement patterns were a significant factor influenced by stone mill operations. This was confirmed by comparing the results from the two different areas in this study. Based on the town and country planning of the study areas [22], in Moo 3, five stone mill industries (33.33%) were located in residential areas, and six stone mill industries (40%) were in industrial areas. In addition, two industries were in agricultural and forest areas. Land-use planning of the study area, implemented after the establishment of these mills, resulted in some mills (40%) being situated less than 1000 m from the nearest communities, though all were more than 600 m from water sources.
Secondly, meteorological conditions such as wind speed, temperature, humidity, and seasonal variations played a crucial role in pollutant dispersion and health risks. Air quality is highly responsive to changes in meteorological conditions. Previous research [23,24,25,26] has highlighted the significance of these factors in pollutant distribution and retention. In [27], the authors established a clear relationship between pollution concentrations and meteorological changes, specifically noting the impacts of humidity, wind speed, and temperature. Another study [28] also included topographical factors, alongside weather, as having a significant role in pollutant retention and distribution. This study confirmed the seasonal differences in TSP and PM10 levels, emphasizing the need for weather-adaptive pollution-management policies.
As mentioned above, urban structures, combined with seasoning factors significantly affected pollutant concentrations. This was in agreement with [29]. A further study [30] concluded that weather conditions should be considered in designing pollution-management policies, as they significantly affect the pollution levels.
Thirdly, The legislation governing stone mill industry activities in Thailand is only marginally interconnected, often leading to regulatory conflicts among controlling agencies. Specifically, for stone mill industries—the focus of this research—the DPIM holds full authority under the Mineral Act B.E. 2560 (2017). However, the Pollution Control Department (PCD) typically intervenes only when significant environmental damage to natural resources has already occurred. Moreover, the EISs included in project evaluations have proven ineffective in preventing environmental degradation. Mitigation measures following the EIA requirement highlighted that occupational safety concerns in stone mills extend beyond inhaling dust. In addition to respiratory risks, stone mill workers are also prone to physical injuries due to handling heavy materials, and to machinery, which can result in accidents and injuries [31]. Proper safety protocols, including the use of personal protective equipment (PPE) and employee training, are essential to mitigate these risks and improve overall workplace safety. However, those measures are only appropriate for workers in the workplace. Beyond this occupational health safety, air emission management by controlling both pollution sources and release points should be strictly implemented by the investors, and directly controlled by the responsible agencies that authorize the projects.
Finally, the importance of the community near stone mills should be highlighted. Stone mill operations not only affect workers but also nearby communities. Dust pollution can spread, impacting local air quality and increasing the prevalence of respiratory illnesses among residents [32]. In the past 10 years, Thailand have faced a PM2.5 problem, especially in winter, although PM2.5 has not been included in the monitoring measures of any stone mill industries [33]. The main reason for this is that monitoring measures of the licensed industries are by permit application, which is subject to Thailand’s EIA regulations. Changing the conditions, especially mitigation and monitoring of EIAs of the industries, is impractical [34]. The inclusion of PM2.5 in monitoring measures remains a challenge due to regulatory limitations.
The coverage of the particulate matters is important for respiratory health. Particulate matter (PM2.5 and PM10), specifically, poses broader health risks beyond respiratory issues. It can exacerbate cardiovascular problems, leading to higher rates of heart disease and premature death. The cumulative impact of stone milling on workers and nearby communities underscores the need for stricter industrial regulations and comprehensive health monitoring to mitigate adverse outcomes. Policies promoting environmental monitoring and dust control measures can help protect vulnerable populations [4], like the communities in the sensitive areas of this study.
This study had several limitations. First, unintentional bias may have been encountered during data collection, as interviewees’ responses could have been influenced by their attitudes or past experiences. To mitigate such biases, the questionnaire was designed to emphasize objective questions while avoiding subjective or opinion-based inquiries.
Second, the hazard quotient (HQ) was used to assess risk following USEPA guidelines. However, as these indices were originally developed for different population conditions, their applicability to the Thai population may be limited. To address this concern, ET, EF, ED, BW, and AT factors in this study were derived from actual data collected from the sampled population.
Lastly, the study’s health risk assessment focused on TSP and PM10 levels from stone mill monitoring data. However, population health is influenced by multiple factors beyond these specific pollutants. Other pollutants from additional sources that may contribute to cumulative health effects were beyond the study’s scope.
Despite these limitations, the findings provide valuable insights into previously overlooked factors contributing to health risks. These insights can serve as a basis for improving regulatory measures and developing guidelines for more sustainable stone mill operations.

5. Conclusions

The hazard risk for individuals in this study revealed significant differences based on seasonal variations and household locations. The results provide insights into incorporating community health considerations into mitigation strategies for stone mills.
The findings suggest a multi-faceted approach that incorporates the consideration of urban planning and climate data for improved air quality in urban areas. Air quality management should incorporate meteorological forecasting to better anticipate pollution levels. A combined effort integrating meteorological data with pollution management is essential for effective improving air quality in urban centers. Local pollution mitigation efforts should consider meteorological influences and the need for localized meteorological-based mitigation strategies. In addition, control measures could be adjusted seasonally to address varying weather impacts on pollutant distribution. Tailored control strategies are necessary to mitigate pollutant concentrations, as these factors vary widely by region and season. The importance of incorporating meteorological insights into air quality management cannot be overstated, as it enhances the effectiveness of pollution control strategies. Long-term monitoring and protective actions for dust-affected areas are also required.

Author Contributions

Conceptualization, K.S. and A.D.; methodology, K.S. and A.D.; software, K.P.; validation, K.S., A.D. and K.P.; formal analysis, K.S., A.D. and K.P.; investigation, K.S. and A.D.; resources, K.S., A.D. and K.P.; data curation, K.S., A.D. and K.P.; writing—original draft preparation, K.S. and K.P.; writing—review and editing, K.S.; visualization, K.S. and A.D.; supervision, K.S.; project administration, K.S. All authors have read and agreed to the published version of the manuscript.

Funding

This research received no external funding.

Institutional Review Board Statement

The study was conducted in accordance with the Declaration of Helsinki, and approved by Ethics Committee of Silpakorn University (COE 63.0921-078 on 21 September 2020).

Informed Consent Statement

Not applicable.

Data Availability Statement

The data generated and analyzed during this study are included in this article. Additional data are available from the corresponding author upon request.

Acknowledgments

The authors would like to thank the Department of Environmental Science, Faculty of Science, Silpakorn University for supporting the resources for this project.

Conflicts of Interest

The authors declare no conflicts of interest.

Abbreviations

The following abbreviations are used in this manuscript:
PMParticulate matter
TSPTotal suspended particulate
HQHazard quotient
RfcReference concentration
EIAEnvironmental impact assessment
EISEnvironmental impact statement
WHOWorld Health Organization
DPIMDepartment of Primary Industries and Mines
ONEPOffice of Natural Resources and Environmental Policy and Planning

References

  1. Nawaz, M.O.; Henze, D.K.; Anenberg, S.C.; Ahn, D.Y.; Goldberg, D.L.; Tessum, C.W.; Chafe, Z.A. Sources of air pollution-related health impacts and benefits of radially applied transportation policies in 14 US cities. Front. Sustain. Cities 2023, 5, 1102493. [Google Scholar] [CrossRef]
  2. Patterson, G. The environmental impact of grain processing technologies. Environ. Sci. Ind. Rev. 2018, 22, 200–215. [Google Scholar]
  3. Silva, L.S.; Amario, M.; Stolz, C.M.; Figueiredo, K.V.; Haddad, A.N. A comprehensive review of stone dust in concrete: Mechanical behavior, durability, and environmental performance. Buildings 2023, 13, 1856. [Google Scholar] [CrossRef]
  4. Leuenberger, A.; Winkler, M.S.; Cambaco, O.; Cossa, H.; Kihwele, F.; Lyatuu, I.; Zabré, H.R.; Farnham, A.; Macete, E.; Munguambe, K. Health impacts of industrial mining on surrounding communities: Local perspectives from three sub-Saharan African countries. PLoS ONE 2021, 16, e025433. [Google Scholar] [CrossRef] [PubMed]
  5. Jenwitheesuk, K.; Peansukwech, U. Construction of polluted aerosol in accumulation that affects the incidence of lung cancer. Heliyon 2020, 6, e03337. [Google Scholar] [CrossRef]
  6. Foocharoen, C.; Peansukwech, U.; Pongkulkiat, P. Aerosol components associated with hospital mortality in systemic sclerosis: An analysis from a nationwide Thailand healthcare database. Sci. Rep. 2021, 11, 7983. [Google Scholar] [CrossRef]
  7. Smallwood, J.M. Implementation International Environmental Law and Policy: An Interactive Approach to Environmental Regulation; Routledge: London, UK, 2024; p. 232. [Google Scholar]
  8. Dantrakula, A.; Swangjang, K.; Pumakjanchana, O. Study of particulate in the stone mill industry; case study Tambol Na Phra Lan, Saraburi. In Proceedings of the in Management in Disruptive Technologies National Conference of Rachamongkol Technology University, Online, Thailand, 27 May 2022; pp. 656–662. [Google Scholar]
  9. Department of Primary Industries and Mines. In Thai. Available online: https://www.dpim.go.th (accessed on 15 July 2024).
  10. Office of Natural Resources and Environmental Policy and Planning. Government Gazette: Project types and sizes required Environmental Impact Assessment. Number 136 Section 3 on 4 January 2562. Bangkok Thailand (In Thai). Available online: https://www.onep.go.th (accessed on 15 July 2024).
  11. Thailand Mineral Act, BE 2560. 2017. Available online: https://www.dpim.go.th/en/media/002_2560.pdf (accessed on 15 December 2024).
  12. Nikam, J.; Archer, D.; Nopsert, C. Regulating Air Quality in Thailand: A Review Policies. SEI Policy Brief. Stockholm Environmental Institute. 2021. Available online: https://www.sei.org/publications/regulating-air-quality-in-thailand-a-review-of-policies/ (accessed on 9 November 2024).
  13. Rughooputh, S.P.; Rughooputh, M.S.; Guo, Y.; Rong, Y.; Chen, W. Occupational exposure to silica dust and risk of lung cancer: An updated meta-analysis of epidemiological studies. BMC Public Health 2016, 16, 1137. [Google Scholar] [CrossRef]
  14. Samana, K.; Ketsakorn, A. Health risk assessment of inhalation exposure to respirable dust among workers in stone mill, Saraburi Province. Dis. Control. J. 2023, 49, 167–178. [Google Scholar] [CrossRef]
  15. Jaber, H.M.; Mohamed, M.S.; El-Safty, A.M.; El-Salamoni, O.K.; Ibrahim, H.M.; El-Din, W.S. Pulmonary Problems among stone cutting workers in West Bank-Palestine. Med. J. Cairo Univ. 2015, 83, 1. Available online: www.medicaljournalofcairouniversity.net (accessed on 20 March 2023).
  16. Krejcie, R.V.; Morgan, D.W. Determining sample size for research activities. Educ. Psychol. Meas. 1970, 30, 607–610. [Google Scholar] [CrossRef]
  17. Thai Meteorological Department. In Thai. Available online: https://www.tmd.go.th (accessed on 6 February 2025).
  18. United States Environmental Protection Agency. United States Environmental Protection Agency, EPA Human Health Risk Assessment Guidance; United States Environmental Protection Agency: Washington, DC, USA, 1991.
  19. World Health Organization. Ambient Outdoor Air Pollution. Available online: https://www.who.int./news-room/fact-sheets/detail/ambient-(outdoor)-air-quality-and-health (accessed on 20 March 2023).
  20. United States Environmental Protection Agency. The Risk Assessment Guidelines of 1986; USEPA EPA/600/8-87/045; United States Environmental Protection Agency: Washington, DC, USA, 1987.
  21. Zheng, H.; Csemezová, J.; Loomans, M.; Walker, S.; Gauvin, F.; Zeiler, W. Species profile of volatile organic compounds emission and health risk assessment from typical indoor events in daycare centers. Sci. Total Environ. 2024, 918, 170734. [Google Scholar] [CrossRef] [PubMed]
  22. Saraburi Town & Country Planning. In Thai. Available online: https://ratchakitcha.soc.go.th/documents/1912656.pdf (accessed on 15 January 2024).
  23. Zhang, H.; Hu, J.; Ying, Q.; Hu, X.M. Relationships between meteorological parameters and criteria air pollutants in three megacities in China. Environ. Res. 2015, 140, 242–254. [Google Scholar] [CrossRef] [PubMed]
  24. Yang, J.; Ji, Z.; Kang, S.; Zhang, Q.; Chen, X. Spatiotemporal variations of air pollutants in western China and their relationship to meteorological factors and emission sources. Environ. Pollut. 2019, 254 Pt A, 112952. [Google Scholar] [CrossRef]
  25. Hu, M.; Wang, Y.; Wang, S.; Jiao, M.; Huang, G. Spatial-temporal heterogeneity of air pollution and its relationship with meteorological factors in the Pearl River Delta, China. Atmos. Environ. 2021, 254, 118415. [Google Scholar] [CrossRef]
  26. Aladag, E. The influence of meteorological factors on air quality in the province of Van, Turkey. Water Air Soil Pollut. 2023, 234, 259. [Google Scholar] [CrossRef]
  27. Çelik, M.B.; Kadı, İ. The relation between meteorological factors and pollutants concentrations in Karabük city. Gazi Univ. J. Sci. 2007, 20, 87–95. [Google Scholar]
  28. Danek, T.; Weglinska, E.; Zareba, M. The influence of meteorological factors and terrain on air pollution concentration and migration: A geostatistical case study from Krakow, Poland. Sci. Rep. 2022, 12, 11050. [Google Scholar] [CrossRef]
  29. Tian, Y.; Yao, X.A.; Mu, L.; Fan, Q. Integrating meteorological factors for better understanding of the urban form-air quality relationship. Landsc. Ecol. 2020, 35, 2357–2373. [Google Scholar] [CrossRef]
  30. Li, R.; Wang, Z.; Cui, L.; Fu, H.; Zhang, L. Air pollution characteristics in China during 2015–2016: Spatiotemporal variations and key meteorological factors. Sci. Total Environ. 2019, 648, 902–915. [Google Scholar] [CrossRef]
  31. Chen, C.H.; Tsai, P.J.; Chang, W.W.; Chen, C.Y.; Chen, C.Y.; Yates, D.; Guo, Y.L. Dose-response relationship between lung function and chest imaging response to silica exposures in artificial stone manufacturing workers. Environ. Health 2024, 23, 25. [Google Scholar] [CrossRef]
  32. Choudhary, A.; Kumar, P.; Pradhan, C.; Sahu, S.K.; Chaudhary, S.; Joshi, P.K.; Pandey, D.N.; Prakash, D.; Mohanty, A. Environmental and health impacts of air pollution: A review. Front. Environ. Sci. 2023, 11, 1132159. [Google Scholar] [CrossRef]
  33. Swangjang, K.; Cumkett, S. Mitigation Hierarchy; An Effectiveness of Project Control Mechanism. In Handbook of Advanced Approaches Towards Pollution Prevention and Control; Rahman, R.O.A., Hussain, C.M., Eds.; Elsevier: New York, NY, USA, 2021; Volume 1, pp. 235–240. [Google Scholar]
  34. Swangjang, K. Comparative review of EIA in the Association of Southeast AsianNations. Environ. Impact Assess. Rev. 2018, 78, 33–42. [Google Scholar] [CrossRef]
Figure 1. Study areas.
Atmosphere 16 00230 g001
Figure 2. House characteristics of Moo 3 (left) and Moo 6 (right).
Atmosphere 16 00230 g002
Figure 3. Background of respondents of Moo 3 and Moo 6.
Atmosphere 16 00230 g003
Figure 4. TSP (24 h) (left) and PM10 (24 h) (right) of Moo 3 and Moo 6 in three seasons. Note: ambient air quality standard of TSP (24 h) is <0.33 mg/m3 and of PM10 (24 h) is 0.05 mg/m3 [19].
Atmosphere 16 00230 g004
Figure 5. HQ of TSP and PM10 of individual respondents in both areas in three seasons.
Atmosphere 16 00230 g005
Table 1. Monitoring performance of 7 stone mills during 2008–2011.
Stone MillsNumber of Monitoring StationMonitoring Frequencies
(per Year) **
142
272,1
35 *2
452
552
662
732
Source: [9]. Note * Only TSPs was monitored; ** monitoring frequencies were performed twice or once per annum for each monitoring station.
Table 2. Factor values of CDI in this study.
FactorsUnitsSources
Concentration of TSP and PM10 (C)mg·m−3Monitoring reports of stone mill industries
Inhalation rate (IR)0.83 m3·h−1 for adults
0.208 m3·h−1 for children
US EPA (1987) [20]
Exposure time (ET)h·day−1Questionnaire
Exposure frequency (EF)day·year−1Questionnaire
Exposure duration (ED)YearQuestionnaire
Body weight of the exposed individual (BW)kgQuestionnaire
Time period over which the dose was averaged (AT)DayQuestionnaire
Table 3. Factors affecting underlying disease.
Environment and Personal BehaviorUnderlying Disease
(N: Percentage)
Non-Underlying Disease
(N: Percentage)
χ2p-Value
Smoking09: 13.459: 26.660.162<0.00 **
Pollution prevention
-Mask use13: 06.706: 33.328.223<0.00 **
-Staying indoors30: 30.603: 09.4
Distance from stone mill
1–300 m02: 47.207: 52.830.711<0.00 **
301–500 m31: 30.903: 09.1
More than 500 m22: 34.443: 05.6
Distance from road
1–100 m13: 52.107: 47.92.6820.262
101–300 m08: 10.003: 30.0
More than 300 m34: 44.742: 55.3
House characteristics
Single floor37: 46.4112: 10018.06<0.00 **
More than one floor17: 53.6
Note: ** Statistical association (p < 0.01).
Table 4. Factors associated with the communities.
FactorsMoo 3
(N: Percentage)
Moo 6
(N: Percentage)
p-Value
Underlying diseases83: 55.33%37: 48.68%0.344
Smoking40: 26.67%27: 35.53%0.1683
Pollution-prevention awareness35: 23.33%15: 19.74%0.5383
Housing distance from stone mills
1–300 m129: 86%00.001 **
301–500 m21: 14%12: 15.79%
More than 500 m064: 84.21%
Housing distance from road
1–100 m140: 93.33%72: 94.74%0.6792
101–300 m10: 6.67%4: 5.26%
House characteristics
Single floor146: 97.33%62: 81.58%0.001 **
More than one floor4: 2.67%14: 18.42%
Note: ** Statistical association (p < 0.01).
Table 5. Health risk assessment.
Hazard RiskAreasWinterSummerRainy
HQ (Mean ± SD)t-TestHQ (Mean ± SD)t-TestHQ
(Mean ± SD)
t-Test
TSPMoo 30.808 ± 0.09782.940 **0.322 ± 0.03828.026 **0.281 ± 0.0335.538 **
Moo 60.150 ± 0.0080.227 ± 0.1150.263 ± 0.014
PM10Moo 31.696 ± 0.20269.033 **0.763 ± 0.09133.397 **1.108 ± 0.13246.149 **
Moo 60.535 ± 0.0270.497 ± 0.025 0.585 ± 0.030
Note: ** Statistical association (p < 0.01).
Disclaimer/Publisher’s Note: The statements, opinions and data contained in all publications are solely those of the individual author(s) and contributor(s) and not of MDPI and/or the editor(s). MDPI and/or the editor(s) disclaim responsibility for any injury to people or property resulting from any ideas, methods, instructions or products referred to in the content.

