Article

Skill Validation of High-Impact Rainfall Forecasts over Vietnam Using the European Centre for Medium-Range Weather Forecasts (ECMWF) Integrated Forecasting System (IFS) and Dynamical Downscaling with the Weather Research and Forecasting Model

1
Vietnam National Center for Hydro-Meteorological Forecasting, 8 Phao Dai Lang Str., Hanoi 100000, Vietnam
2
Institute of Meteorology and Climate Research, Karlsruhe Institute of Technology, 82467 Garmisch-Partenkirchen, Germany
3
Institute of Engineering Innovation, The University of Tokyo, Tokyo 113-8656, Japan
4
Norwegian Meteorological Institute, 5007 Bergen, Norway
*
Author to whom correspondence should be addressed.
Atmosphere 2025, 16(2), 224; https://doi.org/10.3390/atmos16020224
Submission received: 15 January 2025 / Revised: 10 February 2025 / Accepted: 12 February 2025 / Published: 16 February 2025
(This article belongs to the Special Issue Precipitation Observations and Prediction (2nd Edition))

Abstract

:
This research evaluates the quality of high-impact rainfall forecasts across Vietnam and its sub-climate regions. The 3-day rainfall forecast products evaluated include the European Centre for Medium-Range Weather Forecasts (ECMWF) High-Resolution Integrated Forecasting System (IFS) and its downscaled outputs using the Weather Research and Forecasting (WRF) model with the Advanced Research WRF core (WRF-ARW): direct downscaling and downscaling with data assimilation. A full 5-year validation period from 2019 to 2025 was processed. The validation focused on basic rainfall thresholds and also considered the distribution of skill scores for intense events and extreme events. The validations revealed systematic errors (bias) in the models at low rainfall thresholds. The forecast skill was the lowest for northern regions, while the central regions exhibited the highest. For regions strongly affected by terrain, high-resolution downscaling with local observation data assimilation is necessary to improve the detectability of extreme events.

1. Introduction

Vietnam’s territory stretches over 15 latitudes and is divided into three main climatic zones: the north of Vietnam with a subtropical humid climate, the center of Vietnam with a tropical monsoon climate, and the south of Vietnam with a tropical savanna climate. Given Vietnam’s geographical characteristics, the mechanisms for establishing rainfall regimes in the region are influenced by a variety of weather systems, both tropical and extra-tropical, including cold surges and cold fronts, subtropical troughs and monsoons, tropical disturbances and tropical cyclones, and their combinations [1,2,3]. Annual rainfall ranges from 1200 to 3000 mm, and nearly 80–90% falls in the summer. In Figure 1b, the map displays the 5-year average total accumulated rainfall (2019–2023), highlighting Vietnam’s abundant rainfall regime.
Due to differences in latitude and topography, the climate tends to change significantly from one area to another and can be divided in more detail into seven climate zones (Figure 1a, R1–R7) with different characteristics [4]: (i) the North West Region (R1) has 1200–2000 mm of annual rainfall, and its rainy season spans from April to September; (ii) the North East Region (R2) has 1400–2000 mm of annual rainfall, and its rainy season spans from April to November; (iii) the Red River Delta Region (R3) has 1400–1800 mm of annual rainfall, and its rainy season spans from April to November; (iv) the North Central Region (R4) has 1400–2000 mm of annual rainfall, and its rainy season spans from August to December; (v) the South Central Region (R5) has 1200–2000 mm of annual rainfall in the north of region and only 1200–1600 mm in the south of the region, and its rainy season spans from August to December; (vi) the Central Highlands Region (R6) has 1400–2000 mm of annual rainfall, and its rainy season spans from May to October; and (vii) the Southern Region (R7) has 1600–2000 mm of annual rainfall, and its rainy season spans from May to October. Table 1 summarizes the main features of the seven climate zones of Vietnam.
The key source of quantitative precipitation forecasts (QPFs) is numerical weather predictions (NWPs), especially with recent developments in high-performance computing (HPC) systems, with many global satellite observations being used to build reliable initial conditions for global models with complex 3–4-dimensional data assimilation systems. Increases in model resolutions and the physical representation details help significantly improve forecast quality [5]. Moreover, the NWP’s rainfall forecasts have been shown to be highly reliable, especially when combined with ensemble forecast systems, which allow for uncertainty information to be obtained up to 10 days in advance [6,7].
However, with the requirement of more spatial and temporal details, regional-scale or limited-area models will be more responsive to QPFs. With implementations of rapid assimilation systems [8], blended with nowcasting products [9] and more appropriate parameterization instead of fixed global-scale models, regional-scale NWPs have enabled significant increases in QPF skills, especially heavy rain forecasting.
In fact, the current rain forecasting skills are very limited. When directly validated via metric scores such as mean squared error or root mean square error between forecasts and rain gauge observations, the error is very large, and the correlation coefficient between observations and forecasts is typically ~0.3, or even lower for tropical regions. Therefore, rainfall forecast information is additionally evaluated in terms of different operational skills, such as at given rainfall thresholds or the ability of a forecast to discriminate between rain types (heavy, light, and no rainfall) [10]. With information on threshold assessment skills, the rainfall thresholds with high impact/intensities are surveyed (20–50 mm/24 h) to extreme rainfall thresholds (>100 mm/24 h), thereby allowing appropriate warnings to be issued in extreme rainfall operation forecast bulletins.
Operational forecasting at the Vietnam National Center for Hydro-Meteorological Forecasting (NCHMF) is mainly based on international global-scale forecast systems from the Japanese Meteorological Agency (JMA), the United States National Centers for Environmental Prediction (NCEP), Germany’s Weather Service (DWD), and the European Centre for Medium-Range Weather Forecasts (ECMWF). In addition, more detail on the forecast is also attained through dynamical downscaling products using the Weather Research and Forecasting (WRF) model. The NCHMF is also currently the focal point of two missions of the World Meteorological Organization (WMO) in the Severe Weather Forecasting Programme (SWFP) and the Flash Flood Guidance System (FFGS) for Southeast Asia [11]. NWPs are provided directly to FFGS as inputs for flash flood and landslide warning models; therefore, assessments of the QPF’s skills of current models are also extremely important in improving the quality of forecasts and minimizing damage, preventing natural disasters caused by heavy rains and extreme rains in the Southeast Asia region in general and in Vietnam in particular.
The structure of the paper is as follows: Section 2 provides a comprehensive description of NWPs. Section 3 presents observational data and the evaluation methods. Section 4 presents the validation results, and some main conclusions are drawn in Section 5.

2. Model Descriptions

2.1. The European Centre for Medium-Range Weather Forecasts High-Resolution Integrated Forecasting System (ECMWF IFS) Model

With the official license to use the European Centre for Medium-Range Weather Forecasts (ECMWF) data for national severe weather hazard prevention, the raw limited domain data (covering Southeast Asia) were transferred with forecast ranges up to 10 days for the High-Resolution Integrated Forecast System (resolution ~9 km, deterministic forecast, denoted as the IFS in this research) to the National Center for Hydro-Meteorological Forecasting’s (NCHMF) servers for further post-processing (e.g., making meteorological variable field plots or using the initial and lateral boundary conditions for limited-area models).
The IFS model, considered the most sophisticated and reliable forecasting model currently available [10,12,13,14], provides optimal boundary conditions for performing dynamical downscaling with regional models, facilitating enhanced forecasting resolution for centers such as the NCHMF, which lacks the infrastructure to make sophisticated global forecasts.

2.2. The Weather Research and Forecasting Model with the Advanced Research WRF Core (WRF-ARW) Model

As mentioned, the regional numerical weather prediction (NWP) system at the NCHMF is based on the Weather Research and Forecasting (WRF) model, which utilizes the Advanced Research dynamical core, version 3.9.1.1, denoted as WRF-ARW. The WRF-ARW has been the subject of research by numerous scholars in the field, with contributions that have facilitated the incorporation of recent developments in NWPs, including physical parameterization schemes and data assimilation [15].
The initial and 3-hourly interval lateral boundary conditions were obtained from the IFS. The horizontal resolution of the WRF-ARW is 3 km for the domain covering Vietnamese lands and the Bien Dong Sea (also known as the South China Sea) (4° N–27° N; 97° E–127° E), using 41 vertical levels up to 5 hPa.
To enhance the initial conditions across the Vietnam area, the WRF-ARW’s data assimilation system (WRFDA) [15] was used with both the Global Telecommunications System (GTS) data and additional surface observations of Vietnam. The background error information was generated by applying the National Meteorological Center (NMC) method, using 12 h and 24 h forecast ranges of the WRF-ARW for the domain above Vietnam over a two-week period [16]. The WRF-ARW was cycled every six hours, and the initial conditions for the next/warm assimilated cycles were derived from the most recent run (six-hour forecast).
In this research, the WRF-ARW with the IFS’s initial and lateral boundary conditions is denoted as WRF3kmIFS. The WRF3kmIFS with data assimilation is denoted as WRF3kmIFS-DA.
An example of the rainfall forecast from the IFS and its downscaling with the WRF-ARW related to the heavy rainfall event on 21 July 2020, 00:00 UTC (07:00 LTC) in the northern mountainous region of Vietnam is shown in Figure 2. The IFS forecast could not capture the rainfall amounts over Ha Giang province (200–400 mm/24 h, in the north of the R2 sub-climate area), but these amounts were accurately represented in both the WRF3kmIFS and WRF3kmIFS-DA forecasts. In this example, WRF3kmIFS-DA produced the most accurate extreme rainfall values, closely matching the observations. The example also shows the potential for improved forecasting when incorporating local observation data assimilation rather than relying solely on dynamical downscaling with the WRF-ARW.

3. Observational Data and Verification Methodology

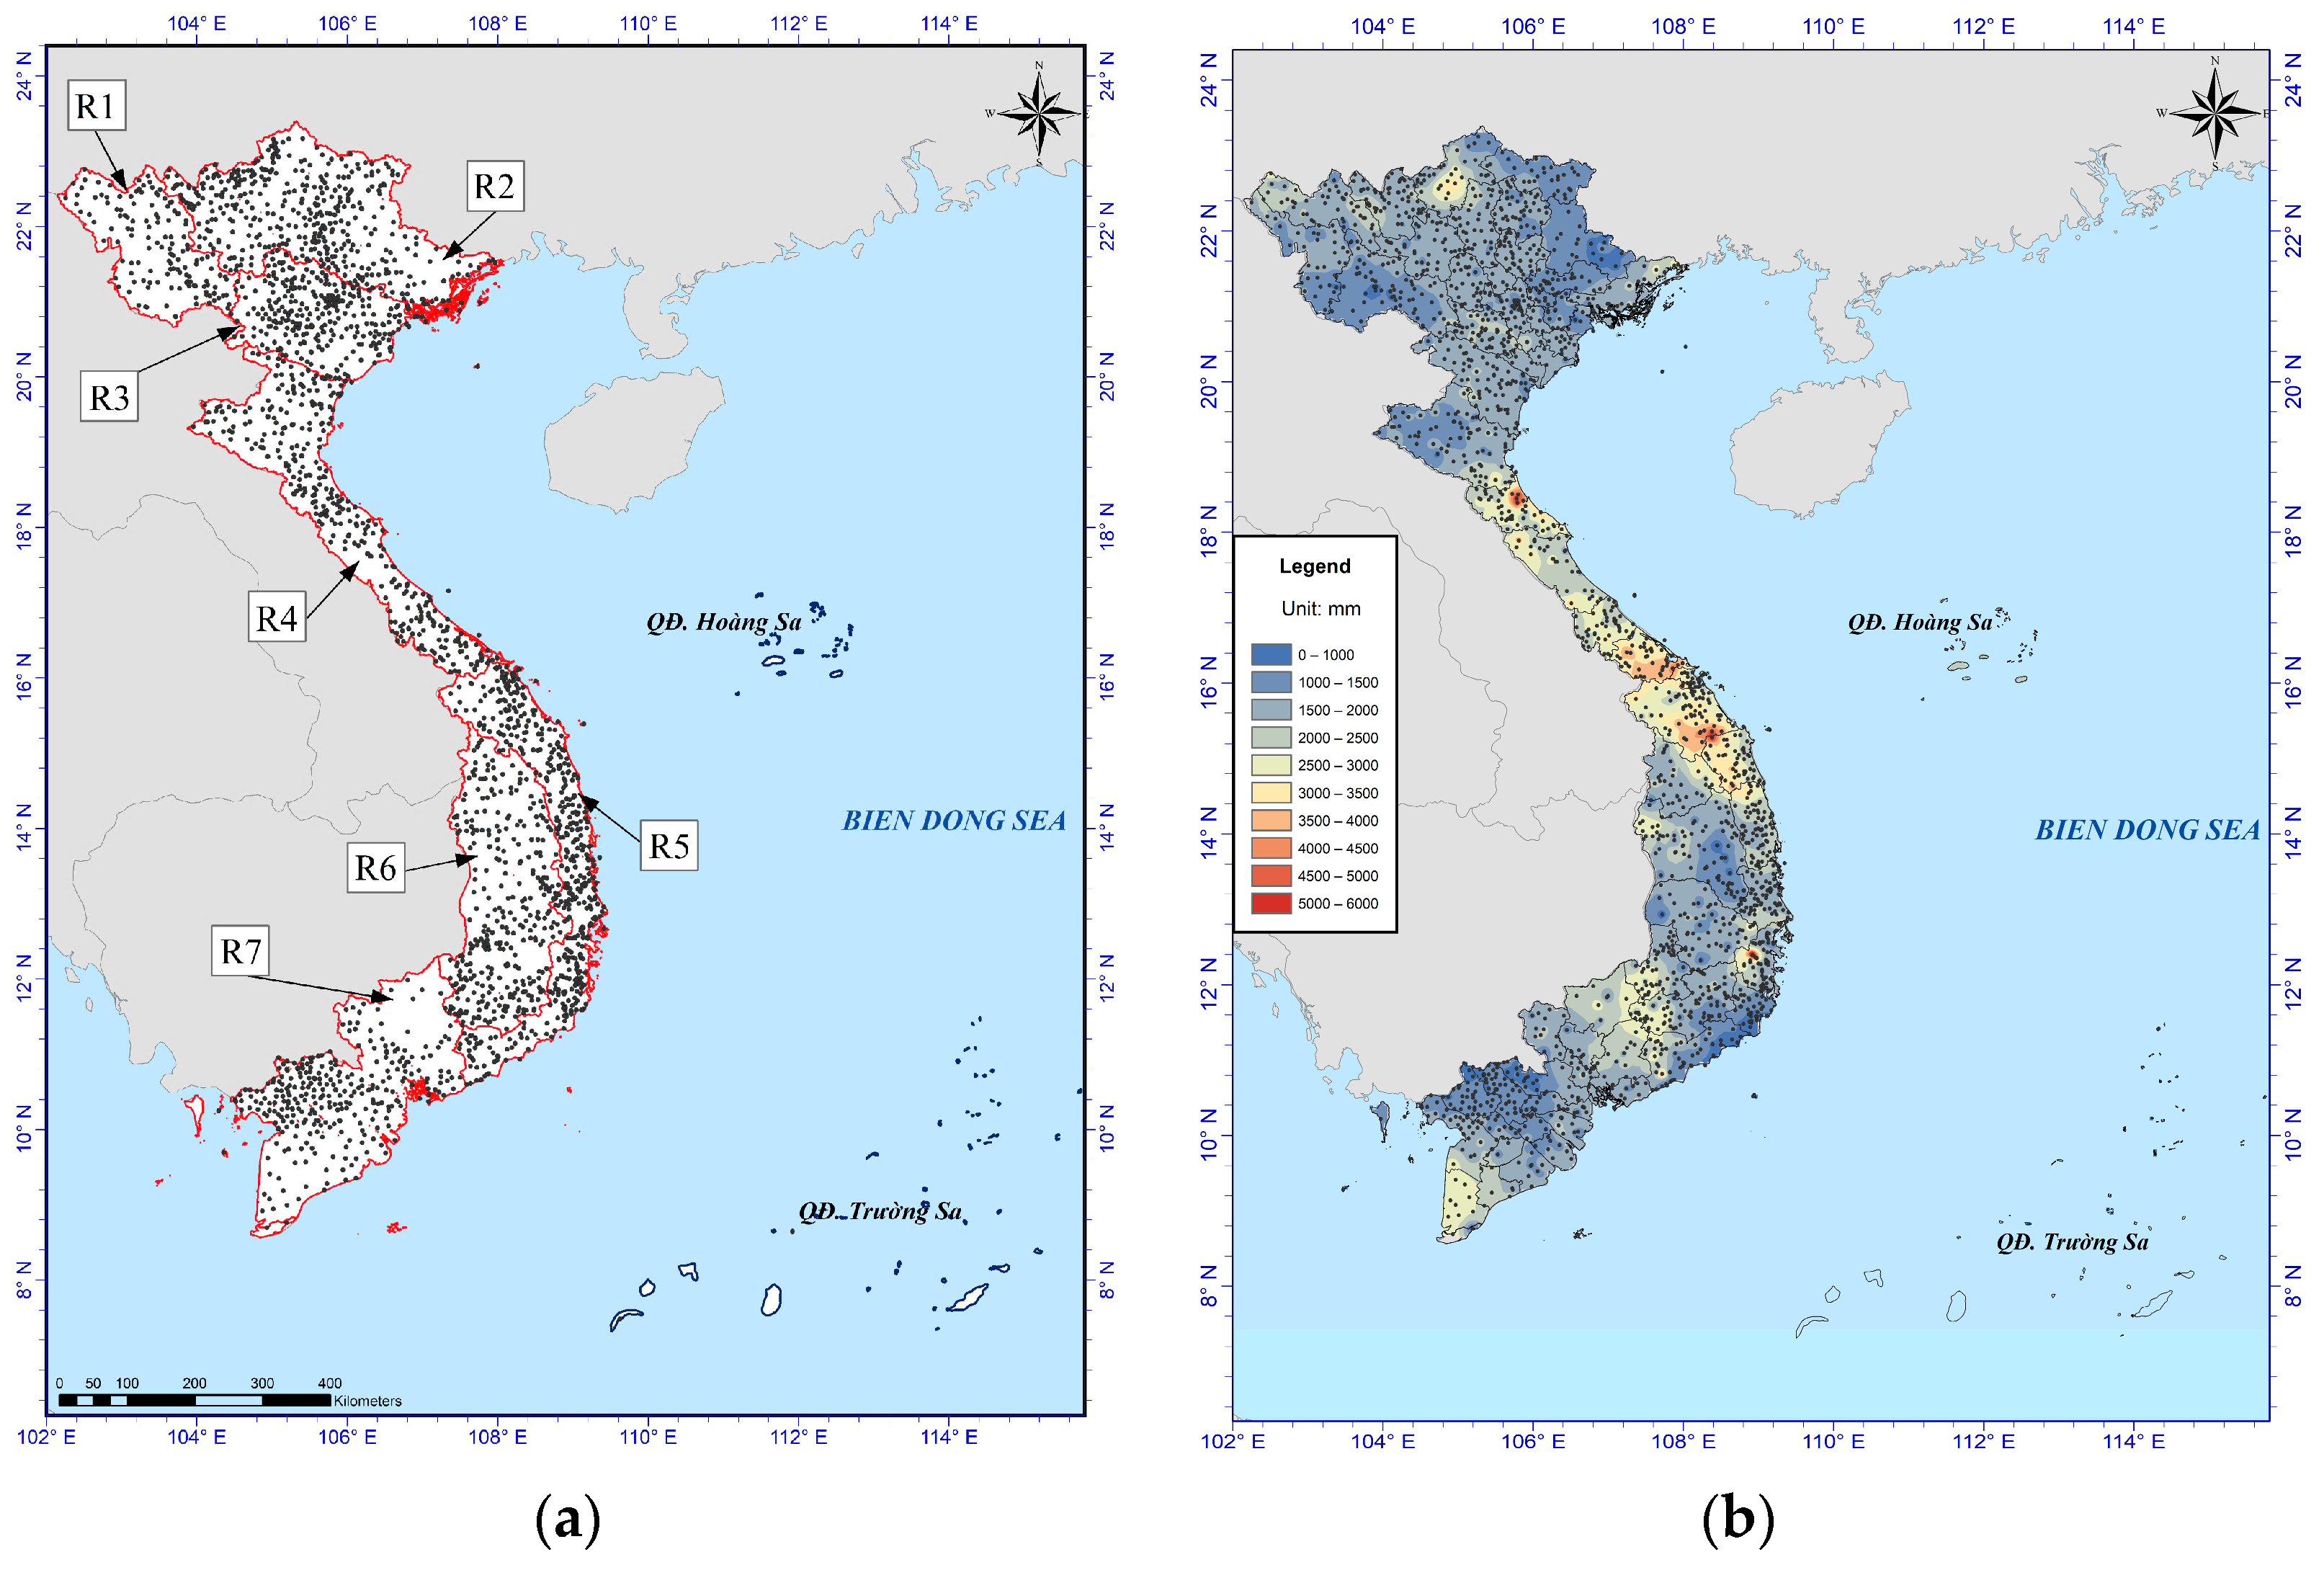
3.1. Vietnam Sub-Climate Regions and Precipitation Observational Data

In this research, the station-based rainfall dataset draws from 2111 automatic weather stations (AWS) over Vietnam (Figure 1a) [17]. In fact, Vietnam’s AWSs system was established from different international/domestic projects; therefore, synchronization was a challenge and it was not until 2018 that the data were able to undergo quality control with an error of about 2–4% of the total number of stations. Compared with the rainfall observation information from about 180 conventional Synop stations before, the AWS system has provided very detailed rainfall information across the entire territory of Vietnam. The number of stations for regions R1, R2, R3, R4, R5, R6, and R7 is 156, 420, 141, 334, 480, 299, and 291, respectively. Of these, regions R2 and R4 have the most stations.

3.2. Validation Methods

To determine the forecast of a given station, the nearest model grid to each station location will be searched, and then, a model forecast value will be assigned to this station.
The validation scores used in this research were the probability of detection (POD, perfect score value: 1), false alarm ratio (FAR, perfect score value: 0), frequency bias (BIAS perfect score value: 1), threat score (TS perfect score value: 1) or critical success index (CSI), and Heidke skill score (HSS perfect score value: 1) for a given threshold. The systematic errors of models can be considered through the BIAS score. A BIAS value of ~1 ensures that the forecast frequency of model does not over- or underestimate for each specific rainfall observation threshold. The POD indicates that the rates of the observed rain events were correctly forecasted. The FAR indicates that the rates of the forecasted rain events were not observed. The TS and HSS indicate the fraction of observed and/or forecast events that were correctly forecasted. The advantage of HSS over TS is that HSS will eliminate those forecasts that could be correct but relate only to random probabilities. All the information on the validation methods used in this research can be found in [18].
To evaluate the overall skill, in this research, about 1825 samples (from 5 years × 365 days × 1 forecast cycle at 00 UTC) were processed. The forecast variable for the 24 h, 48 h, and 72 h forecast ranges to be evaluated is the accumulated rainfall in 24 h, and with the normal rainfall thresholds of >5 mm/24 h. For high-impact rainfall, the intense rainfall thresholds of >25 mm/24 h and >50 mm/24 h will be used. For extreme rainfall events, the threshold of >100 mm/24 h is used. Here, the research gives evaluation scores at some popular thresholds recommended by the WMO [19] and related to the rain characteristics of Vietnam.
Note that when calculating the representative score for each sub-climate region, instead of averaging scores at stations, all the stations across each region were used to establish the sample and then applied to calculate the skill scores.

4. Results and Discussion

4.1. General Skill Statistics

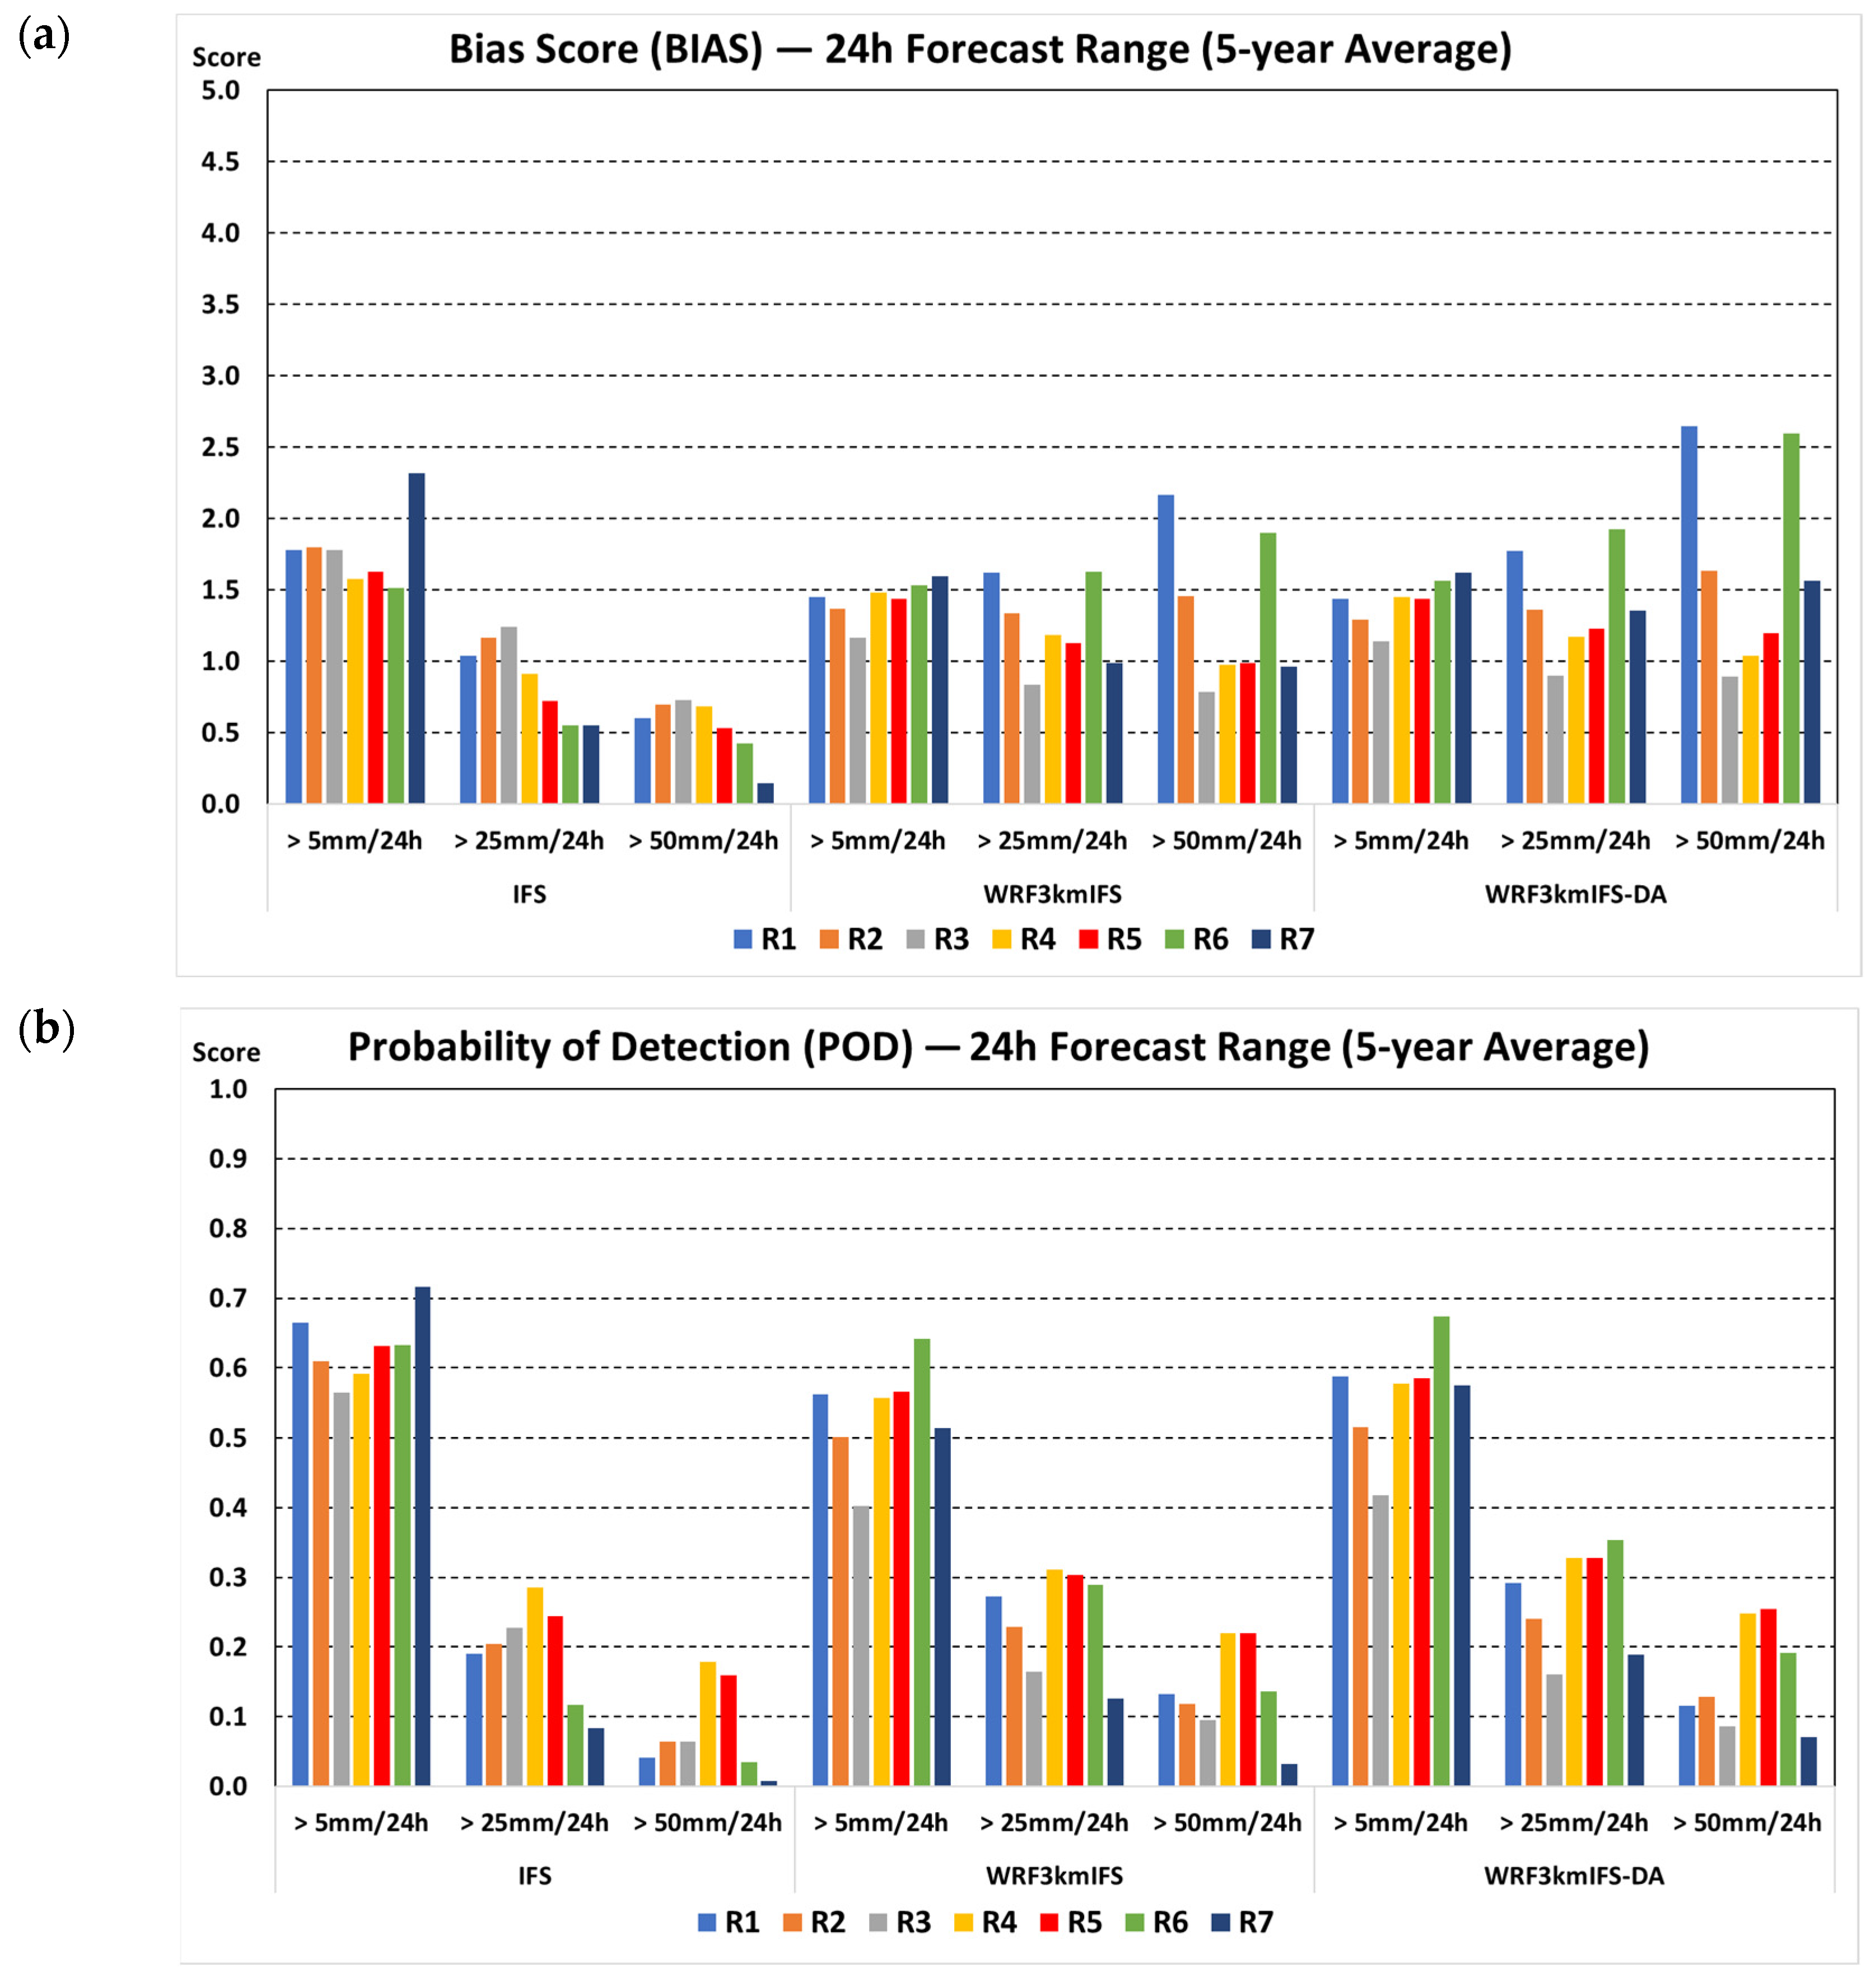
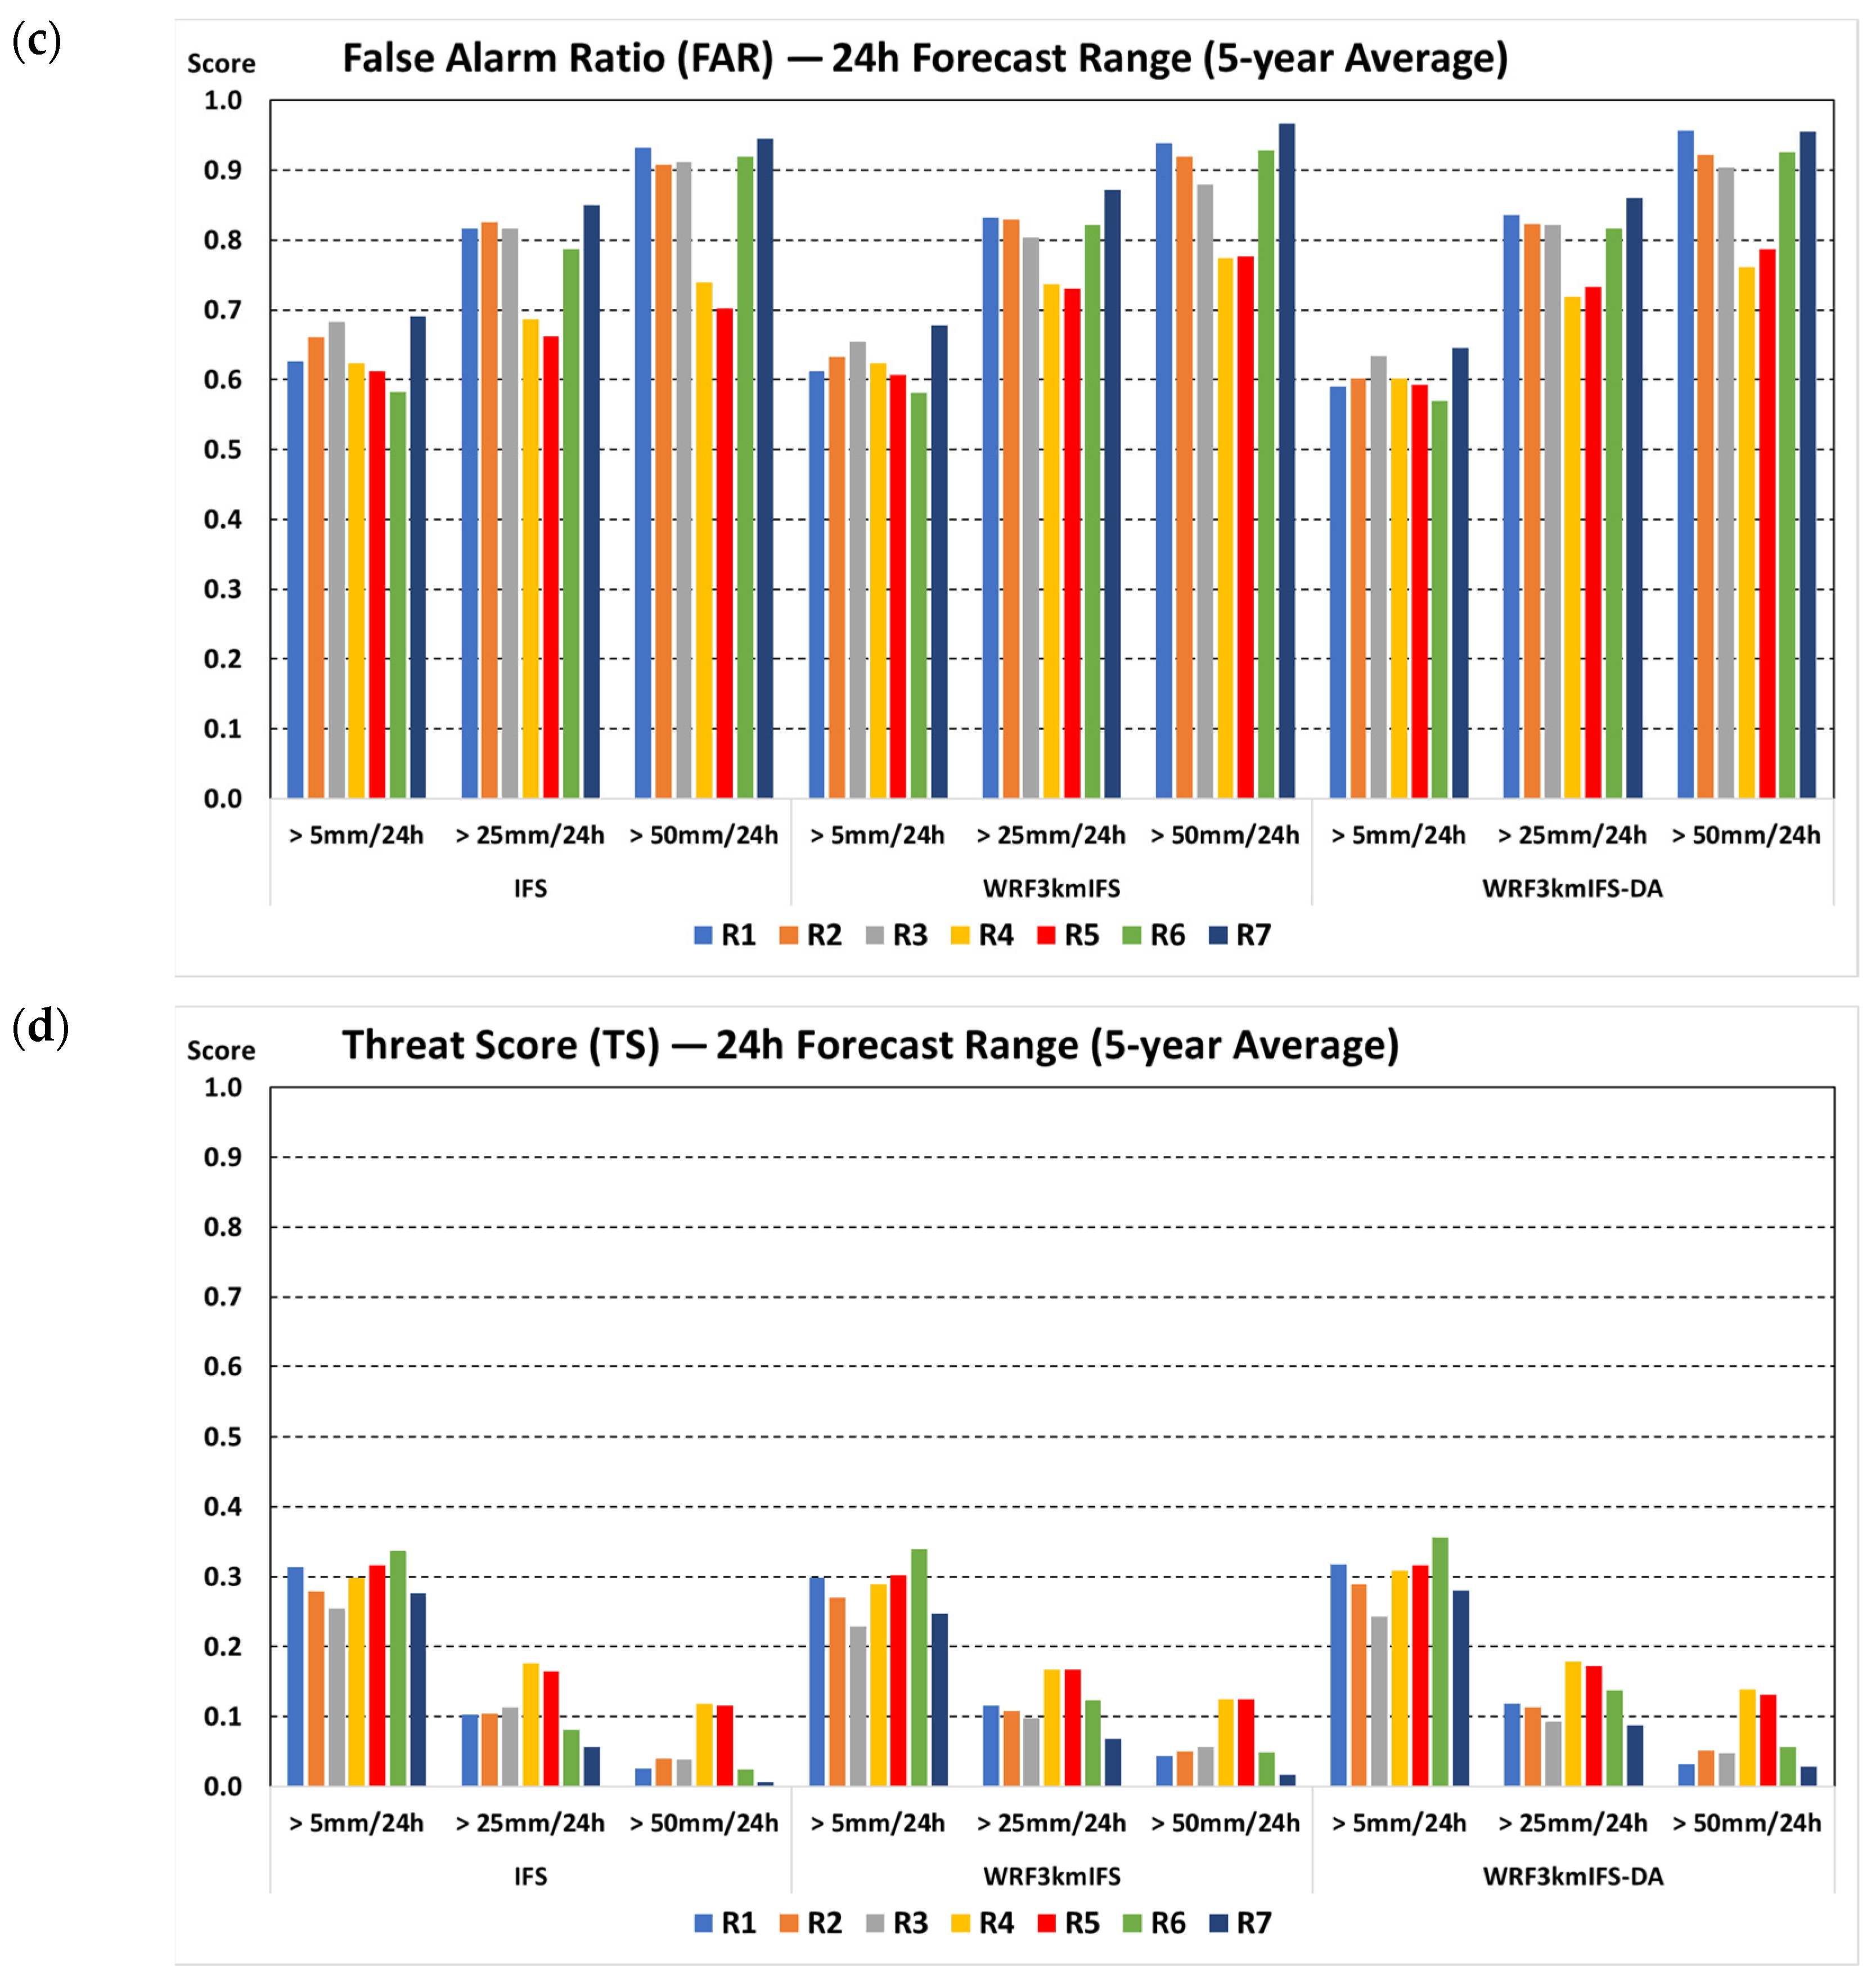
4.1.1. For the Forecast Range of 24 h

Regarding BIAS scores (Figure 3a), it can be seen that the IFS tends to overestimate (overforecasting) (~1.7–2) at small thresholds (5 mm), while higher thresholds are all underestimated. High-resolution downscaling forecasts slightly reduce this overestimate at the 5 mm threshold. The most improved BIAS with WRF3kmIFS and WRF3kmIFS-DA is focused on areas over the north (R1, R2, and R3). However, the remaining sub-climate areas still have BIAS scores of about 1.5. However, at large thresholds, downscaling with WRF3kmIFS and WRF3kmIFS-DA significantly improved the underestimation of forecasts, except for the R1 and R6 regions. The problem of overestimation bias over Southeast Asia was also pointed out in Lavers et al.’s 2021 research evaluating the IFS’s precipitation forecasts [20]. However, it should be noted that these overestimates are only at small rainfall thresholds.
Regarding POD scores (Figure 3b), the detection rate for the 5 mm/24 h threshold of the IFS is best, with a value range of 0.5–0.6. At higher thresholds, downscaling forecasts increase the detection rate by 5–10%. The assimilated mode WRF3kmIFS-DA also has the highest detection rate for heavy rainfall thresholds, significantly improving for the R4, R5, and R6 regions.
Regarding the false alarm rate through the FAR scores (Figure 3c), three models have comparable results; for high rainfall thresholds, the FAR is above 60%. This shows that in order to have forecasting skills at high rainfall thresholds, the acceptance of high overestimation rates is needed.
In detail, regarding the skill of forecasting rainfall phenomena through the TS scores (Figure 3d), at rainfall thresholds >50 mm, the IFS has almost no skill (<0.05). The IFS’s TS skill can also be referenced in the research by Chen et al. (2023), focused on improving rainfall forecasts [21]. The research showed that TS scores rapidly decrease as thresholds increase, from 0.65 to 0.18, indicating its limitation in heavy rainfall forecasts. For thresholds >20 mm, the TS scores were only below 0.16–0.2 (depending on the season), accompanied by FAR scores of about 0.7–0.8. Note that the research [21] compared the IFS’s forecasting to the fifth-generation ECMWF atmospheric reanalysis (ERA5) grid data with a fairly coarse resolution. At a higher resolution, these skills would be considerably lower. Returning to the obtained results, the downscaling WRF3kmIFS and WRF3kmIFS-DA models also increased the skill at high rainfall thresholds, especially for the R4, R5, and R6 regions.

4.1.2. For Longer Forecast Ranges of 48 h and 72 h

In general, the POD, TS, ETS, and HSS scores decreased quite rapidly. Figure 4 compares the TS scores of three models with 24 h, 48 h, and 72 h forecast ranges at three thresholds of >5 mm/24 h, >25 mm/24 h, and >50 mm/24 h. It can be clearly seen that, with a low rainfall threshold of >5 mm/24 h, the models have quite stable forecasting skills at three forecasting ranges with TS values of ~0.2 to 0.25. The R4, R5, R6, and R7 regions have slightly better skills than the remaining regions. The R6 region has a fairly clear improvement in high-resolution forecasting using WRF3kmIFS and data assimilation using WRF3kmIFS-DA. The WRF3kmIFS-DA experiments also show improvements at high thresholds and for 48 h and 72 h forecasting ranges compared to the IFS; specifically, WRF3kmIFS-DA still achieves a TS skill >0.1 for the 48 h and 72 h ranges in regions R4, R5, and R6, while the IFS has corresponding skill values <0.1.

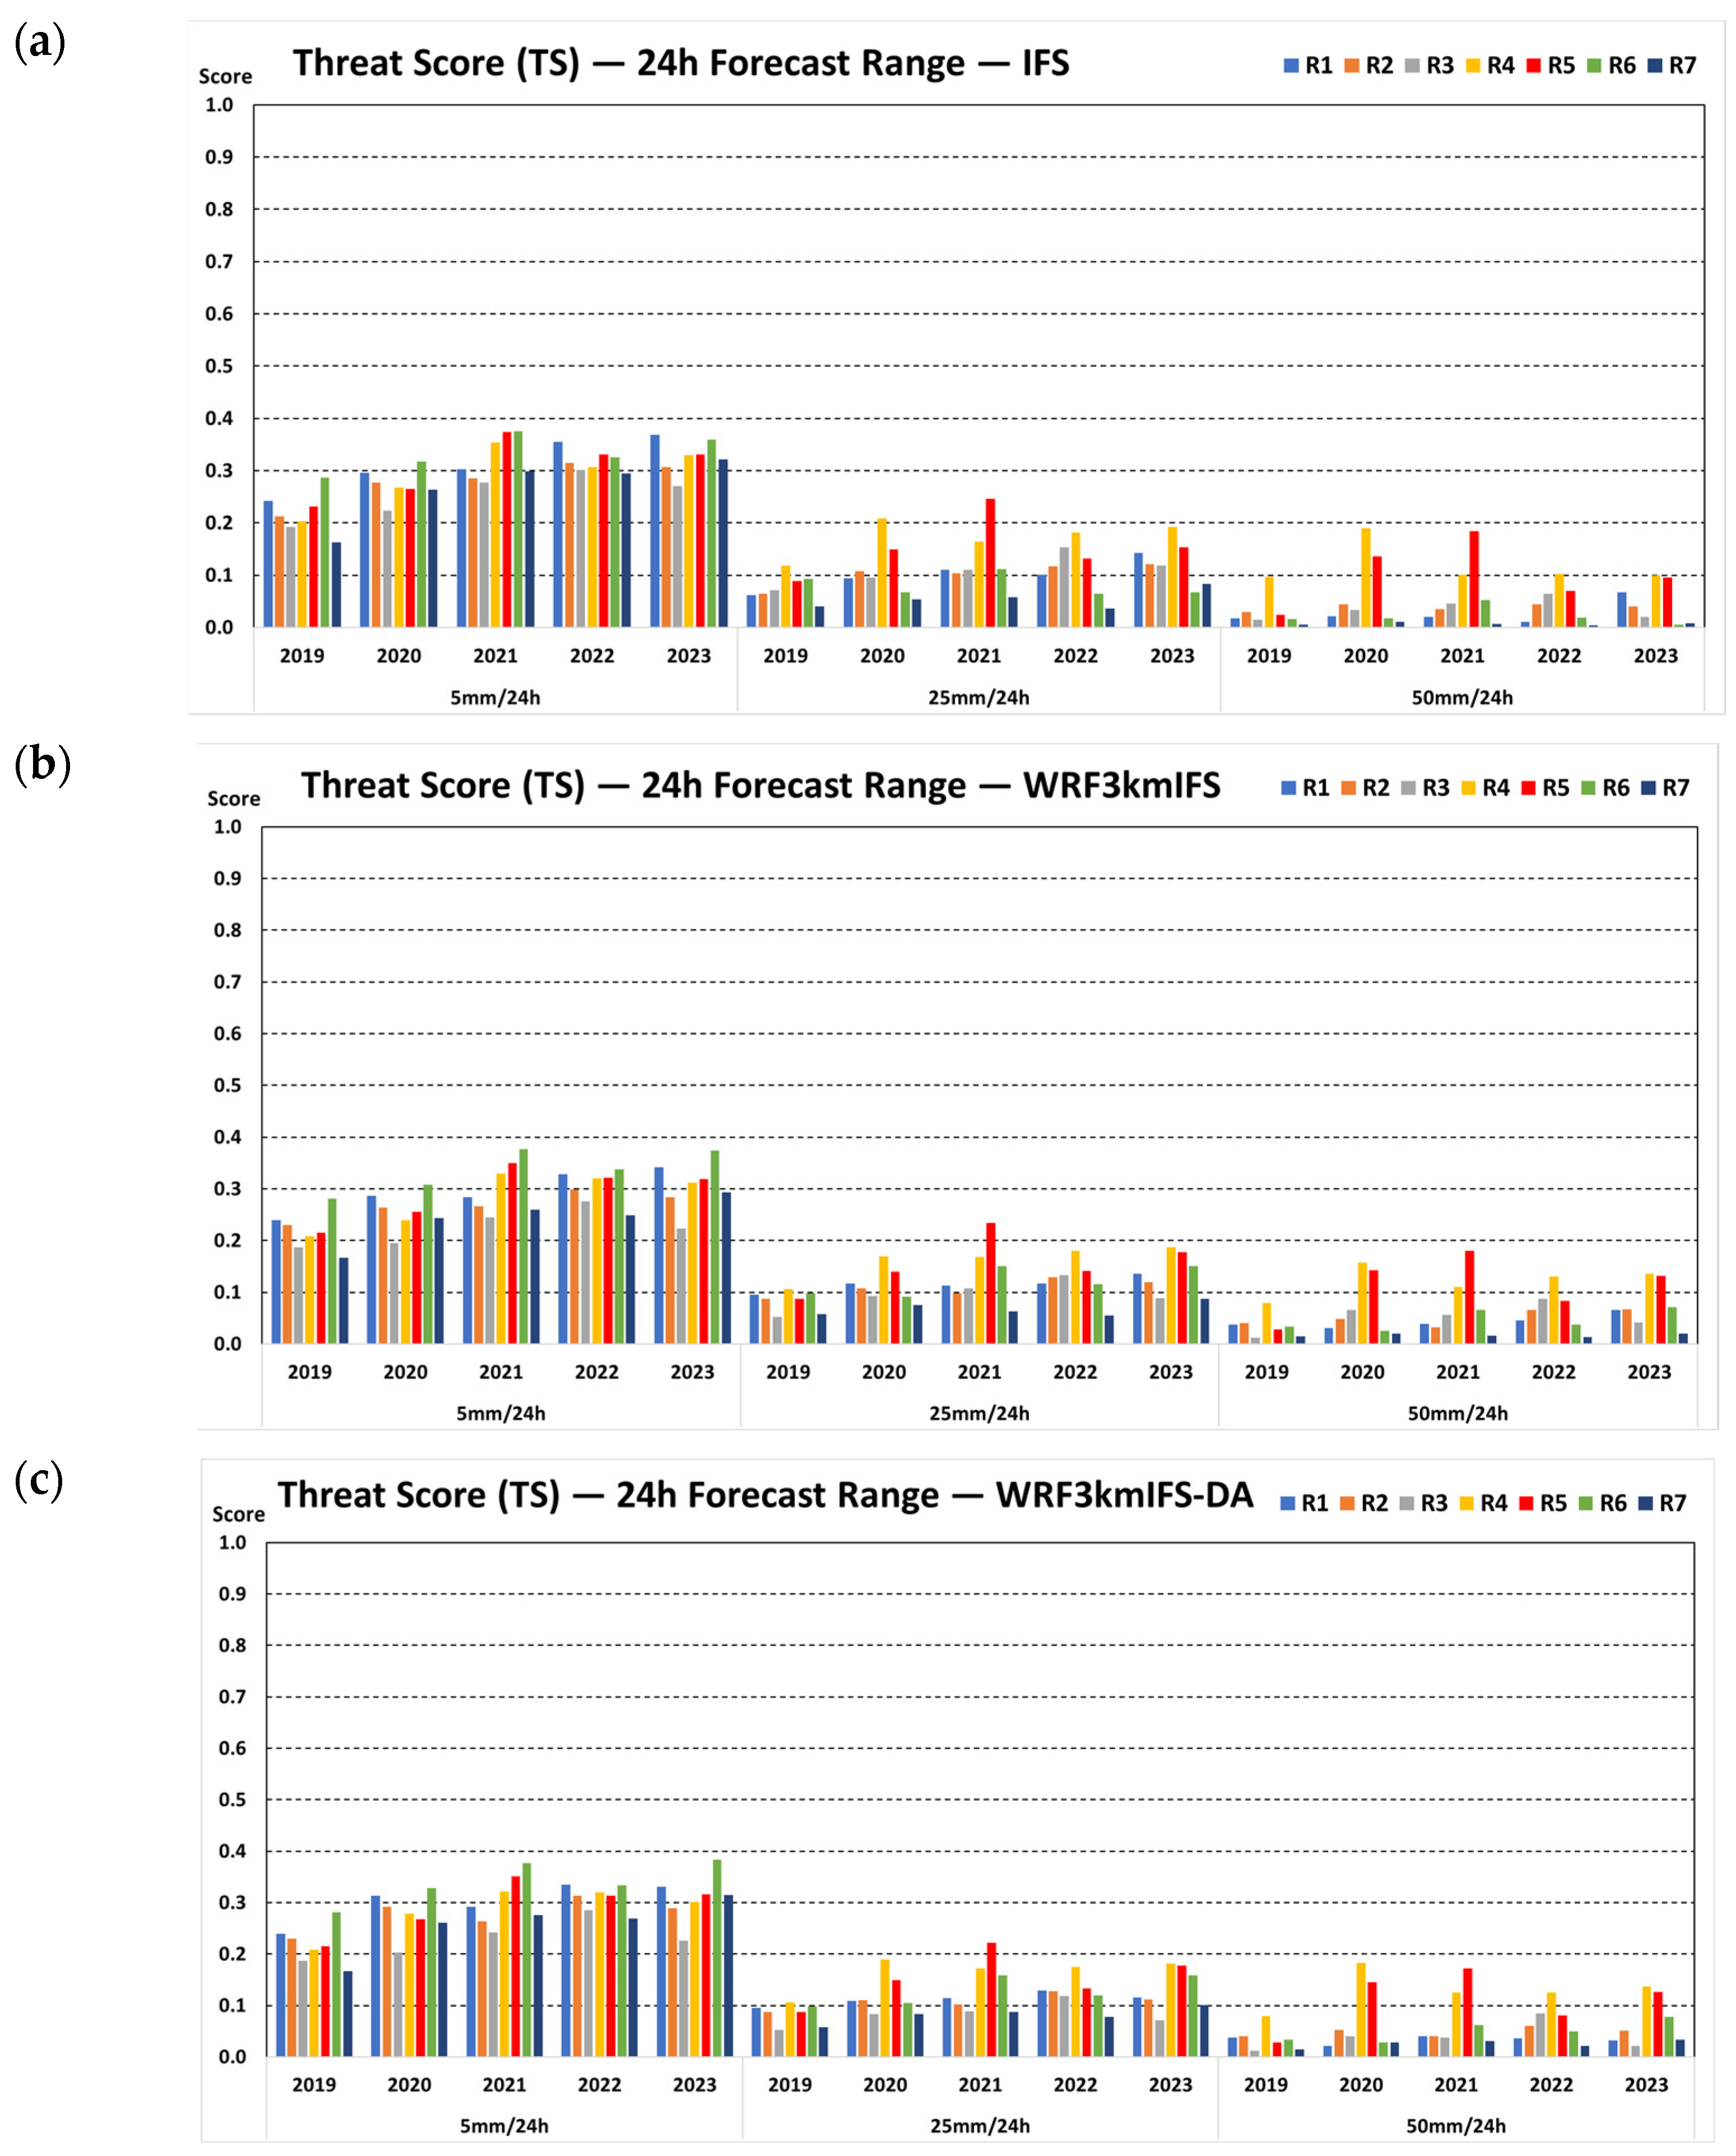
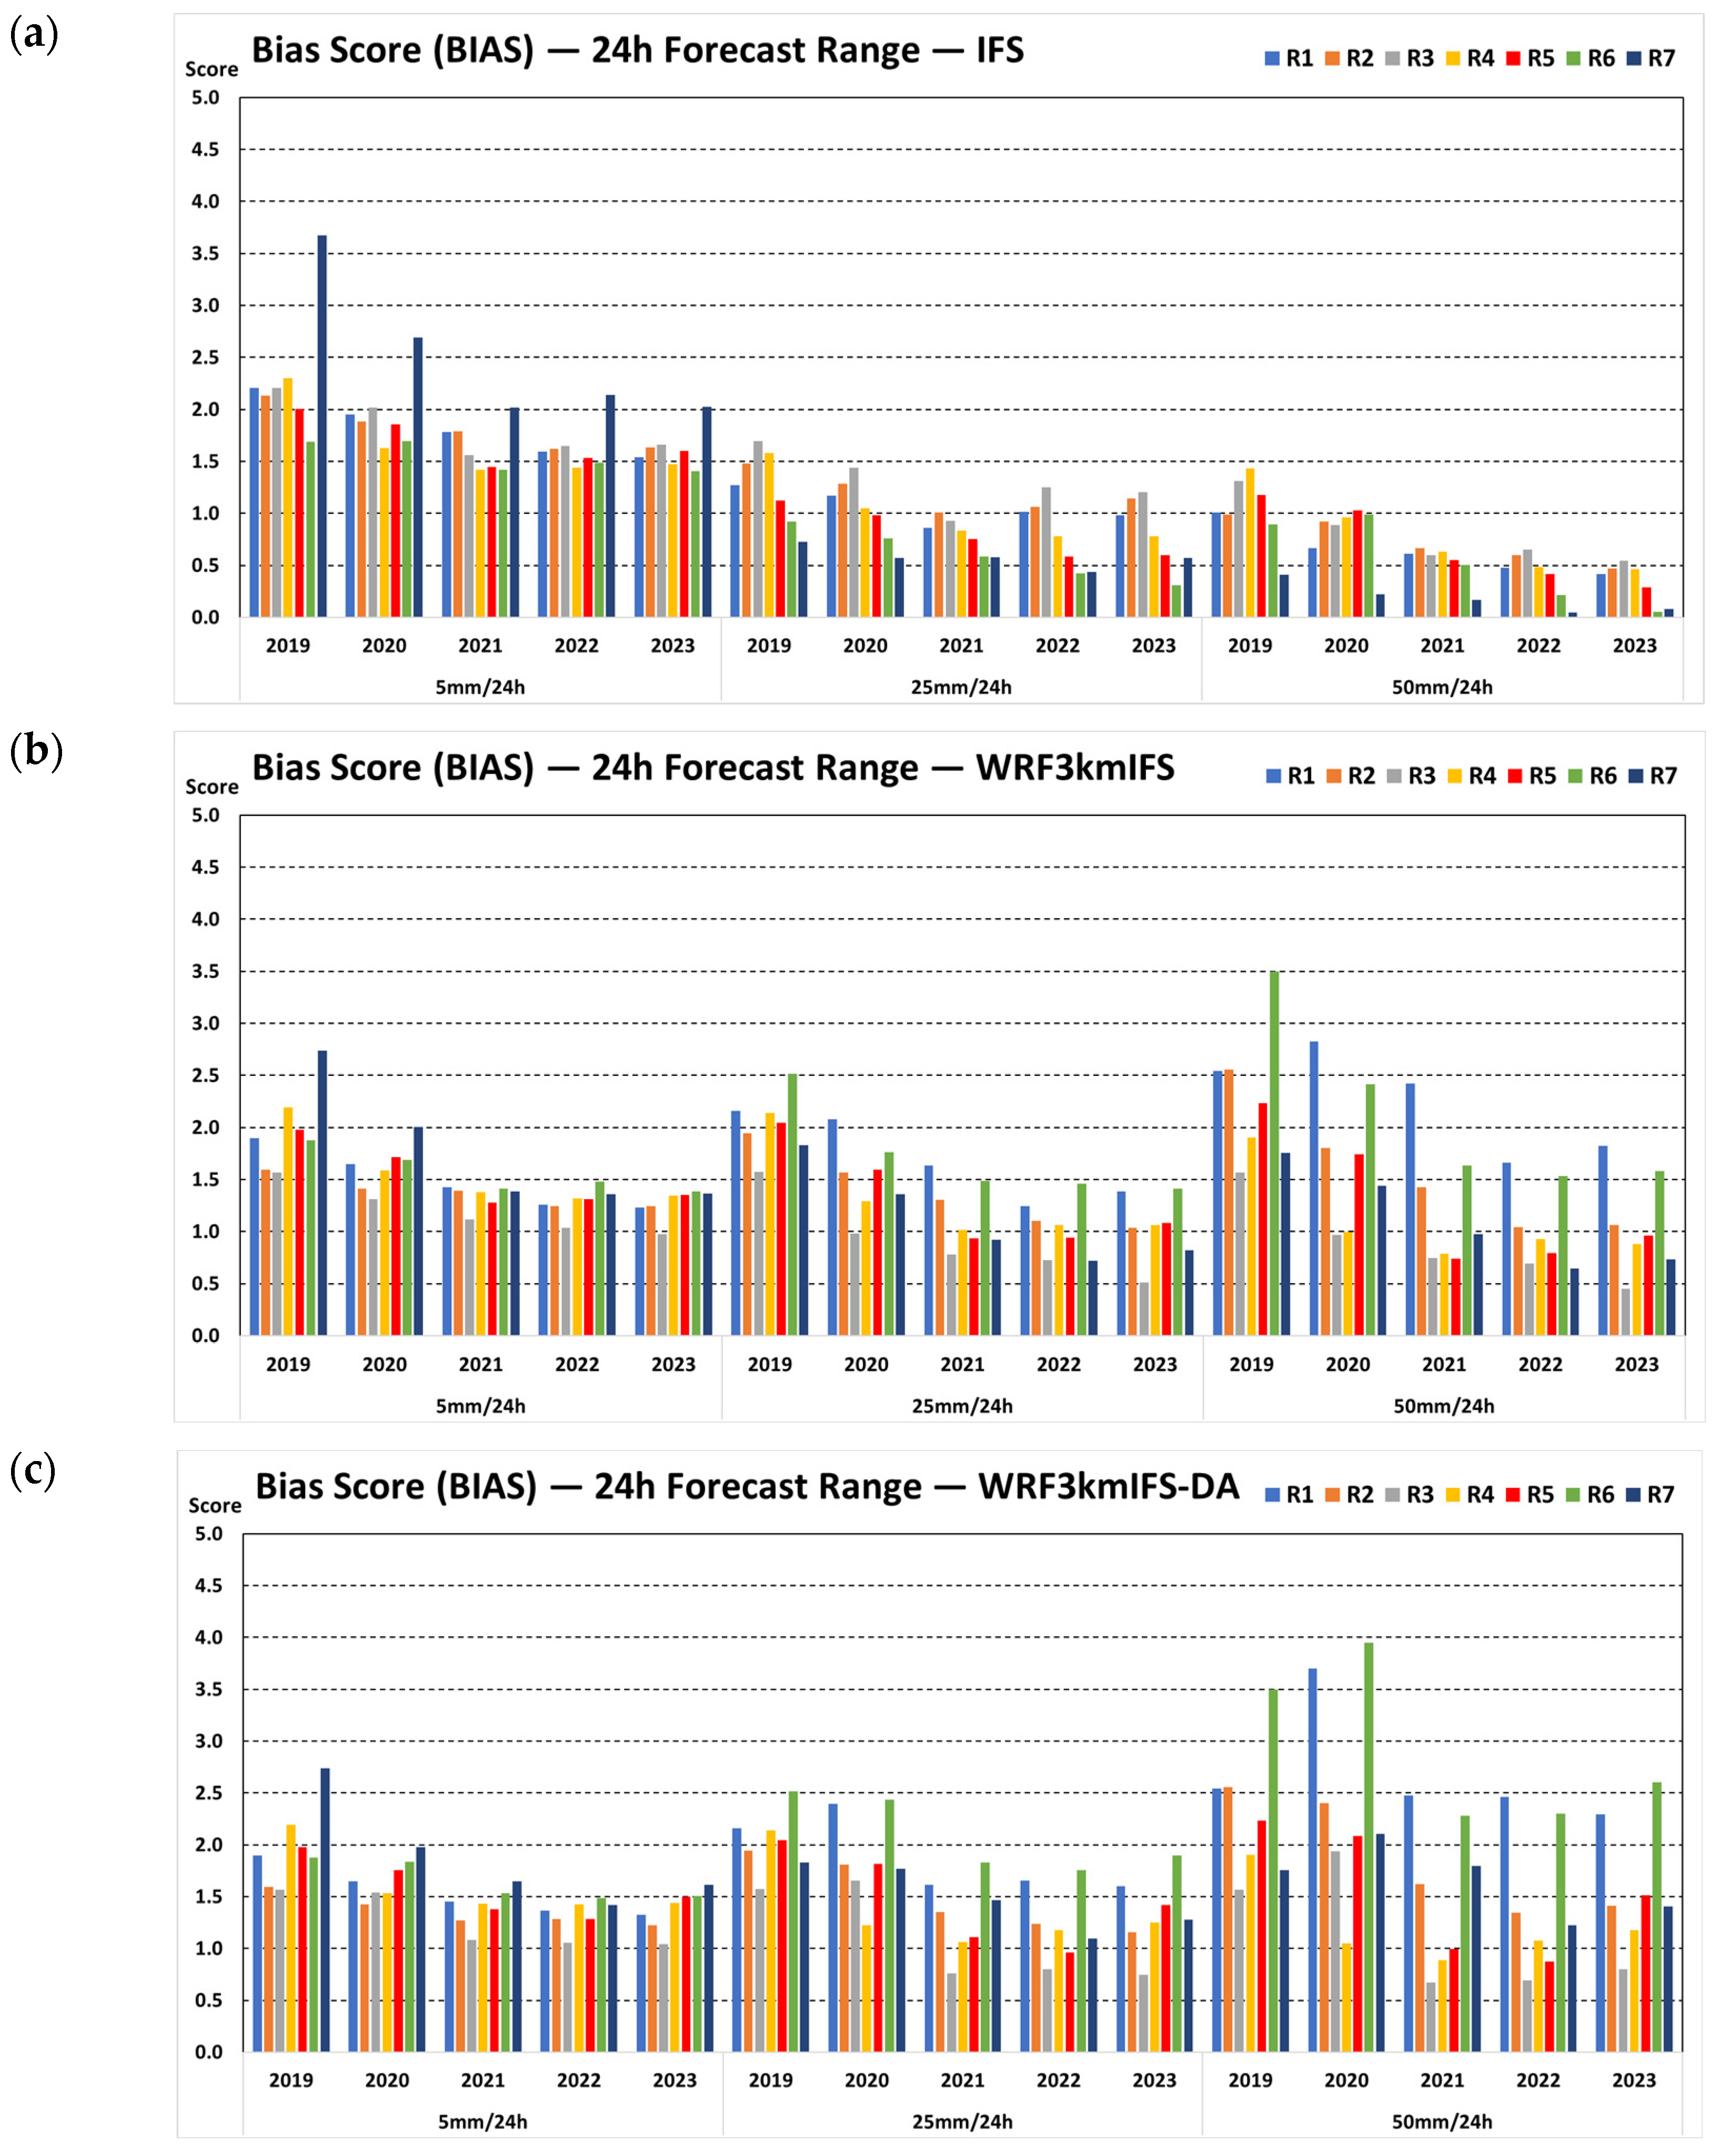
4.2. Yearly Performances

It can be seen that the Numerical Weather Prediction (NWP) improves every year through the number of observations updated for initial model fields and increased computing power from high-performing computing infrastructures. In particular, the European Centre for Medium-Range Weather Forecasts (ECMWF) always focuses on comprehensive improvements, from global frameworks (increasing resolution, increasing vertical levels, assimilation schemes with new types of observations introduced, or the ability to assimilate satellite radiance data in all conditions) to the modules that decide on local forecast phenomena, such as surface schemes for surface forecast variables and improvements in the parametrization of microphysical processes, to improve the quality of rainfall forecasts, especially for tropical regions like Vietnam [22].
Figure 5 shows the average TS scores for each year in each region for each model. It can be clearly seen that at a threshold of 5 mm/24 h, there is a trend of increasing IFS quality over most regions of Vietnam, from about 0.2 in 2019 to about 0.3 in recent years. This also leads to an increase in the quality of the dynamic downscaling product over the year. For higher rainfall thresholds (>25 mm/24 h), this improvement is not particularly clear, although there is still an improvement for some regions, such as R3, R4, and R5, in the years 2021–2023 compared to 2019–2020. For large rainfall thresholds such as 50 mm/24 h, there is almost no improvement.
Similar to the systematic error by the BIAS in Figure 6, the results also suggest systematic improvement from the IFS. However, although it decreased over the last 3 years, this trend is not as clear as the trend in detecting more rain locations, as shown through the TS scores in Figure 5. Clearly, the improvement of the IFS in the overestimation of forecasting skill (BIAS > 1) at low rainfall thresholds and underestimation at high thresholds is still due to the existence of the ECMWF model, which is highly significant in daily forecasting applications.

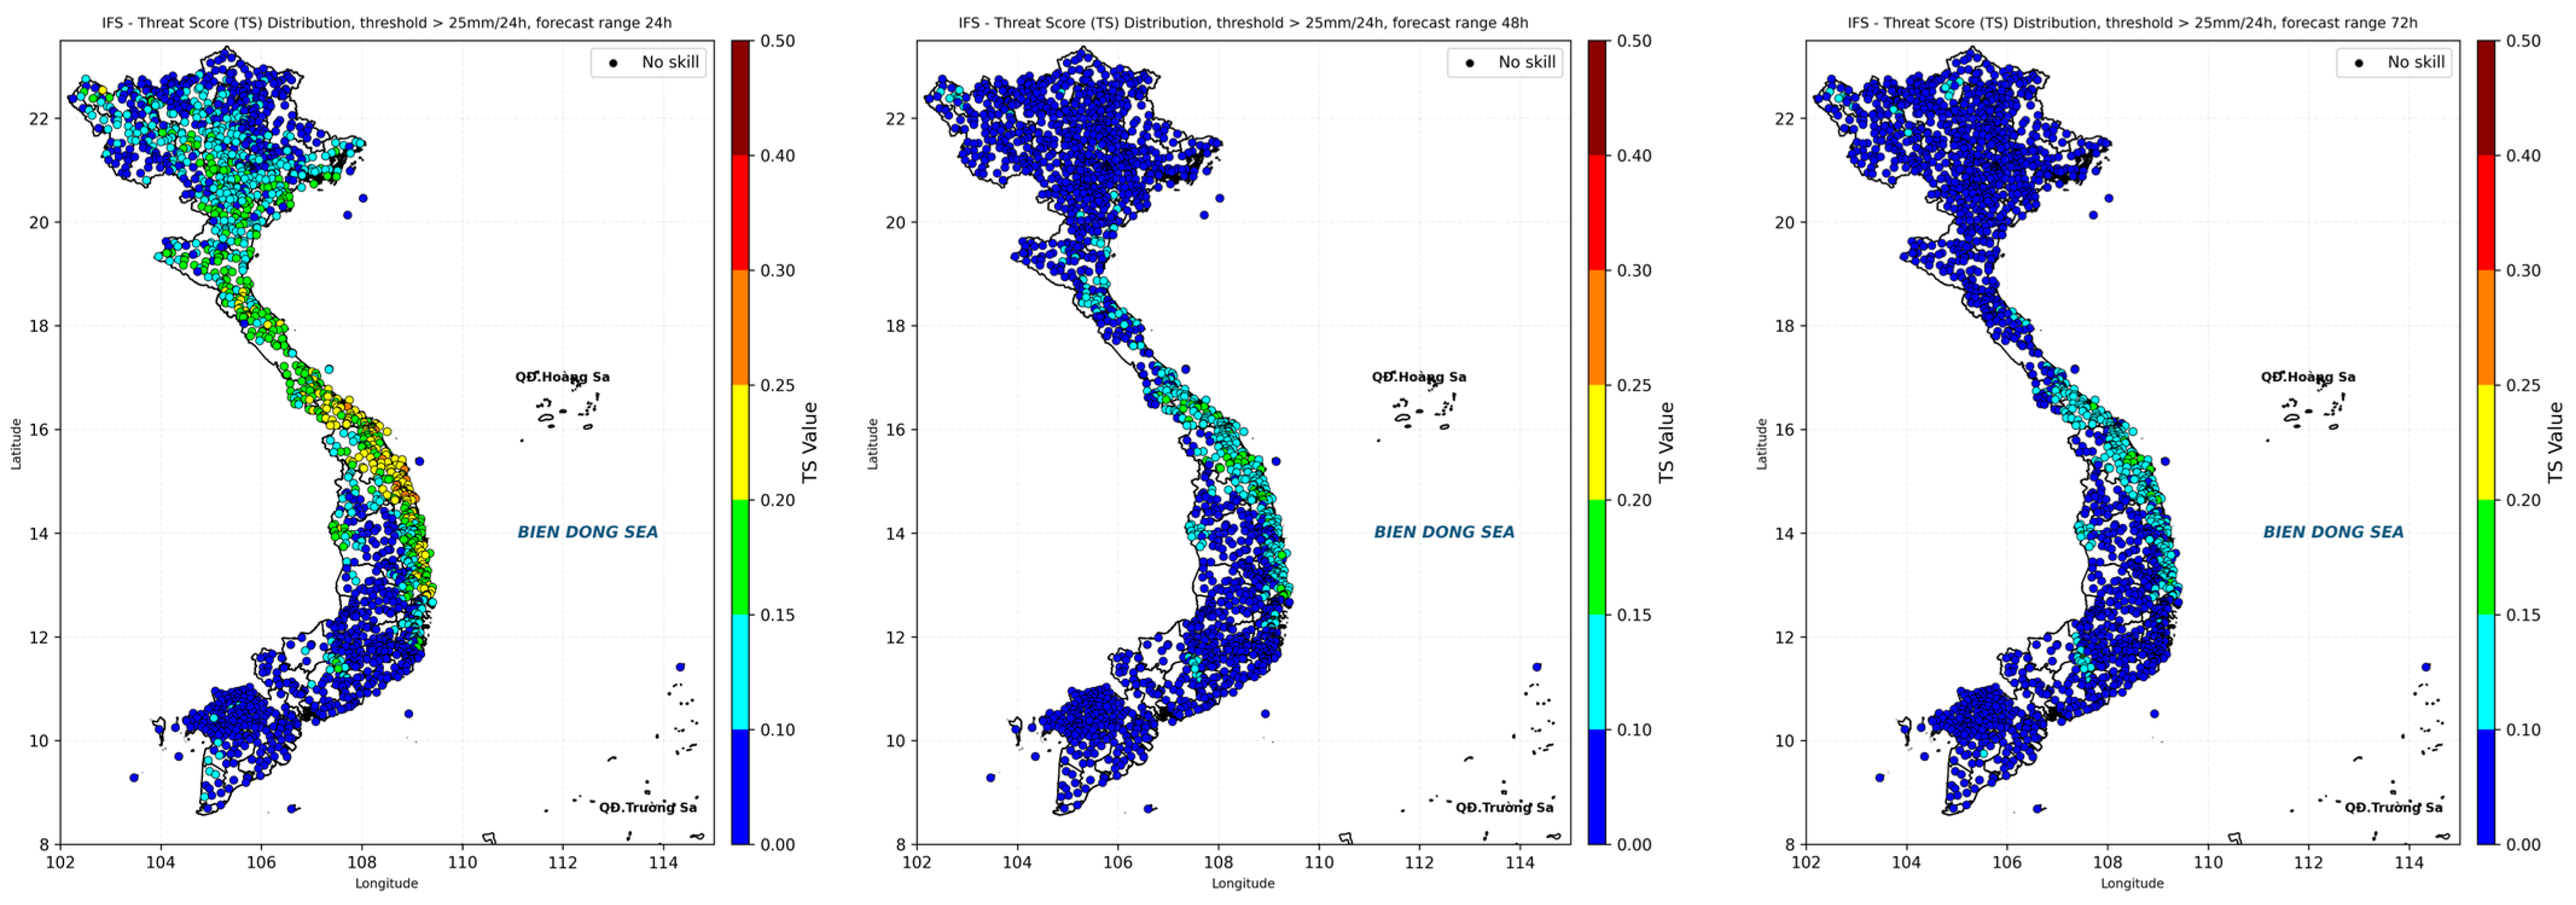
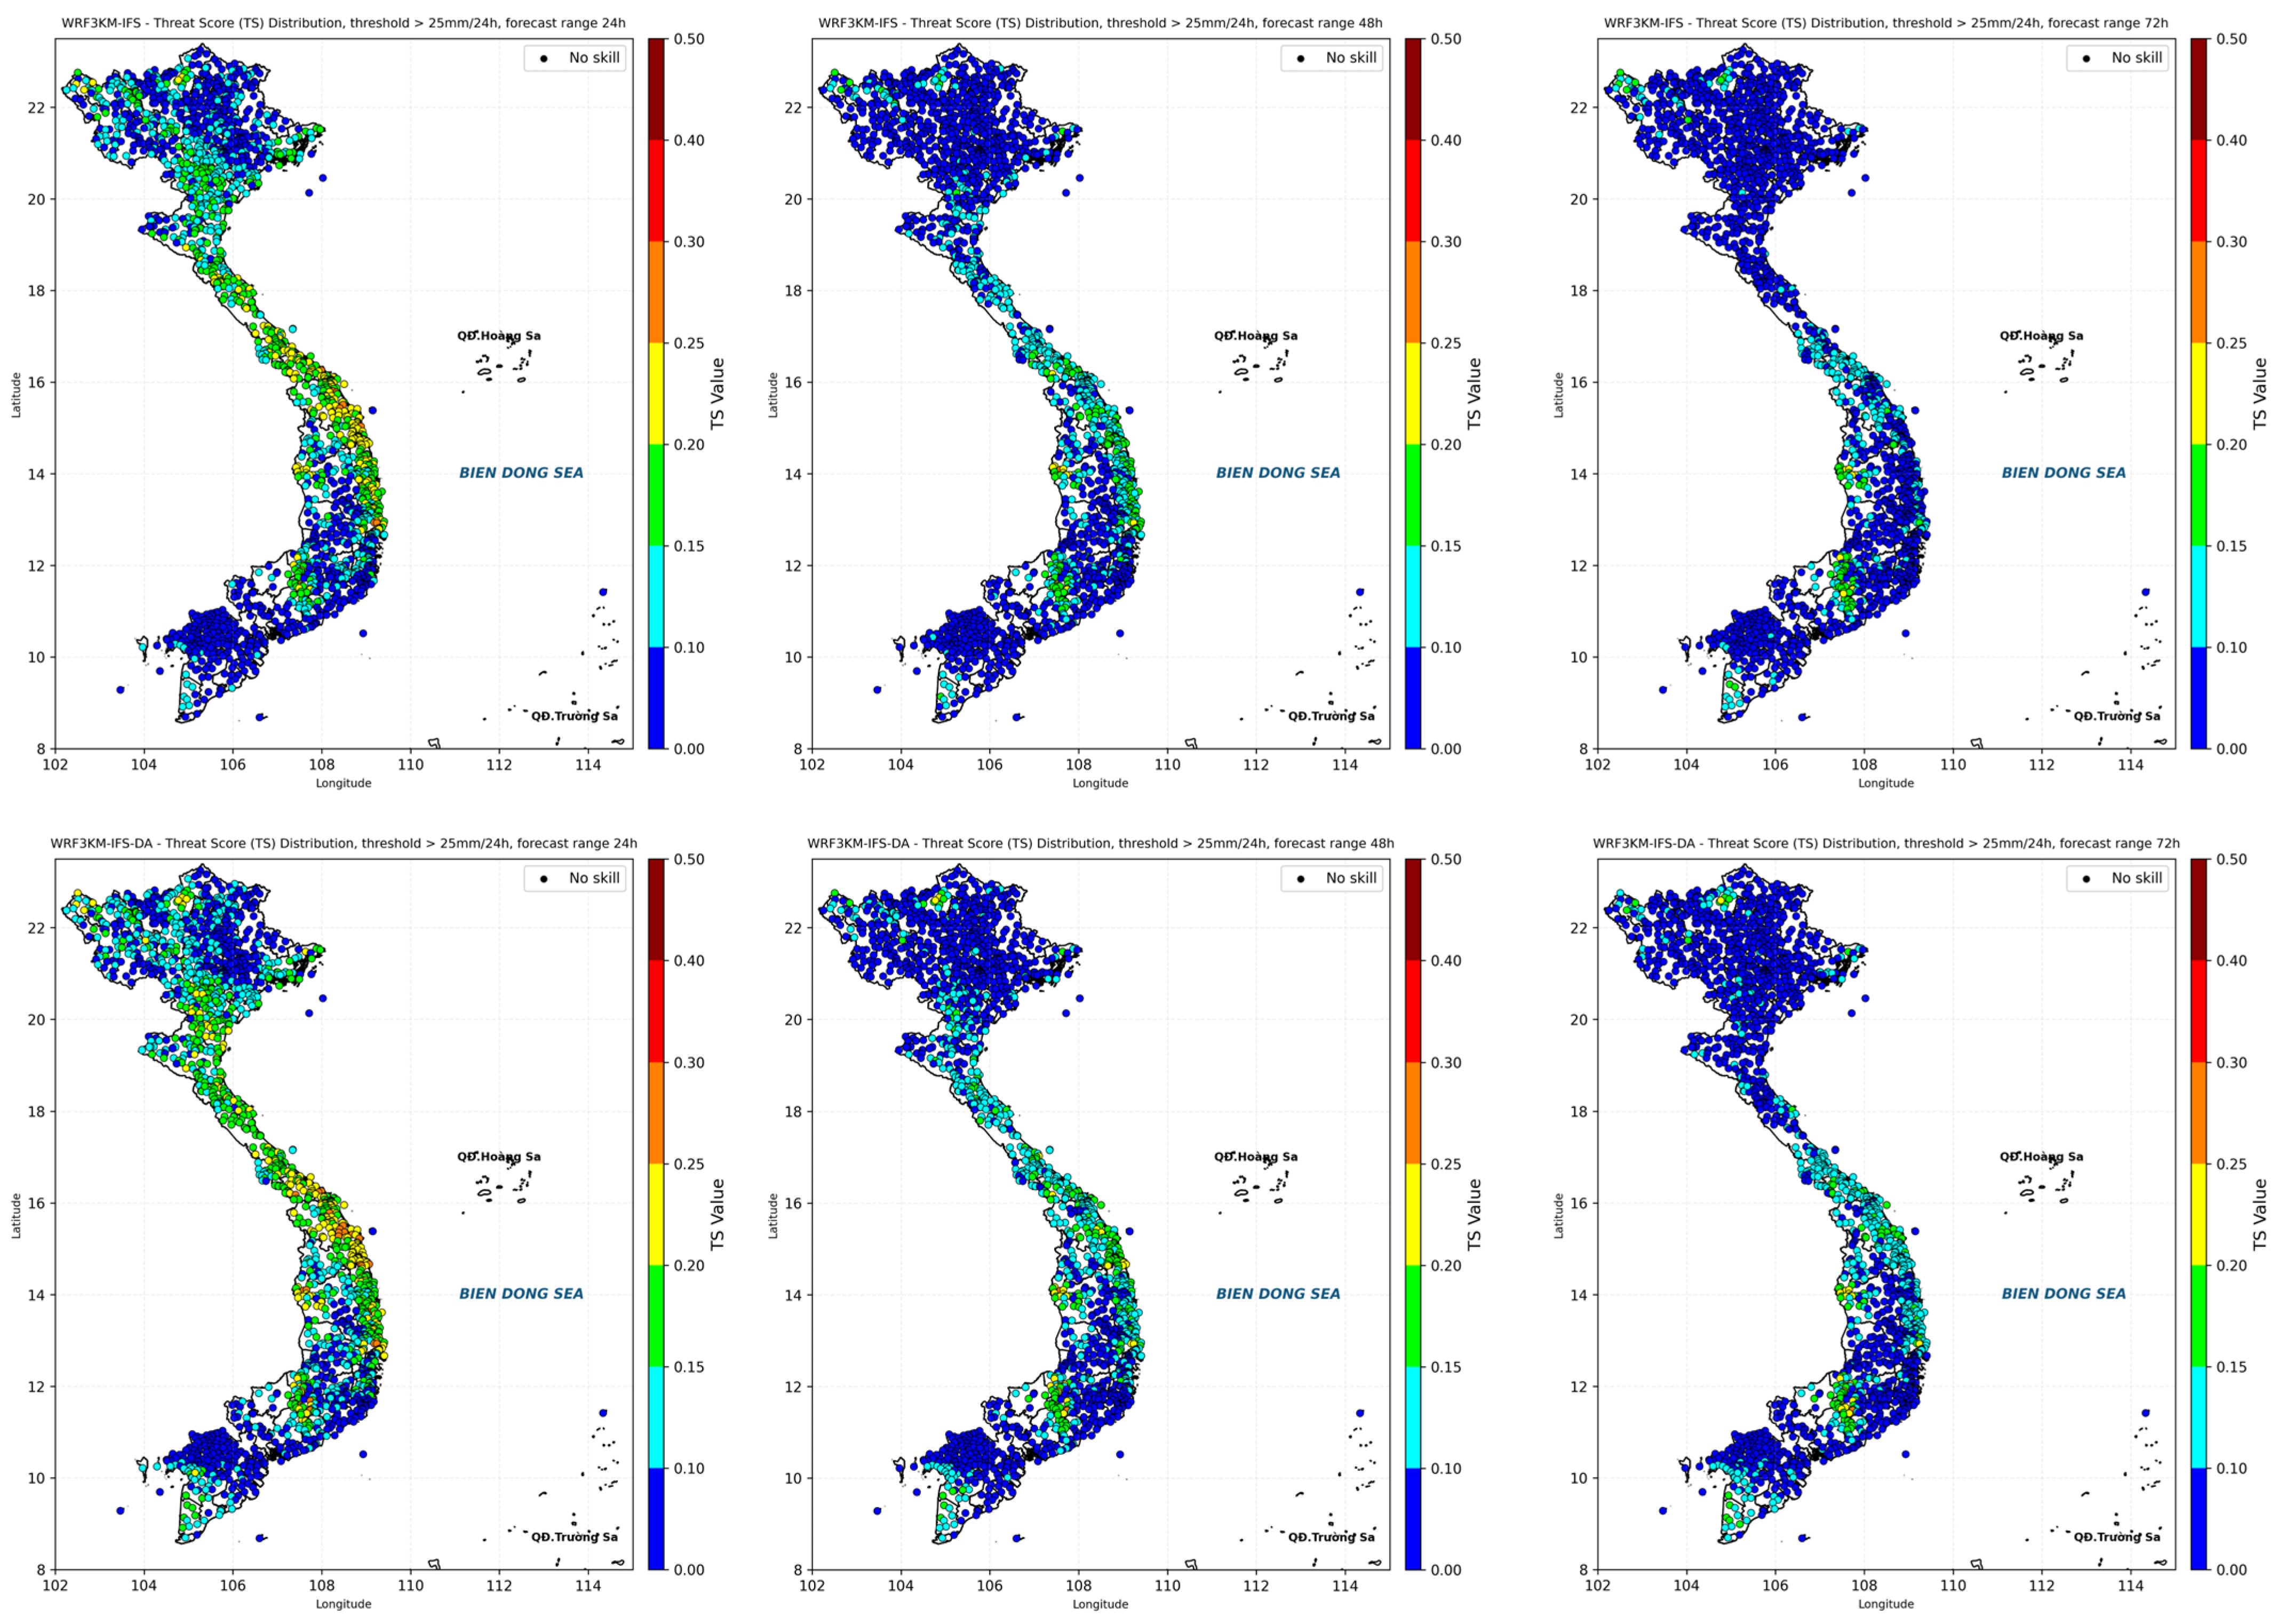
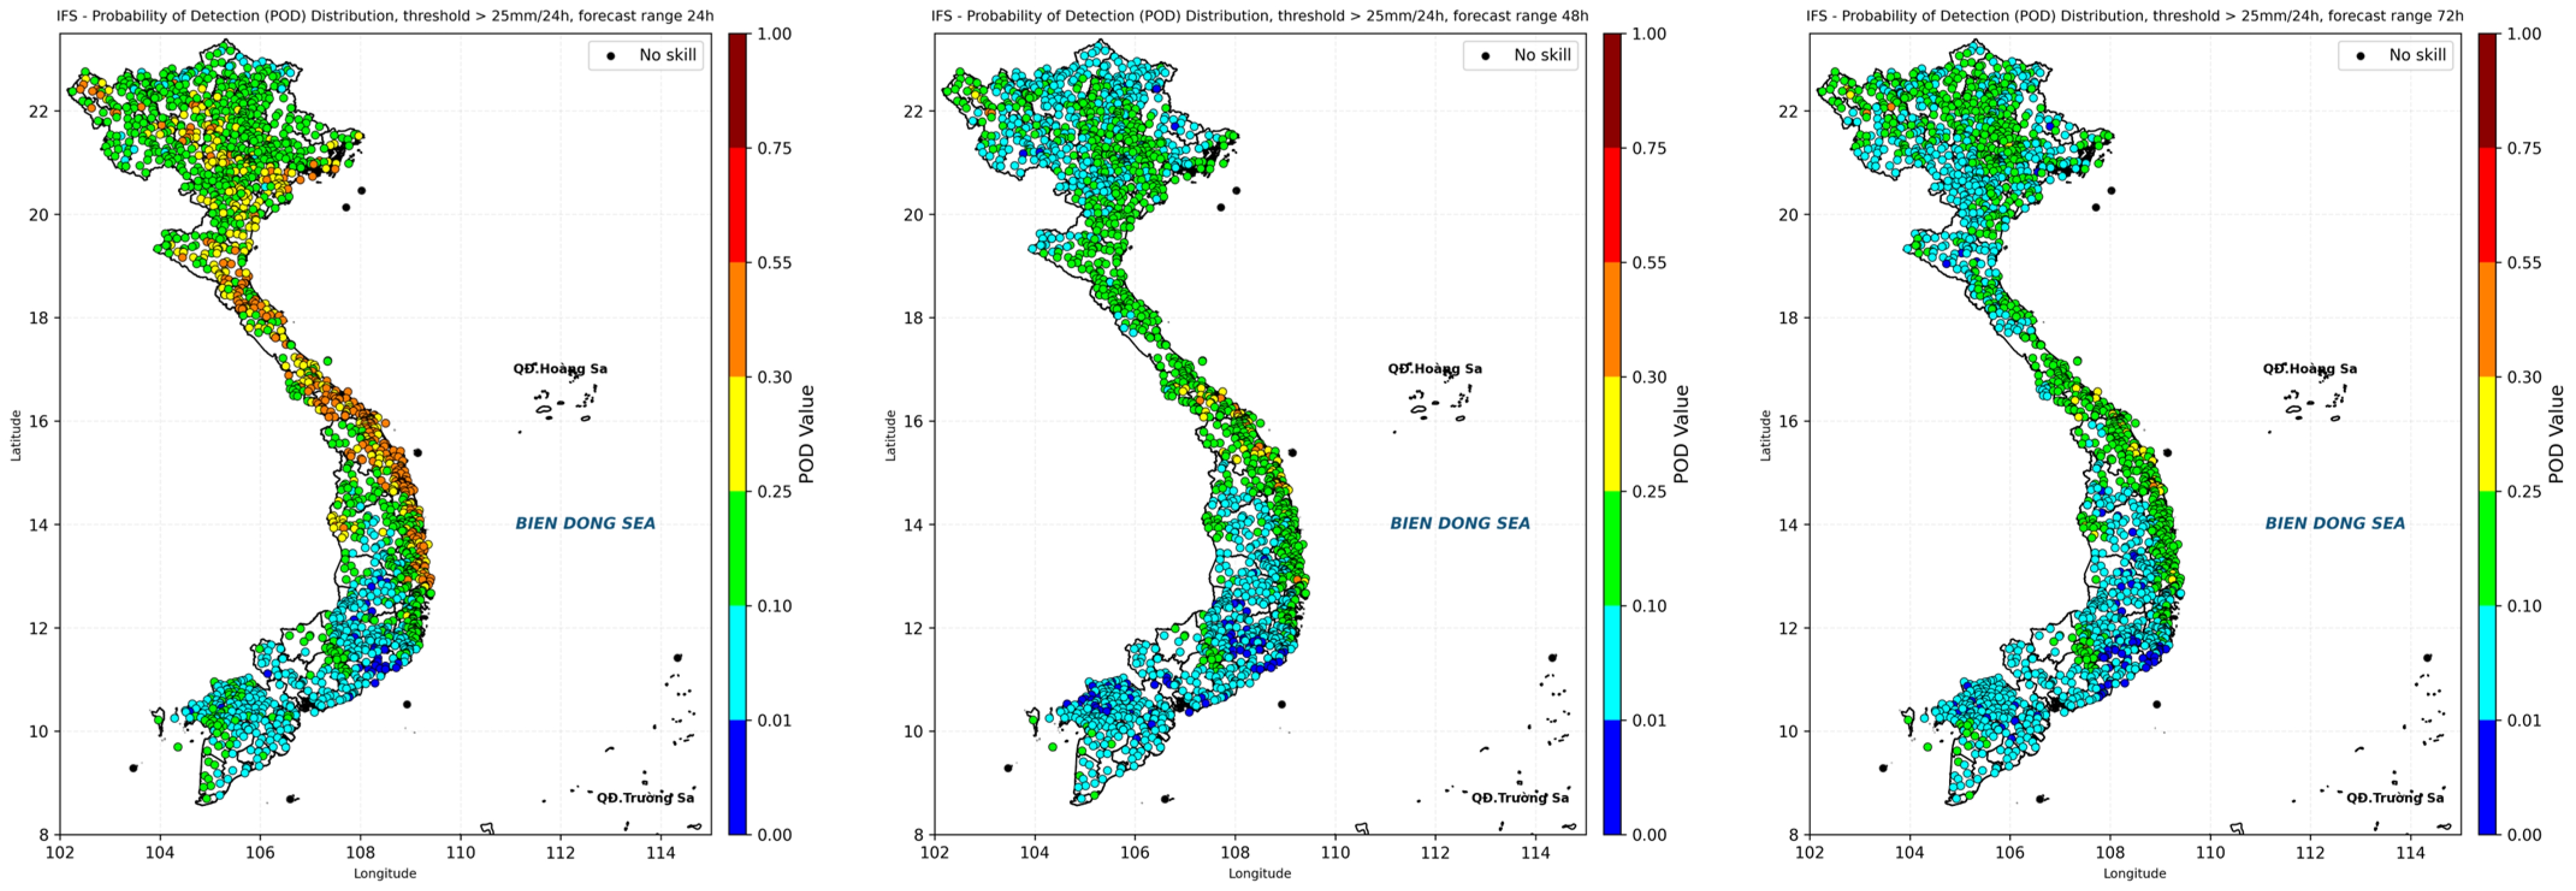
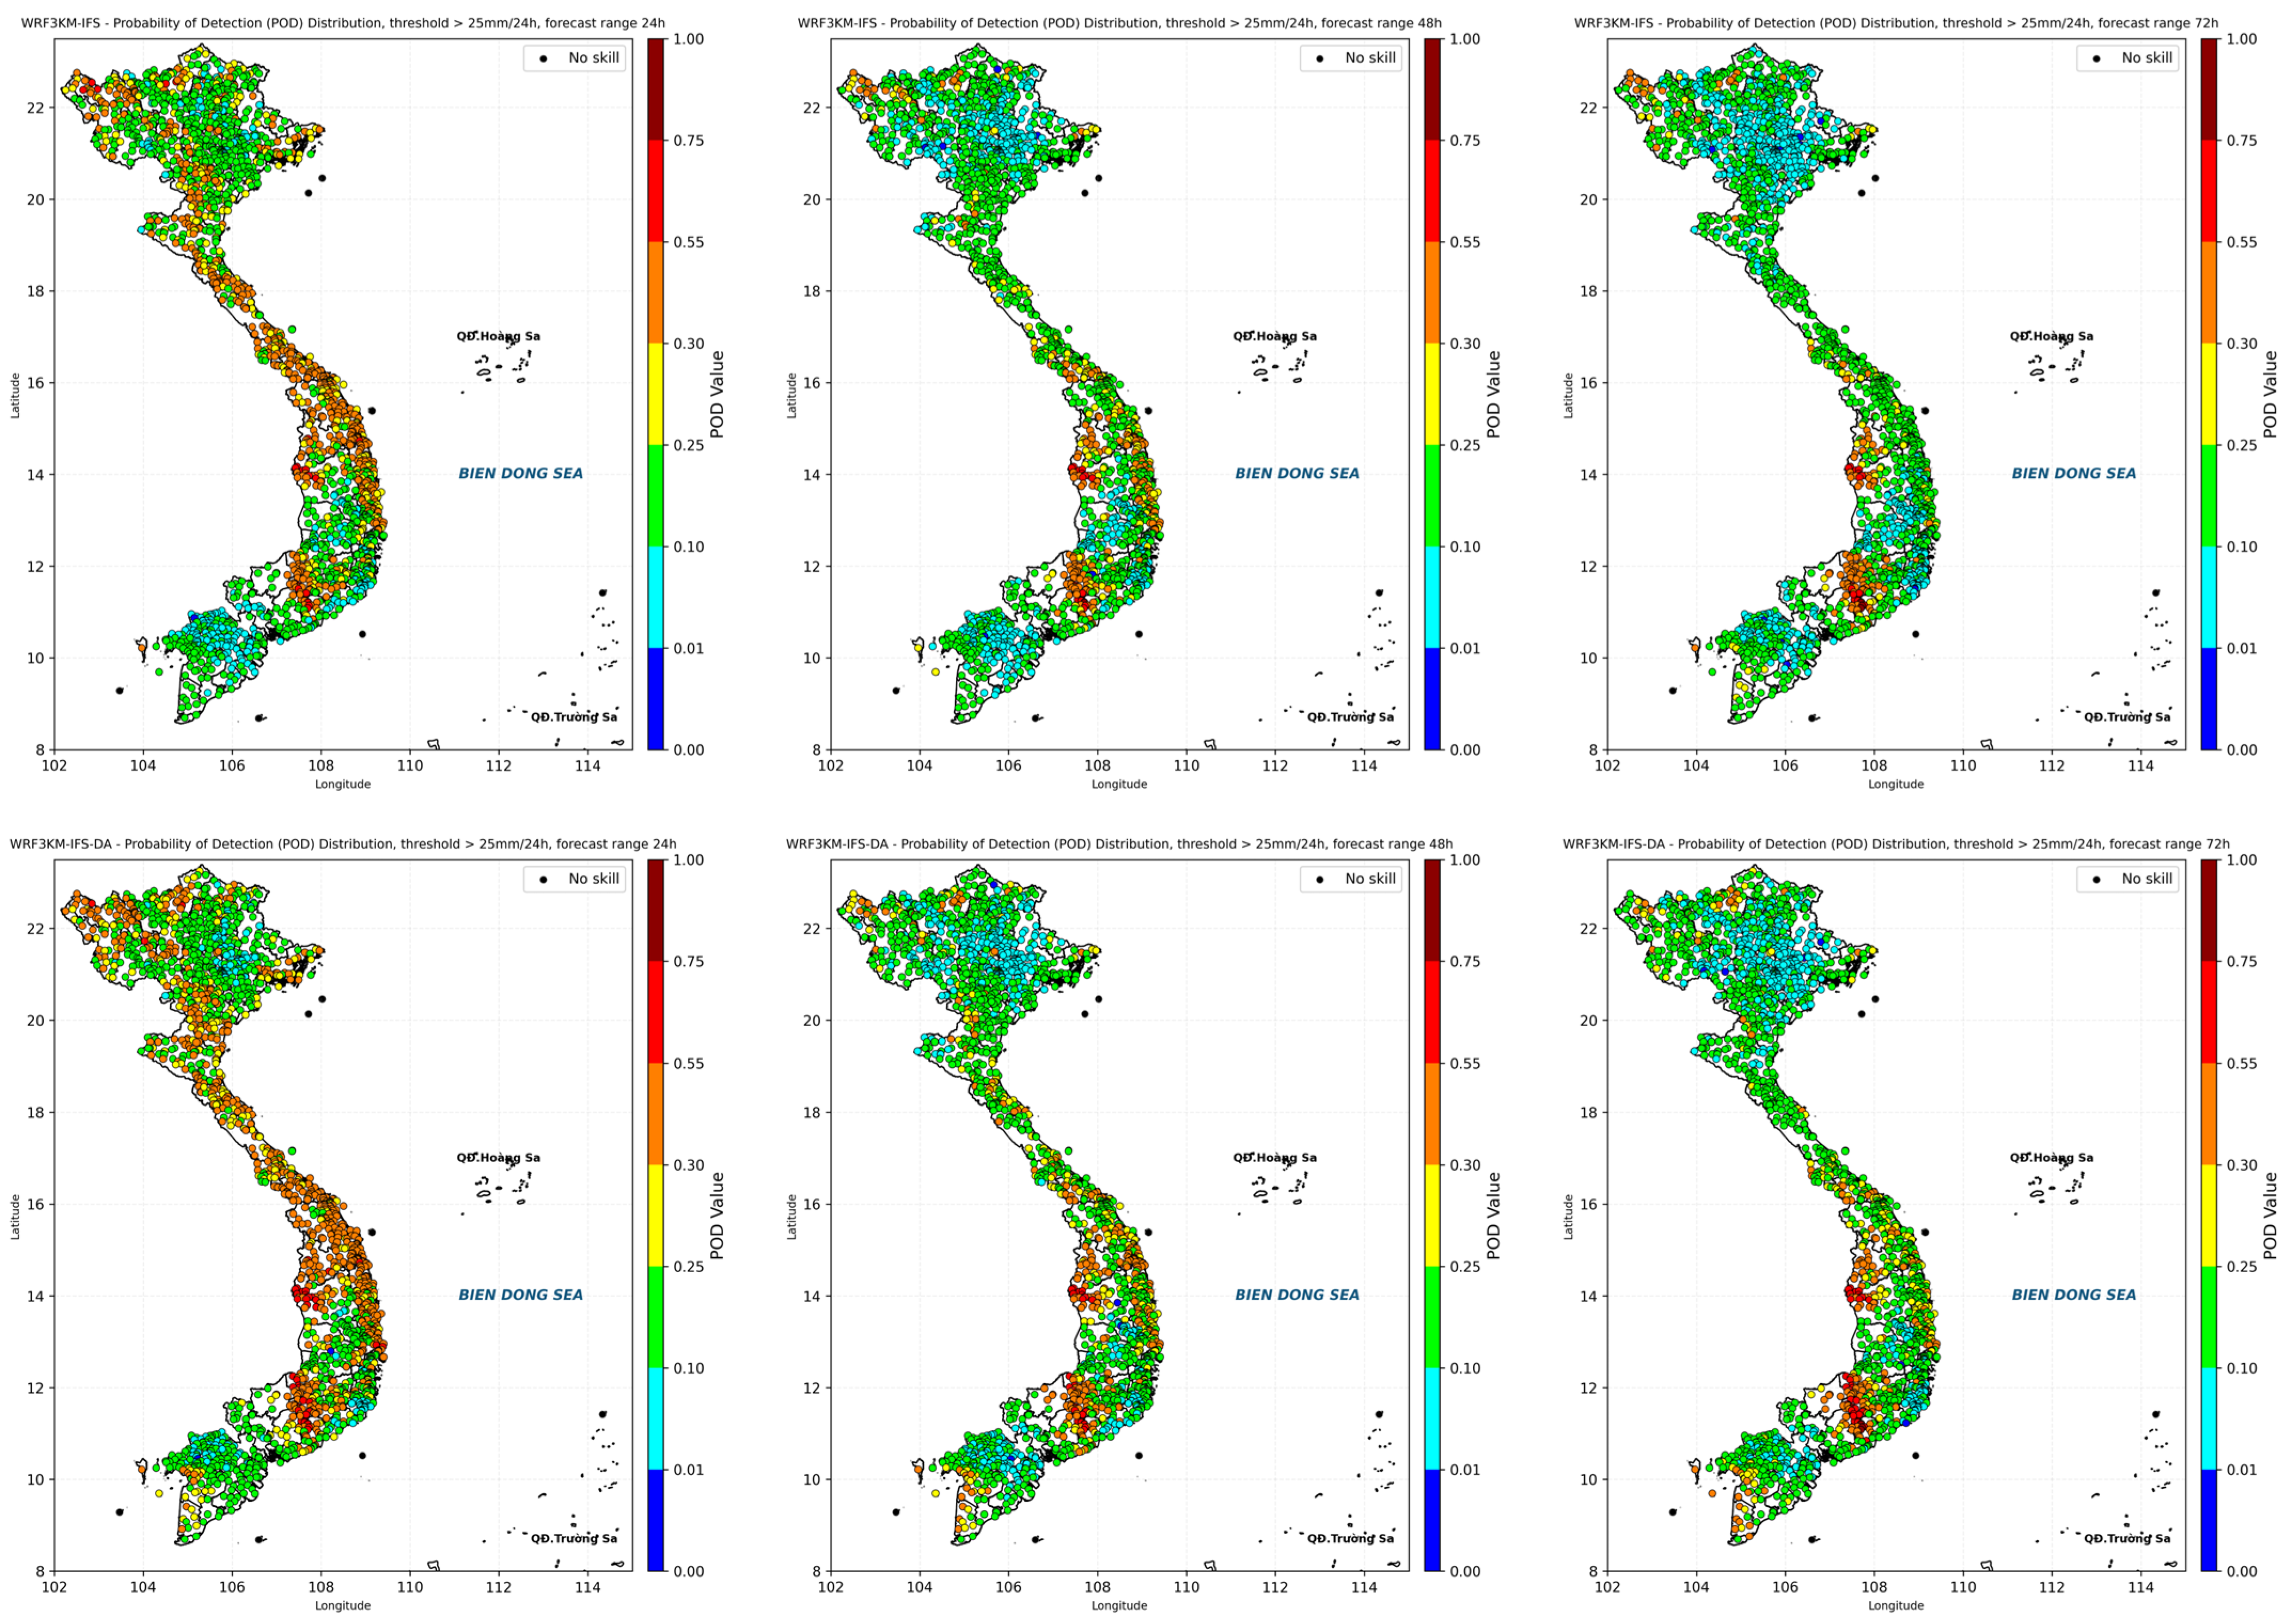
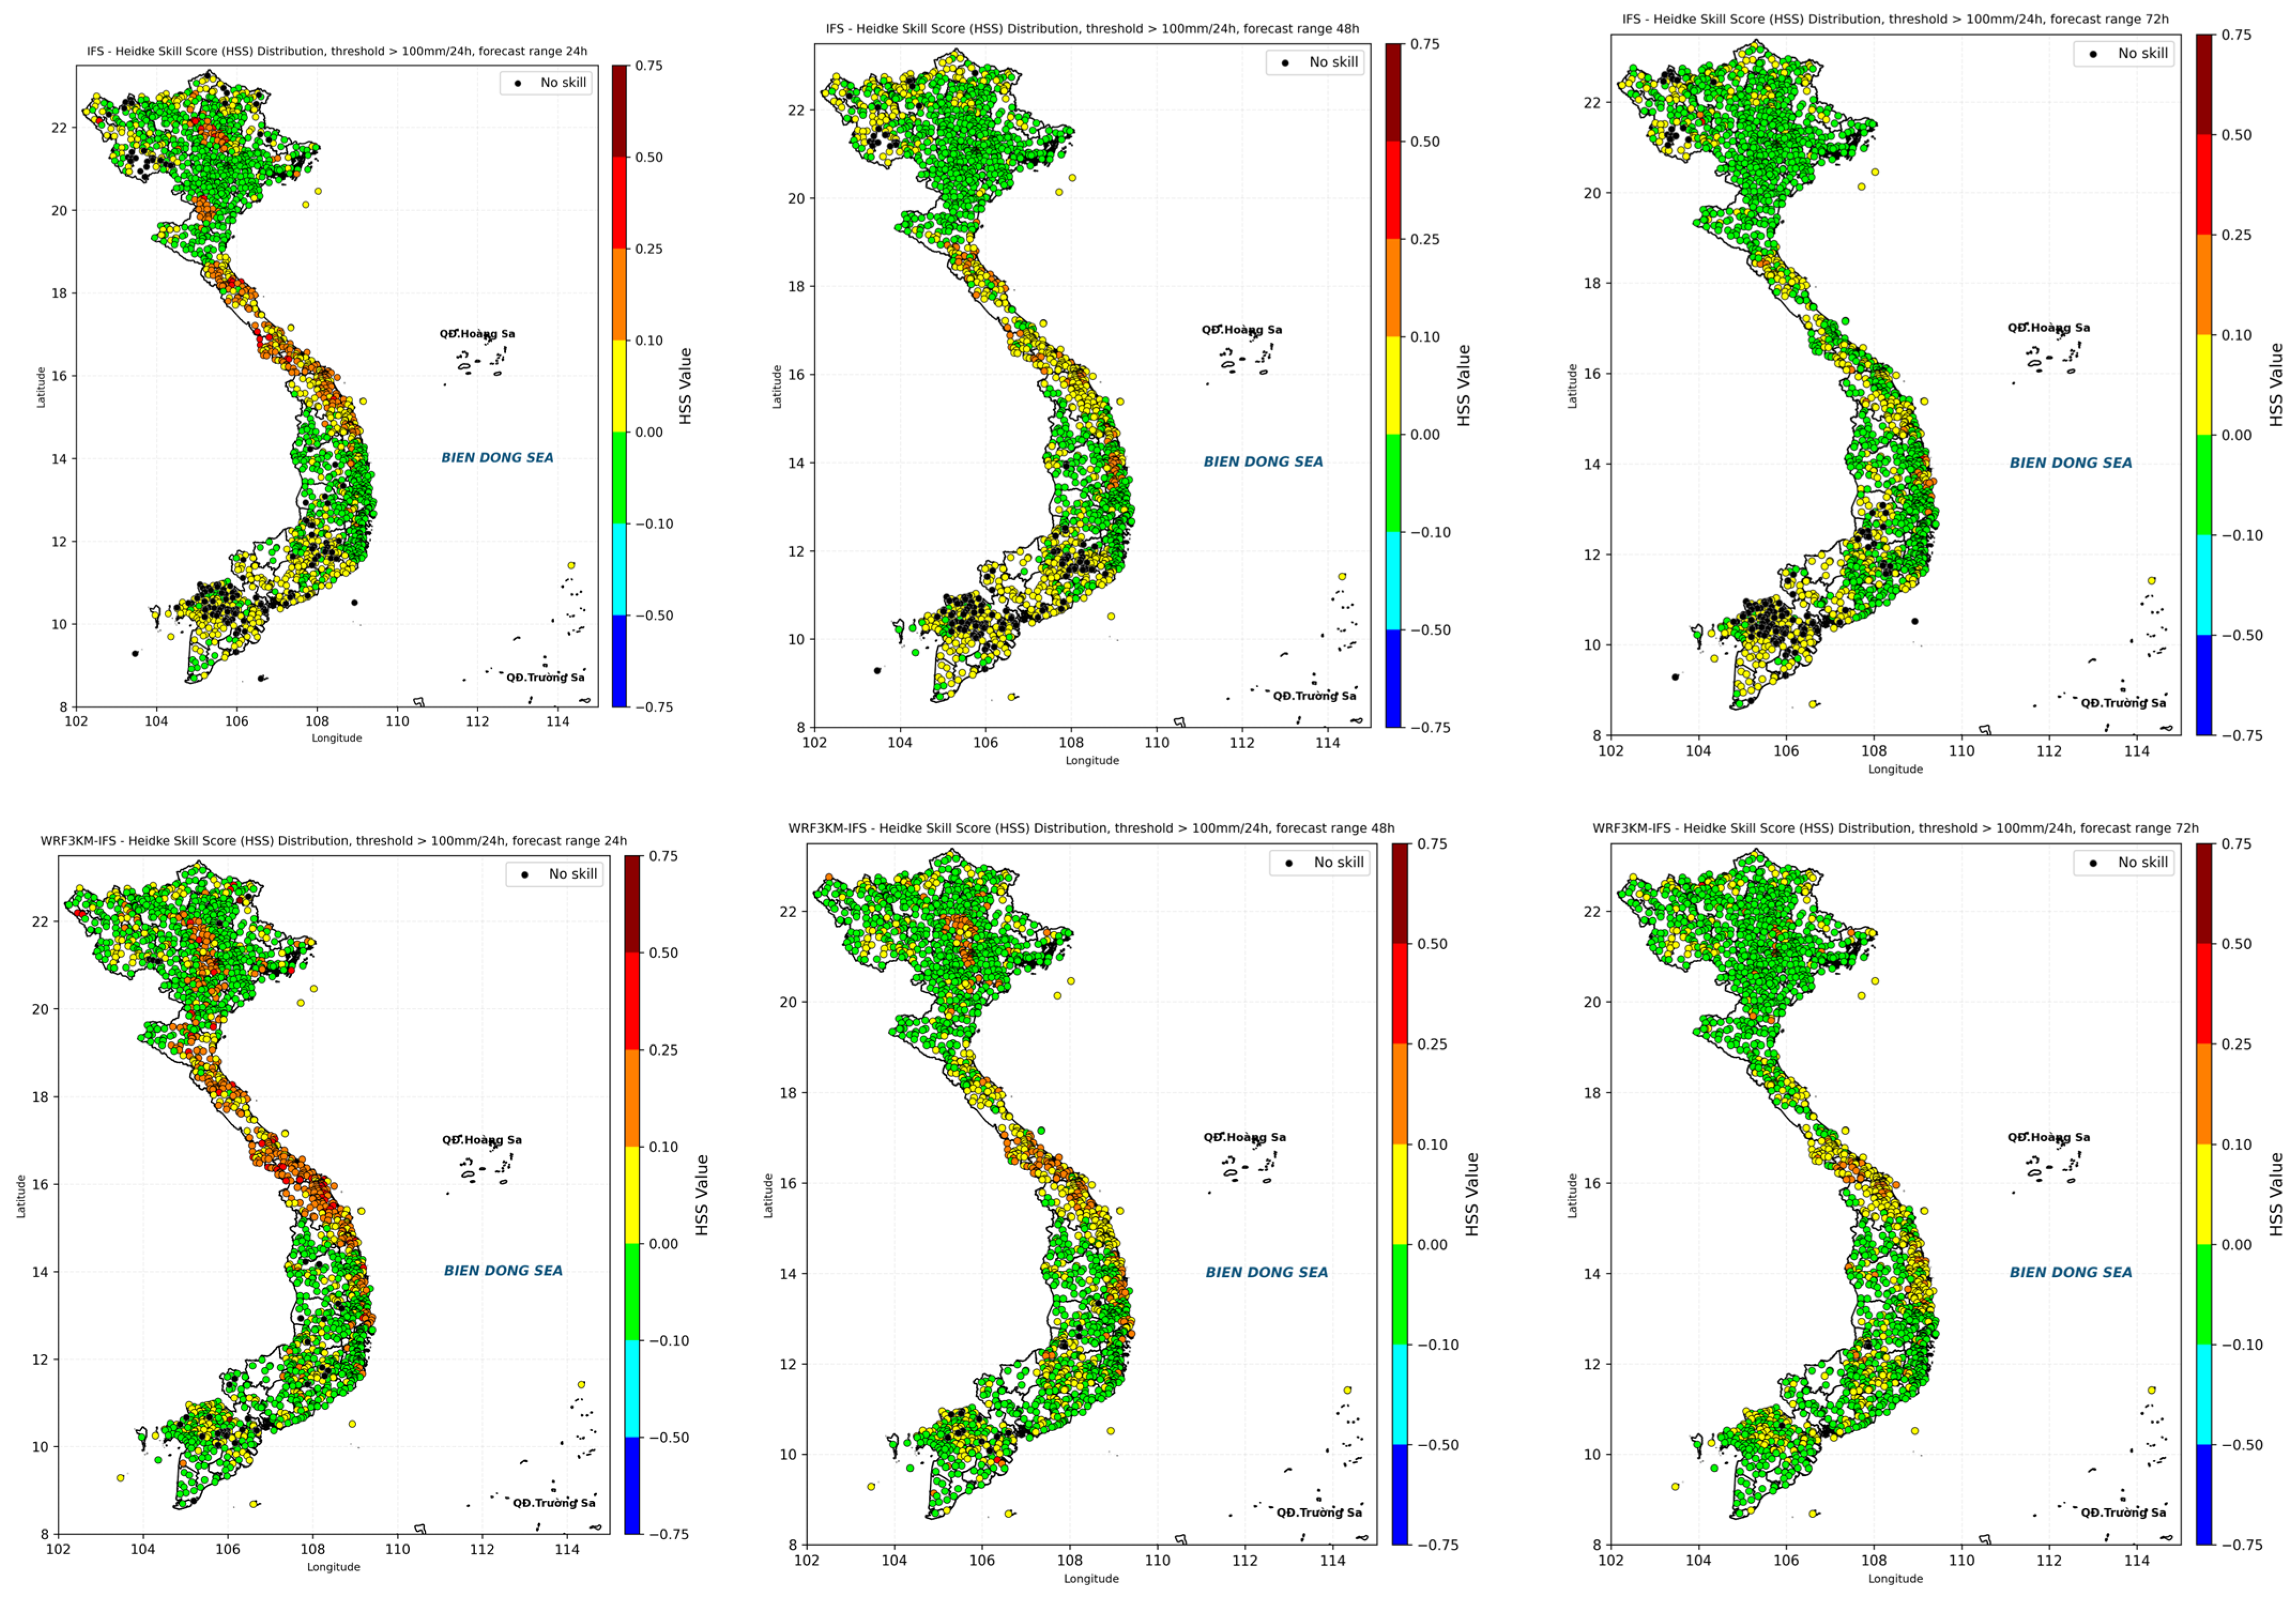
4.3. Spatial Distributions for Skill Scores of Intense Rain Events

There are several ways to assess spatial forecast skills, such as using the fractions skill score [23] or the contiguous rain area (CRA) method [24]. However, looking specifically at the distribution of skill indices can also provide clarity on the specific skill of the model for each region to given stations [25]. The detailing of spatially distributed skill scores also allows the forecaster to identify local characteristics of the skill of each model, for example, the systematic error for a specific station related to the interpolation procedures (e.g., caused by station heights or land–sea mask data).
For intense rainfall, Figure 7 and Figure 8 illustrate the threshold of 25 mm and for TS and POD scores, respectively. The high-value distributions of TS scores are concentrated in the R4 and R5 regions related to coastal areas, and the rainfall in these regions is closely related to tropical disturbances such as the Intertropical Convergence Zone (ITCZ) and tropical cyclones. As the forecast range increases, the skill of the IFS decreases very quickly with the rainfall threshold >25 mm/24 h. In regions with complex terrain such as R6 or R1, which are both associated with highly localized rainfall (terrain), higher-resolution forecasts from WRF3kmIFS and WRF3kmIFS-DA showed a clear localization ability and increased the skill in all three forecast ranges compared to the IFS (as mentioned in the example of forecast in Figure 2).
In the regional average charts, it can be seen that the POD of the IFS is ~0.2–0.25, with the WRF3kmIFS and WRF3kmIFS-DA models showing a slight improvement to 0.3 (clearly concentrated in the R4, R5, and R6 regions). The POD distribution maps show a clear improvement in the ability to detect heavy rain in the WRF3kmIFS and WRF3kmIFS-DA forecasts (0.3–0.4). In particular, the increase in the number of stations with PODs reaching 0.5–0.7 in the R6 region is related to the highland region, where the IFS is almost always below 0.25. The improvement in WRF3kmIFS and WRF3kmIFS-DA detection rates is also maintained at the 48 h and 72 h forecast ranges.

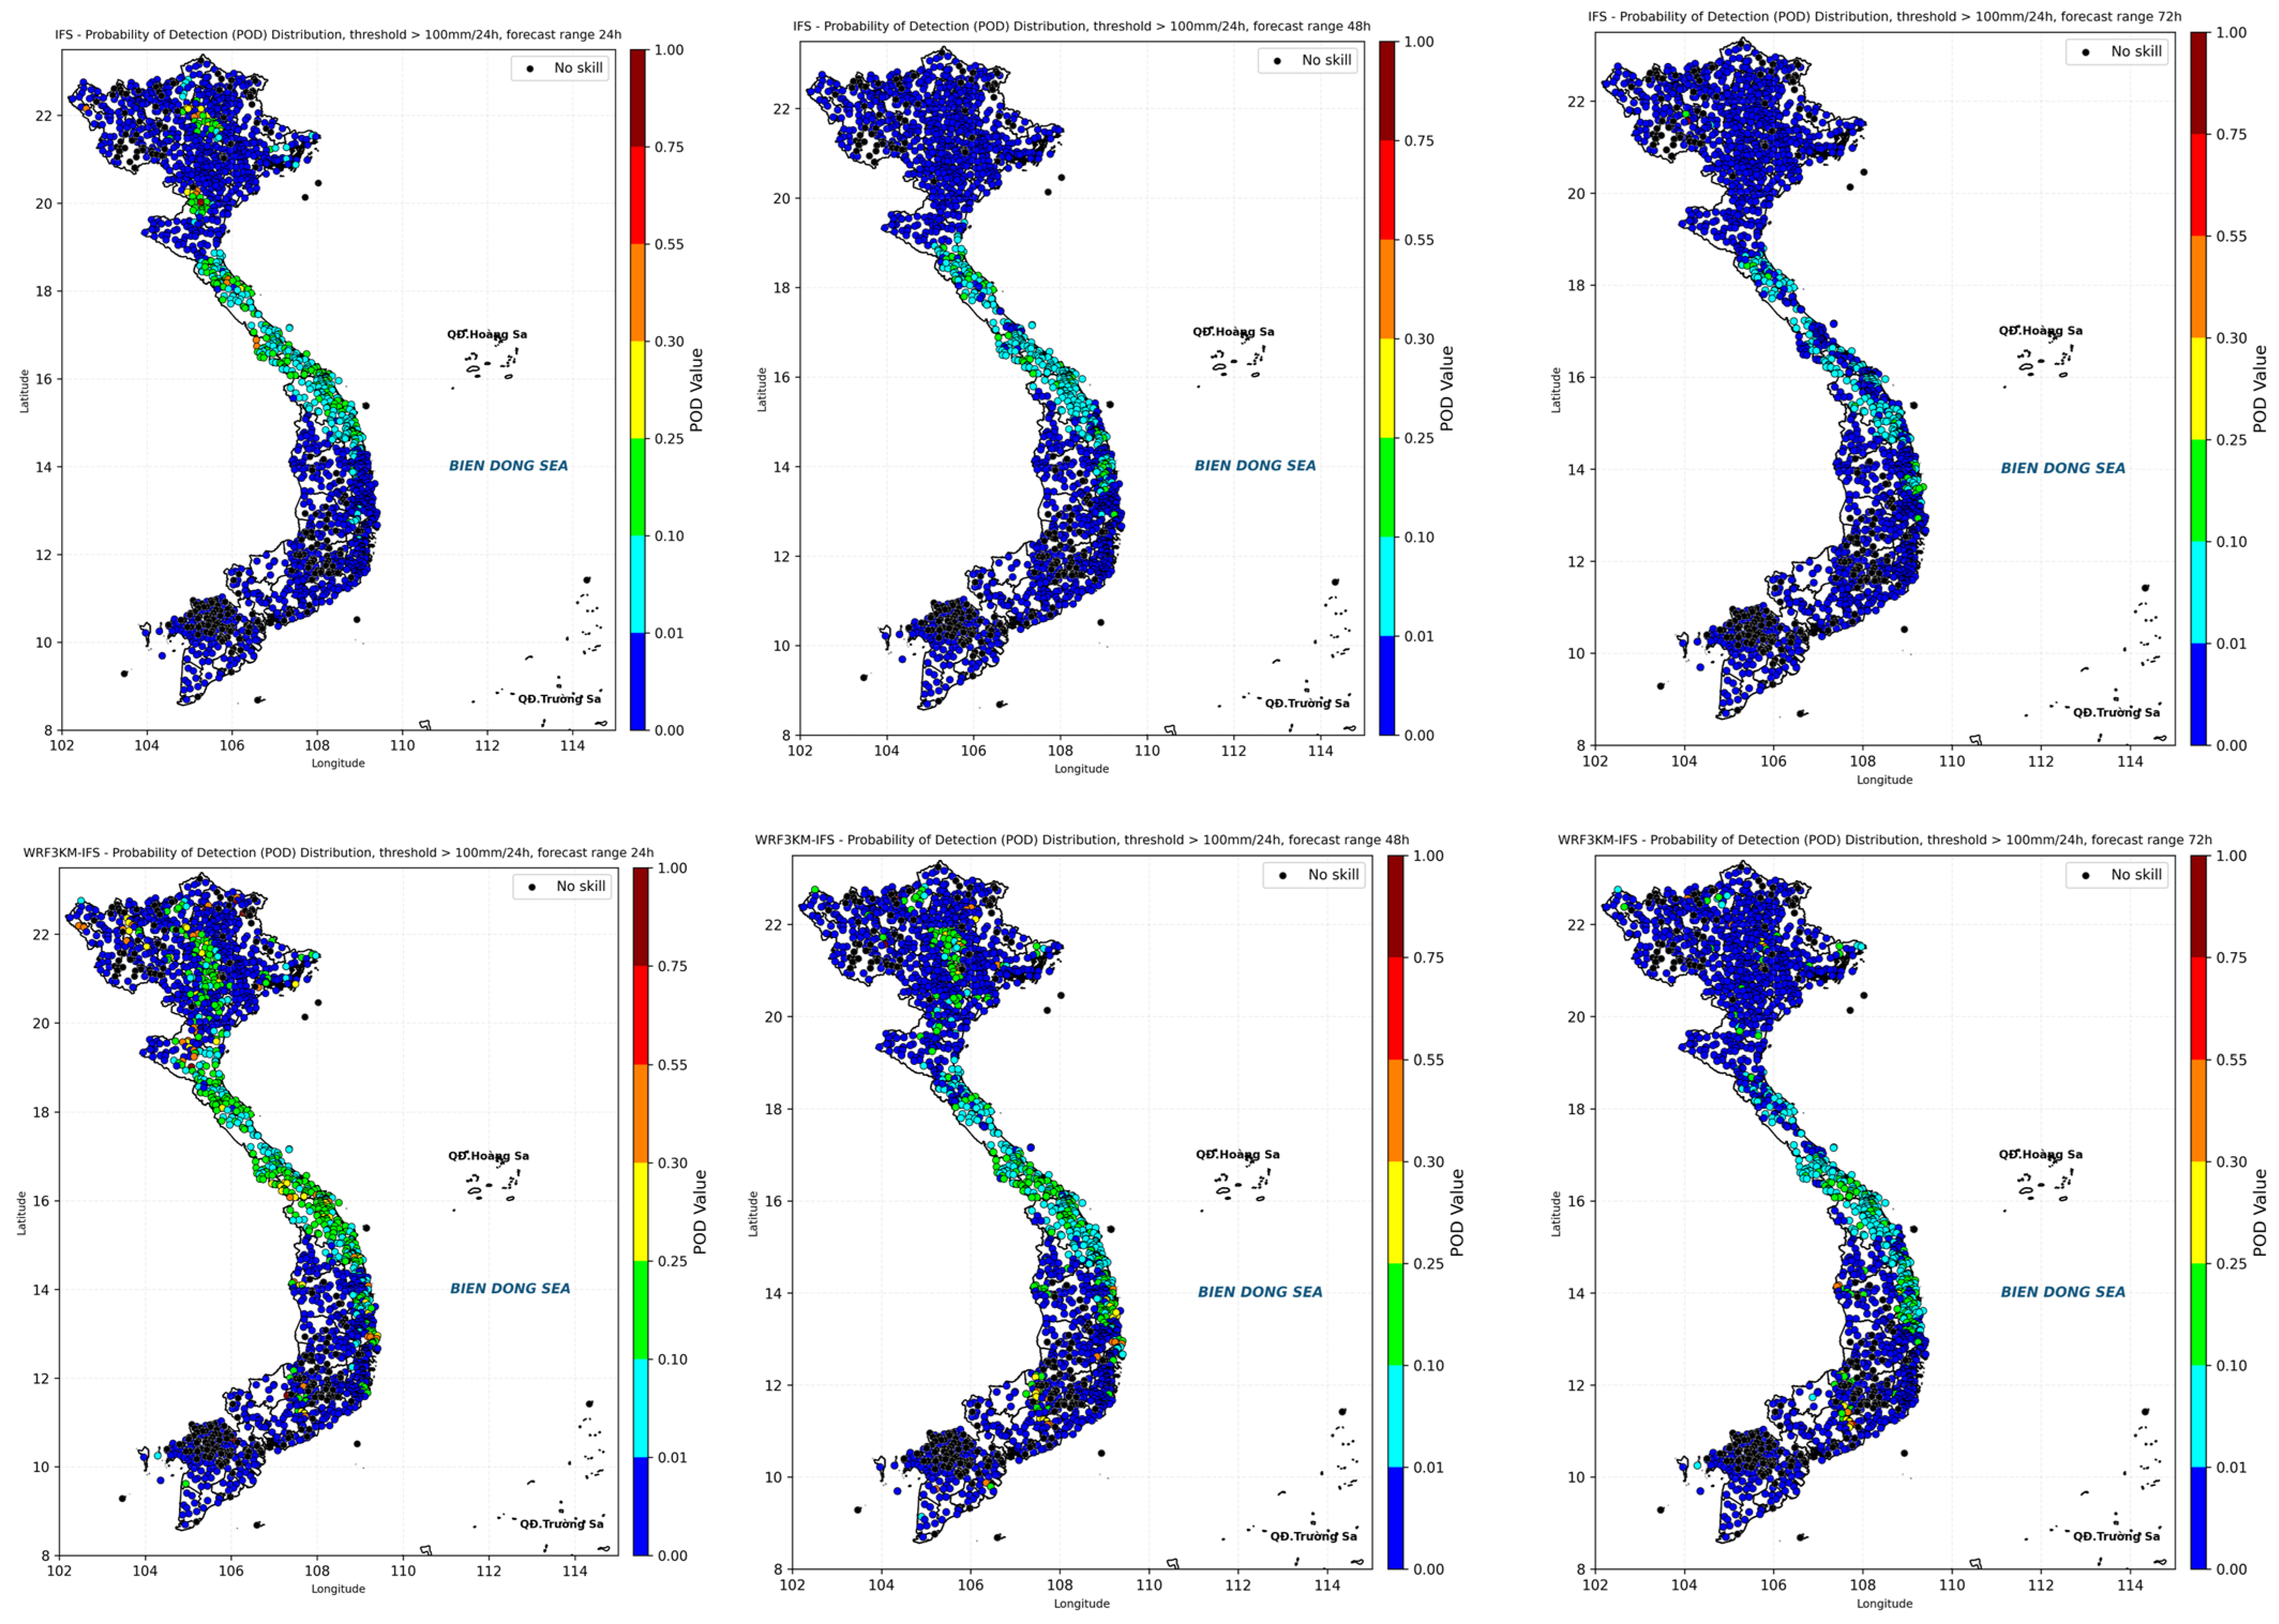
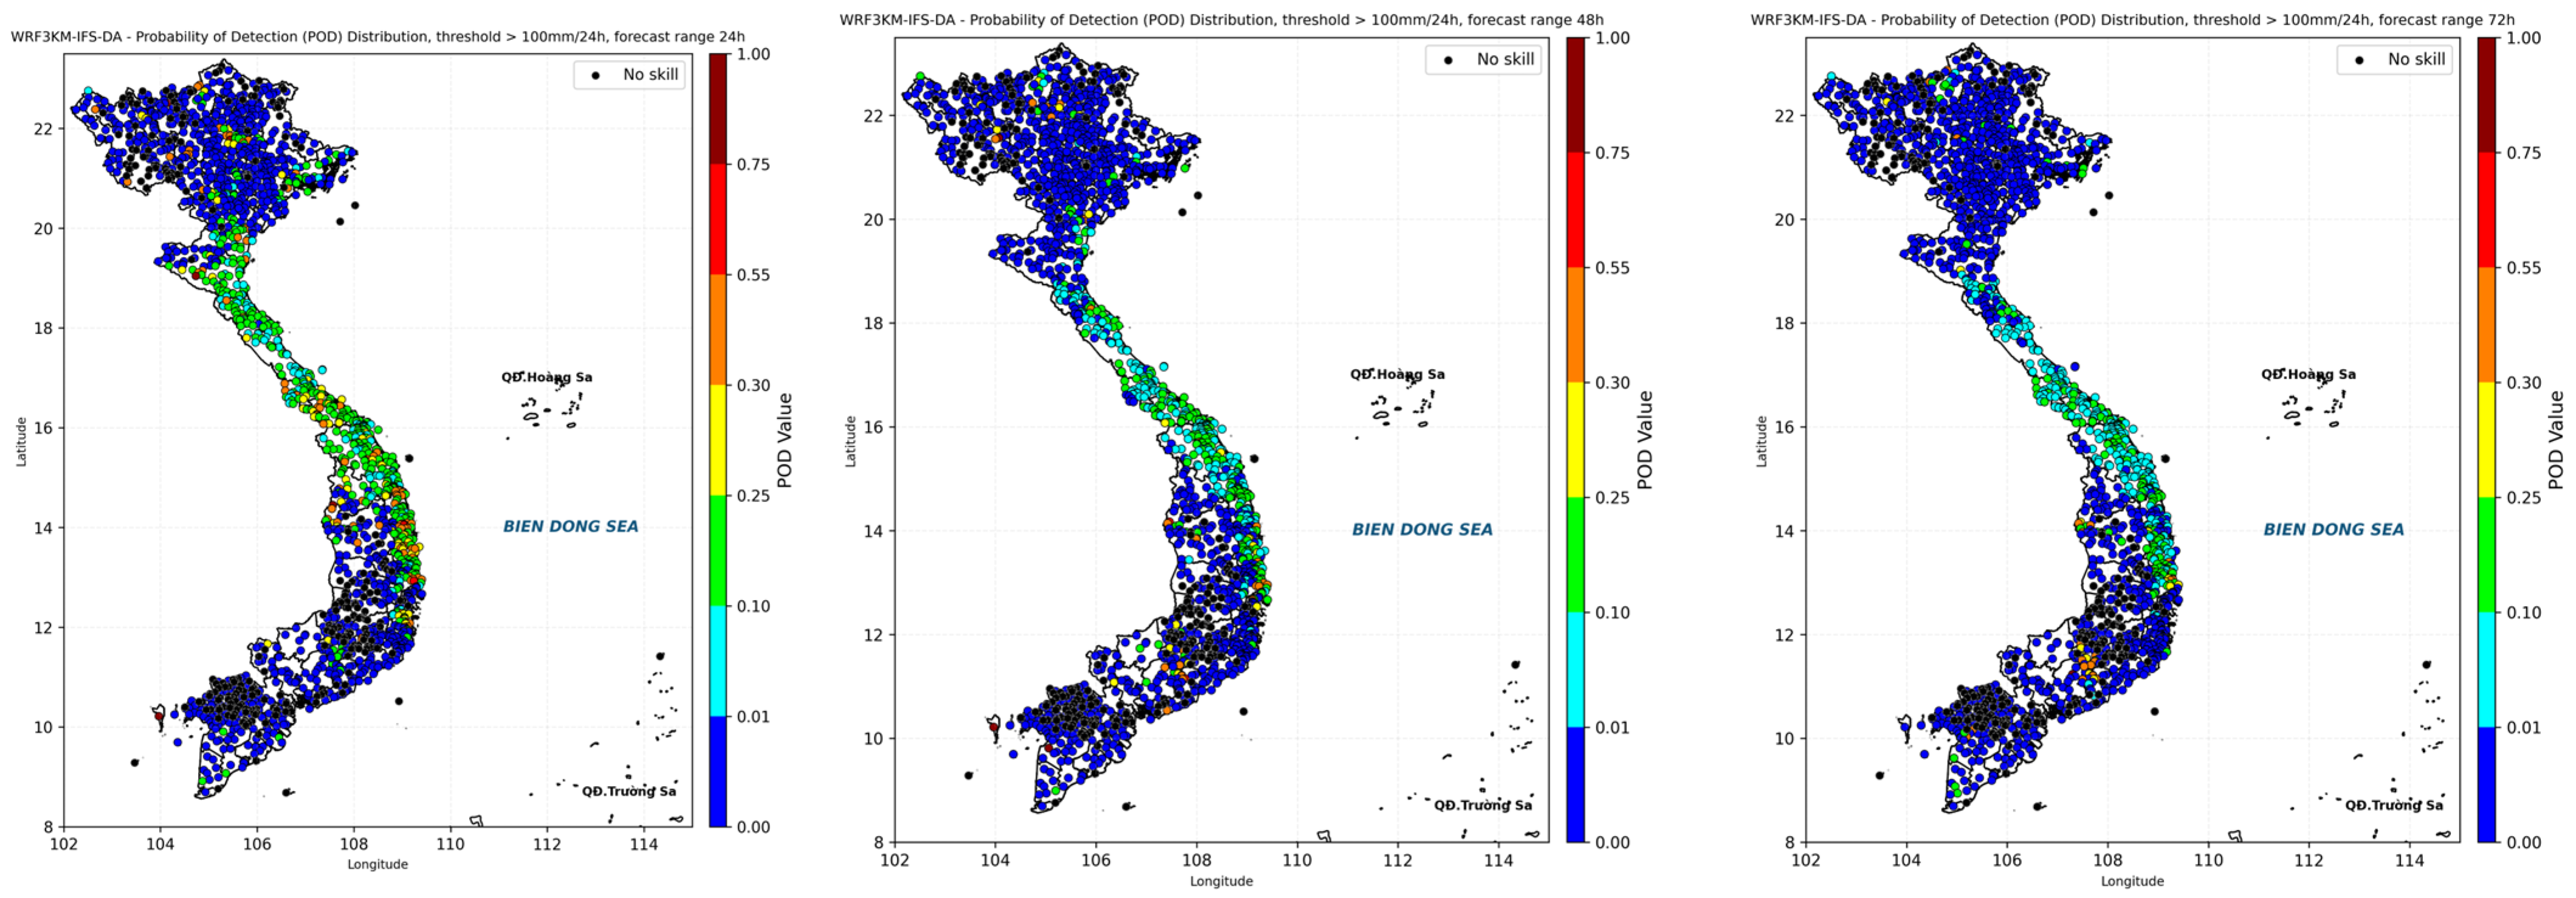
4.4. Extreme Heavy Rainfall Forecast Skills

For extreme rainfall events, the illustrations are given at the threshold > 100 mm/24 h at 24 h, 48 h, and 72 h forecast ranges. Instead of TS, this research will consider POD and HSS scores, where HSS is similar to TS but eliminates information related to correct forecasts due to random chance. The closer the HSS is to 1, the higher the model skill, and it can be used to evaluate extreme rainfall events or rare events [25,26,27,28,29]. Typical current values for tropical regions for HSS for 1–5-day forecast ranges are around 0.2–0.4; however, for intense rainfall types, the HSS has lower values.
For POD (Figure 9), in general, the forecasting models can predict about 25% of the detection rate for extreme rainfall, and the central region has the highest detection ability (R4 and the northern part of R5). At the 24 h forecast range, it can be seen that the WRF3kmIFS-DA model can increase the detection rate very clearly up to 40–60% for stations in the R4 and R5 regions. Specific calculations also show that the hit rates at large thresholds with DA increase significantly compared to the WRF3kmIFS and IFS models, showing the role of local information when assimilated in the WRF-ARW model.
For the IFS model, it can first be seen that the proportion of stations with skill in the R4 and R5 regions is larger than in the northern region (R1 and R2). R2 and R7 are almost completely absent at all three forecast ranges. In practical forecasting, this phenomenon is largely related to the complexity of combinations of different weather patterns to produce heavy rain in the northern region, leading to almost no model-capturing capability [2] or the extremely low forecasting ability of the ECMWF’s forecasting system. The key point is that for purely downscaling WRF3kmIFS, the R3 region is clearly improved for extreme events at 24 h and 48 h (Figure 9).
Through HSS (Figure 10), when comparing the three forecast ranges using the WRF-ARW, the effect of data assimilation in WRF3kmIFS-DA at 24 h is most obvious, which is understandable due to the characteristics of the initial problem in weather forecasting. Maintaining the effect of data assimilation at longer ranges is often quite difficult and requires techniques such as 4Dvar and hybrid ensemble data assimilation.
It is also quite clear that the higher the forecast ranges, the lower the proportion of stations with skill in forecasting this extremely heavy rain. However, at this extreme threshold, the results clearly show the role of the local scale with the forecasting ability from the established high-resolution systems in the forecast of WRF3kmIFS and WRF3kmIFS-DA. In general, the no-skill score decreased significantly in the three forecast ranges, but with the WRF3kmIFS and WRF3kmIFS-DA models, skill scores increased significantly in the highland area (R6) and complex terrain areas in the north (R1 and R2).

5. Conclusions

This research evaluates the skill of the European Centre for Medium-Range Weather Forecasts (ECMWF) High-Resolution Integrated Forecasting System (IFS) model and combines dynamical downscaling with the Weather Research and Forecasting with the Advanced Research WRF core (WRF-ARW) model for high-impact rainfall forecasting over the Vietnam region from 2019 to 2023. This research used over 2000 AWSs instead of sparse information from conventional synoptic rain gauge stations as in several previous studies of the Vietnam region. The differences in model performance across Vietnam’s sub-climate regions (R1–R7) were detailed, emphasizing the strengths and limitations of the models in varying terrains and weather patterns.
Some main results show the existence of bias at low rainfall thresholds of the models. Among the regions of Vietnam, the northern region presents the greatest challenge for forecasting, as it is affected by a variety of weather patterns. Especially in extreme events, the 2–3-day forecast ranges still have very low forecasting skills (TS < 0.1 for threshold > 50 mm/24 h). For the central region, which is affected by tropical disturbances, the model shows the best performance in capturing rainfall patterns.
For regions strongly influenced by local conditions (terrain), such as mountainous areas over the northern region and the highland region, in general, at the 24 h forecast range, the forecasting models can predict about 25% of the detection rate for extreme rainfall (>100 m/24 h) and the WRF3kmIFS-DA can increase the detection rate up to 40–60%. Therefore, it is clear that downscaling with local observation assimilated forecasts is necessary to improve the ability to predict heavy rain events.
The average TS scores for each year showed a trend of increasing IFS quality over most regions of Vietnam, from about 0.2 in 2019 to about 0.3 in recent years, at a threshold of 5 mm/24 h. This also supported the increasing of the quality of the dynamic downscaling product over the years.
Regarding the quite obvious existence of model biases, this is also the basis for applying post-processing procedures such as quantile mapping methods or machine learning/deep learning applications [21], which is the focus of further research to increase the ability to forecast high-impact rainfall events in the Vietnam region.

Author Contributions

Writing and original draft preparation, D.D.T., M.K.H. and D.D.Q.; review and editing, L.R.H., T.A.D., M.V.K. and D.D.T.; calculation and visualization, T.A.D., H.G.N. and D.T.T.; and project administration, D.D.T. and T.A.D. All authors have read and agreed to the published version of the manuscript.

Funding

This research was supported by the Ministry of Natural Resources and Environment of Vietnam (“Research on establishing a 10-day quantitative precipitation forecasting system to serve hydrological forecasting problems”, intervention code TNMT.2023.06.01).

Institutional Review Board Statement

Not applicable.

Informed Consent Statement

Not applicable.

Data Availability Statement

All data related to this paper can be requested from the authors for research purposes.

Acknowledgments

Hole received funding from the Norwegian Agency for Development Cooperation (NORAD). The authors would like to thank Nguyen Thanh Tung for the information shared in his WMO fellowship report at the ECMWF in 2016 and Pham Thi Phuong Dung for her help in pre-processing observation data.

Conflicts of Interest

The authors declare no conflicts of interest.

References

  1. Yokoi, S.; Matsumoto, J. Collaborative effects of cold surge and tropical depression–type disturbance on heavy rainfall in central Vietnam. Mon. Weather Rev. 2008, 136, 3275–3287. [Google Scholar] [CrossRef]
  2. Van der Linden, R.; Fink, A.H.; Pinto, J.G.; Phan-Van, T. The dynamics of an extreme precipitation event in northeastern Vietnam in 2015 and its predictability in the ECMWF ensemble prediction system. Weather Forecast. 2017, 32, 1041–1056. [Google Scholar] [CrossRef]
  3. Ngo-Duc, T.; Kieu, C.; Thatcher, M.; Nguyen-Le, D.; Phan-Van, T. Climate projections for Vietnam based on regional climate models. Clim. Res. 2014, 60, 199–213. [Google Scholar] [CrossRef]
  4. Phan, V.T.; Ngo-Duc, T. Seasonal and interannual variations of surface climate elements over Vietnam. Clim. Res. 2009, 40, 49–60. [Google Scholar] [CrossRef]
  5. Simmons, A.J.; Hollingsworth, A. Some aspects of the improvement in skill of numerical weather prediction. Q. J. R. Meteorol. Soc. A J. Atmos. Sci. Appl. Meteorol. Phys. Oceanogr. 2002, 128, 647–677. [Google Scholar] [CrossRef]
  6. Vogel, P.; Knippertz, P.; Fink, A.H.; Schlueter, A.; Gneiting, T. Skill of global raw and postprocessed ensemble predictions of rainfall in the tropics. Weather Forecast. 2020, 35, 2367–2385. [Google Scholar] [CrossRef]
  7. Hamill, T.M. Verification of TIGGE multimodel and ECMWF reforecast-calibrated probabilistic precipitation forecasts over the contiguous United States. Mon. Weather Rev. 2012, 140, 2232–2252. [Google Scholar] [CrossRef]
  8. Bauer, H.S.; Schwitalla, T.; Wulfmeyer, V.; Bakhshaii, A.; Ehret, U.; Neuper, M.; Caumont, O. Quantitative precipitation estimation based on high-resolution numerical weather prediction and data assimilation with WRF—A performance test. Tellus A Dyn. Meteorol. Oceanogr. 2015, 67, 25047. [Google Scholar] [CrossRef]
  9. Hung, M.K.; Tien, D.D.; Quan, D.D.; Duc, T.A.; Dung, P.T.P.; Hole, L.R.; Nam, H.G. Assessments of use of blended radar–numerical weather prediction product in short-range warning of intense rainstorms in localized systems (SWIRLS) for quantitative precipitation forecast of tropical cyclone landfall on Vietnam’s Coast. Atmosphere 2023, 14, 1201. [Google Scholar] [CrossRef]
  10. Haiden, T.; Rodwell, M.J.; Richardson, D.S.; Okagaki, A.; Robinson, T.; Hewson, T. Intercomparison of global model precipitation forecast skill in 2010/11 using the SEEPS score. Mon. Weather Rev. 2012, 140, 2720–2733. [Google Scholar] [CrossRef]
  11. World Meteorological Organization. Guidelines on High-resolution Numerical Weather Prediction (WMO-No. 1311). Available online: https://library.wmo.int/idurl/4/66217 (accessed on 15 January 2025).
  12. Furnari, L.; Magnusson, L.; Mendicino, G.; Senatore, A. Fully coupled high-resolution medium-range forecasts: Evaluation of the hydrometeorological impact in an ensemble framework. Hydrol. Process. 2022, 36, e14503. [Google Scholar] [CrossRef]
  13. Su, D.; Zhong, J.; Xu, Y.; Lv, L.; Liu, H.; Fan, X.; Han, L.; Wang, F. SAL Method Applied in Grid Forecasting Product Verification with Three-Source Fusion Product. Atmosphere 2024, 15, 1366. [Google Scholar] [CrossRef]
  14. Magnusson, L.; Ackerley, D.; Bouteloup, Y.; Chen, J.H.; Doyle, J.; Earnshaw, P.; Kwon, Y.C.; Köhler, M.; Lang, S.K.; Lim, Y.J.; et al. Skill of medium-range forecast models using the same initial conditions. Bull. Am. Meteorol. Soc. 2022, 103, E2050–E2068. [Google Scholar] [CrossRef]
  15. Skamarock, W.C.; Klemp, J.B.; Dudhia, J.; Gill, D.O.; Barker, D.M.; Duda, M.G.; Huang, X.Y.; Wang, W.; Powers, J.G. A description of the advanced research WRF version 3. NCAR Tech. Note 2008, 475, 10–5065. [Google Scholar] [CrossRef]
  16. Parrish, D.F.; Derber, J.C. The National Meteorological Center’s spectral statistical-interpolation analysis system. Mon. Weather Rev. 1992, 120, 1747–1763. [Google Scholar] [CrossRef]
  17. Roversi, G.; Pancaldi, M.; Cossich, W.; Corradini, D.; Nguyen, T.T.N.; Nguyen, T.V.; Porcu, F. The extreme rainfall events of the 2020 typhoon season in Vietnam as seen by seven different precipitation products. Remote Sens. 2024, 16, 805. [Google Scholar] [CrossRef]
  18. Wilks, D.S. Statistical Methods in the Atmospheric Sciences; Academic Press: Cambridge, MA, USA, 2011. [Google Scholar]
  19. World Meteorological Organization. Guide to Instruments and Methods of Observation; World Meteorological Organization: Geneva, Switzerland, 2018; p. 548. [Google Scholar]
  20. Lavers, D.A.; Harrigan, S.; Prudhomme, C. Precipitation biases in the ECMWF integrated forecasting system. J. Hydrometeorol. 2021, 22, 1187–1198. [Google Scholar] [CrossRef]
  21. Chen, Y.; Huang, G.; Wang, Y.; Tao, W.; Tian, Q.; Yang, K.; Zheng, J.; He, H. Improving the heavy rainfall forecasting using a weighted deep learning model. Front. Environ. Sci. 2023, 11, 1116672. [Google Scholar] [CrossRef]
  22. Lang, S.; Rodwell, M.; Schepers, D. IFS upgrade brings many improvements and unifies medium-range resolutions. ECMWF Newsl. 2023, 176, 21–28. [Google Scholar] [CrossRef]
  23. Skok, G.; Roberts, N. Analysis of fractions skill score properties for random precipitation fields and ECMWF forecasts. Q. J. R. Meteorol. Soc. 2016, 142, 2599–2610. [Google Scholar] [CrossRef]
  24. Ebert, E.E.; Gallus, W.A., Jr. Toward better understanding of the contiguous rain area (CRA) method for spatial forecast verification. Weather Forecast. 2009, 24, 1401–1415. [Google Scholar] [CrossRef]
  25. Ding, C.; Su, Z.; Ren, F.; Wong, W.K.; Chen, B.; Ren, H. Prediction of tropical cyclone precipitation over China by the DSAEF_LTP model. Q. J. R. Meteorol. Soc. 2022, 148, 2243–2253. [Google Scholar] [CrossRef]
  26. Lyu, Y.; Zhu, S.; Zhi, X.; Ji, Y.; Fan, Y.; Dong, F. Improving subseasonal-to-seasonal prediction of summer extreme precipitation over southern China based on a deep learning method. Geophys. Res. Lett. 2023, 50, e2023GL106245. [Google Scholar] [CrossRef]
  27. Eini, M.R.; Rahmati, A.; Salmani, H.; Brocca, L.; Piniewski, M. Detecting characteristics of extreme precipitation events using regional and satellite-based precipitation gridded datasets over a region in Central Europe. Sci. Total Environ. 2022, 852, 158497. [Google Scholar] [CrossRef] [PubMed]
  28. Doswell, C.; Davies-Jones, R.; Keller, D.L. On summary measures of skill in rare event forecasting based on contingency tables. Weather Forecast. 1990, 5, 576–585. [Google Scholar] [CrossRef]
  29. Zhang, B.; Zeng, M.; Huang, A.; Qin, Z.; Liu, C.; Shi, W.; Li, X.; Zhu, K.; Gu, C.; Zhou, J. A general comprehensive evaluation method for cross-scale precipitation forecasts. Geosci. Model Dev. 2024, 17, 4579–4601. [Google Scholar] [CrossRef]
Figure 1. (a) Distribution of automatic weather stations (black dots) used for model validations and the seven sub-climate regions (R1–R7). (b) The 5-year average (2019–2023) of annual accumulated rainfall (unit: mm).
Atmosphere 16 00224 g001
Figure 2. (a) The observation analysis 24 h accumulated rainfall map, (bd) 24 h accumulated rainfall and mean sea level pressure forecast on 21 July 2020, 00:00 UTC (07:00 LTC) from the Integrated Forecasting System (IFS), WRF3kmIFS, and WRF3kmIFS-DA, respectively, and more detailed plots for Vietnam only (eg) for the IFS, WRF3kmIFS, and WRF3kmIFS-DA, respectively.
Atmosphere 16 00224 g002
Figure 3. The 5-year average (a) bias score (BIAS), (b) probability of detection (POD), (c) false alarm rate (FAR), and (d) threat score (TS) scores at a 24 h forecast range for the IFS, WRF3kmIFS, and WRF3kmIFS-DA model for seven sub-climate regions (R1–R7) at three thresholds (>5 mm/24 h, >25 mm/24 h, and >50 mm/24 h).
Atmosphere 16 00224 g003aAtmosphere 16 00224 g003b
Figure 4. The 5-year average TS scores at 24 h, 48 h, and 72 h forecast ranges for the (a) IFS, (b) WRF3kmIFS, and (c) WRF3kmIFS-DA models for seven sub-climate regions (R1–R7) at three thresholds (>5 mm/24 h, >25 mm/24 h, and >50 mm/24 h).
Atmosphere 16 00224 g004
Figure 5. Yearly performances of TS scores at 24 h forecast range for the (a) IFS, (b) WRF3kmIFS, and (c) WRF3kmIFS-DA models for seven sub-climate regions (R1–R7) at three thresholds (>5 mm/24 h, >25 mm/24 h, and >50 mm/24 h).
Atmosphere 16 00224 g005
Figure 6. Yearly performances of BIAS scores at 24 h forecast range for the (a) IFS, (b) WRF3kmIFS, and (c) WRF3kmIFS-DA models for seven sub-climate regions (R1–R7) at three thresholds (>5 mm/24 h, >25 mm/24 h, and >50 mm/24 h).
Atmosphere 16 00224 g006
Figure 7. Spatial distribution of TS scores at the threshold >25 mm/24 h for the IFS (first row), WRF3kmIFS (second row), and WRF3kmIFS-DA (third row) at forecast ranges of 24 h (left column), 48 h (center column), and 72 h (right column).
Atmosphere 16 00224 g007aAtmosphere 16 00224 g007b
Figure 8. Similar to Figure 7 but for POD scores.
Atmosphere 16 00224 g008aAtmosphere 16 00224 g008b
Figure 9. Spatial distribution of PODs for extreme precipitation forecasts (>100 mm/24 h) using the IFS (first row), WRF3kmIFS (second row), and WRF3kmIFS-DA (third row) models at forecast ranges of 24 h (left column), 48 h (center column), and 72 h (right column).
Atmosphere 16 00224 g009aAtmosphere 16 00224 g009b
Figure 10. Similar to Figure 9 but for spatial distribution of Heidke skill scores.
Atmosphere 16 00224 g010aAtmosphere 16 00224 g010b
Table 1. The climatic regions in Vietnam.
RegionAnnual Rainfall (MM)Rainy Season
R1the North West1200–2000from April to September
R2the North East1400–2000from April to November
R3the Red River Delta1400–1800from April to November
R4the North Central1400–2000from August to December
R5the South Central1200–2000 (northern)from August to December
1200–1600 (southern)
R6the Central Highlands1400–2000from May to October
Disclaimer/Publisher’s Note: The statements, opinions and data contained in all publications are solely those of the individual author(s) and contributor(s) and not of MDPI and/or the editor(s). MDPI and/or the editor(s) disclaim responsibility for any injury to people or property resulting from any ideas, methods, instructions or products referred to in the content.

