Article

Causes and Transmission Characteristics of the Regional PM2.5 Heavy Pollution Process in the Urban Agglomerations of the Central Taihang Mountains

1
National Key Laboratory of Intelligent Spatial Information, Beijing 100080, China
2
Hebei Technology Innovation Center for Remote Sensing and Identification of Environmental Changes, Shijiazhuang 050024, China
3
College of Geographic Sciences, Hebei Normal University, Shijiazhuang 050024, China
4
Institute of Atmospheric Physics, Chinese Academy of Sciences, Beijing 100029, China
5
School of Management, Hebei GEO University, Shijiazhuang 050031, China
*
Author to whom correspondence should be addressed.
These authors contributed equally to this work and should be considered co-first authors.
Atmosphere 2025, 16(2), 205; https://doi.org/10.3390/atmos16020205
Submission received: 11 January 2025 / Revised: 8 February 2025 / Accepted: 10 February 2025 / Published: 11 February 2025

Abstract

:
The Taihang Mountains serve as a critical geographical barrier in northern China, delineating two major 2.5-micrometer particulate matter (PM2.5) pollution hotspots in the Beijing–Tianjin–Hebei region and the Fenwei Plain. This study examines the underlying mechanisms and interregional dynamic transport pathways of a severe PM2.5 pollution event that occurred in the urban agglomerations of the Central Taihang Mountains (CTHM) from 8–13 December 2021. The WRF-HYSPLIT simulation was employed to analyze a broader range of potential pollution sources and transport pathways. Additionally, a new river network analysis module was developed and integrated with the Atmospheric Pollutant Transport Quantification Model (APTQM). This module is capable of identifying localized, small-scale (interplot) pollution transport processes, thereby enabling more accurate identification of potential source areas and transport routes. The findings indicate that the persistence of low temperatures, high humidity, and stagnant atmospheric conditions facilitated both the local accumulation and cross-regional transport of PM2.5. The eastern urban agglomerations, such as Shijiazhuang and Xingtai, were predominantly influenced by northwesterly air masses originating from Inner Mongolia and Shanxi, with pollution levels intensified due to topographic blocking and subsidence effects east of the Taihang Mountains. In contrast, western urban centers, including Taiyuan and Yangquan, experienced pollution primarily from short-range transport within the Fen River Basin, central Inner Mongolia, and Shaanxi, compounded by basin-induced stagnation. Three principal transport pathways were identified: (1) a northwestern pathway from Inner Mongolia to Hebei, (2) a southwestern pathway following the Fen River Basin, and (3) a southward inflow from Henan. The trajectory analysis revealed that approximately 68% of PM2.5 in eastern receptor cities was transported through topographic channels within the Taihang Transverse Valleys, whereas 43% of pollution in the western regions originated from intra-basin emissions and basin-capture circulation. Furthermore, APTQM-PM2.5 identified major pollution source regions, including Ordos and Chifeng in Inner Mongolia, as well as Taiyuan and the Fen River Basin. This study underscores the synergistic effects of basin topography, regional circulation, and anthropogenic emissions in shaping pollution distribution patterns. The findings provide a scientific basis for formulating targeted, regionally coordinated air pollution mitigation strategies in complex terrain areas.

1. Introduction

With the rapid advancement of industrialization and urbanization, air pollution has emerged as a significant global environmental challenge. In urban environments, PM2.5 has emerged as a primary air pollutant exceeding regulatory standards [1]. Beyond significantly reducing visibility, prolonged exposure to PM2.5 has been associated with an elevated risk of cardiovascular, respiratory, and metabolic disorders, including diabetes [2,3,4,5]. Due to its high atmospheric mobility and dispersion potential, PM2.5 exhibits extensive spatial distribution, resulting in widespread exposure and significant public health concerns [6]. Since the 1990s, the Chinese government has gradually acknowledged the severity of air pollution and has implemented a series of prevention and control measures, such as the “Air Pollution Prevention and Control Action Plan” [7]. Among policy recommendations for managing polluted weather, the development of regional joint prevention and control strategies remains one of the most frequently advocated measures. Previous studies have demonstrated that the transport dynamics and structural instability of air pollution necessitate an approach that extends beyond local emissions, emphasizing the significant role of external pollution transport. Consequently, understanding the characteristics and spatial patterns of cross-regional pollutant transport in urban agglomerations is critical for designing effective air quality management strategies.
Most domestic air pollution studies have primarily focused on cities within major economic centers [8,9,10], while research on pollution in urban assemblages along mountainous terrain remains relatively limited. In contrast, several studies in Western Europe and North America have investigated air pollution dynamics in cities characterized by complex topographies, such as basins and mountainous regions. For example, Calderón-Garcidueñas et al. [11] analyzed air pollution in the Mexico City Metropolitan Area (MCMA), examining the spatial distribution and transport patterns of PM10 and PM2.5, with 10-micrometer particulate matter (PM10) concentrations predominantly observed in the northeastern MCMA. Langford et al. [12] integrated LiDAR observations with the NOAA HYSPLIT model to analyze 48 h and 60 h forward trajectories of aerosols at varying altitudes over the San Gabriel Mountains. Similarly, Kanakidou et al. [13] conducted a comprehensive study of air pollution in the Eastern Mediterranean region, utilizing atmospheric modeling and backward trajectory analysis to assess pollution sources, transport pathways, transformation processes, and dispersion patterns.
In atmospheric science research, Lagrangian dispersion models are widely preferred for their accuracy in simulating pollutant transport dynamics. Notably, the HYSPLIT (Hybrid Single-Particle Lagrangian Integrated Trajectory) model, jointly developed by the Air Resources Laboratory of the National Oceanic and Atmospheric Administration (NOAA) and the Australian Bureau of Meteorology, has been extensively applied in global air quality simulations and dispersion studies. The HYSPLIT model employs forward trajectory simulations to trace pollutant dispersion pathways, while its backward trajectory analysis is instrumental in identifying potential pollution sources affecting a given region [14,15]. This model has demonstrated versatility across various domains, including air pollution dispersion and atmospheric transport studies. For instance, it has played a critical role in tracking pest migration trajectories [16], dust storm transport routes [17], and water vapor transport patterns [18]. Luoqi Yang et al. [19] proposed the Atmospheric Pollutant Transport Quantification Model (APTQM), which can effectively characterize complex pollutant transport dynamics while maintaining computational efficiency, enabling the analysis and quantification of transport pathways and fluxes of atmospheric pollutants across regions. The APTQM model has been successfully applied to the study of pollution events and the assessment of regional air pollution transport pathways, demonstrating its effectiveness in air quality research and management. These applications provide valuable methodologies and insights for analyzing regional pollution dynamics.
As an important natural barrier to the North China Plain, the special geographic location and topographic conditions of the Taihang Mountains make them a natural laboratory for studying the cross-regional transport of air pollution [20]. The significant increase in PM2.5 concentration in winter in this region is associated with a variety of factors, including but not limited to the increase in coal-fired heating, industrial emissions, traffic pollution, and unfavorable meteorological conditions [21]. Chen Li and Coco Zhang et al. [22] studied the causes of pollution in 11 cities in Shanxi Province, and the results showed that the peak PM2.5 concentrations were mainly concentrated in the southern part of Taiyuan, the southeastern part of Yangquan, and the southwestern part of Jinzhong, and that the three cities were affected by the transmission of pollution from the Fen River basin. Jie Wang et al. [23] found that southwestern air masses gathered at the end of the Fen River valley and carried pollutants to the northeast under the strong effect of the valley airflow that transported them along the transport corridor to the western part of Hebei Province. Meanwhile, the particulate matter over Shijiazhuang City was influenced by the southerly winds near the ground that converged with the sinking airflow appearing in front of the Taihang Mountains in the eastern part of CTHM and transported westward along the creeping transport corridor under the effect of the easterly winds. However, most existing studies have primarily focused on the pollution characteristics of individual cities along the Taihang Mountains or specific time periods, while systematic investigations into transregional pollution transport corridors between urban agglomerations on either side remain limited. In particular, there is a lack of comprehensive research on the airflow transport characteristics, the pathways of interregional pollutant exchange, and the extent to which these factors influence pollution concentrations in urban agglomerations on both sides of the Taihang Mountains. At present, the underlying mechanisms governing cross-regional pollutant transport in this region remain inadequately understood, particularly under the influence of complex meteorological conditions and intricate topographical features.
This study examines the CTHM urban agglomeration, providing a comprehensive analysis of the persistent severe pollution in the region and the characteristics of wintertime pollution dispersion. A significant PM2.5 pollution event, which occurred between 8–13 December 2021, is examined in detail. The research integrates multi-scale modeling and observational analysis, employing the WRF-HYSPLIT model for large-scale trajectory simulations, alongside the development of an enhanced APTQM-PM2.5 model. This new version incorporates a novel river network module to address local transport dynamics. In addition, this study investigates the interactions between PM2.5 concentrations in key areas, meteorological factors, and upper atmospheric circulation patterns to provide a more comprehensive understanding of the pollution formation processes. The Section 2 includes a detailed explanation of the newly developed APTQM-PM2.5 model, while the Section 3 demonstrates its effectiveness in simulating and quantifying pollution transport pathways. Furthermore, the article analyzes the pollution characteristics, transport dynamics, and the primary pathways identified through trajectory analysis and numerical simulations related to the pollution event in the CTHM. The discussion and Section 4 summarize the findings, aiming to inform the development of coordinated air pollution control strategies for cities along the Taihang Mountain range. This study offers insights applicable to other urban agglomerations with similar geographic characteristics, contributing to the enhancement of regional air quality and the promotion of ecological sustainability.

2. Summary of Datasets and Research Methods

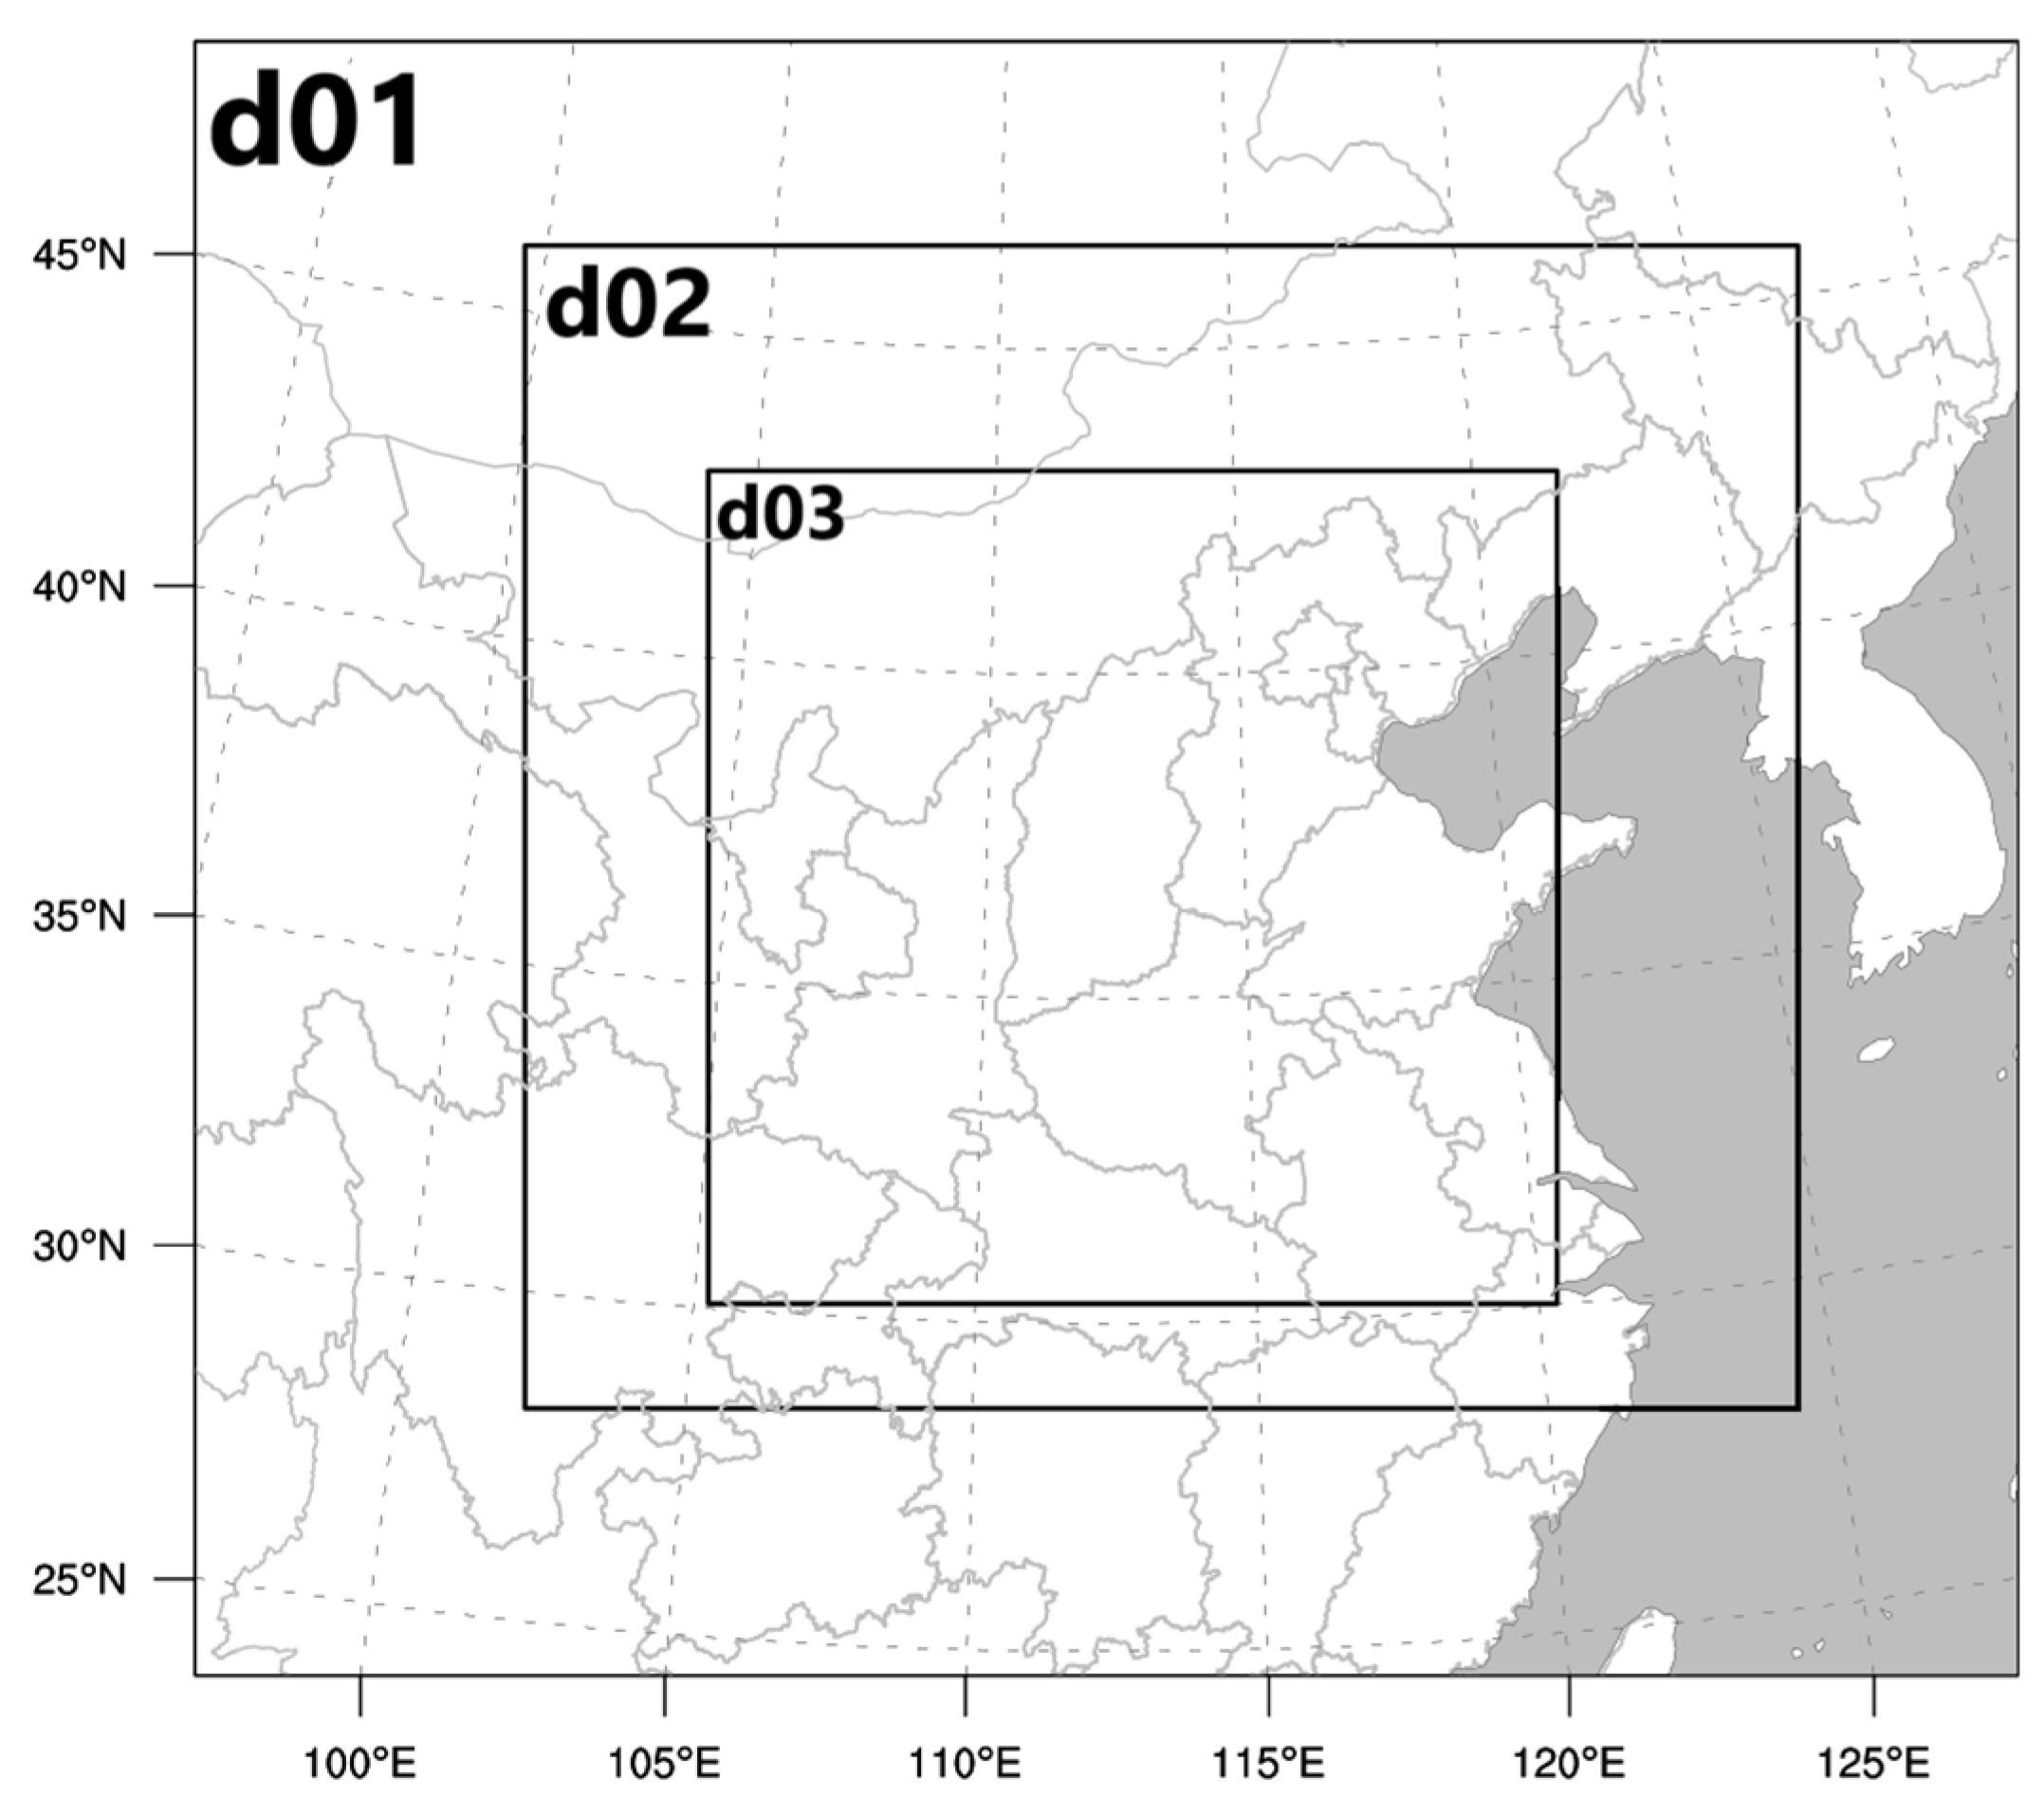
2.1. Overview of the Study Area and Data Sources

This study focuses on CTHM as the core axis, conducting an in-depth investigation into the characteristics and mechanisms of pollution transmission between urban agglomerations on both sides of the range. As illustrated in Figure 1a,b, the CTHM not only serve as a natural demarcation line between Shanxi and Hebei provinces but also function as a critical regional watershed [24]. The eastern side of the range is adjacent to the North China Plain, characterized by flat and open terrain, whereas the western side consists of a northeast-facing basin, exhibiting a distinct topographic gradient with higher elevations in the west and lower elevations in the east. The study area, spanning from 112.3° E to 116.5° E and 35.8° N to 38.8° N, encompasses several key urban and ecological regions, making it an important geographic domain for analyzing transregional pollution transport dynamics.
The distribution of urban agglomerations on both sides of the Taihang Mountains is closely influenced by topographical features. As shown in Figure 1c, the eastern urban agglomerations, primarily comprising Shijiazhuang, Xingtai, and Handan, are located within the North China Plain and the hilly regions along the eastern foothills of the Taihang Mountains. This area is characterized by relatively flat terrain, rapid economic development, high population density, and a high degree of urbanization. However, these cities also experience severe air pollution due to intensive industrial activities and high emissions. In contrast, the western urban agglomeration, centered around Taiyuan, Yangquan, and Jinzhong, is situated in a region dominated by basins and mountainous landscapes. This area features complex topography and hosts concentrated industrial activities, particularly heavy industries such as coal, steel, and chemical manufacturing [25]. These industries contribute to substantial atmospheric pollutant emissions, frequent haze episodes, and persistently poor air quality. Notably, the Taihang Mountains possess a unique topographic structure with multiple lateral passes and valleys, historically referred to as the “Eight Passes of the Taihang Mountains” [26] (Figure 1d). These geographic features play a crucial role in regional atmospheric circulation and pollutant transport. The transverse valleys not only serve as vital corridors for interregional transportation but also function as natural conduits for the dispersion of airborne particulate matter. Their presence facilitates pollutant exchange between urban agglomerations on either side of the Taihang Mountains, forming a complex regional pollution transport network.
The measured meteorological data were obtained from the China Meteorological Administration Open Data Platform (https://data.cma.cn/, last accessed on 18 June 2024), including near-surface air temperature (°C), relative humidity (%), and 10 m wind U/V component (kts). A number of state-controlled stations were built along the CTHM, and the arithmetic mean of the monitoring values of all the stations was used as the standard value CTHM. The final operational global analysis data (FNL) with 1° × 1° spatial resolution and 6 h time resolution (00:00, 06:00, 12:00 and 18:00 UTC) provided by the National Centers for Environmental Prediction (NCEP) are used as the meteorological initial conditions and boundary conditions of the numerical model. The real-time PM2.5 monitoring data were obtained from the National Urban Air Quality Real-time Publishing Platform (NUAQRPP) dataset of the National Environmental Monitoring General Station of China (https://air.cnemc.cn:18007, accessed on 15 January 2024). In this study, the quality control of PM2.5 mass concentration data was carried out in strict accordance with the national standard of the People’s Republic of China, GB3095-2012 “Ambient Air Quality Standards”, in which the moments in which the PM2.5 mass concentration was greater than 75 μg/m3 were labeled as polluted moments, and 8–13 December 2021, was selected as a typical pollution process for the case study. This stage includes the process of rising pollution values and moments of severe pollution, which is suitable for studying the diffusion and dilution of pollutants in the atmosphere.

2.2. WRF/WRF-HYSPLIT Parameter Settings
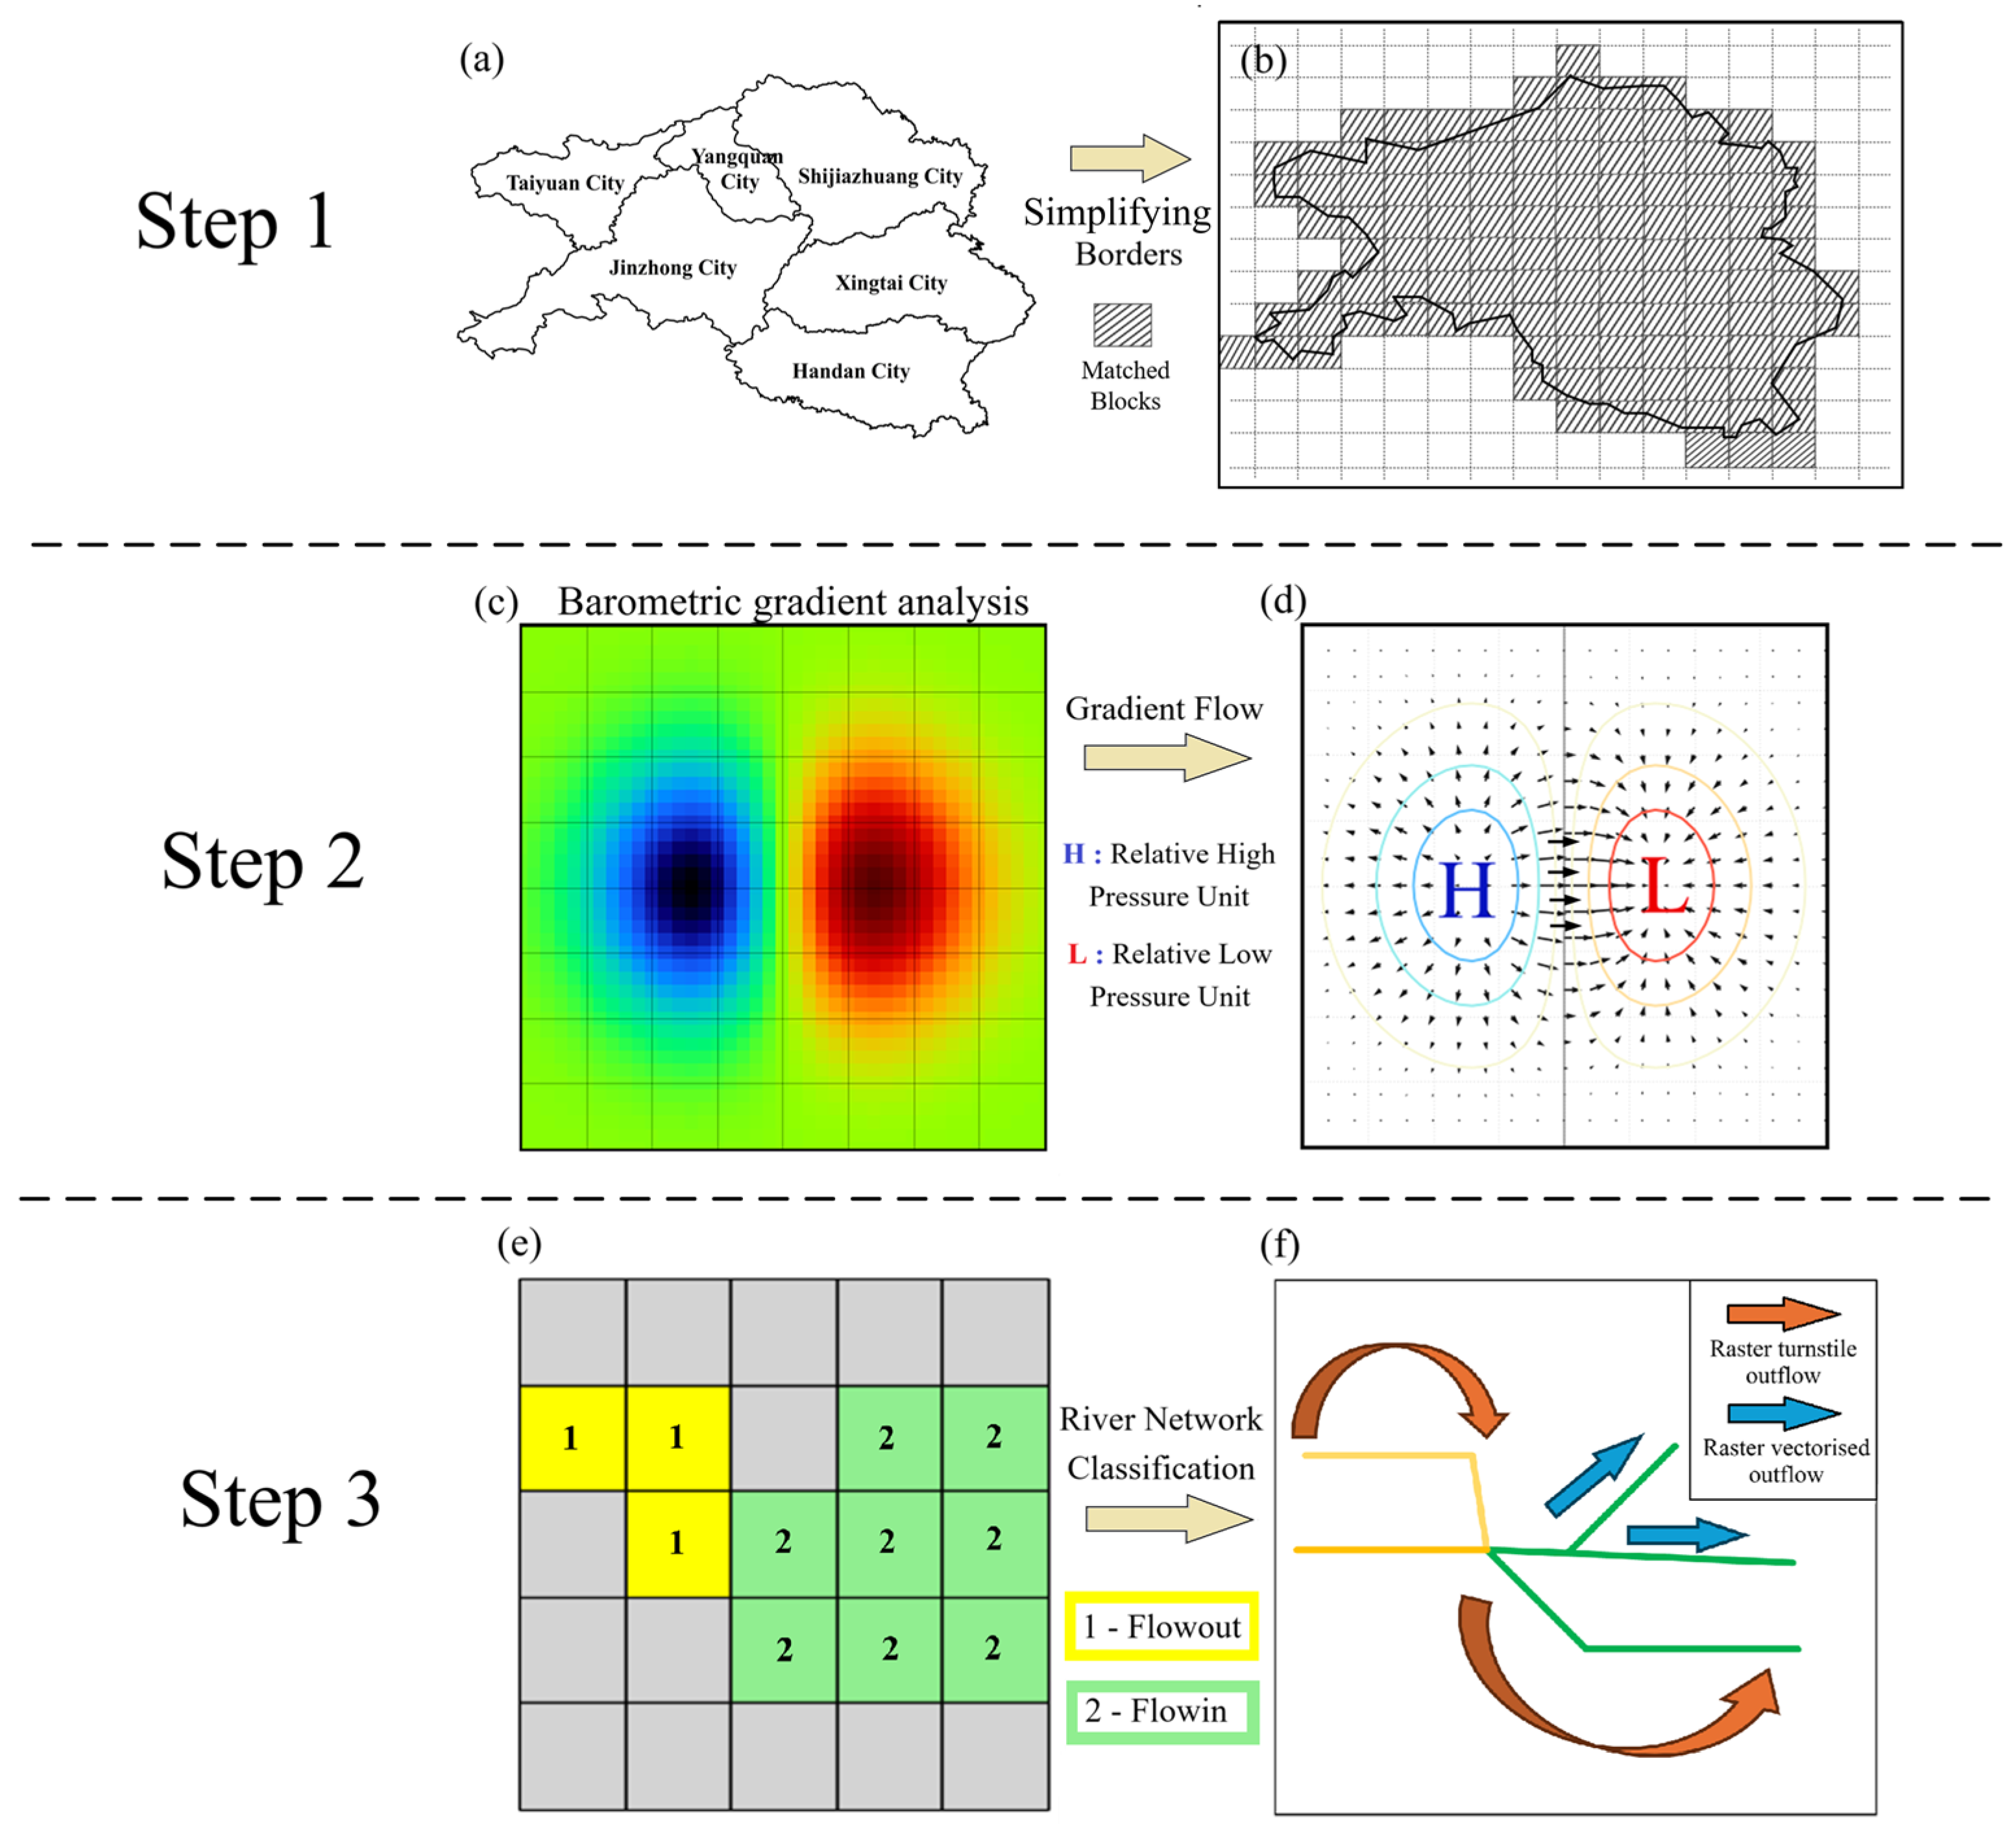
The WRF (weather research and forecasting) model is a fully compressible, non-hydrostatic mesoscale atmospheric numerical model used for simulating pollution processes [27]. The simulation domain is centered at 37°55′ N, 113°51′ E, covering a period from 3–18 December 2021, for a total of 360 h. The nested grid configuration of the WRF model is depicted in Figure 2; the grid resolution was 27 km, 9 km, and 3 km; and the innermost grid was selected. The parameterization schemes selected for microphysical processes include the WSM3 simple ice scheme, the Monin–Obukhov near-surface layer scheme, the YSU boundary layer scheme, the Grell three-dimensional cumulus cloud parameterization scheme, and the thermal diffusion scheme. Relevant studies have demonstrated that these modeling schemes can be effectively applied to regions with complex terrain and pollution transport dynamics, enabling improved simulations of atmospheric dynamics and thermodynamic processes. For instance, the WSM Type 3 scheme has been shown to perform well in simulating cloud formation and precipitation processes [28]. Additionally, Zhang et al. found that the YSU scheme exhibits high accuracy in simulating boundary layer processes in regions with complex topography, making it particularly suitable for applications in mountainous terrain [29].
This study utilizes the output data from the WRF model to drive the HYSPLIT 4.0 model (Hybrid Single Particle Lagrangian Integrated Trajectory Model, Version 4). The model was jointly developed by the National Oceanic and Atmospheric Administration (NOAA) and the Australian Bureau of Meteorology (BOM) to calculate and analyze the transport and dispersion trajectories of atmospheric pollutants. The Lagrangian–Eulerian hybrid model, developed by NOAA and BOM, is specifically designed for trajectory calculations using the Lagrangian framework and has been widely employed in pollutant source tracing studies [30,31,32]. The WRF-HYSPLIT model was used to perform backward trajectory simulations for 48 h per day from December 8 to 13, 2021. Particle release occurred at 00:00 UTC each day, with a temporal resolution of 6 h. The initial release height of the trajectory was set at 100 m, and the release points were chosen as the central locations of six cities: Shijiazhuang (38.04° N, 114.50° E), Handan (36.62° N, 114.53° E), Xingtai (37.05° N, 114.49° E), Taiyuan (37.86° N, 112.54° E), Yangquan (37.85° N, 113.57° E), and Jinzhong (37.68° N, 112.74° E).

2.3. APTQM-PM2.5

The turbulent kinetic energy of pollutants is a key focus in atmospheric pollution transport studies. In this study, the APTQM was utilized in conjunction with statistical indicators related to PM2.5 concentration quality criteria to develop a geographic pixel-level transport model for PM2.5 (APTQM-PM2.5). This model aims to refine the characterization of pollutant flow direction within the target study area. Building on this framework, the APTQM-PM2.5 model further enhances the spatial distribution analysis of pollutants and their transport pathways. Additionally, it dynamically adjusts pollutant transport trajectories and velocities in response to variations in PM2.5 concentrations, thereby improving the accuracy of pollution transport simulations.
Figure 3 shows the main modeling steps of APTQM-PM2.5 as follows:
(1)
Geographic framework construction and initial flow assignment
The geographic boundaries of the study area were simplified and aligned with corresponding block areas to construct a well-defined geographic framework (as shown in Figure 3a,b). The numerical simulation results of the near-surface barometric pressure field were utilized as the initial flow values for each grid cell. Additionally, gridded PM2.5 concentration values were introduced as a weighting factor to refine the model. This coefficient effectively captures the spatial distribution of pollutant concentrations across different regions, thereby enhancing the accuracy of pollutant transport simulations. Furthermore, outliers and missing values in the dataset were addressed through appropriate data imputation techniques to ensure the integrity and reliability of the analysis.
(2)
Gradient analysis and airflow direction division
To facilitate gradient analysis, the average raster criterion value was set to the national secondary concentration limit of 75 μg/m3 for this study. This standard threshold can be further refined based on simulated barometric field parameters and target pollutant control criteria, allowing adaptation to different research objectives and environmental conditions.
Then, to capture the dynamic variations in the barotropic field, airflow direction was determined using gradient analysis. Specifically, the maximum pressure difference across eight directional axes within a geographic pixel-level cell was identified to delineate airflow trajectories. For flow analysis and classification, this study defined high-value grids as primary pollutant outflow areas and low-value grids as pollutant inflow areas, as illustrated in Figure 3c,d. This classification approach effectively identifies major pollutant transport pathways and potential pollution sources, providing a robust framework for understanding regional pollutant dispersion patterns.
(3)
River network classification and flow intensity analysis
The classification results were further analyzed using river network analysis to visualize local pollutant transport pathways and quantify pollution contributions. As illustrated in Figure 3e,f, the river network analysis effectively reveals the primary pollutant transport trajectories from emission sources to receptor points. In the visualization, the yellow trunk lines represent major pollution transport pathways, while the green branch lines indicate secondary transport routes. Upon reaching the confluence hub, the primary pollutant flow begins to bifurcate, forming multiple transmission channels that facilitate pollutant dispersion across the region.
This analytical approach enhances the understanding of pollution propagation dynamics by identifying critical transport corridors and key emission–receptor relationships, thereby providing a foundation for targeted pollution mitigation strategies.

3. Analysis of Results

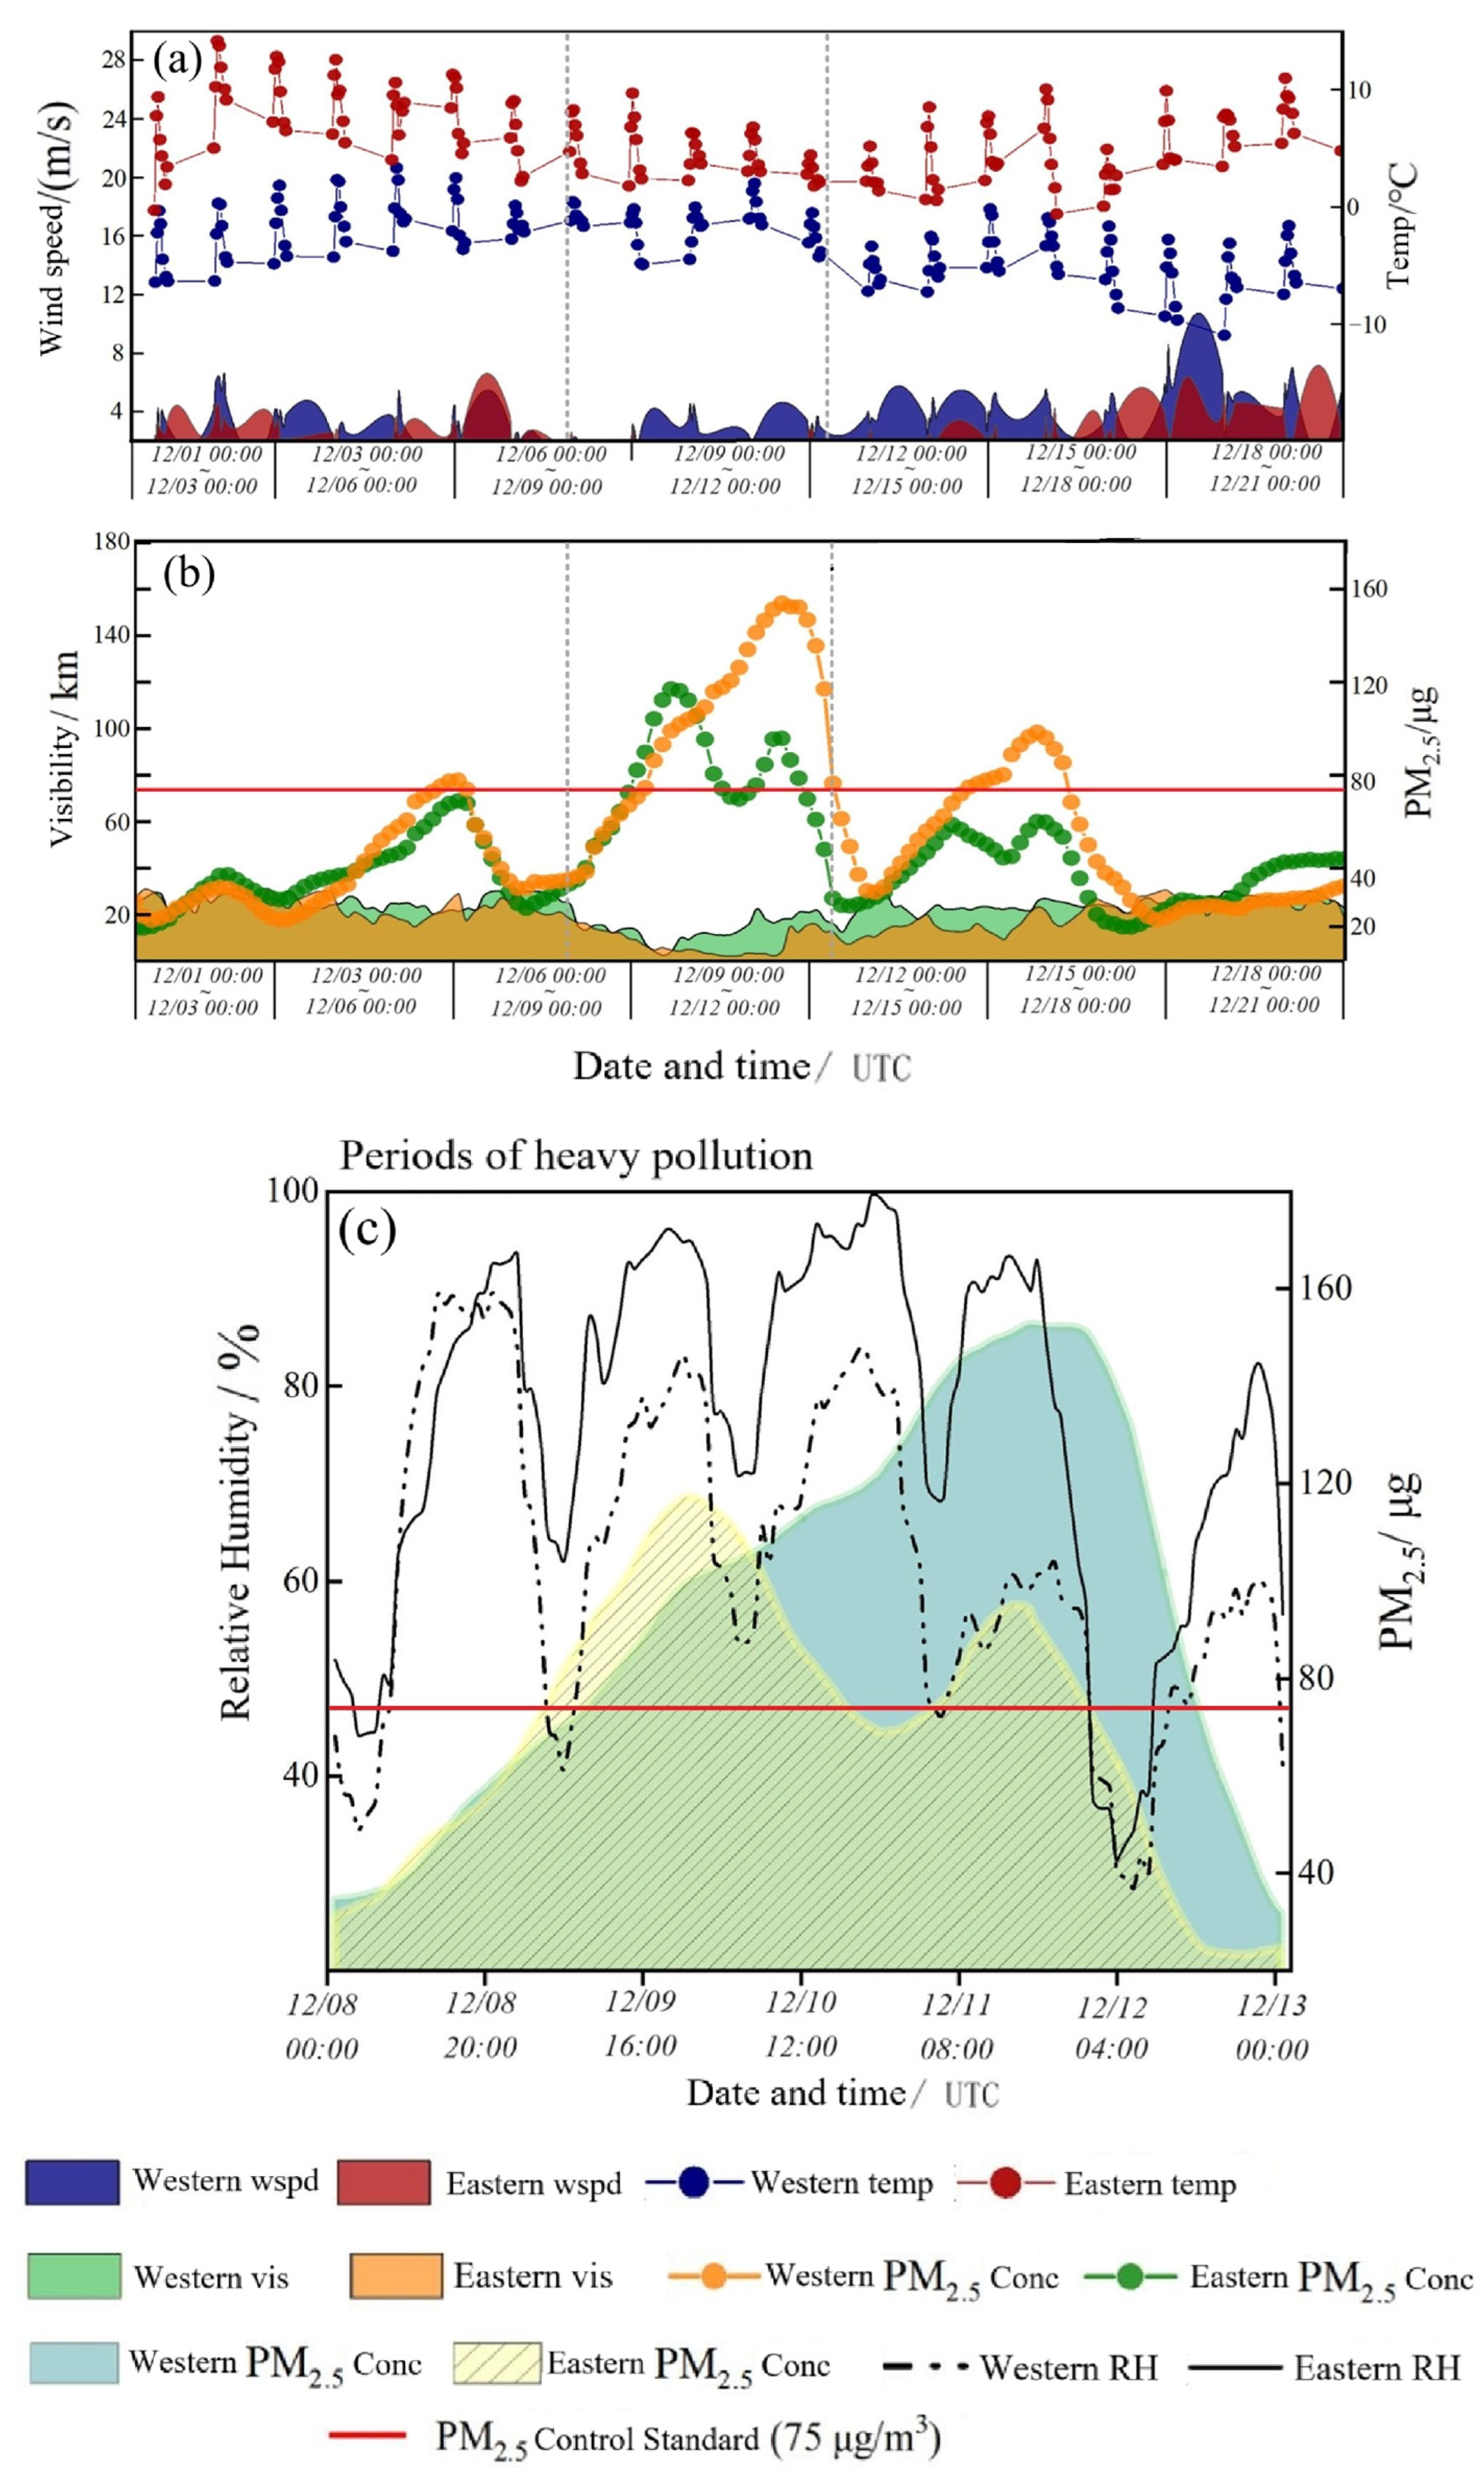
3.1. Heavy Pollution Processes Analysis

In December 2021, the urban agglomeration in the CTHM experienced a period of severe PM2.5 pollution. Figure 4 presents the hourly variation curves of PM2.5 mass concentrations and related meteorological factors in this region during December 2021. As shown, PM2.5 concentrations underwent three significant fluctuations during this period, with the average concentration during the second peak and valley phase (8–13 December) significantly exceeding the national standard, confirming the presence of heavy pollution during this time. Concentration changes in the western region displayed a “double-peak, double-trough” pattern, while the eastern region exhibited a “single-peak, single-trough” pattern. At the onset of the pollution event, concentrations in both regions showed an upward trend, with levels exceeding the 75 μg/m3 warning threshold for the first time at 18:00 on 9 December. The western region reached its first peak within the following six hours, with an average concentration as high as 118.7 μg/m3, whereas the eastern region peaked at 15:00 on 11 December, reaching 156 μg/m3. After the peak, PM2.5 concentrations in the western region began to decline, with a brief trough at 00:00 on 11 December, when concentrations temporarily dropped below 70 μg/m3, followed by a resurgence three hours later. By 12:00, a second smaller peak emerged in the west, with concentrations around 152 μg/m3. Afterward, both regions entered a declining phase, with pollution concentrations dropping below 40 μg/m3 by 00:00 on 13 December, reaching the national secondary air quality standards, thus marking the end of this heavy pollution episode.
The occurrence of this severe pollution event is closely associated with the low mixing layer and the stable atmospheric conditions characteristic of winter. A low mixing layer restricts the vertical dispersion of pollutants, leading to their accumulation near the surface [33]. PM2.5 concentrations typically peak at night due to increased atmospheric stability, whereas during the daytime, as the mixing layer rises and vertical exchange intensifies, pollution levels gradually decline [34]. Local meteorological conditions play a crucial role in regulating pollutant concentration dynamics and influencing the formation, persistence, and dissipation of pollution episodes. In addition to wind field patterns, various natural factors—including surface temperature, precipitation and regional topography—have been shown to significantly impact PM2.5 concentrations and transport processes [35,36,37]. Understanding these interactions is essential for developing effective pollution mitigation strategies in complex terrain regions.
As seen in Figure 4b, visibility in the eastern region is slightly lower than in the west. Meanwhile, combining with Table 1, it can be seen that the mean relative humidity accelerates the formation of secondary particulate matter and promotes the hygroscopic growth of particles, thereby exacerbating PM2.5 pollution. Regarding temperature, the hourly mean temperature showed a weak negative correlation with PM2.5 concentration in the eastern region (r = −0.2573), whereas it showed a positive correlation in the western region (r = 0.30). Since the study period was during the winter in the northern hemisphere, the average temperature in the CTHM was below 10 °C. The cold environment reduced atmospheric diffusivity and dilution, facilitating the persistence of heavy pollution episodes. The effect of wind speed on PM2.5 concentration is more complex. In the western region, the regional average wind speed was significantly negatively correlated with PM2.5 concentration due to the lesser influence of topography. In contrast, the eastern region showed a weak correlation due to complex topography and low wind field stability. Higher wind speeds promote purification at low pollutant concentrations, whereas they may increase the contribution of external pollutants at higher concentrations. Complex topography exerts both kinetic and thermal effects on meteorological elements, influencing the dispersion trajectories of pollutant particles to some extent. Among them, Yangquan City, as a trans-valley city, experiences higher surface wind speeds, making localized pollutant accumulation less likely. In contrast, Taiyuan City, located in the northern part of the basin in the Outer Pass, has a narrow, elongated topographic contour and sits in the eastern foothills of the Taiyuan Basin. With high topography to the east, lower topography to the west, and substantial elevation differences, pollutants tend to accumulate at the valley floor. This accumulation is exacerbated by the topographically induced valley wind effect and high rates of near-surface radiative cooling during the winter season [38,39].
In summary, key meteorological and topographical factors, including local precipitation, air temperature, wind speed, and terrain, play a critical role in influencing the formation, transformation, transport pathways, and aggregation dynamics of PM2.5.

3.2. Numerical Simulation Results Analysis
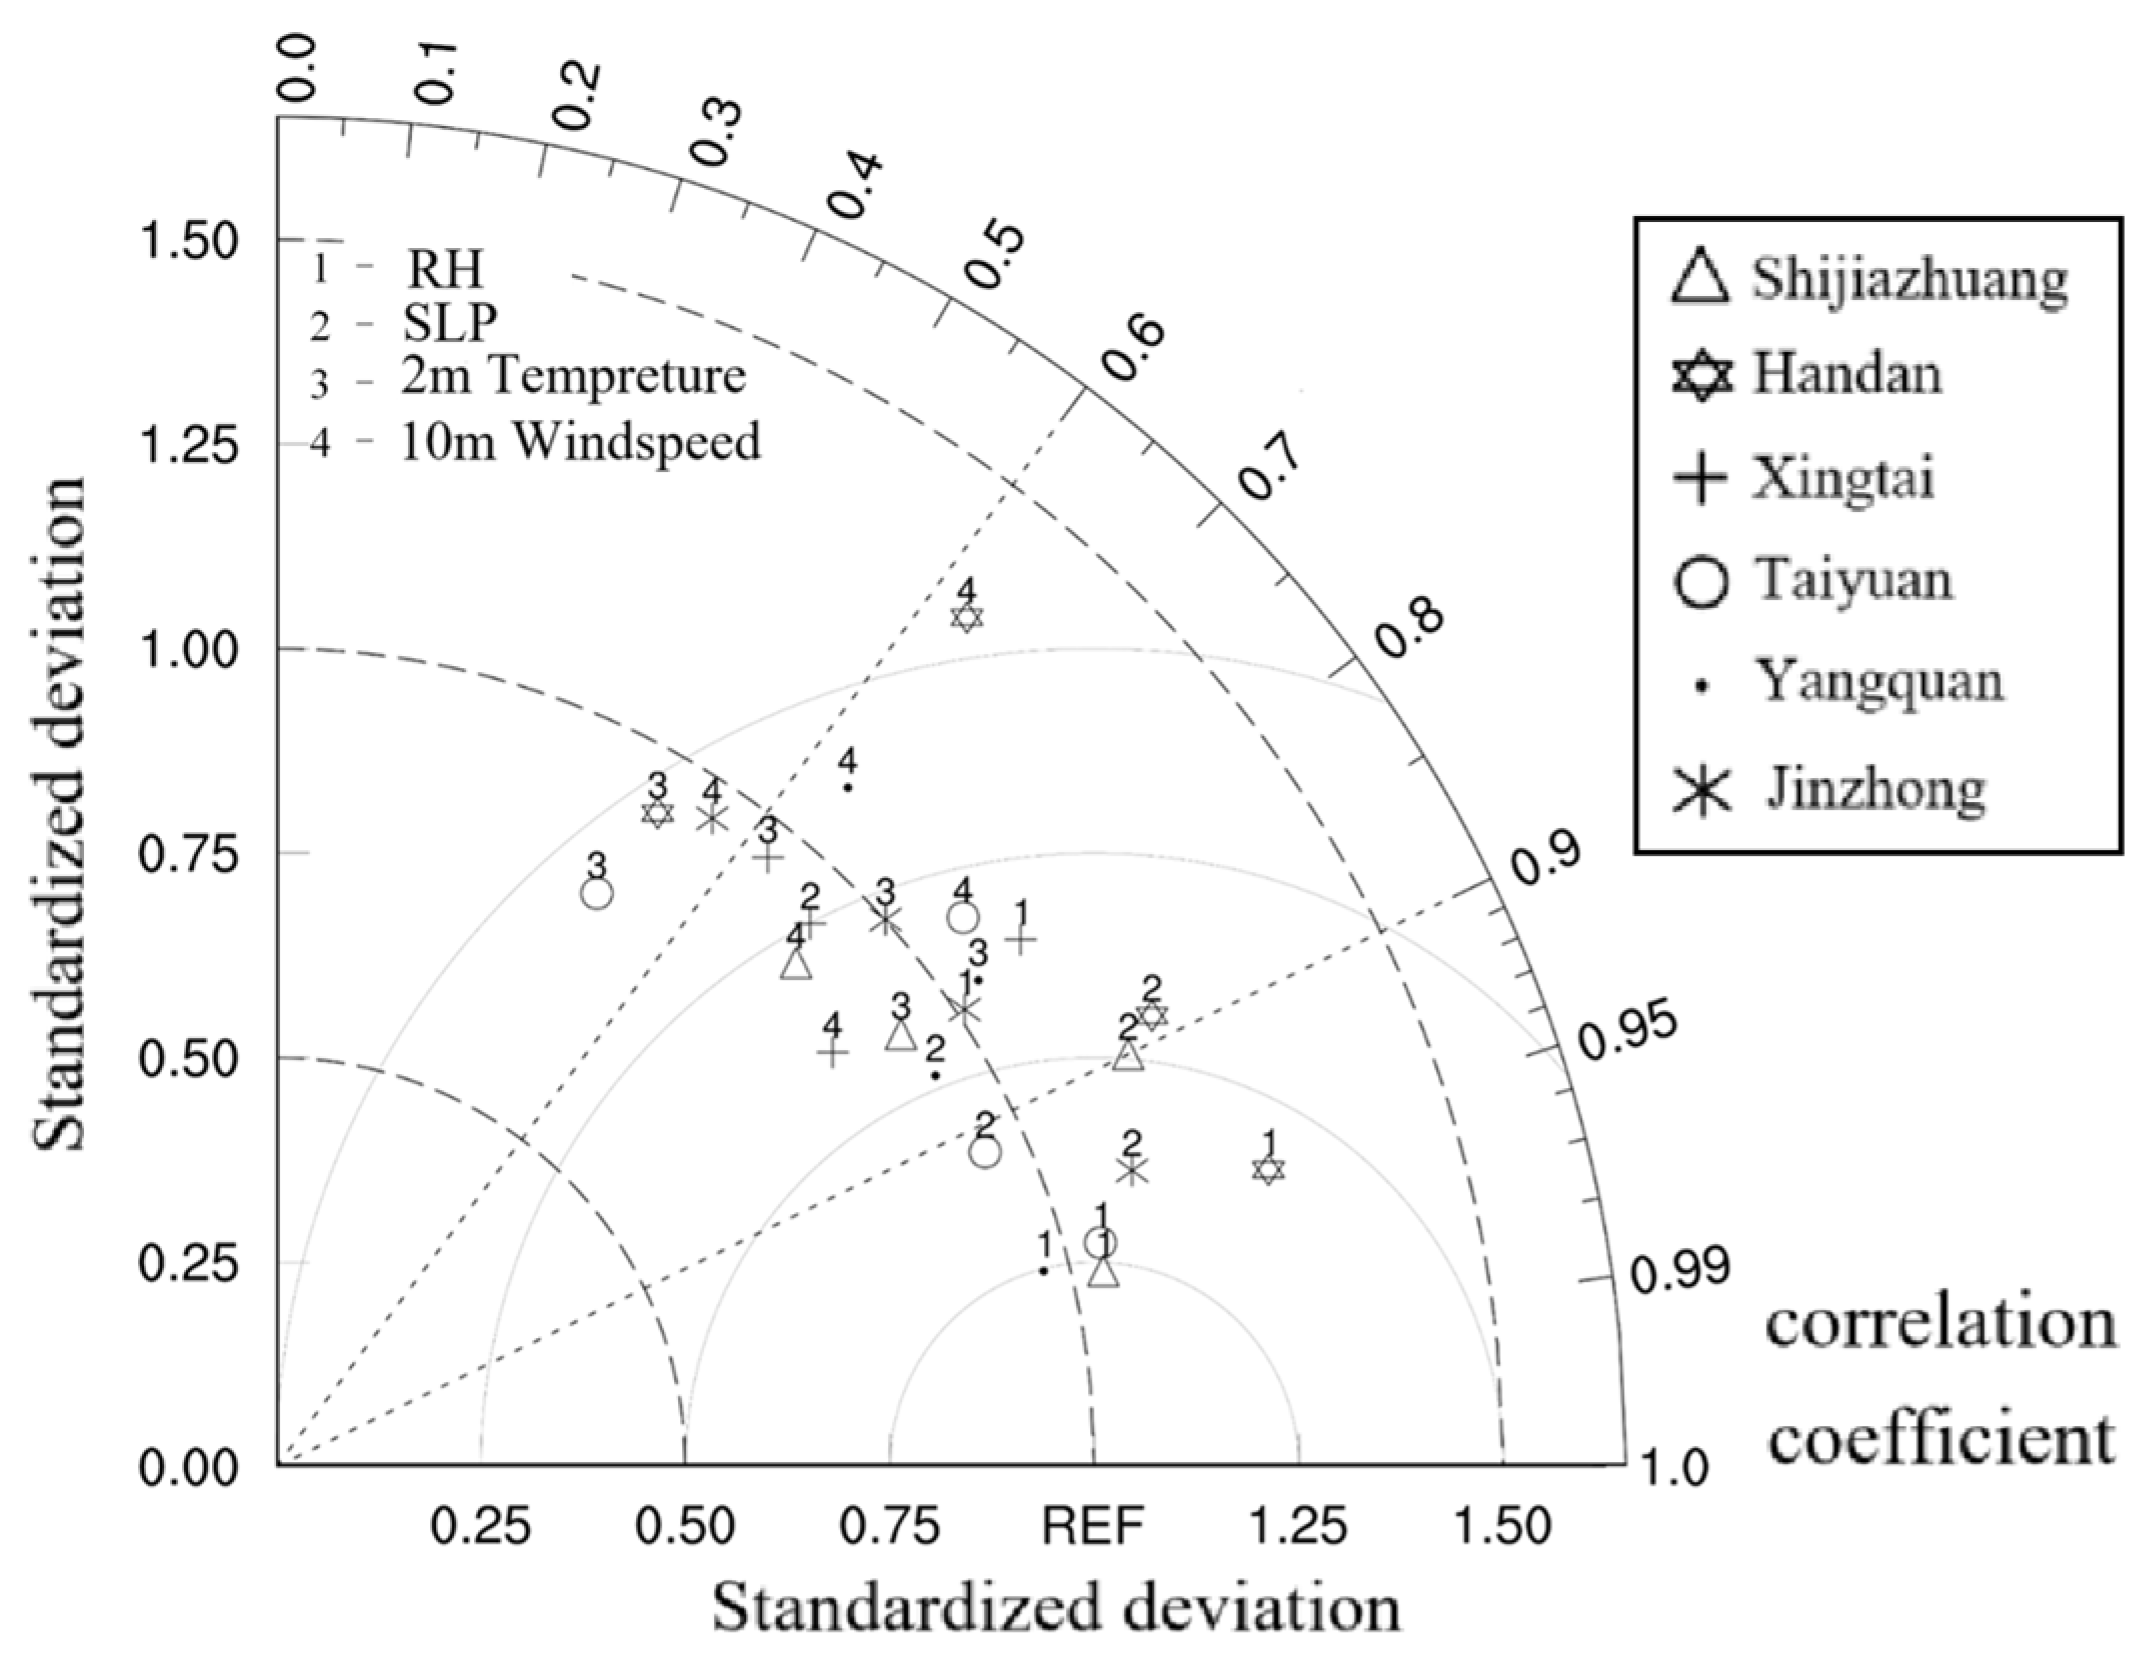
(1)
Evaluation of WRF model simulation results
During the simulation, surface temperature and relative humidity were the primary variables simulated and adjusted. The output results were then compared against the observational data from various cities, and correlation Taylor diagrams were plotted. In these diagrams, the fan arc represents the correlation coefficient, the solid line denotes the ratio of standard deviations, and the distance marked “REF” corresponds to the normalized root-mean-square error. The evaluation results are shown in Figure 5. Based on the standardized deviation, significance test (correlation coefficient of 0.002), and root-mean-square error, the simulated data closely align with the ground-based measurements. This indicates that the WRF model effectively simulates the meteorological conditions in CTHM.
(2)
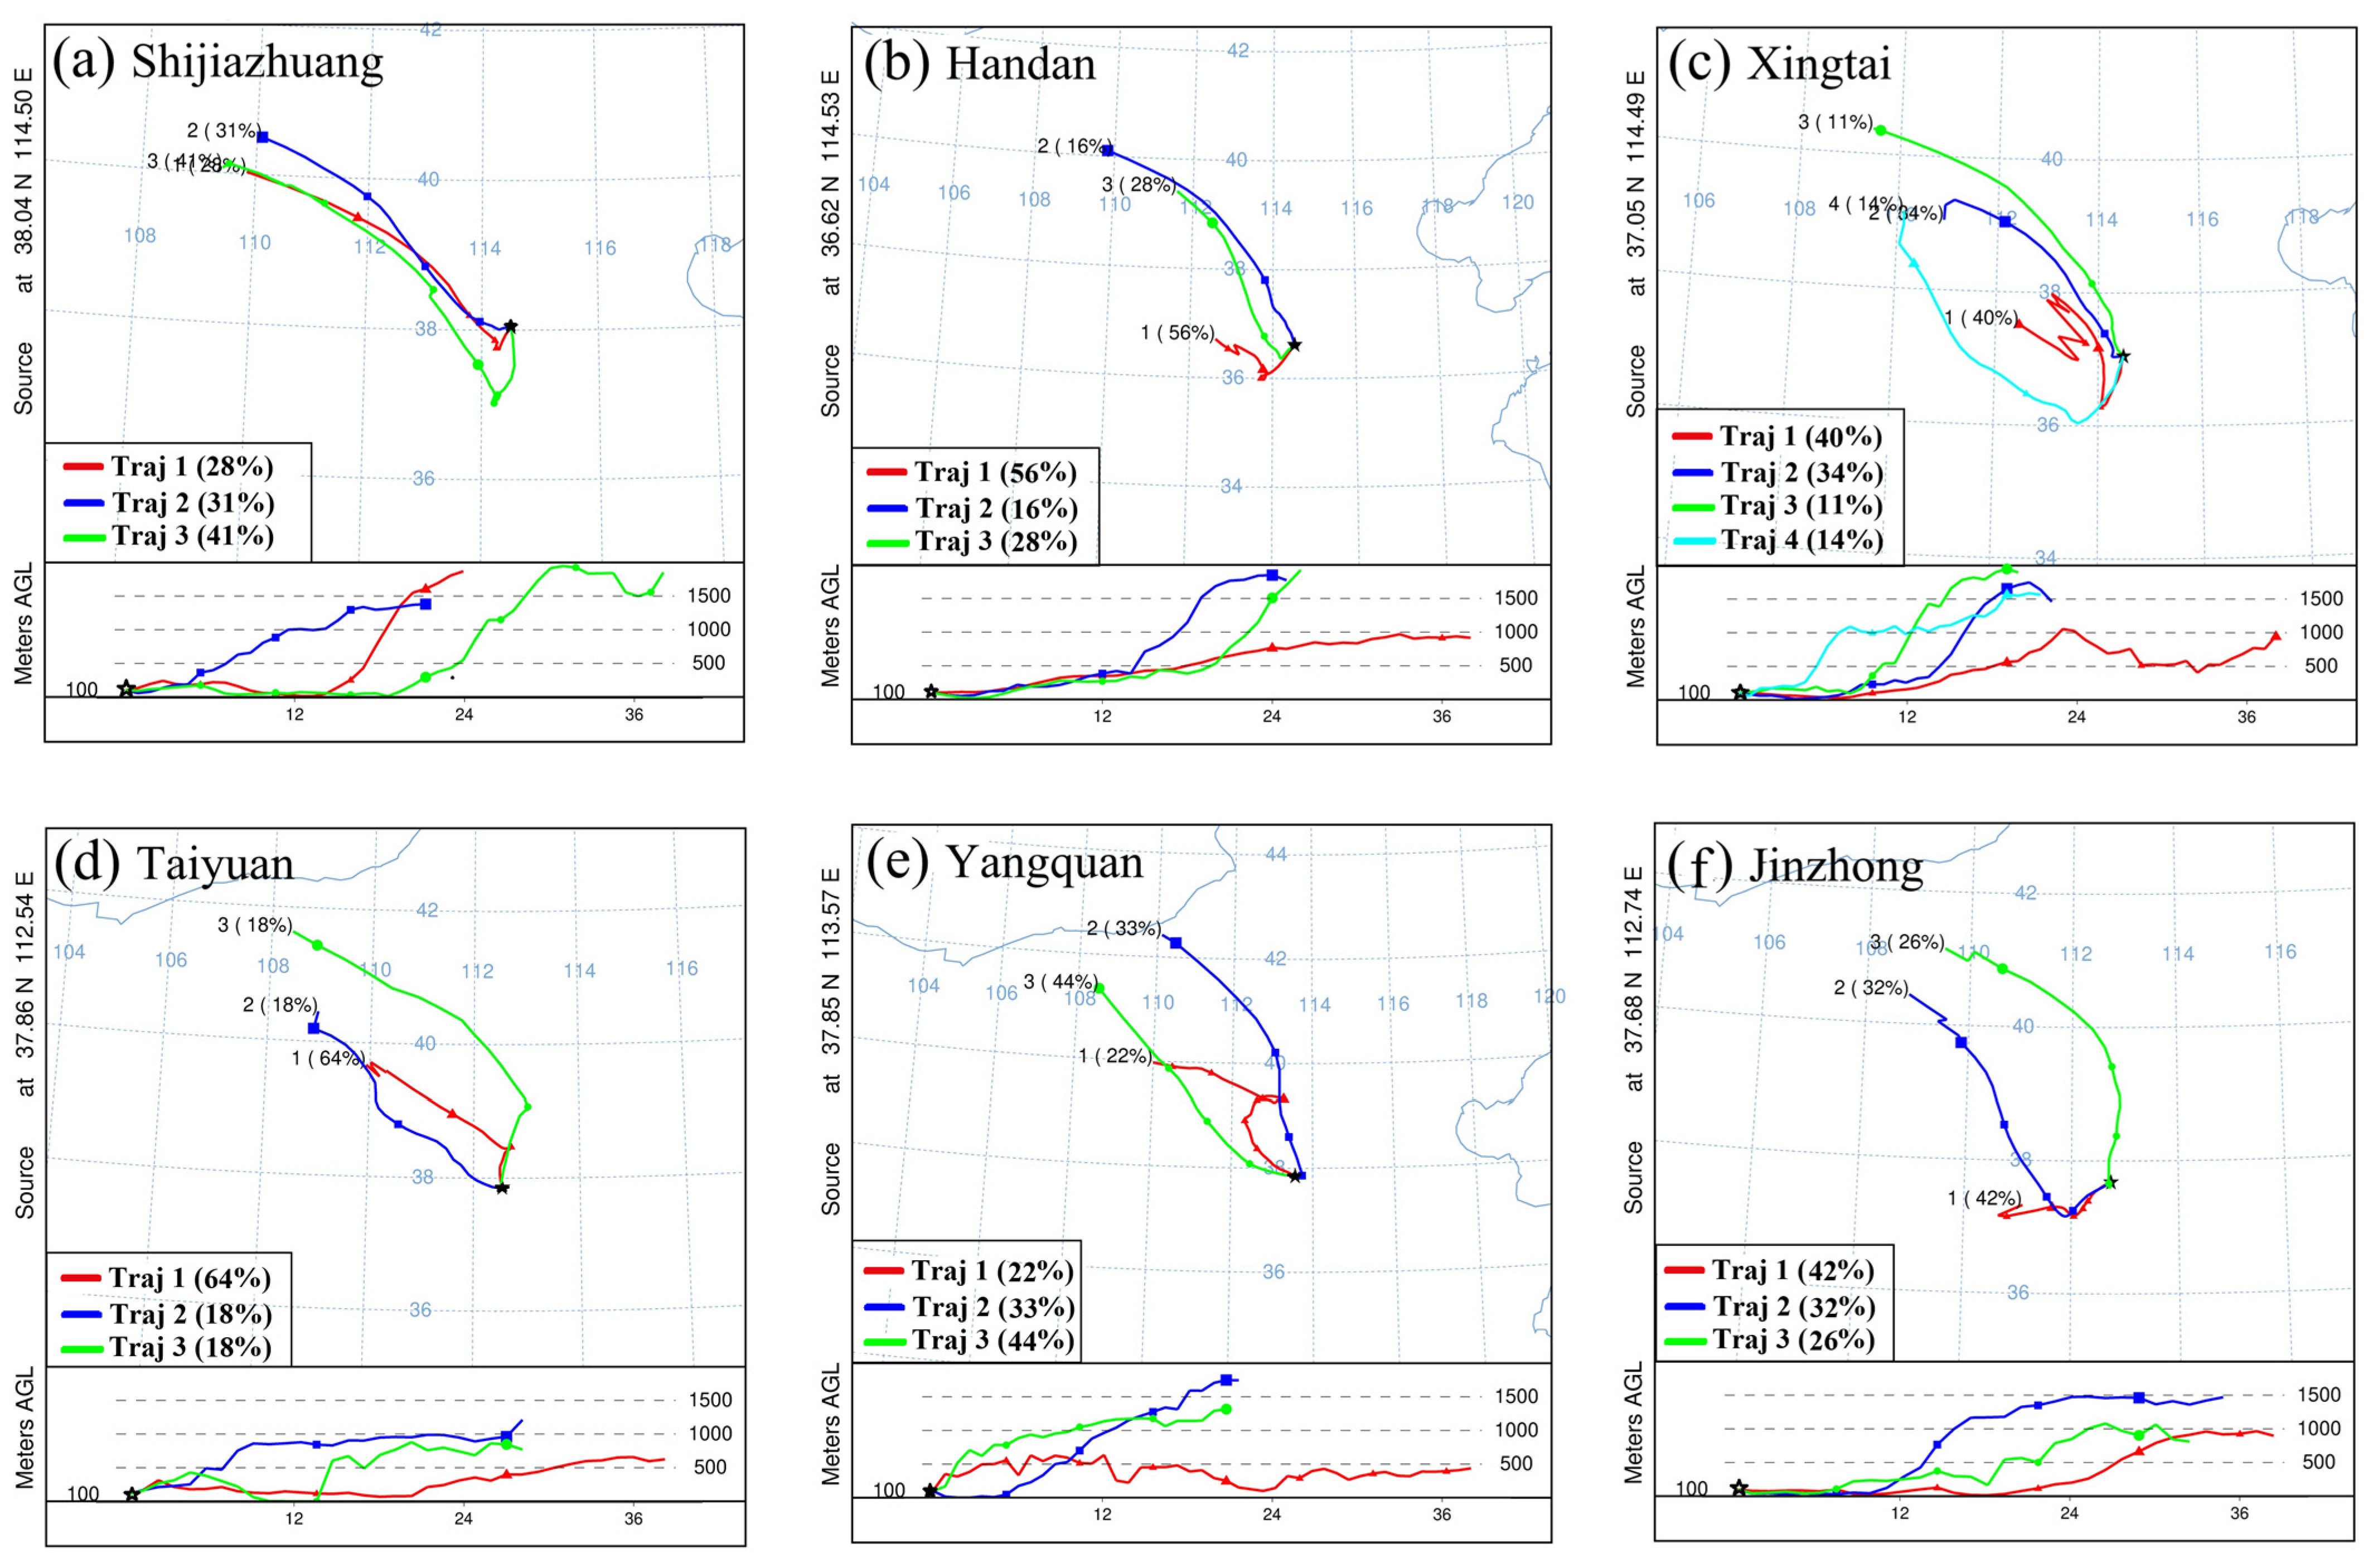
Analysis of HYSPLIT simulation results
The airflow trajectories and their spatial distribution characteristics for the city clusters in CTHM during the heavy pollution period were analyzed using the WRF-HYSPLIT model, as shown in Figure 6. Based on the spatial similarity of air mass trajectories, the daily backward 48 h trajectories of major cities on both sides of the central were grouped and clustered, as presented in Table 2.
The clustering results show that during the pollution period, the airflow in the eastern region mainly originated from the northwest and west, accounting for 68% and 32%, respectively (e.g., Figure 6a–f). Airflow from Inner Mongolia, Shanxi, and Henan into Hebei Province contributed significantly to the trajectories. The speed of air mass movement is closely related to the length of the trajectories, with fast-moving air masses forming long-distance transport trajectories. These trajectories indicate that air masses move from northwest to southeast, and the northwesterly airflow is blocked over the Taihang Mountains, forming subsidence airflow in the eastern region. This subsidence leads to a continuous rise in pollution concentrations in cities located near the Taihang Mountains, eventually resulting in pollution in Hebei Province. Meanwhile, air masses from Shanxi Province to Hebei Province represent short-range transport, crossing the Taihang Mountains. Due to the slower speed and longer residence time of these air masses, they contribute to pollution accumulation.
In the western region, the main pollutant transport path involves short-range transport from Shaanxi to Shanxi Province or from Henan to Shanxi Province, accounting for 43% of the total trajectories (e.g., Figure 6d–f). This pathway is influenced by westerly air currents, particularly those passing through industrial areas in Shanxi Province, where dense populations and developed industries contribute to higher anthropogenic pollution emissions. Poor diffusion conditions further exacerbate pollutant accumulation. Additionally, a northwesterly airflow from Inner Mongolia passes through northern Shaanxi to reach Shanxi Province, representing long-distance transport and accounting for approximately 31.3% of the total. Although these trajectories carry fewer air masses, they converge with the dominant transport pathway near Ordos City in Inner Mongolia, further contributing to pollution concentration. The topography of the Taiyuan Basin hinders airflow transport in the western region, causing pollutants to recirculate within the basin. This restricts diffusion and dilution, thereby increasing the likelihood of persistent regional pollution events.

3.3. Analysis of the Circulation Situation During Heavy Pollution

Atmospheric circulation plays a crucial role in the climate system, governing energy exchange, water vapor transport, and other essential atmospheric processes. To examine the evolution of upper-air circulation patterns during the heavy pollution episode and their correlation with the pressure field, wind field, and vertical airflow dynamics, a comprehensive analysis was conducted. Building upon the findings from Section 3.1, three representative time points were selected for analysis: the initial stage of pollution (00:00 on 9 December), the peak pollution phase (00:00 on 11 December), and the pollution dissipation stage (00:00 on 13 December). Through synchronized numerical simulations, this study assesses the distinct influences of upper-air circulation and vertical transport processes on PM2.5 concentrations at each stage of the pollution event.
(1)
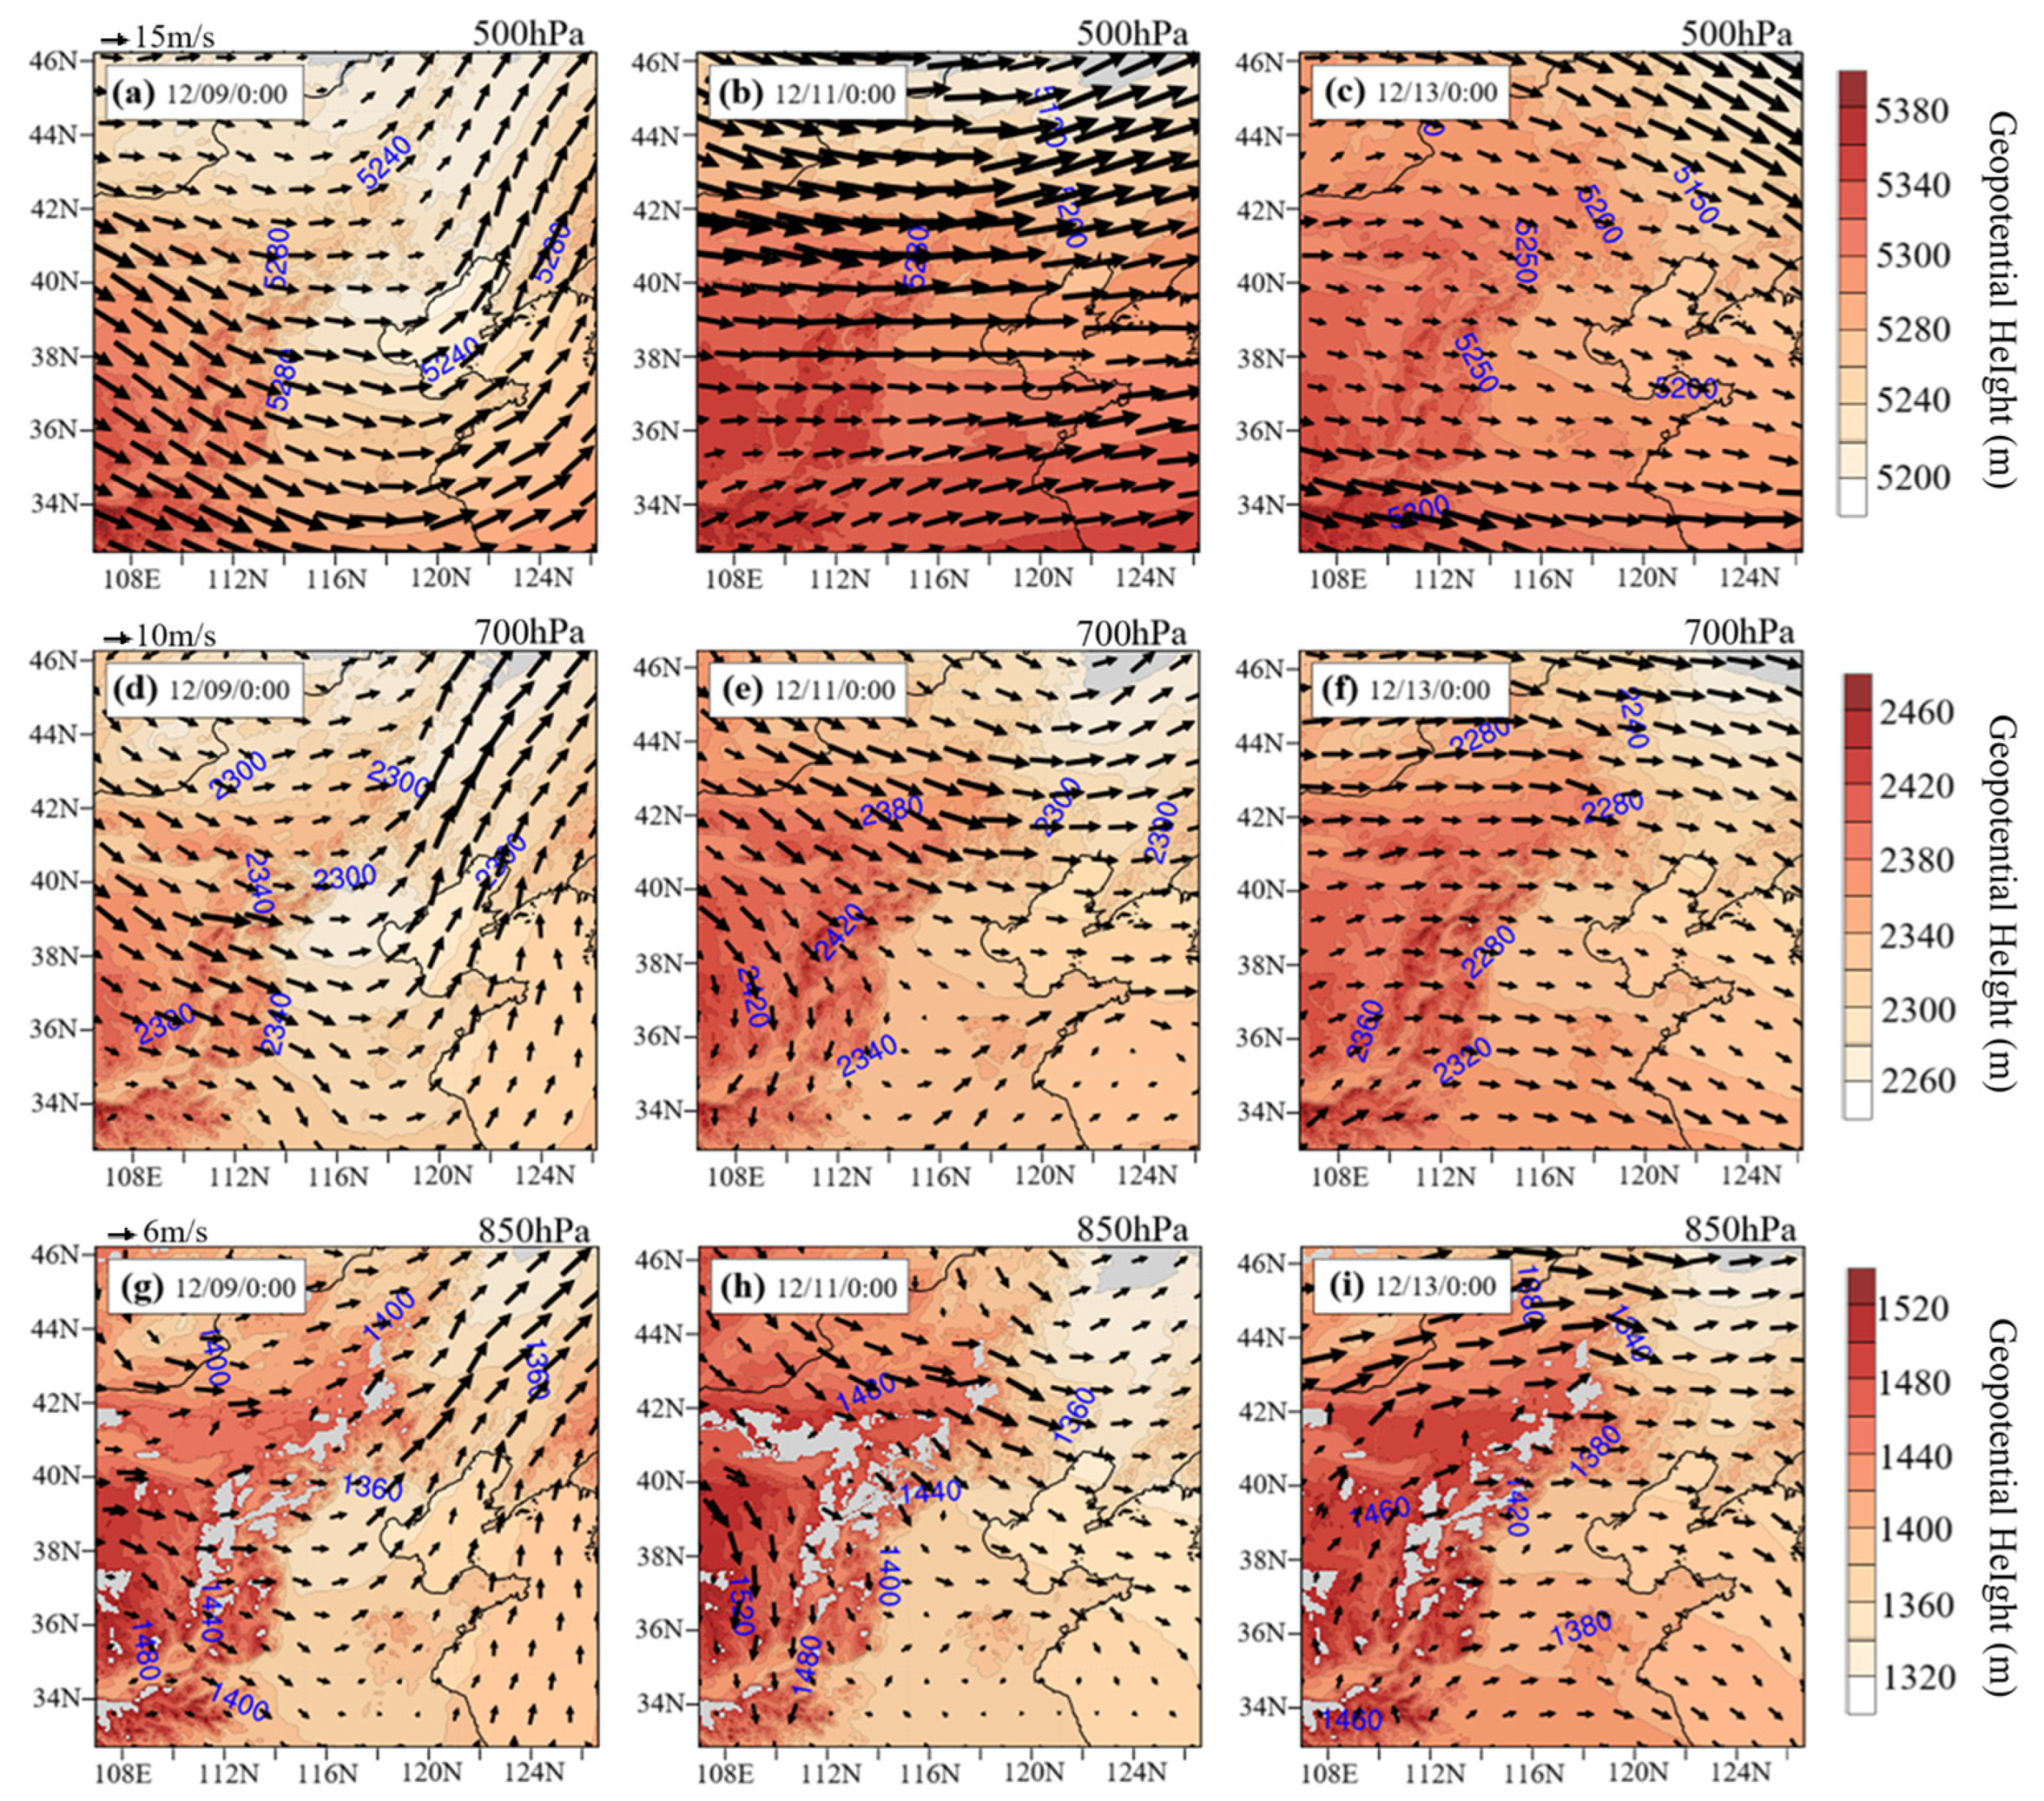
High-altitude horizontal circulation
As shown in Figure 7, the early stage of pollution development was characterized by relatively flat and straight airflow at high altitudes [40]. The North China Plain was influenced by weak high pressure, with a low-pressure center located at the junction of Zhangjiakou and Inner Mongolia. The study area, situated behind the low-pressure trough, exhibited a pressure gradient with higher pressure in the south and lower pressure in the north. The dominant airflow patterns included westward transport from Inner Mongolia and Shaanxi Province and northward transport from southern regions. However, in the Fen River Valley, the airflow was influenced by topography, leading to pollutant dispersion toward the eastern region.
The 500 hPa chart (Figure 7a–c) indicates that the low-pressure center moved northward and weakened, resulting in a significant increase in air pressure over the study area. Despite this, relatively high pressure persisted in the Fen River Valley and at the junction of southern Hebei and Henan (southern of Handan). At the 700 hPa level (Figure 7d–f), the pressure gradient shifted northeastward, the influence of the Siberian trough diminished, and the isobars became smoother. Compared to the 500 hPa level, the overall pressure changes at 700 hPa was more pronounced, showing a gradual increase in potential heights. At 850 hPa (Figure 7h), by 00:00 on 11 December, the northwest low-pressure trough had dissipated, and a low-pressure center had formed at the junction of Beijing, Tianjin, Hebei, and Liaoning. Under the influence of upper-air circulation, the CTHM were predominantly affected by westerly, northwesterly, and partially southwesterly airflow during the pollution period. Pollutants were transported from the southwest to the northeast due to regional low-pressure gradients, leading to poor dispersion conditions and a clear trend of pollution intensification.
During the pollution dissipation phase, the high-altitude flow field exhibited a mixed circulation pattern, combining both straight and rotating air currents. From December 13 onward, the high-pressure center shifted southwestward, and its spatial extent contracted. As Figure 7i indicates, the presence of a high-pressure center over central Shaanxi and Inner Mongolia, which restricted vertical atmospheric exchange, thereby hindering pollutant dispersion.
(2)
Vertical circulation changes
Vertical circulation characteristics and temperature distribution play a crucial role in determining atmospheric stability, directly influencing the intensity of turbulent activity and, consequently, the dispersion of pollutants [41,42,43]. Figure 8 illustrates the vertical circulation patterns at different stages of this heavy pollution episode and their impact on pollutant transport.
During the initial stage of pollution (Figure 8a), the pseudo-equivalent potential temperature (θse) in the lower atmosphere is relatively low, creating thermal instability within the atmospheric boundary layer. This instability is accompanied by strong vertical upward motion, which facilitates the vertical diffusion of pollutants and provides favorable conditions for their initial dispersion. As the pollution event progresses into the middle stage (Figure 8b), θse in the mid-atmosphere increases significantly, while the vertical uplift rate weakens, leading to a more stable atmospheric stratification. This stability suppresses turbulent activity and inhibits vertical diffusion, causing pollutants to accumulate in the mid-atmosphere and resulting in peak pollution levels.
In the later stage of pollution (Figure 8c), θse increases in the upper atmosphere, and the vertical uplift rate strengthens once again, leading to renewed atmospheric instability. This change enhances vertical pollutant dispersion and promotes regional transport, ultimately facilitating pollutant dilution and removal.

3.4. Analysis of APTQM-PM2.5 Results

Figure 9 depicts the cumulative transport of PM2.5 pollution within the study area during periods of severe pollution. The pollution gradient levels were classified on a scale from 0 to 4, with level 4 representing the center of relatively high pressure, indicating the primary source of significant pollution.
As shown in Figure 9, extensive high-pressure systems were observed over central Inner Mongolia, southern Shanxi Province, and central Shaanxi Province during the study period. These regions served as the primary PM2.5 pollution source areas, located in the northwest and southern directions relative to the study area. Among them, the high-pressure center over Ordos City (Inner Mongolia) was identified as a key pollution source in the northwest. Specifically, the western side of the Taihang Mountains, including the urban agglomerations of Taiyuan, Jinzhong, and Yangquan, exhibited higher pollution levels and stronger pollution sources. This trend is likely attributed to localized emissions from industrial activities and vehicular traffic. In contrast, the eastern urban agglomerations displayed lower overall pollution concentrations, with pollutants predominantly transported from the higher concentration zones in the west toward the relatively cleaner eastern areas.
For the western urban agglomerations, extensive horizontal source regions were identified in northern and central Shanxi Province. Pollutants transported from Inner Mongolia into Shanxi Province converged in northern Shanxi before dispersing along short-range transport pathways toward the southwest, east, and southeast. In the eastern region, pollutant transport pathways primarily originated from Inner Mongolia (Chifeng and Tongliao), moving southward into northern Hebei Province (Zhangjiakou area) before flowing into the eastern urban agglomerations. Additionally, pollutants from the western urban agglomerations were transported eastward across the Taihang Mountains into the eastern urban centers.
Beyond these primary transport corridors, a portion of the airflow from Shaanxi Province carried pollutants northeastward into Shandong Province. As the transport intensity weakened, these pollutants entered the eastern urban agglomerations via the southern border of Hebei Province, forming a long-distance transport pathway. During the heavy pollution period, the eastern region primarily experienced pollution inflow, while the western region functioned as a pollution outflow zone, aligning with the upstream sources of the major transport corridors on both sides of the Taihang Mountains. In addition to these dominant pollution transport routes, air currents originating from Shaanxi Province and adjacent regions also played a significant role. Some pollutants traveled through Shandong Province in a northwesterly direction, gradually weakening in intensity before entering the eastern urban agglomerations through southern Hebei. This movement formed a characteristic long-distance transport pathway, further contributing to regional pollution dynamics.

4. Conclusions

This study conducted an in-depth analysis of the causes and transport characteristics of winter PM2.5 heavy pollution events in the urban agglomeration of the CTHM, highlighting the intricate synergies between topography, meteorological conditions, and regional circulation patterns. The key findings are as follows:
(1) The complex topography of the Taihang Mountains plays a critical role in governing pollution transport dynamics. In the eastern cities (e.g., Shijiazhuang and Xingtai), pollutant accumulation was primarily driven by northwesterly airflow that was obstructed by the mountainous terrain. In contrast, the western cities (e.g., Taiyuan and Yangquan) were influenced by short-range pollutant transport from the Fen River Basin, compounded by stagnation effects within the basin circulation. Lateral river valleys serve as essential corridors for pollutant transport, facilitating cross-regional pollution exchange. Analysis revealed that 68% of PM2.5 in the eastern urban areas originated from northwesterly airflow, while 43% of the pollution in the western region resulted from local emissions and basin-induced circulation effects.
(2) Pollution accumulation and dissipation are strongly influenced by meteorological conditions. During pollution events, surface high-pressure ridges create an environment characterized by low temperatures, high humidity, and atmospheric stagnation, which facilitates the accumulation of PM2.5. Vertical circulation patterns further highlight the role of atmospheric stability in pollution dynamics. In the initial stages, convective instability enhances vertical dispersion, promoting pollutant dilution. However, as stratified stability develops, turbulent mixing is suppressed, leading to the accumulation of pollutants. In the later stages, increased upper-level convection enhances vertical exchange, facilitating pollutant removal and contributing to air quality improvement.
(3) In this study, a river network analysis module was integrated with the APTQM model to identify localized, small-scale (interplot) pollution transport pathways and pinpoint potential pollution source areas. The innovation of this approach lies in its integrated consideration of both atmospheric transport and hydrological diffusion effects on pollutant movement. This coupled analysis provides a more comprehensive understanding of the regional pollution process, offering high theoretical feasibility. It also effectively captures the characteristics of pollution transport and distribution in complex environments, enhancing the accuracy of pollution dynamics analysis.
(4) Using the WRF-HYSPLIT model, this study identified three primary pollution transport pathways: (1) a northwestern pathway from Inner Mongolia to Hebei, (2) a southwestern pathway following the Fen River Basin, and (3) a southward inflow pathway from Henan. These transport routes underscore the critical role of regional connectivity in the dispersion and accumulation of pollutants. Furthermore, APTQM-PM2.5 identified key pollution source regions, including Ordos and Chifeng in Inner Mongolia, as well as Taiyuan and the Fen River Basin. These findings provide a scientific basis for targeted air quality management strategies aimed at mitigating cross-regional pollution transport.
(5) Although the APTQM-PM2.5 framework effectively identifies local transport pathways and source regions, coupling with chemical transport models such as WRF-CHEM can further elucidate the role of aerosol chemistry, gas–particle interactions, and deposition mechanisms in pollutants dynamics. Such models are capable of accurately simulating the formation of secondary organic aerosols (SOAs) under high humidity and low temperature conditions. The integration of APTQM-PM2.5 with high-resolution emission tracers, particularly real-time industrial and vehicle data, can enhance the ability to resolve sources of pollution peaks. Future studies should focus on the interaction between river networks and aerosols, quantifying the effect of hydrological systems on particulate matter removal. Furthermore, the research emphasizes the need to develop regionally coordinated emission control strategies that take into account the topographic effects on pollution transport. Emission reductions in upstream pollution source areas (such as Ordos and Taiyuan) could effectively alleviate pollution in downstream eastern urban agglomerations.

Author Contributions

Writing—original draft, L.Y. and G.W.; methodology, L.Y.; software, G.W.; writing—review and editing, Y.M.; funding acquisition, Y.W. and Y.M.; formal analysis, visualization, L.Y.; data curation, X.Z. All authors have read and agreed to the published version of the manuscript.

Funding

This work was funded by “the Ministry of Science and Technology of China” (2022YFF0802501) and “National Natural Science Foundation of China” (41475094)”.

Institutional Review Board Statement

Not applicable.

Informed Consent Statement

Not applicable.

Data Availability Statement

Research data from this study will be made available on request (wanggj2015@nudt.edu.cn).

Acknowledgments

The authors sincerely appreciate the support of the support of the WRF (https://www.mmm.ucar.edu/models/wrf, last accessed on 15 June 2024) official website and HYSPLIT official website (https://www.arl.noaa.gov/hysplit/, last accessed on 18 June 2024) for providing model support, and the China Meteorological Administration (CMA) Open Data Platform (https://data.cma.cn/, last accessed on 18 June 2024), the National Centers for Environmental Prediction (NCEP) for providing the Final Operational Global Analysis data (FNL) provided by the National Center for Environmental Prediction (NCEP), PM2.5 real-time monitoring data from the National Urban Air Quality Real-Time Publishing Platform (NUAQRPP) datasets (https://air.cnemc.cn:18007, last accessed on 1 July 2024) of the National General Station of Environmental Monitoring (NGSEM) of China.

Conflicts of Interest

The authors declare to no conflicts of interest.

Abbreviations

The following abbreviations are used in this manuscript:
CTHMCentral of Taihang Mountains
APTQMAtmospheric Pollutant Transport Quantification Model
WRFWeather research and forecasting (WRF Model)
HYSPLITHybrid Single Particle Lagrangian Integrated Trajectory Model
NECPNational Centers for Environmental Prediction
FNLFinal Operational Global Analysis data
CMAThe China Meteorological Administration
NUAQRPPThe National Urban Air Quality Real-Time Publishing Platform
NGSEMThe National General Station of Environmental Monitoring

References

  1. Huang, H.; Jiang, P.; Chen, Y.X. Analysis of the Social and Economic Factors Influencing PM2.5 Emissions at the City Level in China. Sustainability 2023, 15, 16335. [Google Scholar] [CrossRef]
  2. McClellan, R.O. Providing Context for Ambient Particulate Matter and Estimates of Attributable Mortality. Risk Anal. 2016, 36, 1755–1765. [Google Scholar] [CrossRef] [PubMed]
  3. Liu, C.; Hu, H.; Zhou, S.; Chen, X.; Hu, Y.; Hu, J. Change of Composition, Source Contribution, and Oxidative Effects of Environmental PM2.5 in the Respiratory Tract. Environ. Sci. Technol. 2023, 57, 11605–11611. [Google Scholar] [CrossRef] [PubMed]
  4. Lall, R.; Ito, K.; Thurston, G.D. Distributed Lag Analyses of Daily Hospital Admissions and Source-Apportioned Fine Particle Air Pollution. Environ. Health Perspect. 2011, 119, 455–460. [Google Scholar] [CrossRef] [PubMed]
  5. Hermayurisca, F.; Taneepanichskul, N. Estimation of premature death attributed to short- and long-term PM2.5 exposure in Thailand. Environ. Monit. Assess. 2023, 195, 1–10. [Google Scholar] [CrossRef] [PubMed]
  6. Kim, N.R.; Lee, H.J. Ambient PM2.5 exposure and rapid population aging: A double threat to public health in the Republic of Korea. Environ. Res. 2024, 252, 119032. [Google Scholar] [CrossRef] [PubMed]
  7. Circular of the State Council on the Issuance of the Action Plan for the Prevention and Control of Air Pollution. 2025. Available online: https://www.gov.cn/zwgk/2013-09/12/content_2486773.htm (accessed on 8 January 2024).
  8. Yao, L.; Chu, B.; Wang, J.; Wang, J. Editorial: Atmospheric chemistry in the urban air. Front. Environ. Sci. 2023, 11, 1166400. [Google Scholar] [CrossRef]
  9. Xian, J.; Sun, D.; Xu, W.; Han, Y.; Zheng, J.; Peng, J.; Yang, S. Urban air pollution monitoring using scanning Lidar. Environ. Pollut. 2020, 258, 113696. [Google Scholar] [CrossRef]
  10. Liu, K.; Wang, X.; Zhang, Z. Assessing urban atmospheric environmental efficiency and factors influencing it in China. Environ. Sci. Pollut. Res. 2022, 29, 594–608. [Google Scholar] [CrossRef]
  11. Calderón-Garcidueñas, L.; Kulesza, R.J.; Doty, R.L.; D’Angiulli, A.; Torres-Jardón, R. Megacities air pollution problems: Mexico City Metropolitan Area critical issues on the central nervous system pediatric impact. Environ. Res. 2015, 137, 157–169. [Google Scholar] [CrossRef]
  12. Langford, A.O.; Senff, C.J.; Alvarez, R.J., II; Banta, R.M.; Hardesty, R.M. Long-range transport of ozone from the Los Angeles Basin: A case study. Geophys. Res. Lett. 2010, 37, L06807. [Google Scholar] [CrossRef]
  13. Kanakidou, M.; Mihalopoulos, N.; Kindap, T.; Im, U.; Vrekoussis, M.; Gerasopoulos, E.; Dermitzaki, E.; Unal, A.; Koçak, M.; Markakis, K.; et al. Megacities as hot spots of air pollution in the East Mediterranean. Atmos. Environ. 2011, 45, 1223–1235. [Google Scholar] [CrossRef]
  14. Stein, A.F.; Draxler, R.R.; Rolph, G.D.; Stunder, B.J.B.; Cohen, M.D.; Ngan, F. NOAA’s HYSPLIT Atmospheric Transport and Dispersion Modeling System. Bull. Am. Meteorol. Soc. 2015, 96, 2059–2077. [Google Scholar] [CrossRef]
  15. Koracin, D.; Vellore, R.; Lowenthal, D.H.; Watson, J.G.; Koracin, J.; McCord, T.; DuBois, D.W.; Chen, L.-W.A.; Kumar, N.; Knipping, E.M.; et al. Regional Source Identification Using Lagrangian Stochastic Particle Dispersion and HYSPLIT Backward-Trajectory Models. J. Air Waste Manag. Assoc. 2011, 61, 660–672. [Google Scholar] [CrossRef] [PubMed]
  16. Bao, Y.; Sun, M.; Yan, M.; Lu, M.; Liu, W. Comparative study of migration trajectories of the brown planthopper, nilaparvata lugens, in China based on two trajectory models. Acta Ecol. Sin. 2016, 36, 6122–6138. [Google Scholar]
  17. Zhang, X. GIS-Based Study on the Historical Evolution and Spatial Characteristics of Traditional Settlements in the Northern Three Defiles of the Taihang Mountains. Master’s Thesis, Norinco University, Beijing, China, 2022. [Google Scholar]
  18. Yang, K.; Zhou, X.; Zhou, H.; Lu, W.; You, H. Analysis of water vapor characteristics of four winter heavy precipitation in Yunnan based on HYSPLIT model. J. Meteorol. Sci. 2024, 44, 833–846. [Google Scholar]
  19. Yang, L.; Wang, G.; Wang, Y.; Wang, Y.; Ma, Y.; Zhang, X. A Rapid Computational Method for Quantifying Inter-Regional Air Pollutant Transport Dynamics. Atmosphere 2025, 16, 163. [Google Scholar] [CrossRef]
  20. Li, B. Evaluation of Environmental Protection Policies and Mechanisms in Beijing-Tianjin-Hebei Air Pollution Transmission Corridor Cities. Master’s Thesis, Shanghai University of Finance and Economics (SUFE), Shanghai, China, 2022. [Google Scholar]
  21. Peng, L. Study on the Spatial and Temporal Pattern of PM2.5 in Beijing-Tianjin-Hebei Urban Air Pollution Transmission Corridor Area from 2000 to 2015. Master’s Thesis, Beijing Forestry University, Beijing, China, 2020. [Google Scholar]
  22. Li, C.; Zhang, Z.; Yang, C. Analysis of PM2.5 and O3 pollution characteristics and influencing factors in Shanxi Province. Acta Sci. Circumstantiae 2024, 44, 299–309. [Google Scholar]
  23. Wang, J.; Zhang, Y.; Gao, J.; Xu, Z.; Ma, T.; Liu, S.; Yan, L.; Liu, J. Characterization of PM2.5 pollution in cities along the Taihang Mountains during the heating season from 2016 to 2018. China Environ. Sci. 2019, 39, 4521–4529. [Google Scholar]
  24. Tian, J.; Zhe, D.; Jia, Q.; He, L. Spatial Differentiation of Habitat Quality on Different Topographic Gradients in Taihang Mountains and Its Influencing Factors—A Case Study of Fuping County, Hebei Province, China. For. Ecol. Sci. 2022, 37, 426–436. [Google Scholar]
  25. Liu, S.; Wang, X.; Wang, Y.; Bai, H.; Xing, Y. Analysis of spatial heterogeneity and driving factors of haze in Shanxi Province. Acta Sci. Circumstantiae 2024, 1–12. [Google Scholar] [CrossRef]
  26. Duan, B. Why eight defile—“Taihang eight defile” concept of formation and reflection. J. Chin. Hist. Geogr. 2023, 38, 121–129. [Google Scholar]
  27. Namdev, P.; Sharan, M.; Srivastava, P.; Mishra, S.K. An updated parameterization of the unstable atmospheric surface layer in the Weather Research and Forecasting (WRF) modeling system. Geosci. Model Dev. 2024, 17, 8093–8114. [Google Scholar] [CrossRef]
  28. Hong, S.; Dudhia, J.; Chen, S. A Revised Approach to Ice Microphysical Processes for the Bulk Parameterization of Clouds and Precipitation. Mon. Weather. Rev. 2004, 132, 103–120. [Google Scholar] [CrossRef]
  29. Zhang, B.; Liu, S.; Liu, H.; Ma, Y. The effect of MYJ and YSU schemes on the simulation of boundary layer meteorological factors of WRF. Chin. J. Geophys. 2012, 55, 2239–2248. (In Chinese) [Google Scholar]
  30. Stein, A.F.; Isakov, V.; Godowitch, J.; Draxler, R.R. A hybrid modeling approach to resolve pollutant concentrations in an urban area. Atmos. Environ. 2007, 41, 9410–9426. [Google Scholar] [CrossRef]
  31. Dasari, H.P.; Desamsetti, S.; Langodan, S.; Karumuri, R.K.; Singh, S.; Hoteit, I. Atmospheric conditions and air quality assessment over NEOM, kingdom of Saudi Arabia. Atmos. Environ. 2020, 230, 117489. [Google Scholar] [CrossRef]
  32. Chen, B.; Stein, A.F.; Maldonado, P.G.; de la Campa, A.M.S.; Gonzalez-Castanedo, Y.; Castell, N.; de la Rosa, J.D. Size distribution and concentrations of heavy metals in atmospheric aerosols originating from industrial emissions as predicted by the HYSPLIT model. Atmos. Environ. 2013, 71, 234–244. [Google Scholar] [CrossRef]
  33. He, J.; Gong, S.; Zhou, C.; Lu, S.; Wu, L.; Chen, Y.; Yu, Y.; Zhao, S.; Yu, L.; Yin, C. Analyses of winter circulation types and their impacts on haze pollution in Beijing. Atmos. Environ. 2018, 192, 94–103. [Google Scholar] [CrossRef]
  34. Zhao, Z.J.; Liu, R.; Zhang, Z.Y. Characteristics of Winter Haze Pollution in the Fenwei Plain and the Possible Influence of EU During 1984-2017. Earth Space Sci. 2020, 7, e2020EA001134. [Google Scholar] [CrossRef]
  35. Rao, V.T.; Suneel, V.; Gulakaram, V.S.; Sravani, C.L. Extraction of persistent lagrangian coherent structures for the pollutant transport prediction in the Bay of Bengal. Sci. Rep. 2024, 14, 8761. [Google Scholar]
  36. Ni, J.; Zhao, Y.; Li, B.; Liu, J.; Zhou, Y.; Zhang, P.; Shao, J.; Chen, Y.; Jin, J.; He, C. Investigation of the impact mechanisms and patterns of meteorological factors on air quality and atmospheric pollutant concentrations during extreme weather events in Zhengzhou city, Henan Province. Atmos. Pollut. Res. 2023, 14, 101932. [Google Scholar] [CrossRef]
  37. Csavina, J.; Field, J.; Félix, O.; Corral-Avitia, A.Y.; Sáez, A.E.; Betterton, E.A. Effect of wind speed and relative humidity on atmospheric dust concentrations in semi-arid climates. Sci. Total Environ. 2014, 487, 82–90. [Google Scholar] [CrossRef] [PubMed]
  38. Cui, M. Study on Air Pollution Characteristics and Pollutant Transmission in Typical Cities in Beijing-Tianjin-Hebei and Surrounding Areas. Master’s Thesis, East China Normal University (ECNU), Shanghai, China, 2023. [Google Scholar]
  39. Pang, J. Study on the Relationship Between Urbanization and Spatial and Temporal Evolution of PM2.5 Concentration in Shanxi Province Based on Remote Sensing Data. Master’s Thesis, Tung Wah University of Science and Technology, Hong Kong, China, 2022. [Google Scholar]
  40. Gu, S.; Wu, S.; Yang, L.; Hu, Y.; Tian, B.; Yu, Y.; Ma, N.; Ji, P.; Zhang, B. Synoptic Weather Patterns and Atmospheric Circulation Types of PM2.5 Pollution Periods in the Beijing-Tianjin-Hebei Region. Atmosphere 2023, 14, 942. [Google Scholar] [CrossRef]
  41. Miao, Y.; Liu, S.; Zheng, Y.; Wang, S.; Chen, B.; Zheng, H.; Zhao, J. Numerical study of the effects of local atmospheric circulations on a pollution event over Beijing-Tianjin-Hebei, China. J. Environ. Sci. 2015, 30, 9–20. [Google Scholar] [CrossRef]
  42. Evan, A.T.; Kossin, J.P.; Chung, C.; Ramanathan, V. Arabian Sea tropical cyclones intensified by emissions of black carbon and other aerosols. Nature 2011, 479, 94–97. [Google Scholar] [CrossRef] [PubMed]
  43. Charabi, Y.; Al-Bulooshi, A.; Al-Yahyai, S. Assessment of the impact of the meteorological meso-scale circulation on air quality in arid subtropical region. Environ. Monit. Assess. 2013, 185, 2329–2342. [Google Scholar] [CrossRef] [PubMed]
Figure 1. Overview of the study area. (a) shows the extent of the study area; (b,c) correspond to the distribution of cities in the CTHM and the elevation map; (d) is the distribution of the “Eight Passes of the Taihang Mountains”, where the red lines are valley transmission channels, the blue are rivers, and the black dots are neighboring cities and counties (belonging to the province).
Atmosphere 16 00205 g001
Figure 2. Nested regions of the WRF grid (where d01 is 27 km, d02 is 9 km, and d03 is 3 km).
Atmosphere 16 00205 g002
Figure 3. APTQM-PM2.5 modeling step analysis. Step 1: (a,b) area gridding and boundary processing where (a) is the target study area and (b) is the gridding, where the shaded grid is the matching blocks of the study area. Step 2: (c,d) gradient analysis and airflow direction classification, where (c) is the air pressure gradient schematic, where the blue color is the relatively high-value cell and the red color is the relatively low-value cell, and (d) is the air gradient flow schematic, and the black vector arrow is the airflow direction. Step 3: (e,f) river network classification and flow intensity analysis, where (e) is the river network classification of the study area, direction of air flow; (e) shows the results of river network classification in the study area, where the yellow grid (level 1) is the outflow cell, i.e., upstream grid, and the green grid (level 2) is the inflow cell, i.e., downstream grid; and (f) is the schematic illustration of the flow intensity, where the yellow color is the main stream flow, and the blue color is the secondary flow.
Atmosphere 16 00205 g003
Figure 4. Hourly variations of PM2.5 mass concentration and comparative variations of related meteorological factors in the urban agglomerations of CTHM during the period of heavy pollution. (a) mean surface wind speed (wspd, m/s) and temperature (temp, °C) in December 2021 for both sides of the urban agglomerations; (b) relationship and dynamics between visibility (vis, km) and PM2.5 mass concentration (PM2.5 Conc, μg); (c) relationship and dynamics between relative humidity (RH, %) and PM2.5 mass concentration.
Atmosphere 16 00205 g004
Figure 5. Visualization of the Taylor coefficients between the simulated and observed meteorological fields.
Atmosphere 16 00205 g005
Figure 6. Backward trajectory analysis of major cities during periods of heavy pollution based on WRF-HYSPLIT. (a) Eastern urban agglomeration, Shijiazhuang, Hebei Province. (b) Eastern urban agglomeration, Handan, Hebei Province. (c) Eastern urban agglomeration, Xingtai, Hebei Province. (d) Western urban agglomeration, Taiyuan, Shanxi Province. (e) Western urban agglomeration, Yangquan, Shanxi Province. (f) Western urban agglomeration, Jinzhong, Shanxi Province.
Atmosphere 16 00205 g006
Figure 7. Mean geopotential height field and wind field from 9–13 December 2021, at time 0. Where (a) is the mean geopotential height field and wind field at 500 hpa at time 0 on the 9th, (b) is on 500 hpa at time 0 on the 11th, (c) is on 500 hpa at time 0 on the 13th; (df) is on 750 hpa, and the (gi) is 850 hpa, where the gray filled areas are terrain obstructions.
Atmosphere 16 00205 g007
Figure 8. The longitudinal vertical circulation, mean hourly wind field, and potential pseudo-equivalent temperature (θse) variations in the study area during 9–13 December 2021, at time 0. (a) For 9th, (b) for 11th, and (c) for 13th (where the left side of the y-axis is labeled as the height (km), the right side is the pseudo-equivalent temperature (K) for the corresponding height, and the bottom black fill is the terrain).
Atmosphere 16 00205 g008
Figure 9. Average migration and regional transmission distribution per unit grid (3 km × 3 km) during heavy pollution periods. (The color-filled part of the figure shows the gradient level.)
Atmosphere 16 00205 g009
Table 1. Correlation coefficients of meteorological elements and PM2.5 concentration.
Correlation Coefficient (r)EasternWestern
Mean temperature−0.2573 *0.30 **
Mean wind speed−0.22 *−0.47 **
Mean relative humidity0.52 **0.36 **
Note: * significantly correlated; ** very significantly correlated.
Table 2. Statistical results of air mass trajectories in the CTHM urban agglomerations during the heavy pollution period in the winter of 2021.
TypesMain Pathway RegionsPercentage%
Eastern1Inner Mongolia, Shanxi, Hebei Provinces32.7
2Shanxi, Hebei Provinces32
3Inner Mongolia, Shanxi, Henan and Hebei Provinces35.3
Western1Mongolia, Inner Mongolia, Shanxi Province11
2Inner Mongolia, Shanxi Province14.7
3Inner Mongolia, North Shaanxi Province and Shanxi Province31.3
4Shaanxi Province, Shanxi (South Shaanxi, Henan and Shanxi Province)43
Disclaimer/Publisher’s Note: The statements, opinions and data contained in all publications are solely those of the individual author(s) and contributor(s) and not of MDPI and/or the editor(s). MDPI and/or the editor(s) disclaim responsibility for any injury to people or property resulting from any ideas, methods, instructions or products referred to in the content.

