Error in Figure
In the original publication [1], there was a mistake in Figure 17 as published. In the figure, “(bottom)” means the time series of 60 h with multiple color lines and NOT the lower 2D subpanels. The corrected Figure 17 appears below. The authors state that the scientific conclusions are unaffected. This correction was approved by the Academic Editor. The original publication has also been updated.
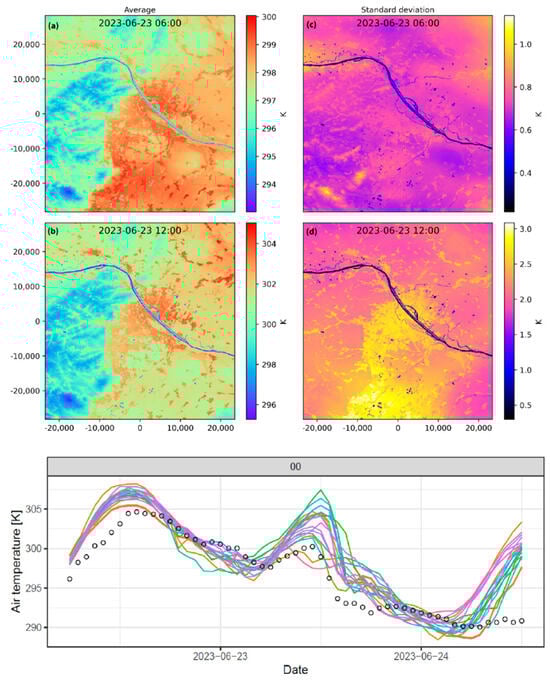
Figure 17.
Forecast of SURFEX-SA for the air temperature [K] for (top) two different time stamps as (a,b) average ensemble forecast and their (c,d) standard deviation and for (bottom) lead time +6 till +60 h (00 UTC run from 22 June 2023) for 16 ensemble members of the grid cell nearest to the TAWES station in the city center of Vienna. Observations from this TAWES station are given in black dots.
Reference
- Oswald, S.M.; Schneider, S.; Hahn, C.; Žuvela-Aloise, M.; Schmederer, P.; Wastl, C.; Hollosi, B. High-Resolution Air Temperature Forecasts in Urban Areas: A Meteorological Perspective on Their Added Value. Atmosphere 2024, 15, 1544. [Google Scholar] [CrossRef]
Disclaimer/Publisher’s Note: The statements, opinions and data contained in all publications are solely those of the individual author(s) and contributor(s) and not of MDPI and/or the editor(s). MDPI and/or the editor(s) disclaim responsibility for any injury to people or property resulting from any ideas, methods, instructions or products referred to in the content. |
© 2025 by the authors. Licensee MDPI, Basel, Switzerland. This article is an open access article distributed under the terms and conditions of the Creative Commons Attribution (CC BY) license (https://creativecommons.org/licenses/by/4.0/).