Article

Coupling Indoor and Outdoor Heat Stress During the Hot Summer of 2022: A Case Study of Freiburg, Germany

1
Department of Meteorology and Climatology, Taras Shevchenko National University of Kyiv, 01033 Kyiv, Ukraine
2
Chair of Environmental Meteorology, Institute of Earth and Environmental Sciences, University of Freiburg, 79085 Freiburg, Germany
3
Democritus University of Thrace, 69100 Komotini, Greece
*
Author to whom correspondence should be addressed.
Atmosphere 2025, 16(2), 167; https://doi.org/10.3390/atmos16020167
Submission received: 4 December 2024 / Revised: 21 January 2025 / Accepted: 28 January 2025 / Published: 1 February 2025
(This article belongs to the Special Issue Indoor Thermal Comfort Research)

Abstract

:
Indoor and outdoor heat stress, which can appear during warm periods of the year, often has a negative impact on health and reduces productivity at work and study. Intense heat waves (HWs) are causing increasing rates of morbidity and mortality. This study aimed to analyze the coupling and delay of indoor and outdoor heat stress during HW events, using the example of ten workplaces (WPs) situated in different offices and buildings in the medium-sized city of Freiburg, Germany. The relationships between air temperature, humidity, and thermal stress intensity in the WPs were explored during HW periods. It was found that the level of thermal load in the investigated WPs was very different compared to that outdoors (during HWs and the entire summer). The mean physiologically equivalent temperature (PET) for the summer of 2022 inside the investigated offices was 2 °C higher than outside. All classes of thermo-physiological stress were observed outdoors at a meteorological station during the study period. While at eight of the ten workplaces, the most frequent physiological stress was slight heat stress (ranging between 62.4% and 97.4% of the time), the other two WPs were dominated by moderate heat stress (53.7% and 60.6% of the time). The daily amplitudes as well as diurnal courses of air temperature, humidity, and PET during the summer differed significantly at the ten different WPs. It is suggested to use vapor pressure instead of relative humidity to characterize and compare different HWs both outside and inside. It is proposed for future work research to analyze not only room and building characteristics but also the characteristics of the surroundings of the building for a better understanding of the key factors that influence human thermal comfort in different workplaces. A framework of the drivers affecting the coupling of outdoor and indoor heat stress is proposed.

1. Introduction

The most prominent features of climate change are globally rising air temperatures and associated phenomena (the frequency of occurrence of hot days, tropical nights, and heat waves). Very strong heat waves have been observed during the last few decades all over the world [1,2,3,4,5,6,7,8,9]. Heat waves (HWs) strongly influence thermal comfort conditions and cause an increasing heat load on humans. HWs are causing a dramatic increase in morbidity and mortality. A mega-HW in the summer of 2003 caused approximately 30,000 deaths in Europe, including nearly 15,000 in France [10,11]. In Slovakia, a mortality increase of +14% during the mega-HW of summer of 2015 was found [12]. The impact of the mega-HW of 2015 on excess mortality was greater than during a previous very intensive heat wave in 1994 in the Czech Republic [13]. In July 2015, daily mortality anomalies of +56% were observed in southwest Germany (Baden-Württemberg) [14].
Summer 2022 was characterized by unprecedently high air temperatures, persistent HWs, and droughts over Europe, the United States, and China [15,16]. The Copernicus Climate Change Service ranked summer 2022 as the hottest European summer on record [17]. Hot weather in 2022 started with high temperatures in southern Europe in May, leading to new temperature records in France and Portugal, and multiple HWs followed in June and continued into July and August, affecting even the United Kingdom and Scandinavia [16]. In general, record-breaking temperatures were registered during the period between 30 May and 4 September 2022 in different parts of the Europe [18]. Many of the 2022 local European HWs were characterized by high intensity, long durations, and large spatial extensions, and they had negative societal impacts [16]. This exceptional hot summer season in Europe caused approximately 60,000 deaths attributable to heat [19]. Italy, Spain, Germany, France, the United Kingdom, and Greece the highest summer heat-related mortality numbers date in 2022. In relative terms, the largest summer heat-related mortality rates were found in Italy, Greece, Spain, and Portugal. According to Ballester et al. [18], the large increase in heat-related mortality during June–August 2022 approached the record-breaking excess mortality of June–September 2003 in Europe.
Ibebuchi and Abu [20] analyzed atmospheric conditions and circulation patterns to assess the reason for the anomalies in regional air temperature in Western Europe during the summer of 2022. They found that a dominance of cyclonic circulation over the North Sea and anticyclonic circulation over the Mediterranean region resulted in enhanced warm air advection by southwest winds into most of the continental area in Western Europe. Kim et al. [19] found that HW events in 2022 in southwestern Europe were strongly related to intensive heat domes, which developed in the lower troposphere due to high-pressure anomalies, especially during the periods of 9–18 June and 8–19 July.
During warm periods of the year, heat stress can appear both outdoors and indoors in buildings. Indoors, it can be caused by outdoor heat or artificial factors, or a combination of both [21]. In industrialized countries, people spend about 90% of their time in indoor environments [22,23]. Therefore, a large number of studies on thermal comfort in buildings have been performed within the last decades.
Human sensitivity (and, respectively, morbidity and mortality) to heat stress depends on many factors, such as age, health, lifestyle, poverty level, etc. [24]. People with pre-existing health conditions, for example, respiratory and cardiovascular diseases, diabetes, or chronic mental illnesses, young children, and elderly people are most vulnerable to temperature extremes [25,26,27]. Thermal discomfort can lead not only to health decline but also to a reduced performance of students [23] and employee productivity [28]. Discomfort in offices causes people to spend time, energy, and attention trying to compensate for the lack of comfort, instead of focusing on their main activity. Productivity is increased when employees work in a thermally comfortable environment [29]. According to Pourshaghaghy and Omidvari [30], thermal discomfort in offices leads to a higher possibility of personnel errors. Despite all the negative consequences of a high air temperature indoors, poor air quality and thermal discomfort in offices are still major problems in developed and industrialized countries [22].
Maintaining a thermally comfortable indoor environment and the energy consumption of a building are closely related, as the achievement of comfortable conditions during periods with high or low air temperature involves an energy cost, which must be taken into account [31,32,33]. Building stock is one of the largest energy-demanding sectors. In recent years, the final energy consumption by this sector has been about 36% at a global scale and reached about 40% in the European Union [34].
There are a lot of factors that influence the thermal environment inside buildings without air-conditioning systems. These factors include construction materials, building height (number of floors), size and orientation of the windows, the external surface color of the facades and roofs, etc. Overheating can occur due to solar gains through large windows, as the result of daylight. Occupants, employees, and students can use adaptive behavior to reduce heat stress. For instance, they can open windows, use the interior or external blinds, etc. [35,36]. But nearly all actions of adaptive behavior lead to certain inconveniences. Opening windows is often not an effective way to reduce heat stress and it often leads to increased noise and drafts inside, which negatively influence productivity [23]. Using blinds reduces natural lighting in workplaces and negatively affects vision. The colors of the external surfaces significantly influence their temperatures. Better thermal insulation in walls and roofs positively influences thermal comfort inside buildings, which effectively reduces the need for air-conditioning and decreases the annual energy consumption of buildings. Thus, insulation in buildings brings additional benefits not only for thermal comfort inside but also for protecting the environment by reducing CO2 emissions [37].
Various approaches and methods are used to investigate the relationship between indoor and outdoor thermal comfort or the impact of multiple factors on indoor thermal comfort. Ahan et al. [38] investigated the relationship between outdoor and indoor heat stress in the example of Ankara based on a physiological approach. The physiologically equivalent temperature (PET) was calculated using RayMan Pro through external and internal climate variables. The PET is defined as the physiological equivalent temperature at any given place (outdoors or indoors) and is equivalent to the air temperature at which, in a typical indoor setting, the heat balance of the human body is maintained (working metabolism 80 W of light activity, added to basic metabolism; heat resistance of clothing 0.9 clo), with core and skin temperatures equal to those under the conditions being assessed [39]. The PET is a thermal index derived from the Munich Energy Balance Model for Individuals (MEMI) and used to determine the impact of the thermal environment on the human body by using the heat balance between them. The PET considers the influences of all thermally relevant climate variables (e.g., air temperature, mean radiant temperature, air velocity, air humidity) in a thermo-physiologically relevant way, evaluating their real effect on the regulatory processes and on the thermal state of the body [39]. The PET is appropriate for such studies because of its suitability for both indoor and outdoor research and utilization of °C as a unit of measurement [38]. Nouri et al. [40] used the PET to determine impacts of extreme heat events on dwellings during summer 2020 in Ankara. The advantages of using the PET are as follows: calibration using easily accessible climatic input variables, its base measuring unit being in °C, thus simplifying the interpretation of the results, and finally, based upon the inherent ‘human centered approach‘, the (Indoor/Outdoor) PET results are directly related to the aforementioned physiological stress classes. Parmaksiz et al. [41] conducted research on thermal comfort conditions in a school in Şanlıurfa Province (Turkey) based on the PMV (Predicted Mean Vote) and PPD (Predicted Percentage Dissatisfied). PMV values were calculated using a web-based application developed by Tartarini et al. [42]. Modeling of indoor thermal comfort in passive buildings performed by Conceição et al. [43] is also based on the PMV index. For considerations of the building geometry, ventilation, and occupancy, the Building Thermal Response (BTR) software has been applied. This improves results’ precision, because PMV values depend on environmental variables: indoor air temperature, mean radiant temperature, indoor relative humidity, and wind.
Weather services in many European countries implemented “heat health warning systems” (HHWSs) after the extreme HW of summer 2003 in Central and Western Europe and its dramatic consequences. HHWSs aim to minimize the negative health impacts of HWs, informing and warning the public health authorities and the general public about heat, triggering interventions, and taking preventive measures [44,45]. Most HHWSs are based on air temperature only (maximum air temperature, mean air temperature, or sometimes both maximum and minimum air temperature) [45,46], and in some countries, HHWSs take into account other relevant meteorological variables. For instance, the basic concept of the German HHWS is the calculation of the perceived temperature (which is based on air temperature and humidity, wind speed, as well as solar and thermal radiation) [45]. All existing HHWSs are based on predicted values of meteorological variables for outdoor environments, and data about the coupling of indoor and outdoor heat stress could help to make the heat warnings more informative and useful for the general public and public health authorities. Understanding the interrelationships between the thermal regimes outside and inside of buildings will help to assess heat’s impact on the human body and health more accurately, as people spend most of their time inside. In addition, an examination of indoor thermal comfort and the factors which influence it may help to optimize the usage of cooling systems and reduce buildings’ energy consumption.
Therefore, the aim of this study was to analyze the delay and coupling of indoor and outdoor heat stress during HW events in the example of ten workplaces (WPs) situated in different offices in the medium-sized city of Freiburg, Germany and to research the relationships between the humidity rate and thermal stress intensity during hot periods. The results of this study could help improve HHWSs and minimize heat exposure to public health.

2. Materials and Methods

Investigation of the delay/coupling of indoor and outdoor heat stress was performed on the example of different workplaces (WPs) situated in Freiburg (48.00 N, 7.85 E, 278 m a.s.l.), a medium-sized city in southwestern Germany. The city’s administrative boundaries cover a total terrestrial area of approximately 153.07 km2, and the population of the city is about 231,000. According to the Köppen–Geiger climate classification, Freiburg has a Marine West Coast Climate (Cfb) [47]. Over the period of 1991–2020, the mean air temperature of the summer (June–August) was 19.4 °C, and the mean relative humidity was 66.8%. The average summer sunshine duration is 239.8 h. The mean total precipitation amount during summer is 265.3 mm.
Out of indoor measurements from 120 WPs in the Upper Rhine Valley, the data of 10 WPs in Freiburg were chosen for this research. They are situated in buildings in different parts of the city (Table 1) and are characterized by different descriptors. WP23, WP34, and WP118 are situated in buildings built around 1900–1930, while WP1 is situated in a building built in 1990–2010. The buildings with WP1 and WP9 are constructed of concrete, the building with WP24 is constructed of concrete and stone, and all the others are of stone. The number of floors in the buildings ranges between 3 and 12. The investigated workplaces are situated on the ground floor (WP34, WP107, and WP118), first floor (WP1), third floor (WP9 and WP24), fourth floor (WP23), and eighth floor (WP100, WP103, and WP105). The height of the rooms ranges from 2.5 m (WP100, WP103, and WP105) to 3.8 m (WP107) and the size of the rooms is between 15 m² (WP24) and 40 m² (WP107). The sensors for the measurements of thermal comfort conditions were mainly situated at desks, but two of them were on a shelf (WP23 and WP24), WP100 was on a windowsill, and WP9 was near a wall. The ten sensors were installed at heights ranging from 0.8 m to 1.2 m. The windows in the investigated offices have different orientations and are directed to all sides of the horizon. All windows except two can be shaded—they are equipped with a jalousie, roller shutter, or curtains. Nevertheless, only WP1 and WP23 are protected from direct solar radiation exposure. Only one workplace (WP107) is equipped with an air-conditioning system.
Data were gathered using a low-cost sensor network of devices called “MoBiMets”, as documented by Sulzer et al. [48] and used in previous research to assess and predict indoor thermal comfort [48,49,50]. To study thermal comfort conditions at the investigated workplaces, each workplace was equipped with a MoBiMet (Figure 1). The MoBiMet is based on a single-board computer Raspberry Pi Zero WH (Raspberry Pi (Trading) Limited, Cambridge, UK), which is connected to sensors for the measurement of air temperature (Ta), relative humidity (RH), globe temperature (Tg), wind speed (v) (only at semi-outdoor locations), thermal incident radiation (LW), and light level (L), while mounted in a 3D-printed enclosure [48]. The MoBiMet is powered by a 5 V adapter via a micro-USB cable. A custom-made black globe thermometer was built for the determination of mean radiant temperature (Tmrt) [48]. The wind speed at indoor workplaces is generally low (lower than 0.1 m/s), and it was not considered in the determination of human thermal comfort in this study [51]. Measurements were conducted by the MoBiMets every five minutes, and they submitted data in near-real-time to central servers for a data curation and annotation system [52]. In previous research, the “MoBiMets” demonstrated potential not only for determining and continuously communicating human thermal comfort in distributed networks in occupational contexts [48] but also in allowing for context-specific heat health warning systems [49], modeling or parameterizing typical time lags and dampening functions between outdoor and indoor temperatures, and even making indoor climate projections [50].
Simultaneously with the indoor measurements, the reference external air temperature and other meteorological variables were measured at the official meteorological station (MS) Freiburg (Station ID 1443, 48.0232 N, 7.8343 E, 236.5 m a.s.l.), which is operated by the German Meteorological Service (“Deutscher Wetterdienst”, DWD). MS Freiburg is situated at the local airport at the edge of the city.
The physiologically equivalent temperature (PET) is used to assess bioclimatic conditions during HWs indoors and outdoors. The PET was chosen because is the most commonly applied thermal index and allows a good comparison with other studies and regions. From the meteorological input variables Ta, vapor pressure (VP), Tmrt, and v, the MoBiMet calculates the PET (°C) based on the Python script by Walther and Goestchel [53]. By default, the PET is calculated for a standardized person (male, 35 years, 1.75 m, 75 kg) with reference clothing of 0.9 clo and a work metabolism of 80 W.
The calculation of the PET for the MS Freiburg is performed based on air temperature, relative humidity, wind speed, and mean radiant temperature data utilizing the same Python script. Wind speed was not available at a height of 1.1 m, so it was calculated based on a power-law profile approach applied by Kuttler through the application of the following formula [54]:
W S 1.1 = W S h * ( 1.1 / h ) α   α = 0.12 × z 0 + 0.18
* where WSh is the wind speed (m s−1) at a height of h (10 m), α is an empirical exponent, depending on the surface roughness, and z0 is the roughness length.
The values of the other variables were obtained at a height of 2 m and used without altitude correction.
PET values are classified into nine thermo-physiological stress levels (Table 2).
In addition to the PET, the air temperature and RH were also used to analyze the delay and coupling of indoor and outdoor heat stress in this investigation.
In this study, a heat wave (HW) was defined based on the heat warnings of the German Weather Service. The basic concept of the DWD’s HHWS is the calculation of the perceived temperature (PT) in order to assess heat with respect to human thermal stress. The DWD numerical weather forecasts in hourly time steps are used to calculate the PT. Dangerous heat episodes are identified by means of the criteria “strong heat stress” and “extreme heat stress” according to the 12:00 Coordinated Universal Time (UTC) prediction of PT [45].

3. Results

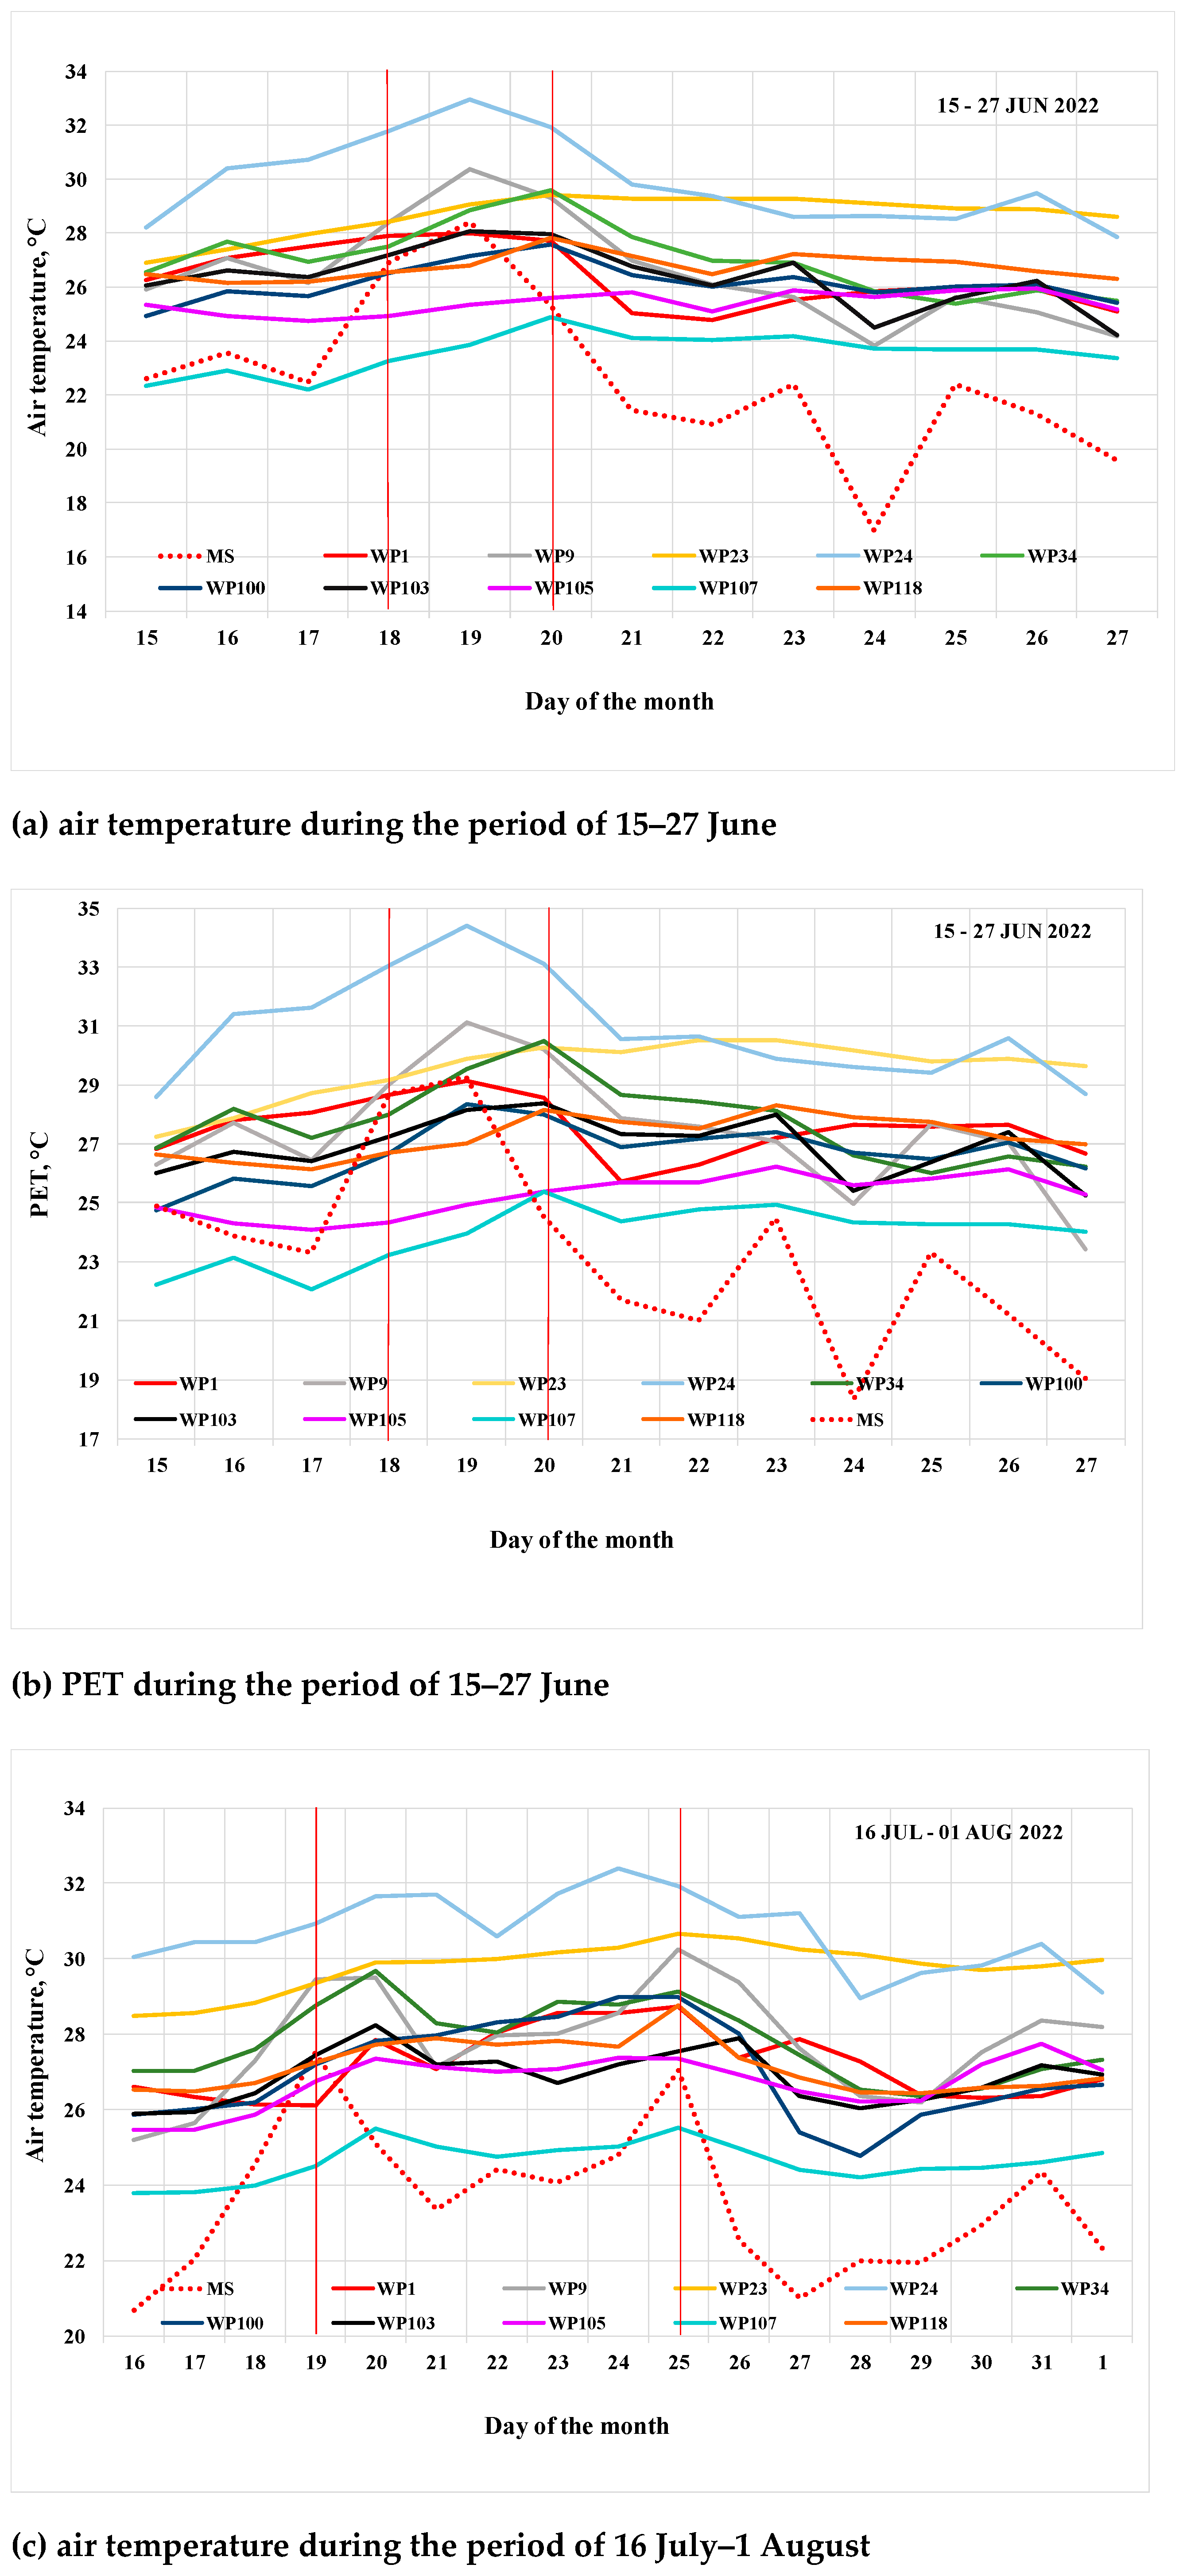
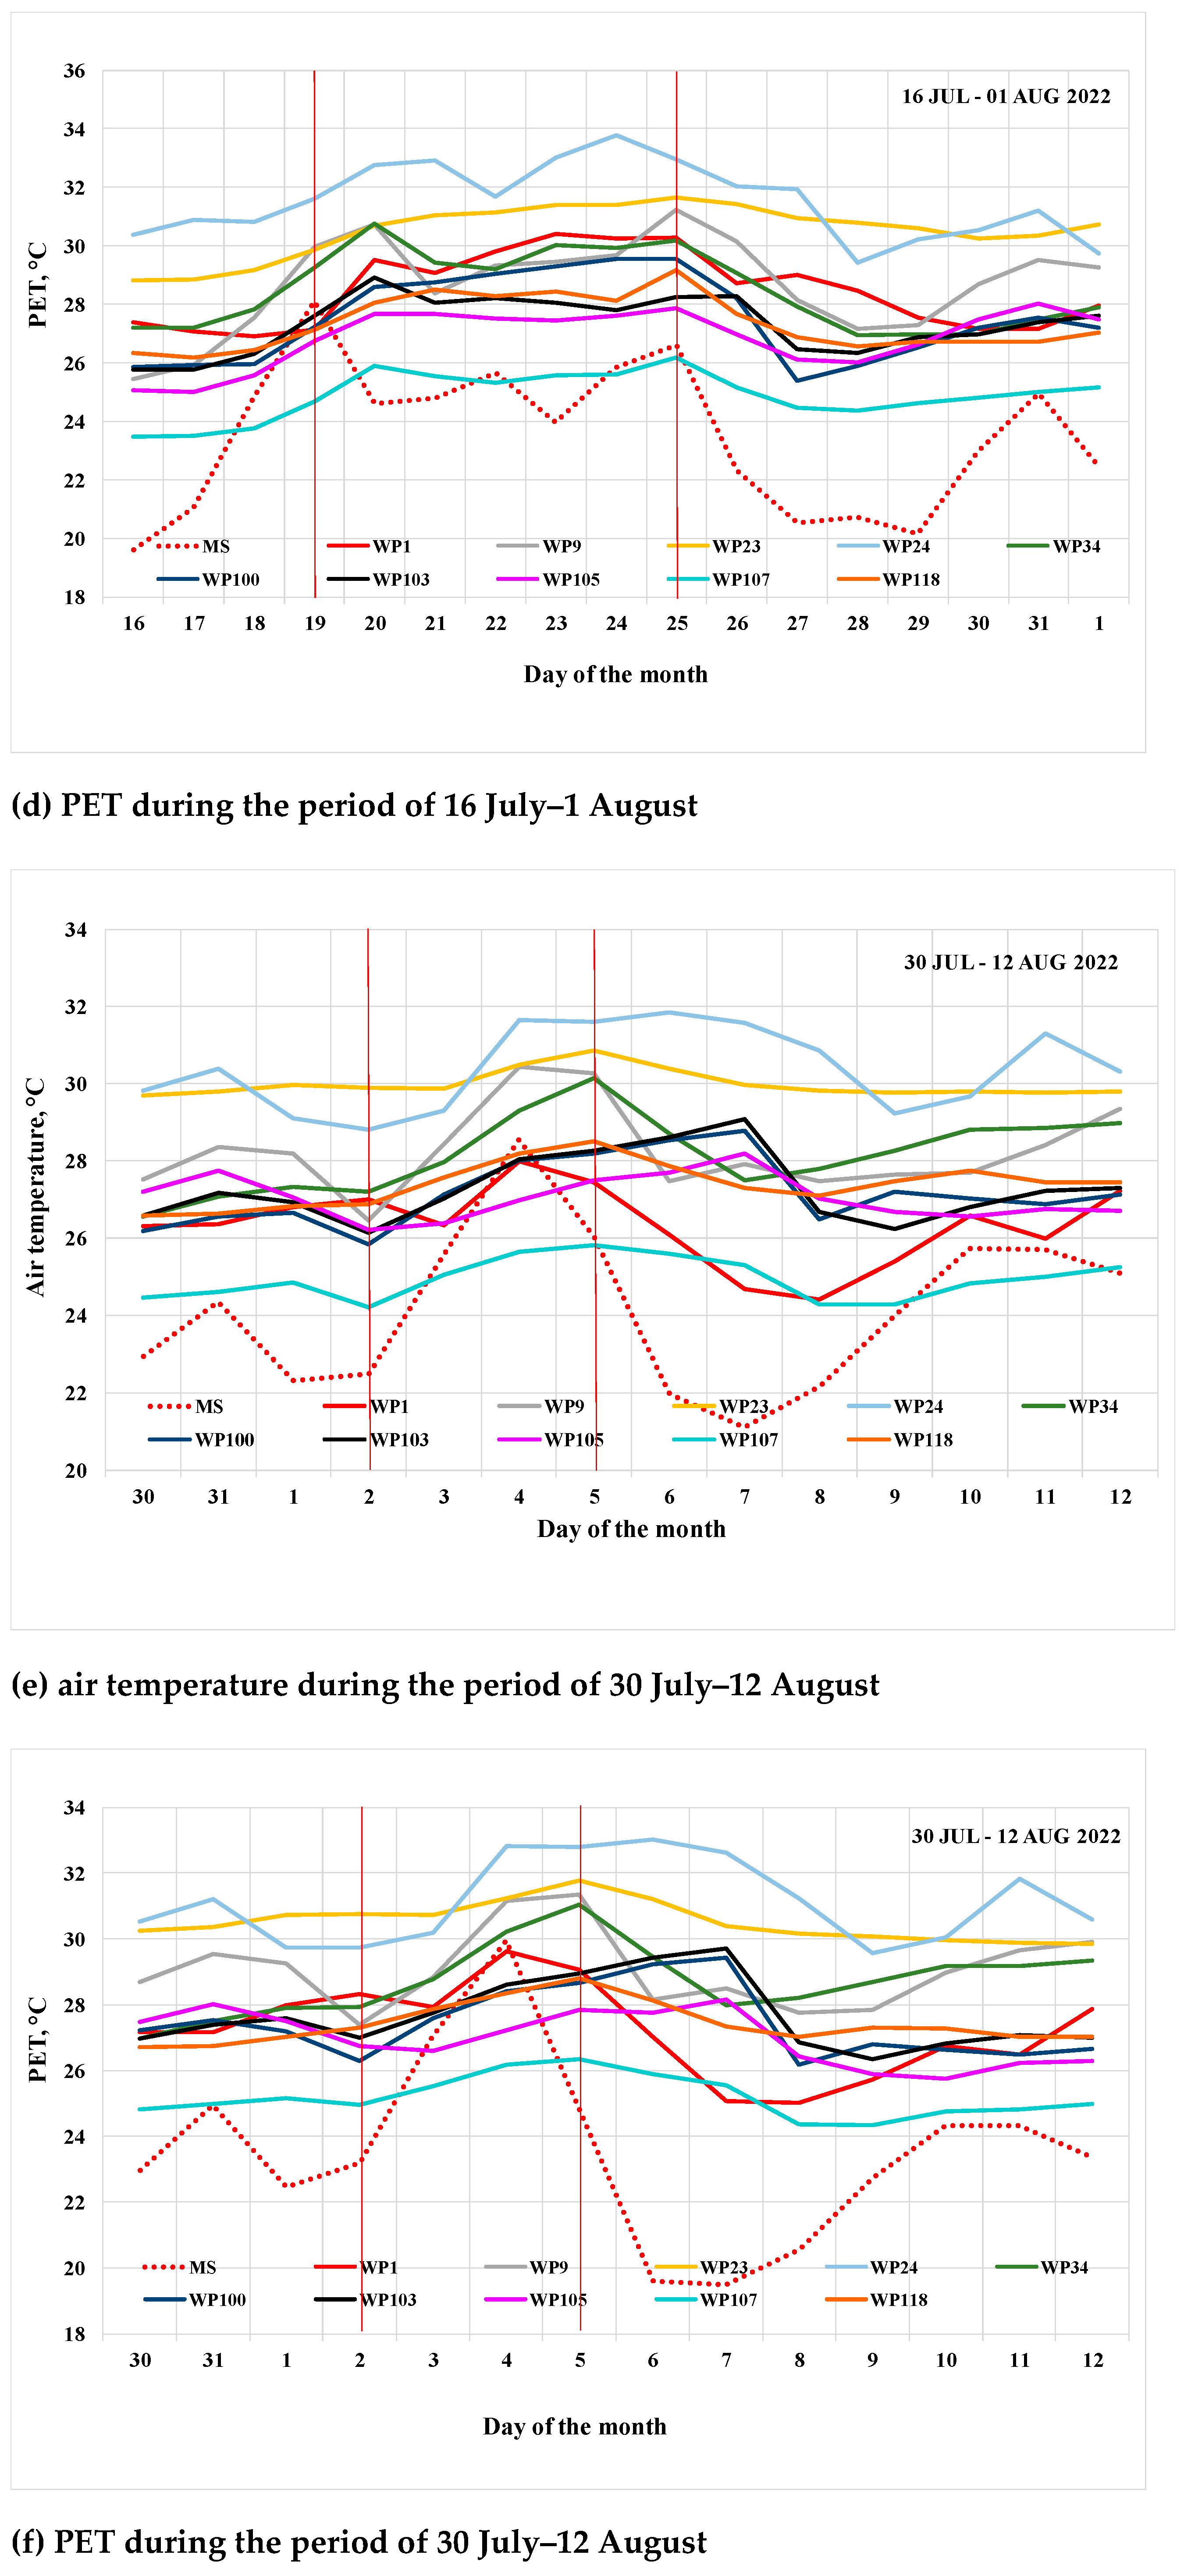
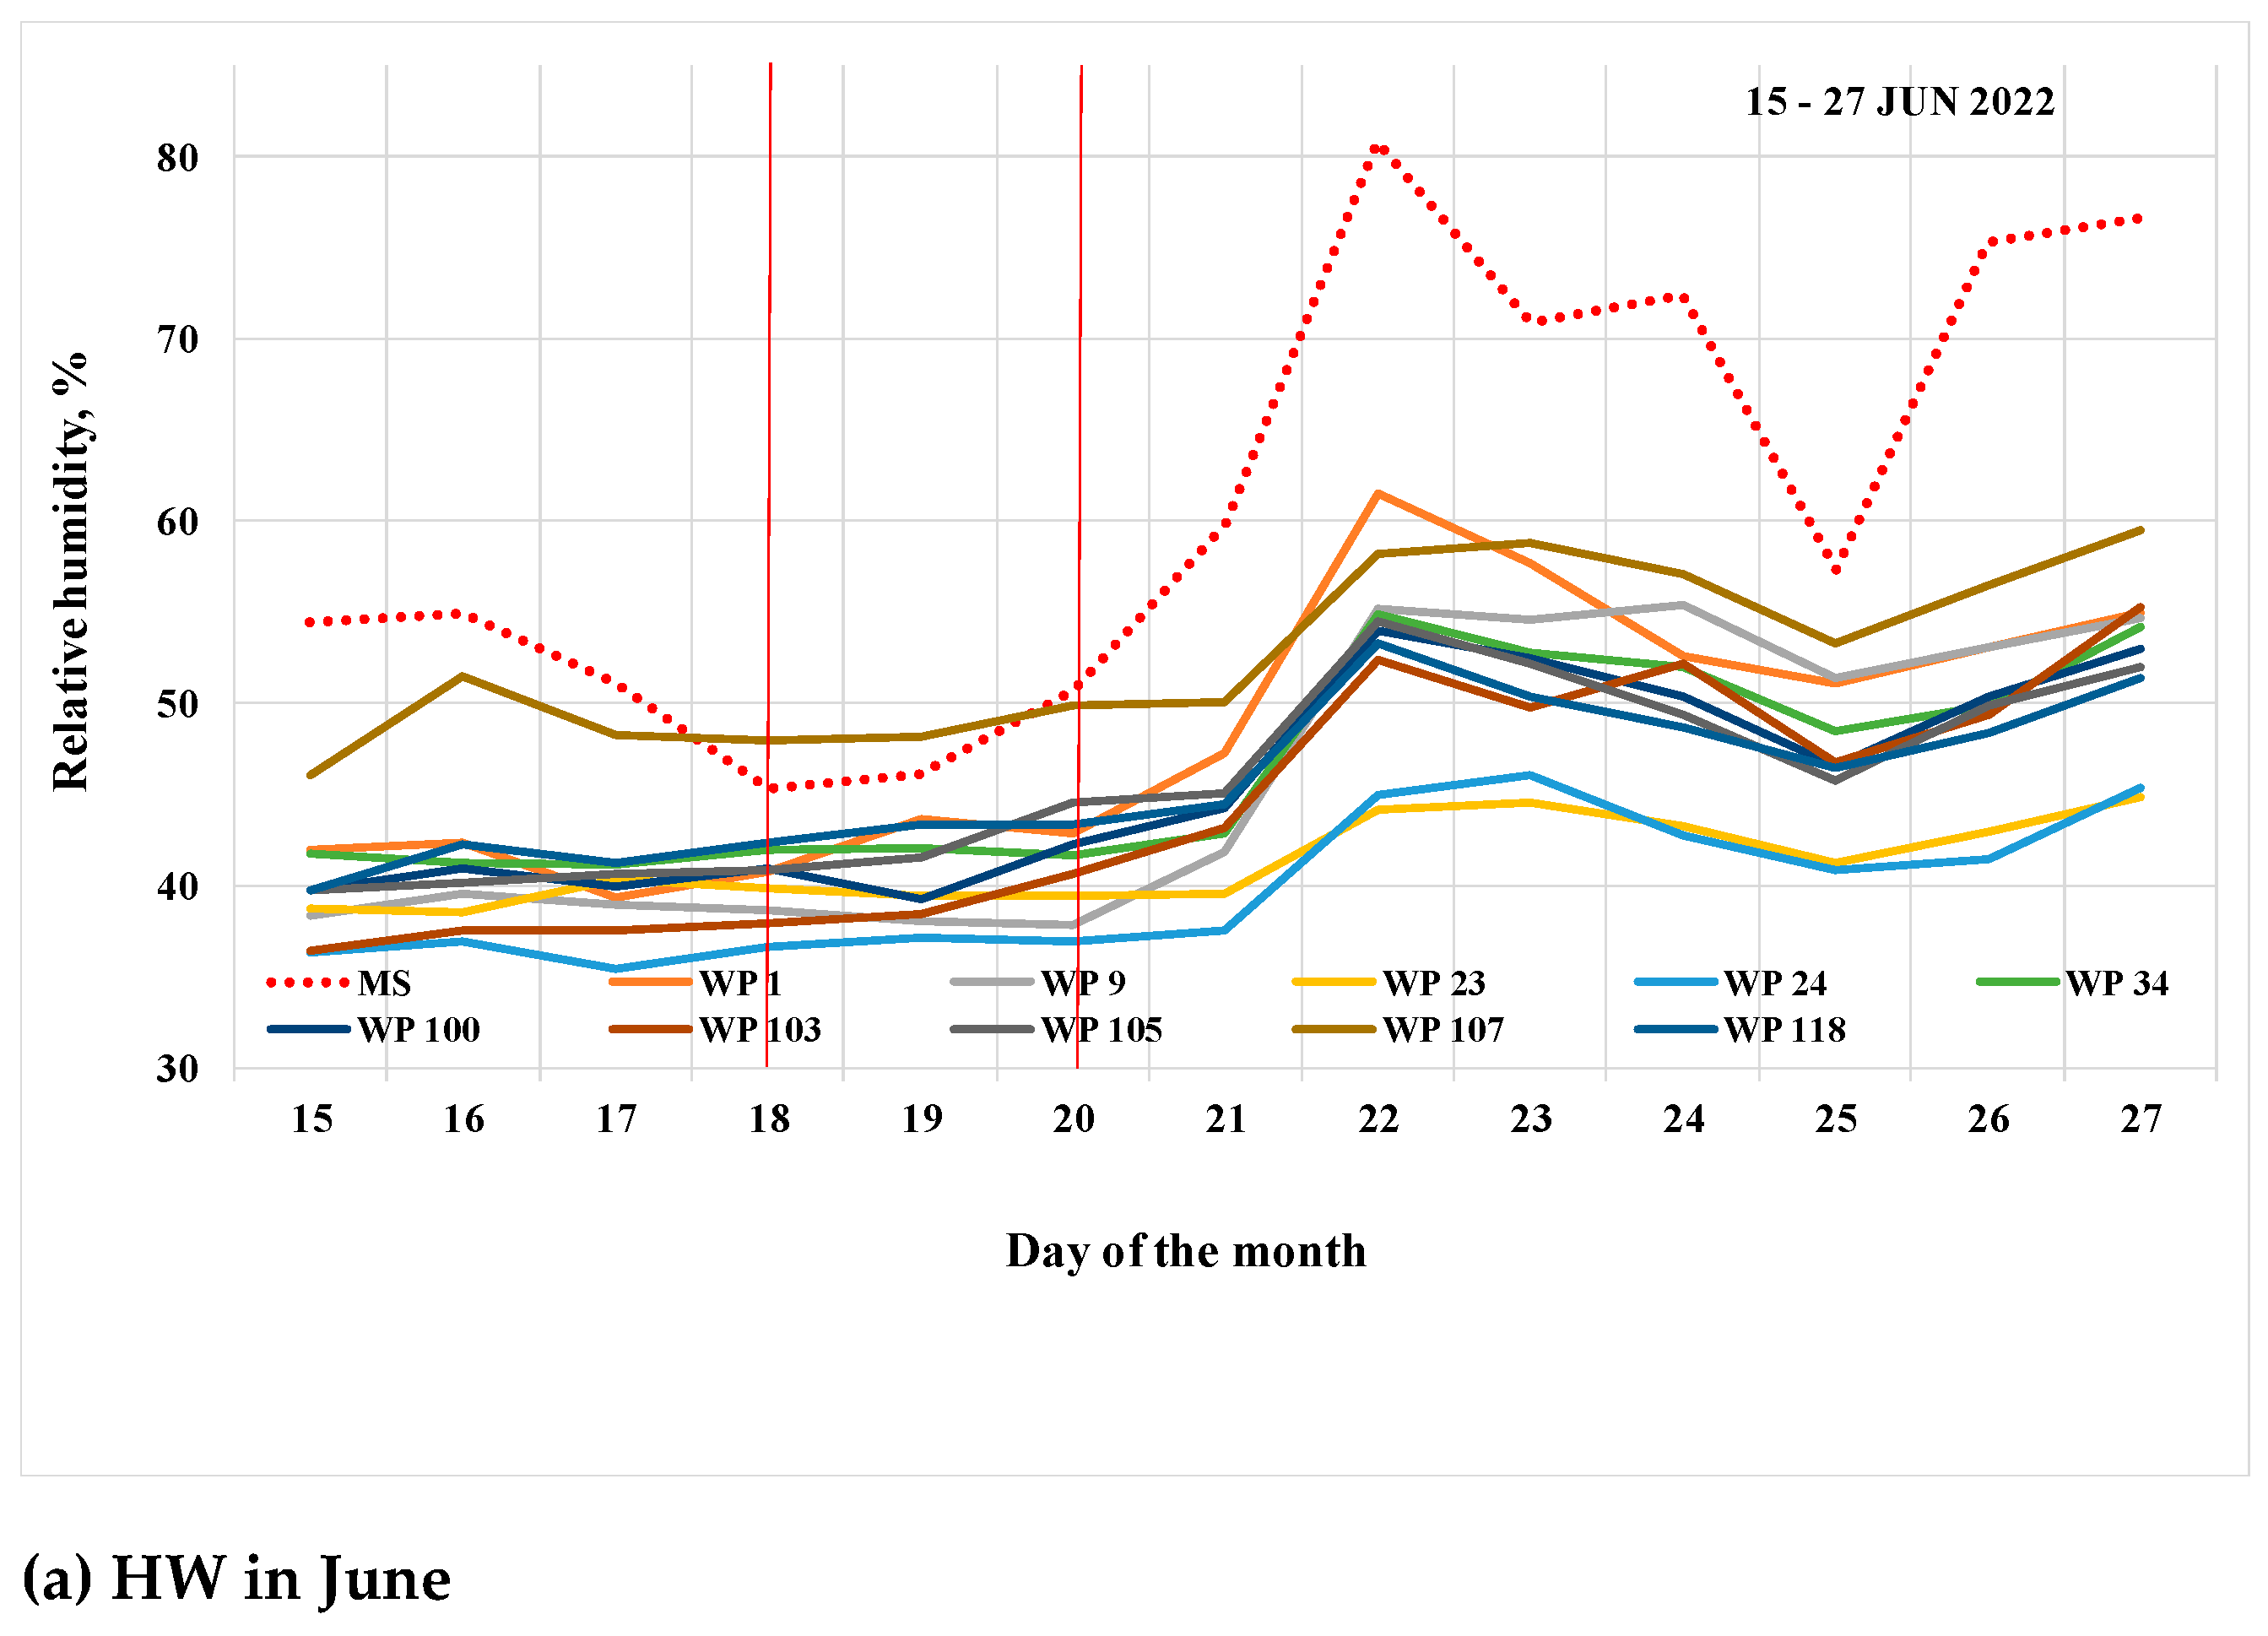
3.1. Meteorological and Biometeorological Condition of Freiburg in Summer 2022

The year 2022 was the second-warmest year ever recorded in Freiburg since 1948. Also, summer (June to August) 2022 was the second-warmest summer ever measured in Freiburg, only exceeded by 2003. The mean summer air temperature measured at the MS in Freiburg in 2022 was 21.9 °C (Table 3), which is 1.9 °C above the mean air temperature for the reference climatic period of 1991–2020. Hence, the year 2022 exemplifies a typical level of heat stress to be experienced in the coming decades based on climate projections. During summer 2022, three HWs were observed in the Freiburg area that met the above HW criteria: (1) 18–20 June, (2) 19–25 July, and (3) 2–5 August.
The mean summer (June to August) air temperature in the researched offices ranged between 23.7 °C (WP107) and 29.1 °C (WP24). The lower air temperature at WP107 could be explained by the fact that this room was the only one in the study equipped with an air-conditioning system. Furthermore, WP107 is located on the ground floor and has the highest ceiling among the studied rooms. The windows face east–southeast. WP24 is located on the third floor of a six-story building, with windows facing west, and the ceiling is 1.05 m lower than at WP107. The air temperature range, calculated as the maximum minus the minimum of the hourly values, for June to August 2022 varied between 7 °C (WP23) and 15.8 °C (WP9). These values are significantly lower than the air temperature range measured at the MS, which was 29.0 °C.
The highest mean PET values were found at WP24 and the lowest at WP107, the WP with air conditioning. The mean PET value calculated based on the MS data was 21.9 °C, which was at least 2 °C lower than at any WP. A more detailed analysis of the PET showed that inside the buildings, PET values ranged between 7 °C (WP23) and 15.8 °C (WP9), while the PET range observed at the MS was 29 °C. Most PET values in the workplaces were in the range of slight heat stress (WP1, WP9, WP34, WP100, WP103, WP105, WP107, and WP118) or moderate heat stress (WP23 and WP24) (Table 4). Comfortable conditions were most frequent at WP107 (26.9%). Less than 5% of comfortable conditions were identified at WP1, WP23, WP24, WP100, WP103, WP105, and WP118. A few values belonging to the classes of severe heat stress and slight cold stress were found at WP9, WP24, WP107, and WP118. All classes of physiological stress (including one value for extreme cold stress and one for extreme hot stress) occurred at the MS in the summer of 2022. Most PET values belonged to the classes of slight cold stress, no thermal stress, slight heat stress, and moderate heat stress (~20% for each class). The highest frequencies of moderate, strong, and extreme heat stress were recorded at WP23 and WP24, which reached 53.7% and 61.6%, respectively. Meanwhile, at the MS, the frequencies of these classes of heat stress were 22.6%. The frequency of slight heat stress in the summer of 2022 at WPs ranged between 38% and 97.4%, with values above 90% at WP100, WP103, WP105, and WP118. At the MS, the frequency of slight heat stress was 20.1%.
The differences between the mean PET values and the mean air temperature values were positive at all WPs (except WP105) and ranged from 0.2 °C (WP107 and WP118) to 1.1 °C (WP1). At WP105, the mean air temperature value was 0.1 °C higher than the PET value. The differences between the mean PET values and the mean air temperature values during the daytime (9:00–18:00) were nearly the same. The highest value of the differences was found at WP1 (1.1 °C), while the lowest was at WP118 (0.2 °C). At WP105, the mean PET and air temperature values were the same. Only the difference at the MS during the daytime was much higher, reaching 2.5 °C.
The mean summer RH was the highest outside at the MS (58.7%). Among the researched WPs, the highest mean RH was found at WP107 (49.5%) and the lowest at WP24 (38.3%). The range of RH values at the MS was 84.8%, while inside the buildings, it was between 24.8% (WP23) and 47.8% (WP9).

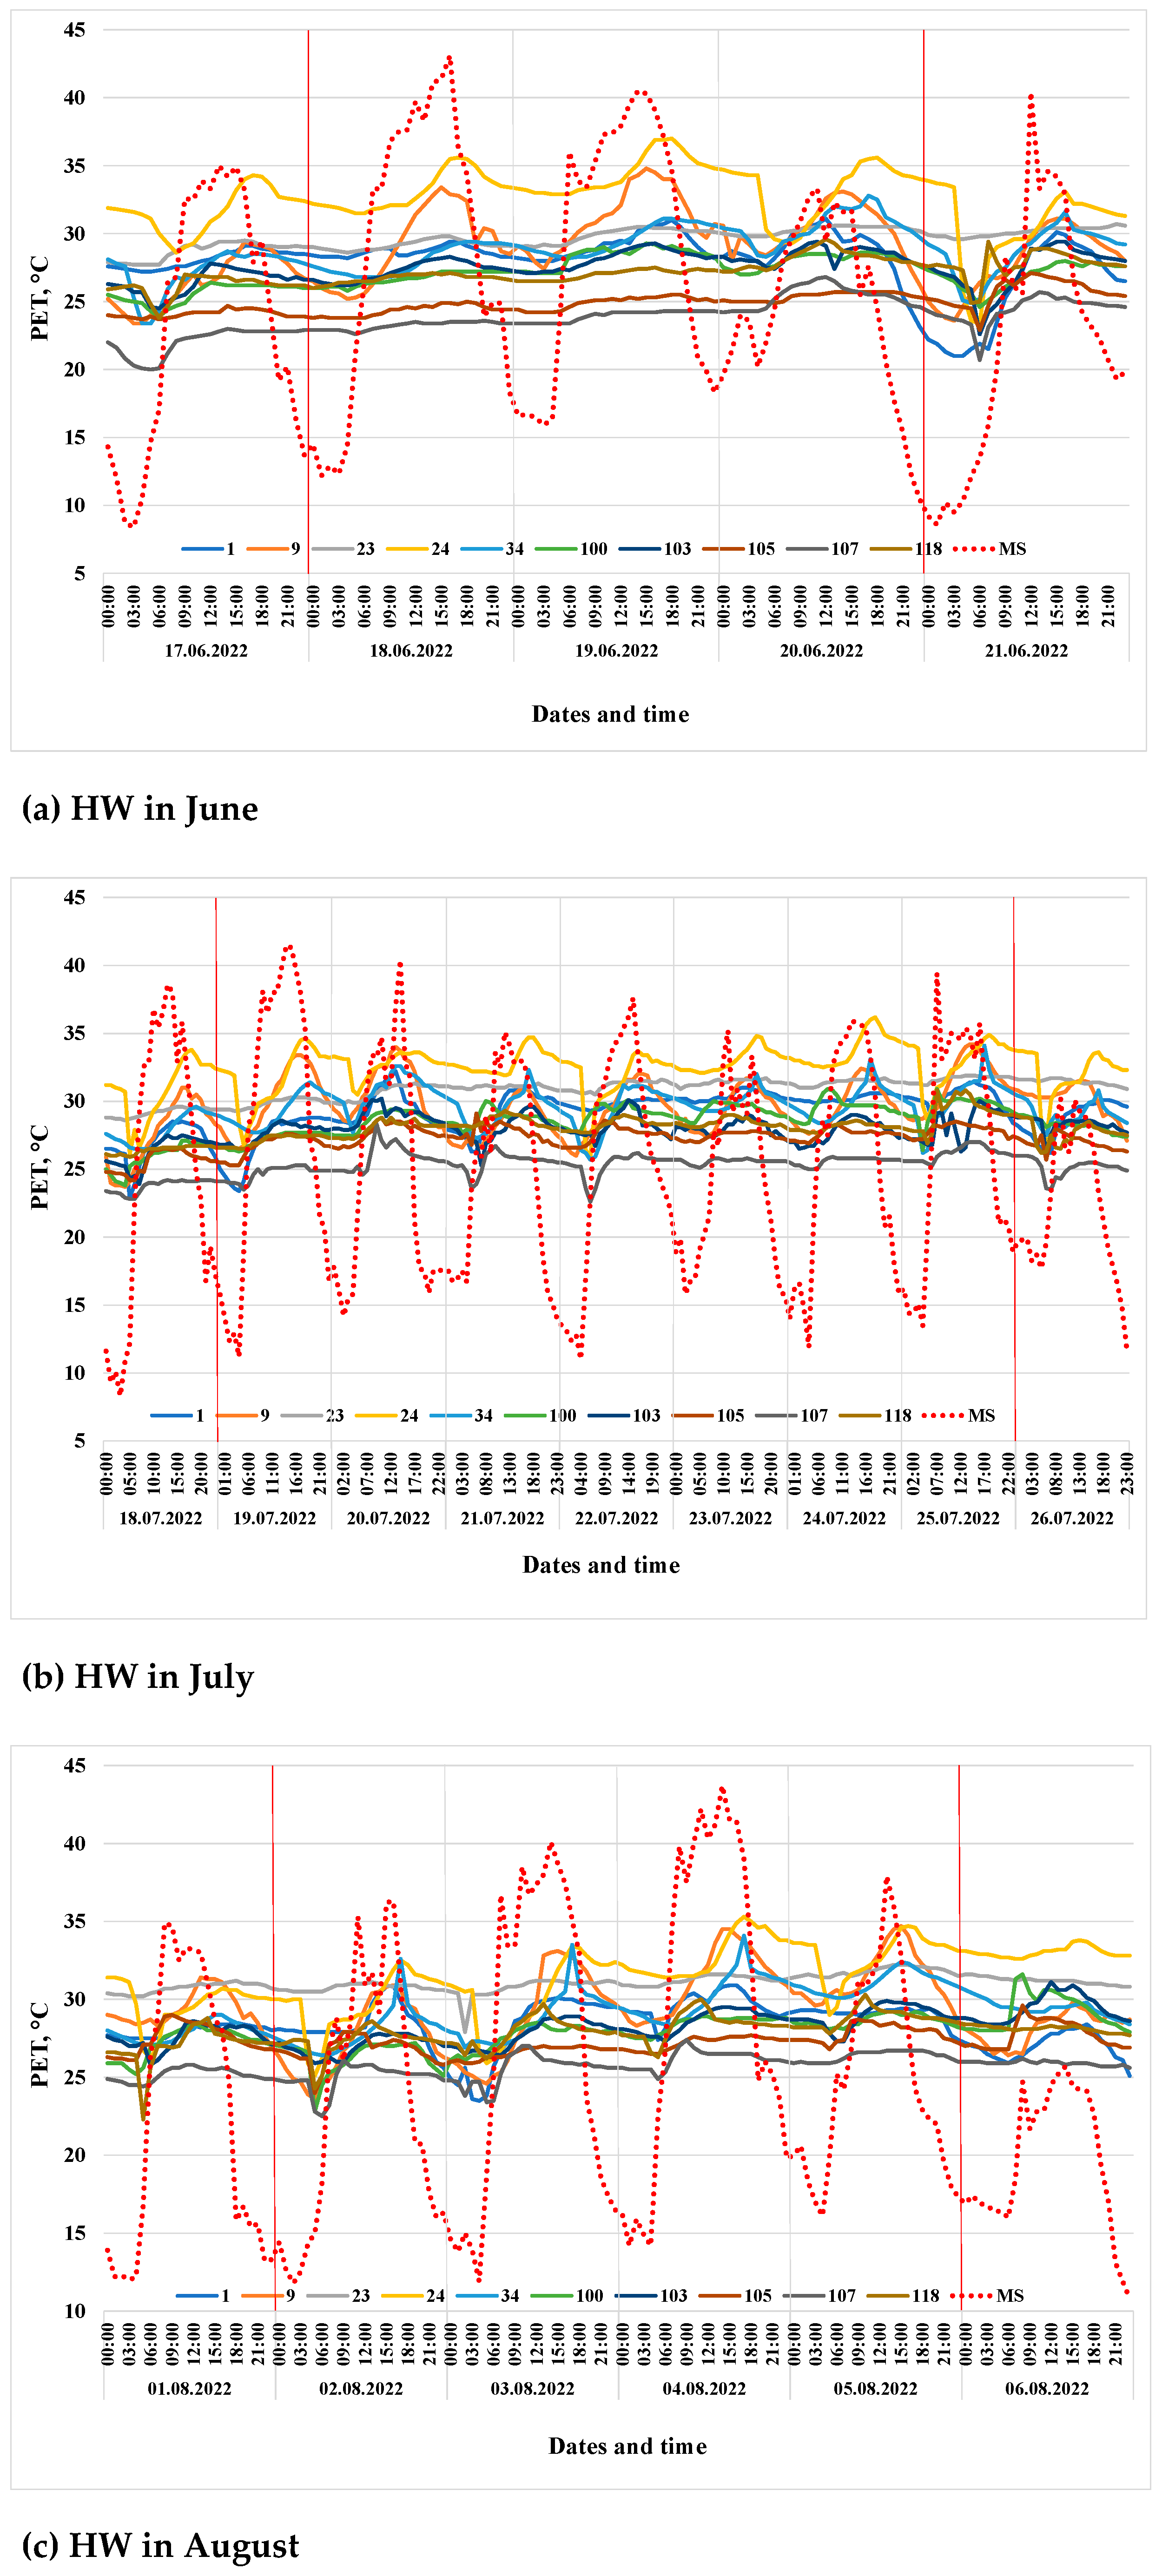
3.2. Thermal Comfort Conditions During Heat Waves

Three HWs occurred in Freiburg during the summer of 2022: 18–20 June, 19–25 July, and 2–5 August. During the HW in June, the hourly outdoor air temperature values ranged between 15.2 °C and 35.6 °C, and during the daytime (9:00–18:00 UTC), the air temperature did not drop below 25.9 °C. The mean daily air temperature was 24.5–28.7 °C, which was much higher than the mean monthly air temperature for June 1991–2020 (18.3 °C). The HW of July 2022 was characterized by hourly outdoor air temperature values between 15.3 °C and 36.5 °C, and the minimum daytime air temperature was higher than 19.8 °C. Mean daily outdoor air temperature values during this HW were between 24.0 °C and 28.1 °C, while the mean monthly air temperature in Freiburg in 1991–2020 in July was 20.1 °C. The hourly air temperature ranged between 15.4 °C and 37.3 °C during the HW in August, and in the daytime, 24.2 °C was the air temperature minimum. The mean daily air temperature values (23.2–29.9 °C) during this HW were 3.5–10.2 °C higher than the mean monthly air temperature in August.
As mentioned above, the researched workplaces were characterized by different thermal conditions. During the three HWs of summer 2022, the most strenuous conditions were found at WP24 and the lowest air temperature and PET values were found at WP107, the only WP equipped with an air-conditioning system. The analysis of air temperatures and PET a few days before HWs, during HWs, and after showed that mean daily air temperature and PET values at some WPs reacted more conservatively to changes in thermal conditions outside (Figure 2). WP118, WP107, and WP23 were characterized by slow and delayed changes in mean values from day to day. For instance, the amplitudes of daily values of indoor air temperatures during the period of 30 July–12 August were less than 2 °C at these WPs. Nevertheless, these WPs differed significantly in their air temperatures and PET: WP107 was the office with the lowest thermal load, WP118 was an office in the middle range of observed air temperatures among the WPs observed, and WP23 was characterized by some of the highest values of air temperature and PET. WP23 is situated in an office on the fourth floor of an old six-floor building (built at the beginning of the 20th century). The windows face east–northeast. It is the only office among the researched WPs without any shading on the windows.
Values of RH depend on the amount of water in the air as well as the air temperature. At a constant mass of water vapor in a room, as the air temperature decreases, the RH will increase, and vice versa; therefore, HWs at moderate latitudes are quite often associated with a low RH. Accordingly, the days with the highest air temperature should correspond to the days with the lowest RH in Figure 3. But depending on local conditions and the weather before HWs it could be quite different. Changes in mean daily values of RH measured at the MS during the HW in June 2022 in Freiburg were quite low, while changes in RH in the studied offices were even lower, almost imperceptible. Meanwhile, in some WPs, the daily values of RH were slightly lower than before, while in others, they were a bit higher. Nearly all WPs were characterized by similar values of RH, with the exception of WP107, with the air conditioning, where the values were higher.
Mean daily RH values during the HW in July were characterized by complex dynamics, with higher and lower values on different days. The differences between values at different WPs were much higher than during the HW in June. The lowest values were found at WP23 and WP24, and the highest at WP107.
During the HW in August 2022, changes in RH were quite similar at the MS and at the WPs. The lowest values were found on 4 August at all researched locations except for WP34. The differences between values at WPs were more than 14%.
The rise in mean daily air temperature in the researched offices on the first day of heat was uneven (Figure 4). The differences between the mean air temperature on the first day of the HW in June and the previous day ranged between 0.2 °C (WP105) and 2.2 °C (WP9), while at the MS, it was 4.4 °C. The highest difference in air temperature at the beginning of the HW in July was found also at WP9 (2.2 °C), while the mean air temperature was the same on the first day of the HW and the previous day at WP1. The HW in August started with not so rapid rising in air temperature outside (only 0.2 °C). The mean daily air temperature on the first day of the HW increased only at a single workplace (WP1), while it did not change at WP118 and decreased at the other WPs (−0.1 °C to −1.7 °C).
In the analysis of hourly measured air temperature and PET values, it was found that the timing of the increase and decrease in these variables was largely synchronous inside and outside of the buildings during HWs (Figure 5 and Figure 6). Some WPs were characterized by very low daily amplitudes of air temperature and PET, and a daily course nearly absent. These WPs were also characterized by small changes in mean daily values from day to day (WP107, WP118, WP23). At all these WPs, the rate of change in PET values was small, but their levels of human thermal load differed. Lower PET values were found at WP107 and higher PET values at WP23. The differences in the hourly PET values at these WPs were about 5 °C. Most of the hourly PET values during the HWs in the summer of 2022 belonged to the classes of slight (23.1–29.0 °C) and moderate (29.1–35.0 °C) thermal stress inside the researched offices (Figure 7). Only a few hours without heat stress (PET > 23.1 °C) were observed at WP100 and WP107, and some values higher than 35 °C at WP24. WP103, WP105, WP107, and WP118 were mainly characterized by slight heat stress during all researched HWs (81.3–100.0% of hourly values), while at WP9, WP23, and WP24, moderate heat stress prevailed (60.7–100%). Moderate heat stress prevailed at WP100 during the HWs in June and August 2022 (93.8–95.8%), but during the HW in July, about 50% of values belonged to the class of slight heat stress and about 50% to the class of moderate heat stress. Also, different ratios between these two classes were found for WP1 and WP34. The amplitude of the PET values and the frequency of the thermal stress classes were different outside. Slight thermal stress ranged between 14.3% and 18.1% during the HW events, moderate was between 14.6% and 27.9%, strong was found in 13.1–22.2% of cases, and extreme in 1.2–5.2%. Comfortable conditions were observed in the early morning time or evening and ranged between 13.9% and 16.7%. Cold stress was found during a few hours of nearly every night during the HW events (19.4–28.6%).

4. Discussion

4.1. Coupling Indoor and Outdoor Heat Stress

The results show that air temperature, humidity, and PET regimes differ significantly at different workplaces (WPs) both during HWs and throughout the summer. However, lower diurnal amplitudes of both meteorological values and PET were recorded at all WPs compared to outdoor conditions. This occurred as at night, buildings do not cool as much, and so their minimum air temperature values are higher, which, accordingly, reduces the amplitude of indoor air temperature and PET. The maximum daily air temperature values were often, but not always higher at the outdoor meteorological station (MS) during the research period. With that said, quite often, air temperatures were almost the same outdoors and indoors, and on some days, they were even higher in some WPs than outdoors.
Among the studied WPs, only one was equipped with air conditioning (WP107) and, as expected, air temperatures at this WP were several degrees lower than at the other WPs, while RH values were constantly higher by several percent. The diurnal amplitudes of air temperature and PET values at this WP were very low and daily variation in these meteorological variables was practically absent. The thermal regimes in the other nine workplaces without air conditioning differed significantly both in terms of average air temperatures and their diurnal amplitudes. Some WPs were characterized by very low diurnal amplitudes (and practically no daily variation), while the daily variation in others was considerable, although always with lower diurnal amplitudes than at the outdoor MS (WP9, WP24, WP34). The lowest diurnal amplitudes (except for WP107) were recorded at WP118 and WP23. These WPs have some common characteristics, but also some distinctive ones. For example, both of these WPs are located in buildings built in the early 20th century (1900–1930) with thick stone walls and with windows facing E (WP118) and ENE (WP23). At the same time, one building has three floors (WP118) and the other has six (WP23). The WPs are located on the ground floor and on the fourth floor. In WP118, the windows are shaded by a roller shutter, and at WP23, there is no shading of the windows. To establish which factors are decisive in the formation of the thermal regime and daily amplitude of the offices, it would be also necessary to analyze the characteristics of the places where the buildings are located, not just the buildings and offices themselves.
Most commonly, in Central Europe, HWs are associated with high air temperatures and low RH levels, but there are exceptions when humidity values are also higher. Russo et al. [56] proposed and defined the category of humid HWs. Under high RH values, even moderate air temperature values can lead to heat stress [57]. Humid HWs have not only direct health outcomes but also large-scale economic impacts [57,58,59]. They occur mainly in tropical regions or in areas where hot and humid air is advected from surrounding water bodies [56]. But they can also arise on any territory after an extended period with substantial precipitation and considerable evapotranspiration. If humid HWs are observed in regions where populations are adapted to hot humid climate conditions (like in the tropics), the negative impact on health and economic losses will be less.
In public weather forecasts, synoptics from DWD frequently apply the term “sultriness” to describe conditions with warm and moist air masses, especially with thunderstorms developing under unstable air-layering in the summer season [60]. Studies valid for eastern Germany [61] establish the threshold for sultry atmospheric conditions at the dew-point temperature Td = 14.5 °C, which closely matches the “neutral humidity” of 16 hPa equivalent to Td = 14 °C or a water vapor concentration of 12 g m−3. This is defined as the threshold for sultriness as a combined effect of a high air temperature and humidity, represented by a so-called perceived temperature greater than 24 °C [60,62,63].
The analysis of the mean daily values of vapor pressure (VP) three days before, during, and seven days after HWs in Freiburg during the summer of 2022 showed that during the HW in July, sultry atmospheric conditions were observed both at the meteorological station and at the researched WPs (Figure 8). The values of VP started rising on the first day of the HW, and from the second, they were higher than 16 hPa and corresponded to sultriness. VP values were quite similar inside and outside. The differences between WPs were at most 4 hPa. The highest daily values of VP during the HW were recorded on the second day at the MS, while at the WPs, they came later. VP values decreased synchronously at the WPs and at the MS on the first day after the HW.
During the HW in August, VP values also exceeded 16 hPa at almost all WPs, except for some days at WP9, WP103, WP105, WP107, and WP23. The highest VP values, similar to the heat wave in July, were recorded at WP1 and WP24. The HW in June was the shortest (only 3 days) and was characterized by VP values below 16 hPa outside and at most WPs indoors. Sultry atmospheric conditions during the HW in August were observed only at WP24.
The analysis of the changes in the mean daily values of RH and VP during the periods of the HWs showed that VP is a more useful variable, because it delivers the amount of water in the atmosphere, which is useful for assessing changes in the thermal load on the human body both outdoors and indoors. The mean daily RH values during the HW in June were nearly the same during the HW as before and afterward. During the HW in July, the RH increased, and during the HW in August, the RH decreased, which made it difficult to assess humidity impacts on the human thermal load. Meanwhile, for VP, values increased during all three HWs, showing that thermal load on the human body increased. Most research studies on HWs at temperate latitudes have been based on air temperature only. Air temperature values are commonly used to identify and characterize HW events. However, as the results have shown, even at extra-tropical latitudes, and far from the seas or oceans, HWs can be characterized by higher humidity and place a high thermal load on the human body, even if the air temperature is moderate. Therefore, we recommend that HW definitions should be based on the values of air temperature and VP, for a more comprehensive and inclusive assessment of the stressors.
HWs influence the air temperature, PET, and VP inside buildings, but the rates of increase and the maximum values differ. The relationships of air temperature and PET between the MS and different WPs were investigated using a correlation analysis (Table 5). The highest correlation values were found between the MS and WP9 for air temperature and PET. The values of the variables at this WP were lower than at the MS and had smaller amplitudes, but the diurnal course and the changes in the mean daily values from day to day were quite similar. This WP is situated on the third floor of a 12-story building made from concrete and constructed in 1950–1970, with a window exposition to the south. The window is equipped with a jalousie. The room height is 3 m and the size is about 22 m². It is difficult to distinguish a dominant characteristic leading to greater connections between air temperature and PET values, but generally, amongst the studied WPs, lower correlations were found in buildings constructed in the early 20th century (average r2 = 0.46) than those from between 1950 and 1990 (average r2 = 0.55). This may reflect the thermal masses of buildings. Older buildings (1900–1930) generally have thicker walls (stone) and hence a larger thermal mass. While there was a more conservative link between outdoor and indoor air temperatures and PETs in older buildings, the absolute values of air temperature and PET did not show any clear correlation with the construction era; hence, thermal stress was found across the building stock.
Clustering is a useful technique often used in meteorology and the other environmental sciences. Clustering involves dividing patterns into groups of similar objects according to various “similarity” features. Hierarchical clustering algorithms can be separated into top-down and bottom-up approaches. In bottom-up algorithms, each sample is regarded as a single cluster at the beginning, which will be merged into pairs of clusters until all clusters are combined [64]. According to the hierarchical clustering of the ten WPs which was performed by single-linkage clustering in a bottom-up fashion (agglomerative clustering) (Figure 9), finding a cluster with similar thermal comfort conditions, which consisted of WP1, WP9, WP34, WP100, WP103, WP105, and WP118. WP23 and WP24 belonged to a small cluster with similar conditions, and WP107 was characterized by quite different conditions. WP23 and WP24 were the offices with the highest air temperature and PET values, both during the whole summer period and the HWs, and also the weakest correlations between indoor and outdoor conditions. The highest frequencies of moderate, strong, and extreme heat stress were found at WP23 and WP24 in summer 2022, reaching 53.7% and 61.6%, respectively (Table 4). But analysis of these WPs did not reveal many similar characteristics that could have produced strenuous human–biometeorological conditions during the warm period. These WPs are situated in different buildings. One building was built in 1900–1930 and the other post-WWII (1950–1970). WP23 is on the fourth floor and WP24 is on the third floor. A window without shading is orientated to the east–northeast with a window-to-wall ratio of 30% at WP23, and a window with jalousie is orientated to the west with a window-to-wall ratio of 50% at WP24. WP23 is additionally equipped with a fan.
WP107 is one of three WPs situated on the ground floor and the only one from the researched workplaces equipped with an air-conditioning system; therefore, it was characterized by quite different thermal conditions from the others, with a lower heat load. Moderate, strong, and extreme heat stress were not found at this WP in summer 2022. Comfortable conditions were most frequent at WP107 (26.9%) out of all the WPs (Table 4).

4.2. Characteristics Influencing Indoor Heat Stress

Not only do building and room characteristics influence the indoor thermal regime but also the characteristics of the surroundings of a building: trees or their absence, grass or paved areas, additional heat emissions (from cars or chillers), the albedo of external surfaces, the building configuration, etc. A multitude of studies have been conducted on the influence of each of these factors on thermal regimes both outdoors and indoors. The shadowing effect (which impedes direct solar exposure and warming of the building) strongly depends on the geometry of urban spaces and urban trees. Trees affect the urban microclimate through shading, evapotranspiration, and increased albedo; therefore, they are capable of decreasing air, surface, and mean radiant temperatures and increasing humidity [65,66,67]. However, the intensity of these impacts is dependent on tree species and their physical and morphological configuration (tree height, trunk height, crown height, leaf density distribution, and crown diameter) [68]. Lower air temperatures and higher RH levels have been found not only near urban trees outside but also inside tree-shaded buildings compared to unshaded buildings [69,70]. On the one hand, a lower indoor air temperature in summer reduces the energy consumption for cooling in buildings, but in combination with increasing humidity, the influence on human thermal perception can be unfavorable.
Deeper street canyons as well as building archetypes like courtyards and urban blocks, where taller bounding buildings impede solar access and increase the average coverage of shadow-casting, reduce surface and radiant energy, decreasing thermal stress in the daytime [68,71]. The geometry of urban spaces as well as the design of green areas not only have significant impacts on indoor and outdoor thermal environments but also on the speed and direction of airflow. An arrangement of buildings parallel to the prevailing wind direction will experience wind deflection on one facade and airflow separation on the other, which could provide better natural indoor ventilation [72]. Cross-ventilation is a traditional method for improving the indoor thermal environment and now is attracting considerable attention as a measure for the sustainable design of buildings [73]. According to Mochida et al. [73], indoor thermal comfort in a warm period can be improved significantly by controlling window opening appropriately in accordance with the temporal variations in indoor and outdoor conditions. Rosenfelder et al. [74] found that regulation of the indoor climate only with natural ventilation is not appropriate for short-term cooling, and that to avoid overheating the building, it must be cooled for some time before the outside air temperature is raised.
If the urban energy balance of the surrounding area causes increased outdoor air and surface temperatures, this will also affect the indoor air temperature and influence human thermal comfort. The study of the mean maximum surface temperature values of different surfaces during July 15 to August 15 conducted by Djekic et al. [75] showed that black rough granite was the hottest material (59.4 °C), followed by asphalt (58.8 °C), other sorts of granite surfaces (gray and red granite), and concrete surfaces (rustic terrazzo and behaton tiles). The lowest surface temperature value, as expected, was for a grass surface (34 °C), which was lower than the mean maximum air temperature (35 °C) [75]. Subjective thermal comfort evaluation has shown that people feel more comfortable inside buildings with greenery outside than in buildings with concrete outside [74,76]. Not only do the types of the surfaces influence albedo significantly, and consequently indoor temperature, but also their spectral properties [77]. For instance, in summer, during hours of maximum solar radiation, the surface temperature of white-colored walls is lower by about 3 °C than that of gray walls of the same building [78], and black-painted walls have at most a 7 °C higher surface temperature than corresponding white-painted walls [79].
Therefore, when researching the coupling of indoor and outdoor heat stress, it is important to consider a comprehensive set of factors (Figure 10).

5. Conclusions

This study analyzed the coupling of indoor and outdoor heat stress during three heat wave (HW) events in summer 2022 at ten different workplaces (WPs) in the medium-sized city of Freiburg, Germany. The main findings of this study are the following:
1. The levels of thermal stress at the monitored WPs during the three HWs were different and depended on the initial thermal conditions before the onset of the HW. The thermal regime inside the buildings differed from the conditions outside as well as among the studied WPs. The mean physiologically equivalent temperature (PET) for summer 2022 calculated based on data from an outdoor meteorological station was 2 °C lower than at any researched WP. According to the PET levels at the different WPs, the most frequent classes of physiological stress were slight heat stress at eight of the ten workplaces, which occurred 62.4% to 97.4% of the time, and moderate heat stress at the other two workplaces, which occurred 53.7% and 60.6% of the time. At the meteorological station, all classes of physiological stress were observed. The most frequent PET values at the meteorological station belonged to the classes of slight cold stress, comfortable conditions, slight heat stress, and moderate heat stress (~20% for each class).
2. The diurnal amplitudes of air temperature, humidity, and PET during the summer differed significantly at the ten WPs. In some offices, the values of these variables hardly changed during the day, while in others, clear daily variations were found. Buildings constructed between 1990 and 1930 showed a lower correlation with outdoor heat conditions compared to rooms in buildings constructed post-WWII between 1950 and 1990, most likely due to thermal mass differences.
3. Humid heat waves can occur not only in tropical regions but also in other territories after a long period with precipitation. Human biometeorological research on heat waves both outside and inside should include information about humidity. It is argued that vapor pressure is a more appropriate variable to characterize and contrast different HWs than average relative humidity, and it can offer an indicator of sultriness.
4. For future analysis of connections between indoor and outdoor heat stress and a better understanding of key factors that influence human thermal comfort at different workplaces, future work should not only consider room and building characteristics, but also include characteristics of the surroundings of the building (for instance, urban geometry, types of the surfaces, availability of trees and their characteristics, additional heat emissions, etc.).

Author Contributions

Conceptualization, A.M. and A.C.; methodology, A.M. and O.S.; software, M.S.; validation, O.S., M.S. and A.M.; formal analysis, O.S.; investigation, O.S., M.S. and A.M.; resources, O.S. and M.S.; data curation, O.S. and M.S.; writing—original draft preparation, O.S. and A.M.; writing—review and editing, O.S., M.S., A.M. and A.C.; visualization, O.S.; supervision, A.M.; project administration, A.C. All authors have read and agreed to the published version of the manuscript.

Funding

The indoor sensors were built and deployed as part of the INTERREG V— Rhin Supérieur program “Clim’Ability Design” (8.3) funded by the European Union through the European Regional Development Fund (ERDF). Data management, documentation, and analysis of indoor data were supported by the ERC Synergy Grant “urbisphere” (grant no. 855005).

Institutional Review Board Statement

Not applicable.

Informed Consent Statement

Not applicable.

Data Availability Statement

The data presented in this study are available on request from the corresponding author. The data are not publicly available due to privacy.

Conflicts of Interest

The authors declare no conflicts of interest.

References

  1. Barriopedro, D.; Fischer, E.; Luterbacher, J.; Trigo, R.; García-Herrera, R. The hot summer of 2010: Redrawing the temperature record map of Europe. Science 2011, 332, 220–224. [Google Scholar] [CrossRef]
  2. Grumm, R. The central European and Russian heat event of July-August 2010. Bull. Am. Meteorol. Soc. 2011, 92, 1285–1296. [Google Scholar] [CrossRef]
  3. Hoy, A.; Hänsel, S.; Skalak, P.; Ustrnul, Z.; Bochníček, O. The extreme European summer of 2015 in a longterm perspective. Int. J. Clim. 2016, 37, 943–962. [Google Scholar] [CrossRef]
  4. Krzyżewska, A.; Dyer, J. The August 2015 mega-heatwave in Poland in the context of past events. Weather 2018, 73, 207–214. [Google Scholar] [CrossRef]
  5. Rahmstorf, S.; Coumou, D. Increase of extreme events in a warming world. Proc. Natl. Acad. Sci. USA 2011, 108, 17905–17909. [Google Scholar] [CrossRef]
  6. Rebetez, M.; Dupont, O.; Giroud, M. An analysis of the July 2006 heatwave extent in Europe compared to the record year of 2003. Theor. Appl. Climatol. 2009, 95, 1–7. [Google Scholar] [CrossRef]
  7. Rebetez, M.; Mayer, H.; Dupont, O.; Schindler, D.; Gartner, K.; Kropp, J.P.; Menzel, A. Heat and drought 2003 in Europe: A climate synthesis. Ann. For. Sci. 2006, 63, 569–577. [Google Scholar] [CrossRef]
  8. Shevchenko, O.; Snizhko, S.; Zapototskyi, S.; Matzarakis, A. Biometeorological Conditions during the August 2015 Mega-Heat Wave and the Summer 2010 Mega-HeatWave in Ukraine. Atmosphere 2022, 13, 99. [Google Scholar] [CrossRef]
  9. Shevchenko, O.; Snizhko, S.; Zapototskyi, S.; Svintsitska, H.; Matviienko, M.; Matzarakis, A. Long-term analysis of thermal comfort conditions during heat waves in Ukraine. Geogr. Pol. 2022, 95, 53–70. [Google Scholar] [CrossRef]
  10. Fouillet, A.; Rey, G.; Laurent, F.; Pavillon, G.; Bellec, S.; Guihenneuc-Jouyaux, C.; Clavel, J.; Jougla, E.; Hémon, D. Excess mortality related to the August 2003 heat wave in France. Int. Arch. Occup. Environ. Health 2006, 80, 16–24. [Google Scholar] [CrossRef]
  11. Laaidi, K.; Zeghnoun, A.; Dousset, B.; Bretin, P.; Vandentorren, S.; Giraudet, E.; Beaudeau, P. The Impact of Heat Islands on Mortality in Paris during the August 2003 Heat Wave. Environ. Health Perspect. 2012, 120, 254–259. [Google Scholar] [CrossRef]
  12. Výberči, D.; Labudová, L.; Eštóková, M.; Faško, P.; Trizna, M. Human mortality impacts of the 2015 summer heat spells in Slovakia. Theor. Appl. Climatol. 2018, 133, 925–936. [Google Scholar] [CrossRef]
  13. Urban, A.; Hanzlíková, H.; Kyselý, J.; Plavcová, E. Impacts of the 2015 Heat Waves on Mortality in the Czech Republic-A Comparison with Previous Heat Waves. Int. J. Environ. Res. Public Health 2017, 14, 1562. [Google Scholar] [CrossRef]
  14. Muthers, S.; Laschewski, G.; Matzarakis, A. The Summers 2003 and 2015 in South-West Germany: Heat Waves and Heat-Related Mortality in the Context of Climate Change. Atmosphere 2017, 8, 224. [Google Scholar] [CrossRef]
  15. Lu, R.; Xu, K.; Chen, R.; Chen, W.; Li, F.; Lv, C. Heat waves in summer 2022 and increasing concern regarding heat waves in general. Atmos. Ocean. Sci. Lett. 2022, 16, 100290. [Google Scholar] [CrossRef]
  16. Feser, F.; van Garderen, L.; Hansena, F. The Summer Heatwave 2022 over Western Europe: An Attribution to Anthropogenic Climate Change. Bull. Am. Meteorol. Soc. 2024, 105, E2175–E2179. [Google Scholar] [CrossRef]
  17. Copernicus Observer. 2022: OBSERVER: A Wrap-Up of Europe’s Summer 2022 Heatwave. Copernicus. Available online: https://www.copernicus.eu/en/news/news/observer-wrap-europes-summer-2022-heatwave (accessed on 4 January 2025).
  18. Ballester, J.; Quijal-Zamorano, M.; Méndez Turrubiates, R.F.; Pegenaute, F.; Herrmann, F.R.; Robine, J.M.; Basagana, X.; Tonne, C.; Anto, J.M.; Achebak, H. Heat-related mortality in Europe during the summer of 2022. Nat. Med. 2023, 29, 1857–1866. [Google Scholar] [CrossRef]
  19. Kim, J.-H.; Nam, S.-H.; Kim, M.-K.; Serrano-Notivoli, R.; Tejedor, E. The 2022 record-high heat waves over southwestern Europe and their underlying mechanism. Weather Clim. Extrem. 2024, 46, 100729. [Google Scholar] [CrossRef]
  20. Ibebuchi, C.C.; Abu, I.O. Characterization of temperature regimes in Western Europe, as regards the summer 2022 Western European heat wave. Clim. Dyn. 2023, 61, 3707–3720. [Google Scholar] [CrossRef]
  21. Cheung, S.S.; Lee, J.K.W.; Oksa, J. Thermal stress, human performance, and physical employment standards. Appl. Physiol. Nutr. Metab. 2016, 41 (Suppl. 2), S148–S164. [Google Scholar] [CrossRef]
  22. Katafygiotou, M.C.; Serghides, D.K. Thermal comfort of a typical secondary school building in Cyprus. Sustain. Cities Soc. 2014, 13, 303–312. [Google Scholar] [CrossRef]
  23. Zomorodian, Z.S.; Tahsildoost, M.; Hafezi, M. Thermal comfort in educational buildings: A review article. Renew. Sustain. Energy Rev. 2016, 59, 895–906. [Google Scholar] [CrossRef]
  24. Ruuhela, R.; Jylhä, K.; Lanki, T.; Tiittanen, P.; Matzarakis, A. Biometeorological Assessment of Mortality Related to Extreme Temperatures in Helsinki Region, Finland, 1972–2014. Int. J. Environ. Res. Public Health 2017, 14, 944. [Google Scholar] [CrossRef]
  25. Bunker, A.; Wildenhain, J.; Vandenbergh, A.; Henschke, N.; Rocklöv, J.; Hajat, S.; Sauerborn, R. Effects of Air Temperature on Climate-Sensitive Mortality and Morbidity Outcomes in the Elderly; a Systematic Review and Meta-analysis of Epidemiological Evidence. EBioMedicine 2016, 6, 258–268. [Google Scholar] [CrossRef]
  26. Hajat, S.; O’Connor, M.; Kosatsky, T. Health effects of hot weather: From awareness of risk factors to effective health protection. Lancet 2010, 37, 856–863. [Google Scholar] [CrossRef]
  27. Kovats, R.S.; Hajat, S. Heat stress and public health: A critical review. Annu. Rev. Public Health 2008, 29, 41–55. [Google Scholar] [CrossRef]
  28. Haslinda, M.K.; Kamsah, N.B.; Ghaleb, F.A.; Idrus-Alhamid, M. Enhancement of thermal comfort in a large space building. Alex. Eng. J. 2019, 58, 49–65. [Google Scholar] [CrossRef]
  29. Bueno, A.; De Paula Xavier, A.; Broday, E. Evaluating the Connection between Thermal Comfort and Productivity in Buildings: A Systematic Literature Review. Buildings 2021, 11, 244. [Google Scholar] [CrossRef]
  30. Pourshaghaghy, A.; Omidvari, M. Examination of thermal comfort in a hospital using PMV–PPD model. Appl. Ergon. 2012, 43, 1089–1095. [Google Scholar] [CrossRef]
  31. Calvino, F.; La Gennusa, M.; Morale, M.; Rizzo, G.; Scaccianoce, G. Comparing different control strategies for indoor thermal comfort aimed at the evaluation of the energy cost of quality of building. Appl. Therm. Eng. 2010, 30, 2386–2395. [Google Scholar] [CrossRef]
  32. Gallardo, A.; Palme, M.; Lobato-Cordero, A.; Beltrán, R.; Gaona, G. Evaluating Thermal Comfort in a Naturally Conditioned Office in a Temperate Climate Zone. Buildings 2016, 6, 27. [Google Scholar] [CrossRef]
  33. Marino, C.; Nucara, A.; Pietrafesa, M. Thermal comfort in indoor environment: Effect of the solar radiation on the radiant temperature asymmetry. Sol. Energy 2017, 144, 295–309. [Google Scholar] [CrossRef]
  34. Reis, I.F.G.; Figueiredo, A.; Samagaio, A. Modeling the Evolution of Construction Solutions in Residential Buildings’ Thermal Comfort. Appl. Sci. 2021, 11, 2427. [Google Scholar] [CrossRef]
  35. Jowkar, M.; Montazami, A. Thermal Comfort in the UK Higher Educational Buildings: The Influence of Thermal History on Students’ Thermal Comfort. Presented at Windsor Conference, London, UK, 12–15 April 2018. [Google Scholar]
  36. Nicol, F.; Humphreys, M.; Roaf, S. Adaptive Thermal Comfort: Principles and Practice; Routledge: London, UK, 2012; 208p. [Google Scholar] [CrossRef]
  37. Kumar, A.; Suman, B.M. Experimental evaluation of insulation materials for walls and roofs and their impact on indoor thermal comfort under composite climate. Build. Environ. 2013, 59, 635–643. [Google Scholar] [CrossRef]
  38. Ahan, M.M.; Nouri, A.S.; Matzarakis, A. Investigating the Relationship of Outdoor Heat Stress upon Indoor Thermal Comfort and Qualitative Sleep Evaluation: The Case of Ankara. Atmosphere 2023, 14, 1407. [Google Scholar] [CrossRef]
  39. Höppe, P. The physiological equivalent temperature—A universal index for the biometeorological assessment of the thermal environment. Int. J. Biometeorol. 1999, 43, 71–75. [Google Scholar] [CrossRef]
  40. Nouri, A.S.; Charalampopoulos, I.; Matzarakis, A. The application of the physiologically equivalent temperature to determine impacts of locally defined extreme heat events within vulnerable dwellings during the 2020 summer in Ankara. Sustain. Cities Soc. 2022, 81, 103833. [Google Scholar] [CrossRef]
  41. Parmaksiz, K.; Yesilnacar, M.I.; Karabulut, A.I. Assessing Thermal Comfort and Indoor Air Quality: In an Educational Facility of a Semi-Arid Climate Zone. Atmosphere 2025, 16, 29. [Google Scholar] [CrossRef]
  42. Tartarini, F.; Schiavon, S.; Cheung, T.; Hoyt, T. CBE Thermal Comfort Tool: Online tool for thermal comfort calculations and visualizations. SoftwareX 2020, 12, 100563. [Google Scholar] [CrossRef]
  43. Conceição, E.; Gomes, J.; Conceição, M.I.; Conceição, M.; Lúcio, M.M.; Awbi, H. Modelling of Indoor Air Quality and Thermal Comfort in Passive Buildings Subjected to External Warm Climate Conditions. Atmosphere 2024, 15, 1282. [Google Scholar] [CrossRef]
  44. Matzarakis, A. Importance of Heat Health Warnings in Heat Management. Atmosphere 2024, 15, 684. [Google Scholar] [CrossRef]
  45. Matzarakis, A.; Laschewski, G.; Muthers, S. The Heat Health Warning System in Germany—Application and Warnings for 2005 to 2019. Atmosphere 2020, 11, 170. [Google Scholar] [CrossRef]
  46. Casanueva, A.; Burgstall, A.; Kotlarski, S.; Messeri, A.; Morabito, M.; Flouris, A.; Nybo, L.; Spirig, C.; Schwierz, C. Overview of existing heat-health warning systems in Europe. Int. J. Environ. Sci. Public Health 2019, 16, 2657. [Google Scholar] [CrossRef]
  47. Köppen, W. Das geographische System der Klimate. In Handbuch der Klimatologie; Köppen, W., Geiger, R., Eds.; Gebrüder Borntraeger: Stuttgart, Germany, 1936; 46p. (In German) [Google Scholar]
  48. Sulzer, M.; Christen, A.; Matzarakis, A. A Low-Cost Sensor Network for Real-Time Thermal Stress Monitoring and Communication in Occupational Contexts. Sensors 2022, 22, 1828. [Google Scholar] [CrossRef]
  49. Sulzer, M.; Christen, A.; Matzarakis, A. Predicting indoor air temperature and thermal comfort in occupational settings using weather forecasts, indoor sensors, and artificial neural networks. Build. Environ. 2023, 234, 110077. [Google Scholar] [CrossRef]
  50. Sulzer, M.; Christen, A. Climate projections of human thermal comfort for indoor workplaces. Clim. Chang. 2024, 177, 28. [Google Scholar] [CrossRef]
  51. Han, H.; Lee, J.; Kim, J.; Jang, C.; Jeong, H. Thermal Comfort Control Based on a Simplified Predicted Mean Vote index. Energy Procedia 2014, 61, 970–974. [Google Scholar] [CrossRef]
  52. Zeeman, M.; Christen, A.; Grimmond, S.; Fenner, D.; Morrison, W.; Feigel, G.; Sulzer, M.; Chrysoulakis, N. Modular approach to near-time data management for multi-city atmospheric environmental observation campaigns Geoscientific Instrumentation. Methods Data Syst. 2024, 13, 393–424. [Google Scholar] [CrossRef]
  53. Walther, E.; Goestchel, Q. The P.E.T. comfort index: Questioning the model. Build. Environ. 2018, 137, 1–10. [Google Scholar] [CrossRef]
  54. Kuttler, W. Stadtklima. In Handbuch der Umweltveränderungen und Ökotoxologie, Band 1B: Atmosphäre; Guderian, R., Ed.; Springer: Berlin/Heidelberg, Germany, 2000; pp. 420–470. [Google Scholar]
  55. Matzarakis, A.; Mayer, H.; Iziomon, M. Applications of a universal thermal index: Physiological equivalent temperature. Int. J. Biometeorol. 1999, 43, 76–84. [Google Scholar] [CrossRef]
  56. Russo, S.; Sillmann, J.; Sterl, A. Humid heat waves at different warming levels. Sci. Rep. 2017, 7, 7477. [Google Scholar] [CrossRef] [PubMed]
  57. Basarin, B.; Lukić, T.; Matzarakis, A. Quantification and assessment of heat and cold waves in Novi Sad, Northern Serbia. Int. J. Biometeorol. 2016, 60, 139–150. [Google Scholar] [CrossRef] [PubMed]
  58. Kjellstrom, T. Impact of Climate Conditions on Occupational Health and Related Economic Losses: A New Feature of Global and Urban Health in the Context of Climate Change. Asia Pac. J. Public Health 2016, 28, 28–37. [Google Scholar] [CrossRef]
  59. Russo, S.; Sillmann, J.; Fischer, E.M. Top ten European heatwaves since 1950 and their occurrence in the coming decades. Environ. Res. Lett. 2015, 10, 124003. [Google Scholar] [CrossRef]
  60. Staiger, H.; Laschewski, G.; Matzarakis, A. A short note on the inclusion of sultriness issues in perceived temperature in mild climates. Theor. Appl. Climatol. 2018, 131, 819–826. [Google Scholar] [CrossRef]
  61. Hentschel, G. Das Bioklima des Menschen; VEB Verlag Volk und Gesundheit: Berlin, Germany, 1978. (In German) [Google Scholar]
  62. Steadman, R.G. The Assessment of Sultriness. Part I: A Temperature-Humidity Index Based on Human Physiology and Clothing Science. J. Appl. Meteorol. 1979, 18, 861–873. [Google Scholar] [CrossRef]
  63. Steadman, R.G. A Universal Scale of Apparent Temperature. J. Clim. Appl. Meteorol. 1984, 23, 1674–1687. [Google Scholar] [CrossRef]
  64. Arroyo, Á.; Herrero, Á.; Tricio, V.; Corchado, E. Analysis of meteorological conditions in Spain by means of clustering techniques. J. Appl. Log. 2017, 24, 76–89. [Google Scholar] [CrossRef]
  65. Darvish, A.; Eghbali, G.; Eghbali, S.R. Tree-configuration and species effects on the indoor and outdoor thermal condition and energy performance of courtyard buildings. Urban Clim. 2021, 37, 100861. [Google Scholar] [CrossRef]
  66. Li, Y.; Lin, D.; Zhang, Y.; Song, Z.; Sha, X.; Zhou, S.; Chen, C.; Yu, Z. Quantifying tree canopy coverage threshold of typical residential quarters considering human thermal comfort and heat dynamics under extreme heat. Build. Environ. 2023, 233, 110100. [Google Scholar] [CrossRef]
  67. Taleghani, M.; Marshall, A.; Fitton, R.; Swan, W. Renaturing a microclimate: The impact of greening a neighbourhood on indoor thermal comfort during a heatwave in Manchester, UK. Sol. Energy 2019, 182, 245–255. [Google Scholar] [CrossRef]
  68. Morakinyo, T.E.; Kong, L.; Lau, K.K.-L.; Yuan, C.; Ng, E. A study on the impact of shadow-cast and tree species on in-canyon and neighborhood’s thermal comfort. Build. Environ. 2017, 115, 1–17. [Google Scholar] [CrossRef]
  69. Akbari, H.; Kurn, D.M.; Bretz, S.E.; Hanford, J.W. Peak power and cooling energy savings of shade trees. Energy Build. 1997, 25, 139–148. [Google Scholar] [CrossRef]
  70. Morakinyo Eniolu, T.; Kalani, C.; Dahanayake, K.W.D.; Bayode Adegun, O.; Adedoyin Balogun, A. Modelling the effect of tree-shading on summer indoor and outdoor thermal condition of two similar buildings in a Nigerian university. Energy Build. 2016, 130, 721–732. [Google Scholar] [CrossRef]
  71. Taleghani, M.; Tenpierik, M.; Van Den Dobbelsteen, A. Indoor thermal comfort in urban courtyard block dwellings in the Netherlands. Build. Environ. 2014, 82, 566–579. [Google Scholar] [CrossRef]
  72. Hong, B.; Lin, B. Numerical study of the influences of different patterns of the building and green space on micro-scale outdoor thermal comfort and indoor natural ventilation. Build. Simul. 2014, 7, 525–536. [Google Scholar] [CrossRef]
  73. Mochida, A.; Yoshino, H.; Takeda, T.; Kakegawa, T.; Miyauchi, S. Methods for controlling airflow in and around a building under cross-ventilation to improve indoor thermal comfort. J. Wind Eng. Ind. Aerodyn. 2005, 93, 437–449. [Google Scholar] [CrossRef]
  74. Rosenfelder, M.; Koppe, C.; Pfafferott, J.; Matzarakis, A. Effects of ventilation behaviour on indoor heat load based on test reference years. Int. J. Biometeorol. 2016, 60, 277–287. [Google Scholar] [CrossRef] [PubMed]
  75. Djekic, J.; Djukic, A.; Vukmirovic, M.; Djekic, P.; Dinic Brankovic, M. Thermal comfort of pedestrian spaces and the influence of pavement materials on warming up during summer. Energy Build. 2018, 159, 474–485. [Google Scholar] [CrossRef]
  76. Lin, T.-P.; Hwang, R.-L.; Chen, M.-J. Effect of External Ground Surface Materials on Indoor Thermal Comfort. In Proceedings of the PLEA2006—The 23rd Conference on Passive and Low Energy Architecture, Geneva, Switzerland, 6–8 September 2006. [Google Scholar]
  77. Mansouri, O.; Belarbi, R.; Bourbia, F. Albedo effect of external surfaces on the energy loads and thermal comfort in buildings. Energy Procedia 2017, 139, 571–577. [Google Scholar] [CrossRef]
  78. Givoni, B.; Hoffiman, M.E. Effect of Building Materials on Internal Temperatures; Research Report; Building Research Station, Technion: Haifa, Israel, 1968. [Google Scholar]
  79. Bansal, N.K.; Garg, S.N.; Kothari, S. Effect of exterior surface colour on the thermal performance of buildings. Build. Environ. 1992, 27, 31–37. [Google Scholar] [CrossRef]
Figure 1. The MoBiMet sensor (figure adapted based on [49]). * Hot-wire anemometer was not used at the investigated workplaces.
Atmosphere 16 00167 g001
Figure 2. The mean daily air temperature and PET values at different workplaces and the MS in Freiburg three days before, during, and seven days after heat waves in Freiburg during the summer of 2022. The vertical red lines indicate the beginning and end of the HW periods.
Atmosphere 16 00167 g002aAtmosphere 16 00167 g002b
Figure 3. The mean daily relative humidity values at different workplaces and the MS in Freiburg three days before, during, and seven days after heat waves in Freiburg during the summer of 2022. The vertical red lines indicate the beginning and end of the HW periods.
Atmosphere 16 00167 g003aAtmosphere 16 00167 g003b
Figure 4. Differences in air temperature at different workplaces between the first day of a HW and the previous day.
Atmosphere 16 00167 g004
Figure 5. The hourly values of air temperature one day before, during, and one day after heat waves in Freiburg during the summer of 2022. The vertical red lines indicate the beginning and end of the HW period.
Atmosphere 16 00167 g005
Figure 6. The hourly values of PET one day before, during, and one day after heat waves in Freiburg during the summer of 2022. The vertical red lines indicate the beginning and end of the HW period.
Atmosphere 16 00167 g006
Figure 7. The percentage of hours with slight and moderate heat stress at different WPs and at MS Freiburg during three heat wave events in 2022.
Atmosphere 16 00167 g007
Figure 8. Mean daily values of vapor pressure (VP) three days before, during, and seven days after heat waves in Freiburg during the summer of 2022. The vertical red lines indicate the beginning and end of the HW period.
Atmosphere 16 00167 g008
Figure 9. Hierarchical clustering of the researched WPs.
Atmosphere 16 00167 g009
Figure 10. A framework of the drivers and controls affecting the coupling of indoor and outdoor heat stress.
Atmosphere 16 00167 g010
Table 1. Characteristics of the research workplaces.
Workplace_ID19232434100103105107118
Latitude47.97748.00148.00448.00047.99348.00148.00148.00148.00147.993
Longitude7.8247.8497.8547.8487.8467.8467.8467.8467.8467.846
Year of construction1990–20101950–19701900–19301950–19701900–19301970–19901970–19901970–19901970–19901900–1930
Main building materialConcreteConcreteStoneConcrete/StoneStoneStoneStoneStoneStoneStone
Building height (floors)512663101010103
Floor13430888Ground 00
Room height (m)2.53.03.02.73.02.52.52.53.83.0
Room size (m²)40222015202018304025
Position of MoBiMetDeskWallShelfShelfDeskWindowsillDesk (near window)Desk (middle of room)DeskDesk
Exposition of windowsN, WSENEWSWESESSEESE, SSEESEE
Direct solar radiationFalseTrueUn-knownTrueTrueTrueTrueTrueTrueTrue
ShadingUnknownJalousieNoneJalousieJalousie (outside)Jalousie (outside)Jalousie (outside)Jalousie (outside)Roller shutter/ curtainRoller shutter
Air conditioningFalseFalseFalseFalseFalseFalseFalseFalseTrueFalse
Table 2. Ranges of the physiologically equivalent temperature for different classes of thermal perception by humans and physiological stress caused to humans [55].
PET, °C Thermal PerceptionClass of Physiological Stress
˂4Very coldExtreme cold stress
4.1–8.0ColdStrong cold stress
8.1–13.0Cool Moderate cold stress
13.1–18.0Slightly coolSlight cold stress
18.1–23.0ComfortableNo thermal stress
23.1–29.0Slightly warmSlight heat stress
29.1–35.0WarmModerate heat stress
35.1–41.0Hot Strong heat stress
˃41.1Very hotExtreme heat stress
Table 3. Regime of air temperature, relative humidity (RH), and physiologically equivalent temperature (PET) in research workplaces and meteorological station during the summer (June–August) of 2022.
MeanMean 09:00–18:00 UTCRange (Max–Min)
Ta,
°C
PET, °CRH,
%
Diff.
PET - Ta, °C
Ta,
°C
PET, °CRH,
%
Diff.
PET - Ta, °C
Ta,
°C
PET, °CRH,
%
WP126.027.145.91.126.727.845.61.19.612.747.3
WP926.126.943.60.827.428.442.91.015.816.947.8
WP2328.429.138.80.728.629.338.80.77.07.624.8
WP2429.129.838.30.729.230.238.51.013.015.934.3
WP3426.827.343.50.527.227.943.60.710.013.337.3
WP10025.826.243.90.426.326.643.40.315.418.736.3
WP10326.126.642.40.526.827.242.30.412.712.838.4
WP10525.725.643.6−0.126.026.043.50.012.111.242.1
WP10723.723.949.50.223.924.349.60.48.911.246.0
WP11826.526.743.80.226.827.043.00.28.817.337.8
MS21.921.958.70.026.228.743.72.529.039.884.8
Table 4. Frequency (%) of occurrence of particular classes of PET at different workplaces and meteorological station in Freiburg in summer 2022.
WPNo Thermal StressSlight Heat StressModerate, Strong, and Extreme Heat Stress
WP12.982.814.2
WP912.062.425.6
WP230.046.353.7
WP240.438.061.6
WP340.880.818.4
WP1003.791.05.3
WP1033.091.55.5
WP1054.494.71.0
WP10726.973.10.0
WP1180.197.42.5
MS18.320.122.6
Table 5. Correlation coefficients of air temperature and PET between the meteorological station and different workplaces based on hourly values.
Air Temperature (°C)Physiologically Equivalent Temperature (°C)
HW 1HW 2HW 3HW 1HW 2HW 3
WP10.66260.42300.68610.62820.30040.5852
WP90.83430.77720.79200.71370.61860.5946
WP230.41690.28510.51810.35030.15100.3516
WP240.44790.24810.26680.22800.01250.0372
WP340.48170.44030.49880.29700.20920.2818
WP1000.60090.53740.50790.40750.35030.3398
WP1030.76830.58850.48100.49920.37830.2565
WP1050.37730.55680.40360.32380.52120.4428
WP1070.32970.39300.51340.29270.31070.5316
WP1180.37320.49660.66910.27530.33240.5108
Disclaimer/Publisher’s Note: The statements, opinions and data contained in all publications are solely those of the individual author(s) and contributor(s) and not of MDPI and/or the editor(s). MDPI and/or the editor(s) disclaim responsibility for any injury to people or property resulting from any ideas, methods, instructions or products referred to in the content.

