Article

Inequitable Air Quality Improvement in China: Regional and Population-Level Disparities in PM Exposure (2013–2020)

1
Department of Atmospheric Sciences, Yunnan University, Kunming 650500, China
2
Yunnan International Joint Laboratory of Monsoon and Extreme Climate Disasters, Kunming 650500, China
3
School of Geography, Earth and Environmental Sciences, University of Birmingham, Birmingham B15 2TT, UK
4
Southwest United Graduate School, Kunming 650092, China
5
Institute of China’s Science, Technology and Education Policy, Zhejiang University, Hangzhou 310058, China
6
Shaoguan Meteorological Bureau, Shaoguan 512000, China
*
Author to whom correspondence should be addressed.
These authors contributed equally to this work.
Atmosphere 2025, 16(2), 152; https://doi.org/10.3390/atmos16020152
Submission received: 19 December 2024 / Revised: 17 January 2025 / Accepted: 28 January 2025 / Published: 30 January 2025
(This article belongs to the Section Air Quality)

Abstract

:
Over the past decade, China has enacted forward-looking environmental policies that have significantly reduced air pollution. However, while there appears to be a synergy between economic development and improvements in air quality, regional imbalances in development and disparities in health risks underscore systemic challenges in environmental governance. This study employed a population-weighted exposure index to evaluate disparities in PM2.5 exposure and its temporal and spatial trends, considering multidimensional socio-economic factors such as education, age, gender, occupation, and urban/rural backgrounds across 32 provinces and regions in China. The findings reveal that despite a notable decline in overall PM2.5 concentrations between 2013 and 2020, improvements in air quality are uneven across regions, with less developed areas bearing a disproportionate burden of emission reductions. Urban centers exhibit lower exposure levels due to resource and industrial advantages, whereas towns experience higher risks of air pollution. Socio-economic disparities are evident, with increased exposure observed in high-pollution industries and among groups with lower educational attainment. Women are more likely to be exposed than men, and both the elderly and children face higher risks. To address these challenges, policies should focus on the economic development of underdeveloped regions, balance environmental protection with growth, prioritize heavily polluted areas and vulnerable populations, and promote the adoption of clean energy to mitigate pollution inequality.

1. Introduction

In 2023, China’s coal consumption reached 91.94 exajoules (EJ), accounting for 56.0% of the global total [1]. This significant energy consumption is emblematic of China’s rapid economic expansion over the past decade [2], reflecting an underlying resource consumption pattern. Alongside economic growth, however, has been the emission of substantial quantities of pollutants, notably particulate matter with a diameter of less than 2.5 μm (PM2.5). These emissions pose a grave threat to public health [3,4,5,6,7,8], contributing to up to 23.9% of lung cancer deaths [9]. Over the last decade, China has enacted progressive environmental policies that have significantly reduced air pollution [10], with average PM2.5 concentrations in major cities falling by 54% and the proportion of days with good air quality exceeding 86% for four consecutive years, establishing China as one of the world’s fastest-improving countries in terms of air quality [11]. Despite this progress, the disparities in health risks and uneven regional development continue to underscore systemic challenges in environmental governance, affecting the efficiency and equity of pollution abatement efforts. Currently, environmental inequality in China manifests through various forms and complex causes [12]:
  • Geographic differences: Individuals in areas with favorable natural conditions face fewer environmental injustices [13]. Additionally, within urban settings, air pollution exposure can vary significantly due to localized environmental conditions and neighborhood characteristics, revealing substantial disparities in pollution exposure even at small scales [14]. Factors such as transportation issues [15,16,17] and geographic advantages and disadvantages are primary influences on the population’s resilience to environmental challenges [18].
  • Economic disparities: Pollution costs are higher in developed regions [19], and pollution transfer issues are more severe in areas with concentrated pollution-intensive and resource-intensive industries [20], where economic and environmental management systems are less developed [21,22,23].
  • Demographic dynamics: Rural residents and migrants are often engaged in ground-level industrial labor, making them more susceptible to industrial pollution [13,24,25,26,27]. Townships with high proportions of rural migrants are more prone to severe air pollution [8,19,28,29].
  • Sociological impacts: The negative effects of PM2.5 pollution on the health of older adults are becoming increasingly pronounced [4,30,31,32,33,34], and women aged between 30 and 45 are exposed to twice as much pollution as the general adult population, undermining the benefits of improved air quality and healthcare advancements [35,36,37,38]. This disparity adversely affects people’s subjective well-being and mental health.
While numerous studies have investigated the impact of air pollutants on environmental inequality in China, there has been limited systematic exploration into the equity of pollutant exposure, health effects, and structural differences among populations across socio-economic dimensions. This study employs a population-weighted pollution exposure index to assess the disparities in PM2.5 exposure and its temporal and spatial trends across 32 provinces and regions from 2013 to 2020, considering factors such as education, age, gender, occupation, and urban–rural backgrounds. Through this analysis, the paper delves into the equity of air pollution management within the current industrial and policy framework, aiming to provide a solid scientific foundation for optimizing resource allocation, reducing health inequalities, and formulating more equitable and effective environmental policies. Understanding these differences is crucial for making informed governance recommendations, optimizing resource allocation, and reducing health disparities, thereby providing a scientific basis for developing more equitable environmental policies.

2. Materials and Methods

This study uses data from several sources, including the National Bureau of Statistics (NBS), the Sixth and Seventh Population Censuses, and the Atmospheric Composition Analysis Group at Washington University in St. Louis (ACAG). Specific information on each data source is shown in Table 1: China National Bureau of Statistics: https://data.stats.gov.cn/mapdata.htm?cn=E0103 (accessed on 1 June 2024): This source provides annual county-level population data for a number of sectors, including mining, education, manufacturing, construction, health, information, transportation, etc., for the period between 2013 and 2020. It also includes county-level population education data. Sixth and Seventh Population Censuses: These censuses provide data on sex, age groups, and residence and household registration (urban, rural, and town) for the years 2010 and 2020, with resolution at the county level, once every ten years. Atmospheric Composition Analysis Group at Washington University in St. Louis: We now utilize high-resolution, satellite-derived PM2.5 data at a spatial resolution of 0.01°, processed using residual neural networks and the GEOS-Chem atmospheric chemistry model. This dataset provides annual average PM2.5 concentrations from 1998 to 2022, enabling a more detailed and accurate assessment of air quality and pollution exposure across diverse geographic regions. In terms of data processing, due to the different units of census data in different years, the data for 2005 and 2015 are expressed as a percentage (%), while the other years are expressed as thousandths (‰). In order to ensure consistency of data, we multiplied the data in thousandths by 10, thus standardizing all data in percentage format for subsequent analysis and comparison.
Population-Weighted PM2.5 Exposure Estimation: Suppose there are i rasters, with the PM2.5 concentration of the ith raster denoted as P M 2.5 , i and its population as P i . The calculation Formula (1) for the population-weighted PM2.5 exposure concentration for different groups is as follows:
P M ¯ 2.5 = i = 1 n P M 2.5 , i × P i i = 1 n P i  
where:
  • P M ¯ 2.5 represents the population-weighted average PM2.5 concentration.
  • P M 2.5 , i is the PM2.5 concentration of the ith raster.
  • P i is the population of the ith raster.
  • n is the total number of rasters.

3. Results

3.1. Spatial and Temporal Characteristics of Economic Development and Air Pollution in China

Figure 1 shows the spatial distribution and temporal changes of PM2.5, GDP in China. From the spatial view, we can see several characteristics of PM2.5 concentration in space. Regional differences are significant in the eastern and central regions where PM2.5 concentration is generally higher than in the western regions, and developed regions are higher than the underdeveloped regions, especially the economically developed regions of Beijing-Tianjin-Hebei, the Yangtze River Delta, and the Pearl River Delta. The northern part of the country is higher than the southern part of the country, and the north–south difference is obvious, with the Qinling and Huaihe Rivers as the dividing line. With the Huaihe River as the dividing line, the difference between north and south is obvious, which is closely related to climatic conditions, winter heating, etc. Densely populated areas are heavily polluted. The coast is lower than the inland, and due to the differences in meteorological and diffusion conditions, the PM2.5 between the coast and the inland shows obvious differences. From a temporal point of view, the overall trend since 2013 has been decreasing across the country, with differences in the rate of decrease between regions, with highly polluted areas such as North China, Central China, and the Western region showing significant decreases and the Northwest region showing a smaller decrease in pollution. China’s GDP per capita is spatially concentrated in three major urban agglomerations: Beijing-Tianjin-Hebei, Yangtze River Delta, and Pearl River Delta [39,40]. These three urban agglomerations are densely populated, with concentrated industries, and are the backbone of China’s economic development. From the perspective of the correlation between the spatial distribution of GDP and PM2.5, there is no obvious consistent distribution of economic level and PM2.5 concentration, which may be due to the fact that, in addition to emissions, meteorological factors have a great influence on air pollution concentration, due to the convenient sea transportation and coastal trade, the three major economic zones in China, namely the Beijing-Tianjin-Hebei, the Yangtze River Delta, and the Pearl River Delta, are all close to the coastline, and the regional meteorological and dispersal conditions will affect the local population’s exposure to pollution. Air pollution from industry is likely to be lower due to more stringent policy reasons that have prompted regional industrial upgrading and the use of cleaner technologies. Figure 1d shows that from a time perspective, China’s GDP has shown a stable growth trend since 2013, and PM2.5 has shown a clear reduction trend, which indicates that China has taken into account the sustainable development of the environment while experiencing high economic growth. However, the results in Figure 1c show the PM2.5 reduction (%) of each province from 2013 to 2020, and it can be seen that the economically developed urban agglomerations do not bear more of a reduction than the economically backward northwestern region of Sichuan and Qinghai and the western province of Gansu and Shaanxi to implement more pollution reduction contributions.
Overall, it seems that China shows a significant downward trend in PM2.5 and a steady upward trend in GDP from 2013–2020, all of which seems to be heading in the right direction, but there are large differences in the regional economies and imbalances in pollution exposure, and regional equity in emission reductions should be further explored in the context of the urbanization process and the policy goal of green development.

3.2. Regional Equity Analysis of Emission Reductions

In Figure 2, China’s 32 provinces are divided into four groups based on GDP per capita. In the L1 high-income group, GDP per capita is in the top 25% of the country, mainly in the eastern coastal areas, representing the cities of Beijing and Shanghai, with an advanced level of industry, representing the forefront of China’s economic development. In the L2 middle- and high-income group, GDP per capita is in the top 25–50% of the country, located in central and western regions of China, which is a balanced part of economic development with a certain level of industrial and agricultural output. There is a certain amount of industrial and agricultural output. The L3 low- and middle-income group, with GDP per capita in the top 50–75% of the country, is located in the central and western regions of China, similar to L2, and undertakes the transfer of industries from the east and develops specialty industries. The L4 low-income group, with GDP per capita in the bottom 75% of the country, is mainly distributed in the remote areas of China and develops tourism and low-end agriculture based on the local characteristics of natural and humanistic landscapes. Figure 2a shows that L1 had the largest share of GDP in 2017 at 41.4%, L4 had the smallest share at 15.9%, and L2 and L3 were similar at around 20%. Figure 2b shows that L4 has the lowest average PM2.5 of 37 ug/m3 but the highest reduction of 54% during the 2013–2020 reduction period. While L1, L2, and L3, which have higher economic levels and are more polluted, have PM2.5 45–47.6 ug/m3, the reduction is only 45–50%. Combined with Figure 2c, it can be seen that the emission reduction level of the L1 group is in the middle-low level of the country, while L3 and L4 demonstrate a high percentage reduction in PM2.5, which proves that low-polluting, economically backward regions take on more emission-reduction tasks. As the industrial and energy structure of less developed regions is easier to adjust, the differentiated apportionment of emission-reduction tasks can achieve obvious results in the short term, but in the long term, it will form a constraint on the economic development of the disadvantaged regions and increase the marginal cost and pressure on the development of the region. Moreover, excessively heavy and unbalanced emission-reduction tasks may further widen the inter-regional economic gap, which is the result of the game between inter-regional resource allocation, policy formulation, and implementation efficiency.

3.3. Differences in Pollution Exposure Between Urban and Rural Areas

In order to explore the specific manifestation of this inequity across different populations even further, this study explores the imbalance in PM2.5 exposure caused by socioeconomic differences across different populations in the context of urban–rural differences. Figure 3a,c,d shows that China’s population is spatially characterized by a dense east and a sparse west, with obvious urbanization. The Yangtze River Delta and Pearl River Delta urban agglomerations in the east have attracted and gathered a large number of people, further promoting the economic level and urbanization. The northwestern region covers a vast area, but the topographic and climatic conditions limit the population, resulting in a sparse population and insufficient economic level. The fact that Henan in the Central Plains has the largest rural population is due to its foundation as a large agricultural province, its relatively lagging urbanization process, and the retention of a large rural population. In Figure 3b,d, with the absolute and percentage difference between the foreign and local populations in urban and rural towns in 2010 and 2020, it can be seen that the rural population decreased and the urban population, especially the city population, grew significantly. Moreover, the proportion of the urban population increases from 30% to 41%, with the largest increase in the foreign population, and the urban population has a higher proportion of foreigners while the rural and towns have a high proportion of the local population, which illustrates China’s recent urbanization and the migration of more people from rural to urban areas. Figure 3f denotes the average population PM2.5 exposure of local foreign and residents in urban and rural towns, and it can be seen that the average pollution exposure from 2013–2020 is greater in towns than in rural cities, with the migrant population having the highest exposure in towns and the least in rural and the native population having the least exposure in urban towns and the most in towns. In each region, the exposure of the native population is greater than that of the foreign population. The results suggest that urban areas rely on resource advantages to absorb large numbers of foreigners, industrial upgrading, and stricter environmental policies to achieve low air pollution exposure. Polluting firms tend to be located on the urban fringe or in the middle of towns and cities, rather than in urban centers or rural areas. This avoids disproportionate environmental impacts on densely populated urban centers while taking advantage of better infrastructure and transportation. Towns and cities usually have lower land costs and may have less stringent environmental regulations than urban centers, which in turn leads to towns and cities being the hardest hit by air pollution exposure, and this is also the area where the local population is more predominant.

3.4. Differences in PM2.5 Exposure Among Social Groups

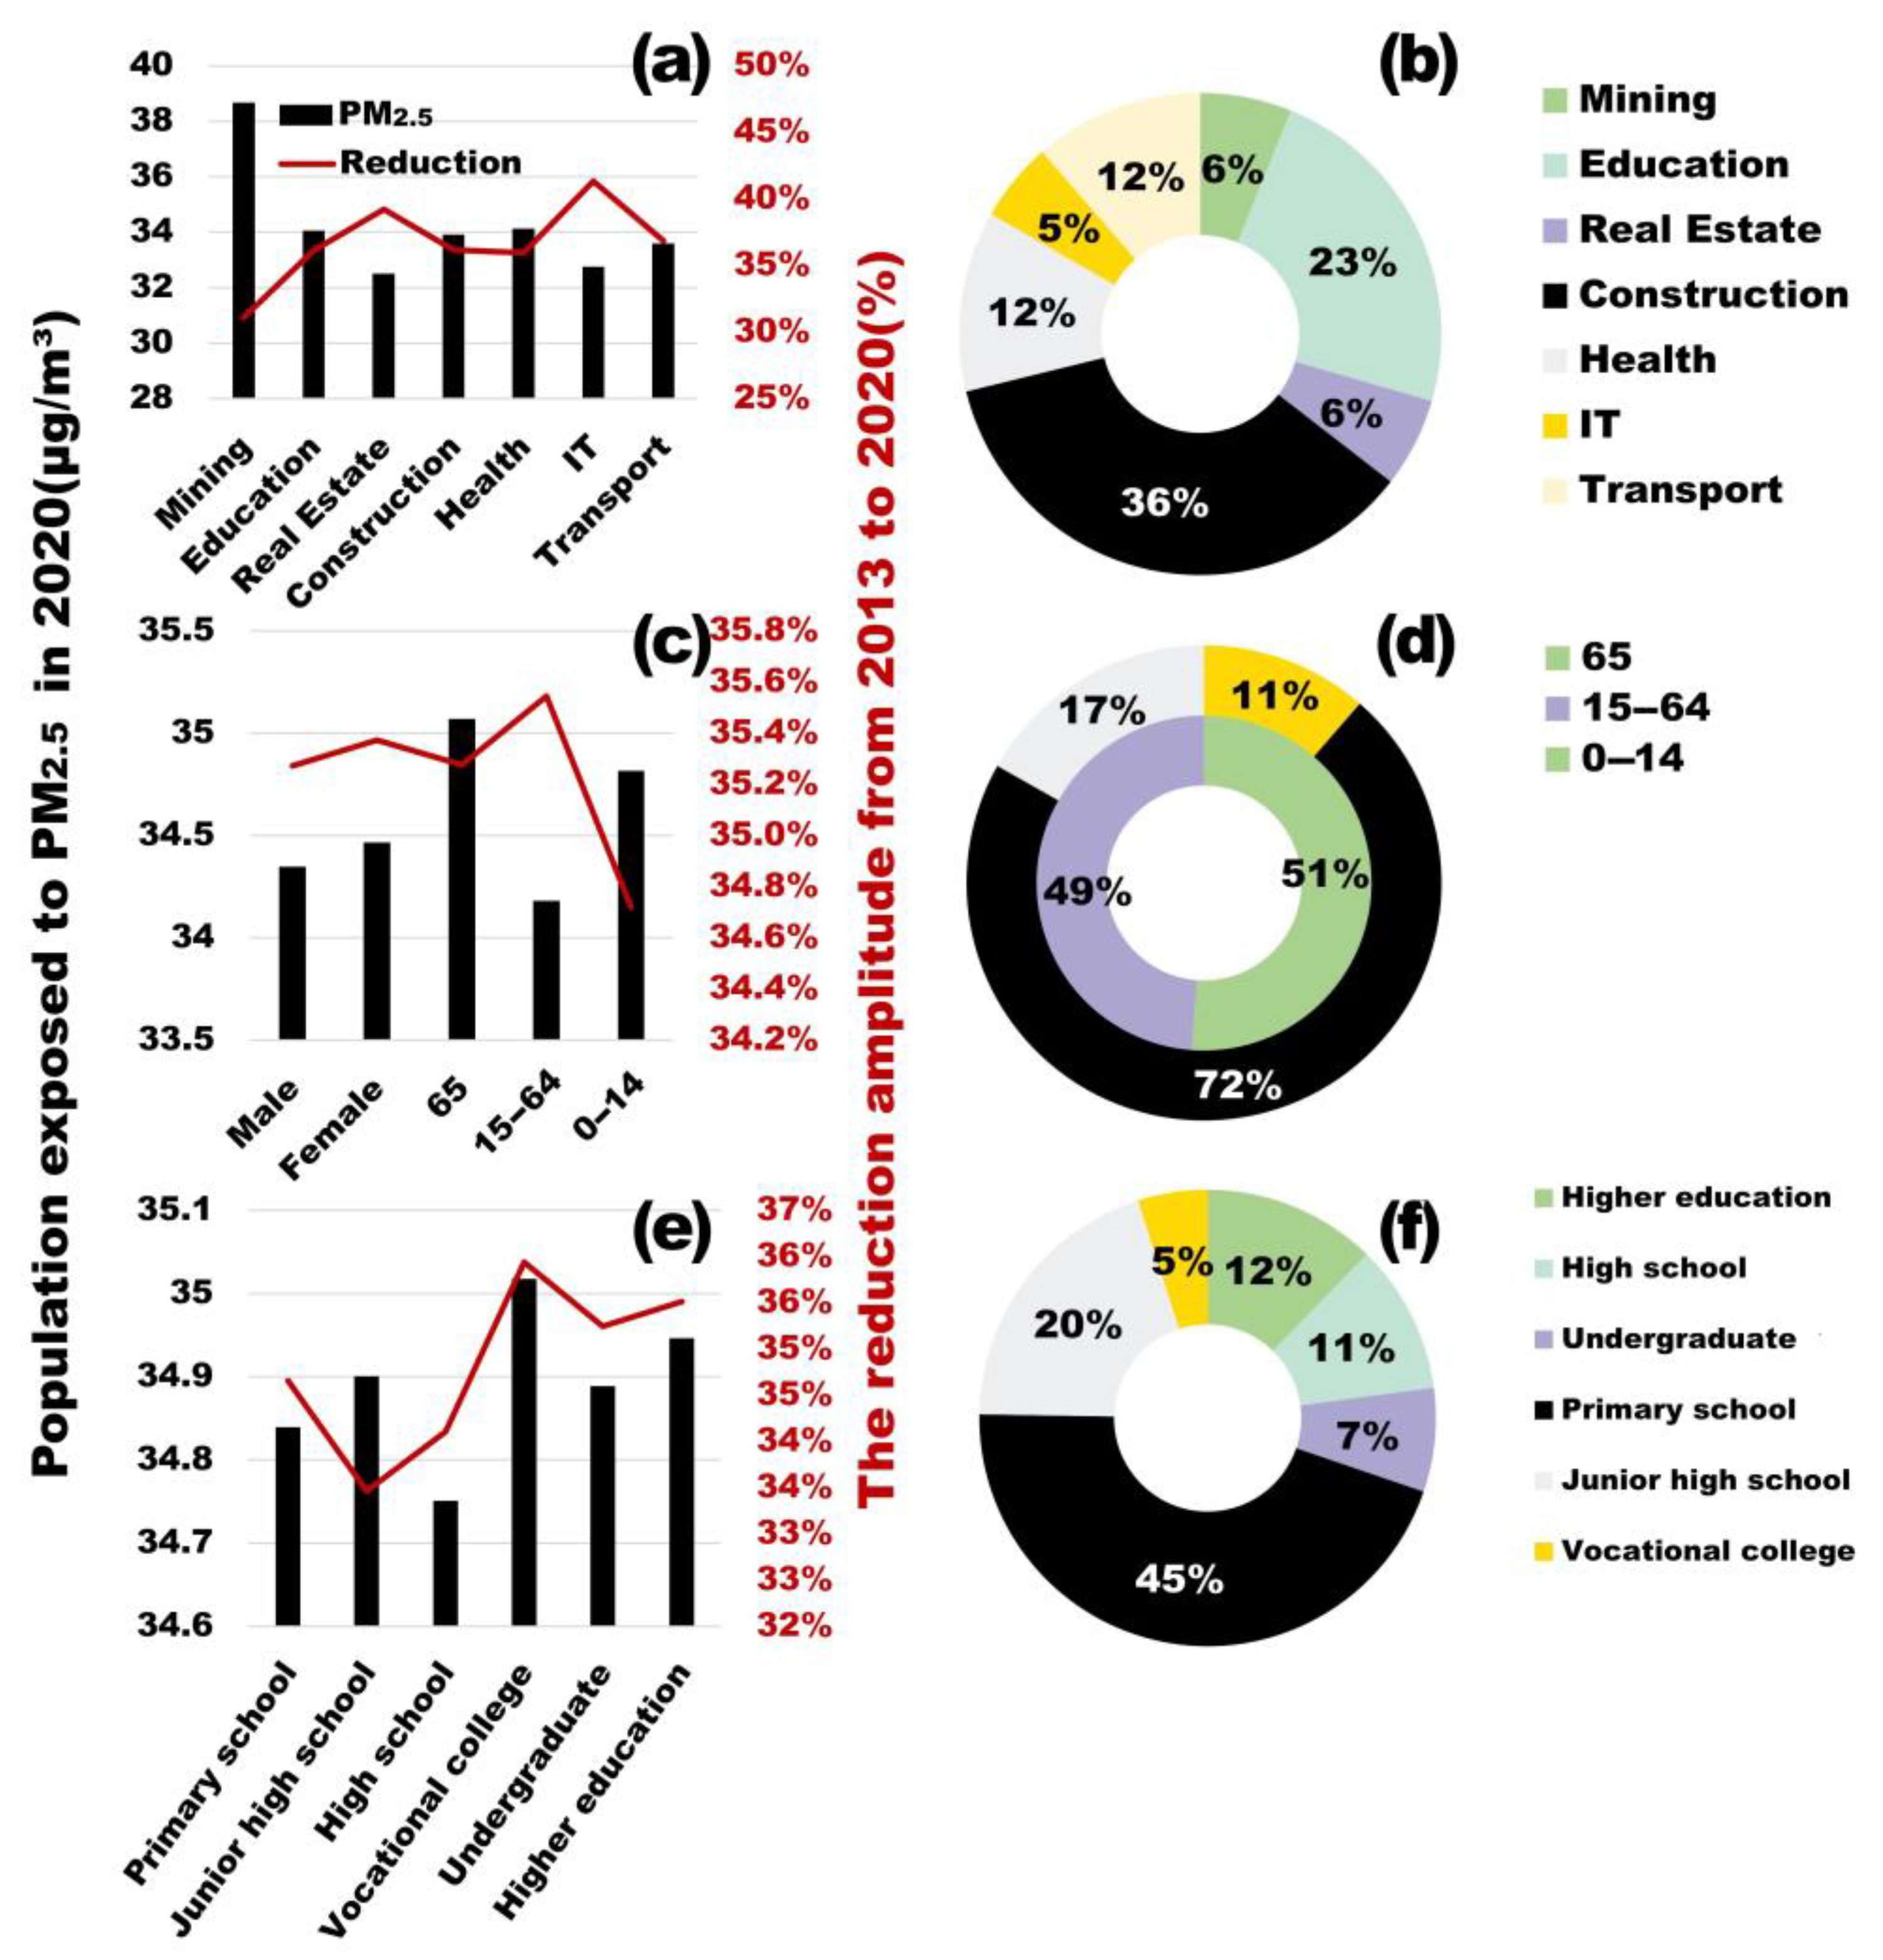
Figure 4 shows the exposure of the population to pollution by occupation, gender, age group, and education level. Figure 4a,b shows that the coal mining industry accounts for only 6% of the occupations but its exposure to PM2.5 is significantly higher than that of the other industries and has the smallest decrease in the abatement process. Every year, especially in winter, the heating demand for coal combustion in the north rises dramatically, despite the stringent environmental measures in place The heating demand, as an unavoidable civil demand, makes it difficult to implement pure emission reduction measures. Promoting clean energy or improving combustion efficiency may be able to both safeguard the heating demand and minimize air pollution. The education sector has the next highest pollution exposure and occupies a larger share of the occupational population at 23%, indicating that the air pollution exposure of educators should be emphasized. As shown in Figure 4c,d, in terms of gender, the pollution exposure of females is higher than that of males, and the decrease is higher. Many women engage in cooking and heating tasks, which often involve the use of biomass fuels or coal, especially in rural areas, leading to higher indoor air pollution levels. Additionally, although men are more likely to work in high-pollution industries such as construction or mining, these activities mostly occur outdoors, where pollutants can disperse more readily. In contrast, women tend to work indoors in administrative and service industries, potentially in environments with poor air circulation, which increases their risk of pollution exposure. However, in recent years, women’s exposure to pollution has been improving. In China’s 2020 PM2.5 exposure data, middle-aged individuals (15–64 years) showed the lowest exposure levels, at only 34.4 micrograms per cubic meter, while children (0–14 years) and the elderly (65 years and above) experienced higher levels, reaching 35.8 and 35.6 micrograms per cubic meter, respectively. This may be related to middle-aged individuals primarily working in controlled indoor air environments, whereas children and the elderly spend more time exposed to outdoor environments. Notably, from 2013 to 2020, the reduction in PM2.5 exposure for children was the most significant at 35.8%, demonstrating the effectiveness of policies aimed at protecting children’s health. Moving forward, it is crucial to continue improving air quality for high-risk groups in future policy making. Figure 4e,f shows that in 2020, vocational college students had the highest PM2.5 exposure level at 35.1 micrograms per cubic meter, while individuals from higher-education institutions had the lowest at 34.7 micrograms per cubic meter. Moreover, undergraduate and vocational college students experienced the most significant reduction in PM2.5 exposure from 2013 to 2020 at approximately 35%. Despite only making up 11% of the total population, vocational college students face the most severe pollution issues, reflecting that lower educational groups are more likely to be located in heavily polluted industrial areas. This situation underscores the need for more targeted environmental protection policies that address different educational backgrounds to reduce the health inequities caused by educational disparities.

4. Conclusions

Regional Disparities in Air Quality Improvements: Although China’s overall PM2.5 concentration has declined significantly from 2013 to 2020, air quality improvements are uneven across regions. Less developed regions bear a greater burden of emission reductions, while developed regions experience relatively smaller reductions. These disparities highlight the short-term efficacy and long-term constraints of current air pollution policies, which may increase the marginal costs for disadvantaged regions and exacerbate the economic gap between regions. This reflects the complex interplay of resource allocation and policy implementation across different regions.
Impact of Urbanization on Pollution Exposure: Urban areas, due to their resource advantages and higher industrial structures, attract large populations and show lower pollution exposure as a result of industrial upgrading. However, polluting enterprises tend to be concentrated in these town settings, which also house dense local populations, leading to high air pollution exposure for the residents. This scenario underscores the impact of industrial structure layout and population movement on urban air quality over the past decade.
Industry-Specific PM2.5 Exposure: PM2.5 exposure is significantly higher among workers in the coal-mining industry and populations with vocational college backgrounds compared to other industries and educational groups. This suggests that pollution prevention and control measures need to be intensified in high-polluting industries and among low-education groups. Additionally, factors such as gender, age, and education level significantly influence pollution exposure, shaping disparities that warrant targeted interventions. For example, females often face higher indoor pollution exposure due to cooking and heating practices in rural areas, while children and the elderly are more vulnerable to outdoor pollution due to prolonged exposure in high-risk environments. Education level also plays a critical role, as lower educational groups, such as vocational college students, are disproportionately concentrated in heavily polluted industrial areas. These insights provide a strong basis for formulating more tailored and equitable environmental policies to address the specific needs of these vulnerable populations.
Policy Recommendations: Air pollution policies must consider the long-term development of less developed regions, taking into account regional economic levels and industrial structures. Such policies should aim for more equitable environmental governance and foster a positive interaction between environmental protection and economic development. Enhancing resource allocation toward highly polluted areas and vulnerable populations, along with promoting cleaner energy alternatives to coal heating in northern regions, is crucial for reducing inequalities in pollution exposure.
Study Limitations and Future Research: Despite using high-precision, remote-sensing-derived PM2.5 data and county-level census data, this study acknowledges that PM2.5 exposure at the sub-city level still shows significant variations due to differences in facility layout, architectural forms, and production activities within cities. Furthermore, the accuracy of the remote sensing data is constrained by sensor limitations and the maturity of inversion algorithms, which may introduce errors. These limitations underscore the need for further optimization of data processing methods and exploration of more advanced monitoring techniques to enhance the accuracy and reliability of future research.

Author Contributions

C.W. and S.L.: conceptualization, methodology, experiment execution, formal analysis, investigation, and writing—original draft preparation; P.H., T.M., X.W., L.G., K.Z., J.L. and Y.L.: writing—review and editing, and providing constructive feedback; W.C.: resources, supervision, funding acquisition, and final manuscript review. All authors have read and agreed to the published version of the manuscript.

Funding

This work was supported by the Practical Innovation Project of Postgraduate Students in the Professional Degree of Yunnan University [ZC-23234472] and the Scientific Research and Innovation Project of Postgraduate Students in the Academic Degree of Yunnan University [KC-242410634].

Institutional Review Board Statement

Not applicable.

Informed Consent Statement

Not applicable.

Data Availability Statement

The data can be made available upon request.

Conflicts of Interest

The authors declare no conflicts of interest. The funders had no role in the design of the study; in the collection, analyses, or interpretation of data; in the writing of the manuscript; or in the decision to publish the results.

References

  1. International Energy Agency. World Energy Outlook 2024; International Energy Agency: Paris, France, 2024. [Google Scholar]
  2. Hao, Y.; Chen, H.; Zhang, Q. Will income inequality affect environmental quality? Analysis based on China’s provincial panel data. Ecol. Indic. 2016, 67, 533–542. [Google Scholar] [CrossRef]
  3. de Leeuw, G.; van der A, R.; Bai, J.; Xue, Y.; Varotsos, C.; Li, Z.; Fan, C.; Chen, X.; Christodoulakis, I.; Ding, J. Air quality over China. Remote Sens. 2021, 13, 3542. [Google Scholar] [CrossRef]
  4. Fiordelisi, A.; Piscitelli, P.; Trimarco, B.; Coscioni, E.; Iaccarino, G.; Sorriento, D. The mechanisms of air pollution and particulate matter in cardiovascular diseases. Heart Fail. Rev. 2017, 22, 337–347. [Google Scholar] [CrossRef] [PubMed]
  5. Hamra, G.B.; Guha, N.; Cohen, A.; Laden, F.; Raaschou-Nielsen, O.; Samet, J.M.; Vineis, P.; Forastiere, F.; Saldiva, P.; Yorifuji, T. Outdoor particulate matter exposure and lung cancer: A systematic review and meta-analysis. Environ. Health Perspect. 2014, 122, 906–911. [Google Scholar] [CrossRef] [PubMed]
  6. Liu, C.; Chen, R.; Sera, F.; Vicedo-Cabrera, A.M.; Guo, Y.; Tong, S.; Coelho, M.S.; Saldiva, P.H.; Lavigne, E.; Matus, P. Ambient particulate air pollution and daily mortality in 652 cities. New Engl. J. Med. 2019, 381, 705–715. [Google Scholar] [CrossRef]
  7. Pui, D.Y.; Chen, S.-C.; Zuo, Z. PM2.5 in China: Measurements, sources, visibility and health effects, and mitigation. Particuology 2014, 13, 1–26. [Google Scholar] [CrossRef]
  8. He, L.; He, L.; Lin, Z.; Lu, Y.; Chen, C.; Wang, Z.; An, P.; Liu, M.; Xu, J.; Gao, S. Sensing the Environmental Inequality of PM2.5 Exposure Using Fine-Scale Measurements of Social Strata and Citizenship Identity. ISPRS Int. J. Geo-Inf. 2024, 13, 257. [Google Scholar] [CrossRef]
  9. Zhang, Q.; Meng, X.; Shi, S.; Kan, L.; Chen, R.; Kan, H. Overview of particulate air pollution and human health in China: Evidence, challenges, and opportunities. Innovation 2022, 3, 100312. [Google Scholar] [CrossRef] [PubMed]
  10. Zhang, R.; Zhu, S.; Zhang, Z.; Zhang, H.; Tian, C.; Wang, S.; Wang, P.; Zhang, H. Long-term variations of air pollutants and public exposure in China during 2000–2020. Sci. Total Environ. 2024, 930, 172606. [Google Scholar] [CrossRef] [PubMed]
  11. Fan, Y.; Chen, Z.; He, T.J.S. The Impact of Carbon-Emission Trading Scheme Policies on Air Quality in Chinese Cities. Sustainability 2024, 16, 10023. [Google Scholar]
  12. Shan, Z.; Li, H.; Pan, H.; Yuan, M.; Xu, S. Spatial equity of PM2.5 pollution exposures in high-density metropolitan areas based on remote sensing, LBS and GIS data: A case study in Wuhan, China. Int. J. Environ. Res. Public Health 2022, 19, 12671. [Google Scholar] [CrossRef]
  13. Quan, R. Establishing China’s environmental justice study models. Geo. Int’l Envtl. L. Rev. 2001, 14, 461. [Google Scholar]
  14. Kamińska, J.A.; Turek, T.; Van Poppel, M.; Peters, J.; Hofman, J.; Kazak, J.K.J.J.o.E.M. Whether cycling around the city is in fact healthy in the light of air quality–Results of black carbon. J. Environ. Manag. 2023, 337, 117694. [Google Scholar] [CrossRef]
  15. Golub, A.; Marcantonio, R.A.; Sanchez, T.W. Race, space, and struggles for mobility: Transportation impacts on African Americans in Oakland and the East Bay. Urban Geogr. 2013, 34, 699–728. [Google Scholar] [CrossRef]
  16. Moser, M.; Zwickl, K. Informal Environmental Regulation of Industrial Air Pollution: Does Neighborhood Inequality Matter? WU Vienna University of Economics and Business: Wien, Austria, 2014. [Google Scholar]
  17. Zheng, S.; Yao, R.; Zou, K. Provincial environmental inequality in China: Measurement, influence, and policy instrument choice. Ecol. Econ. 2022, 200, 107537. [Google Scholar] [CrossRef]
  18. Zheng, D.; Shi, M. Multiple environmental policies and pollution haven hypothesis: Evidence from China’s polluting industries. J. Clean. Prod. 2017, 141, 295–304. [Google Scholar] [CrossRef]
  19. Yang, T.; Liu, W. Does air pollution affect public health and health inequality? Empirical evidence from China. J. Clean. Prod. 2018, 203, 43–52. [Google Scholar] [CrossRef]
  20. Wu, H.; Guo, H.; Zhang, B.; Bu, M. Westward movement of new polluting firms in China: Pollution reduction mandates and location choice. J. Comp. Econ. 2017, 45, 119–138. [Google Scholar] [CrossRef]
  21. Tian, X.; Geng, Y.; Ulgiati, S. An emergy and decomposition assessment of China-Japan trade: Driving forces and environmental imbalance. J. Clean. Prod. 2017, 141, 359–369. [Google Scholar] [CrossRef]
  22. Zhang, W.; Liu, Y.; Feng, K.; Hubacek, K.; Wang, J.; Liu, M.; Jiang, L.; Jiang, H.; Liu, N.; Zhang, P. Revealing environmental inequality hidden in China’s inter-regional trade. Environ. Sci. Technol. 2018, 52, 7171–7181. [Google Scholar] [CrossRef] [PubMed]
  23. Zhao, X.; Zhang, S.; Fan, C. Environmental externality and inequality in China: Current status and future choices. Environ. Pollut. 2014, 190, 176–179. [Google Scholar] [CrossRef] [PubMed]
  24. He, Q.; Wang, R.; Ji, H.; Wei, G.; Wang, J.; Liu, J. Theoretical model of environmental justice and environmental inequality in China’s four major economic zones. Sustainability 2019, 11, 5923. [Google Scholar] [CrossRef]
  25. Ma, C. Who bears the environmental burden in China—An analysis of the distribution of industrial pollution sources? Ecol. Econ. 2010, 69, 1869–1876. [Google Scholar] [CrossRef]
  26. Ma, J.; Liu, B.; Mitchell, G.; Dong, G. A spatial analysis of air pollution and environmental inequality in Beijing, 2000–2010. J. Environ. Plan. Manag. 2019, 62, 2437–2458. [Google Scholar] [CrossRef]
  27. Ma, J.; Mitchell, G.; Dong, G.; Zhang, W. Inequality in Beijing: A spatial multilevel analysis of perceived environmental hazard and self-rated health. Ann. Am. Assoc. Geogr. 2017, 107, 109–129. [Google Scholar] [CrossRef]
  28. Schoolman, E.D.; Ma, C. Migration, class and environmental inequality: Exposure to pollution in China’s Jiangsu Province. Ecol. Econ. 2012, 75, 140–151. [Google Scholar] [CrossRef]
  29. Niu, X.-T.; Yang, Y.-C.; Wang, Y.-C. Does the economic growth improve public health? A cross-regional heterogeneous study in China. Front. Public Health 2021, 9, 704155. [Google Scholar] [CrossRef]
  30. Xue, T.; Zhu, T.; Zheng, Y.; Liu, J.; Li, X.; Zhang, Q. Change in the number of PM2.5-attributed deaths in China from 2000 to 2010: Comparison between estimations from census-based epidemiology and pre-established exposure-response functions. Environ. Int. 2019, 129, 430–437. [Google Scholar] [CrossRef] [PubMed]
  31. Tao, T.; Xin, K. Public health: A sustainable plan for China’s drinking water. Nature 2014, 511, 527–528. [Google Scholar] [CrossRef] [PubMed]
  32. Cao, J.; Xu, H.; Xu, Q.; Chen, B.; Kan, H. Fine particulate matter constituents and cardiopulmonary mortality in a heavily polluted Chinese city. Environ. Health Perspect. 2012, 120, 373–378. [Google Scholar] [CrossRef]
  33. Crouse, D.L.; Peters, P.A.; van Donkelaar, A.; Goldberg, M.S.; Villeneuve, P.J.; Brion, O.; Khan, S.; Atari, D.O.; Jerrett, M.; Pope III, C.A. Risk of nonaccidental and cardiovascular mortality in relation to long-term exposure to low concentrations of fine particulate matter: A Canadian national-level cohort study. Environ. Health Perspect. 2012, 120, 708–714. [Google Scholar] [CrossRef] [PubMed]
  34. Cui, Z.; Yi, X.; Huang, Y.; Li, M.; Zhang, Z.; Kuang, L.; Song, R.; Liu, J.; Pan, R.; Yi, W. Effects of socioeconomic status and regional inequality on the association between PM2.5 and its components and cardiometabolic multimorbidity: A multicenter population-based survey in eastern China. Sci. Total Environ. 2024, 946, 174453. [Google Scholar] [CrossRef]
  35. Chen, S.; Oliva, P.; Zhang, P. The effect of air pollution on migration: Evidence from China. J. Dev. Econ. 2022, 156, 102833. [Google Scholar] [CrossRef]
  36. Xu, F.; Huang, Q.; Yue, H.; Feng, X.; Xu, H.; He, C.; Yin, P.; Bryan, B.A. The challenge of population aging for mitigating deaths from PM2.5 air pollution in China. Nat. Commun. 2023, 14, 5222. [Google Scholar] [CrossRef] [PubMed]
  37. McKinney, L.A.; Wright, D. Gender and environmental inequality. In Handbook on Inequality and the Environment; Edward Elgar Publishing: Cheltenham, UK, 2023; pp. 228–245. [Google Scholar]
  38. Buckingham, S. Gender and Environment; Routledge: London, UK, 2020. [Google Scholar]
  39. Li, W.; Wu, M.; Niu, Z. Spatialization and Analysis of China’s GDP Based on NPP/VIIRS Data from 2013 to 2023. Appl. Sci. 2024, 14, 8599. [Google Scholar] [CrossRef]
  40. Zhao, N.; Liu, Y.; Cao, G.; Samson, E.L.; Zhang, J.J.G.; Sensing, R. Forecasting China’s GDP at the pixel level using nighttime lights time series and population images. GISci. Remote Sens. 2017, 54, 407–425. [Google Scholar] [CrossRef]
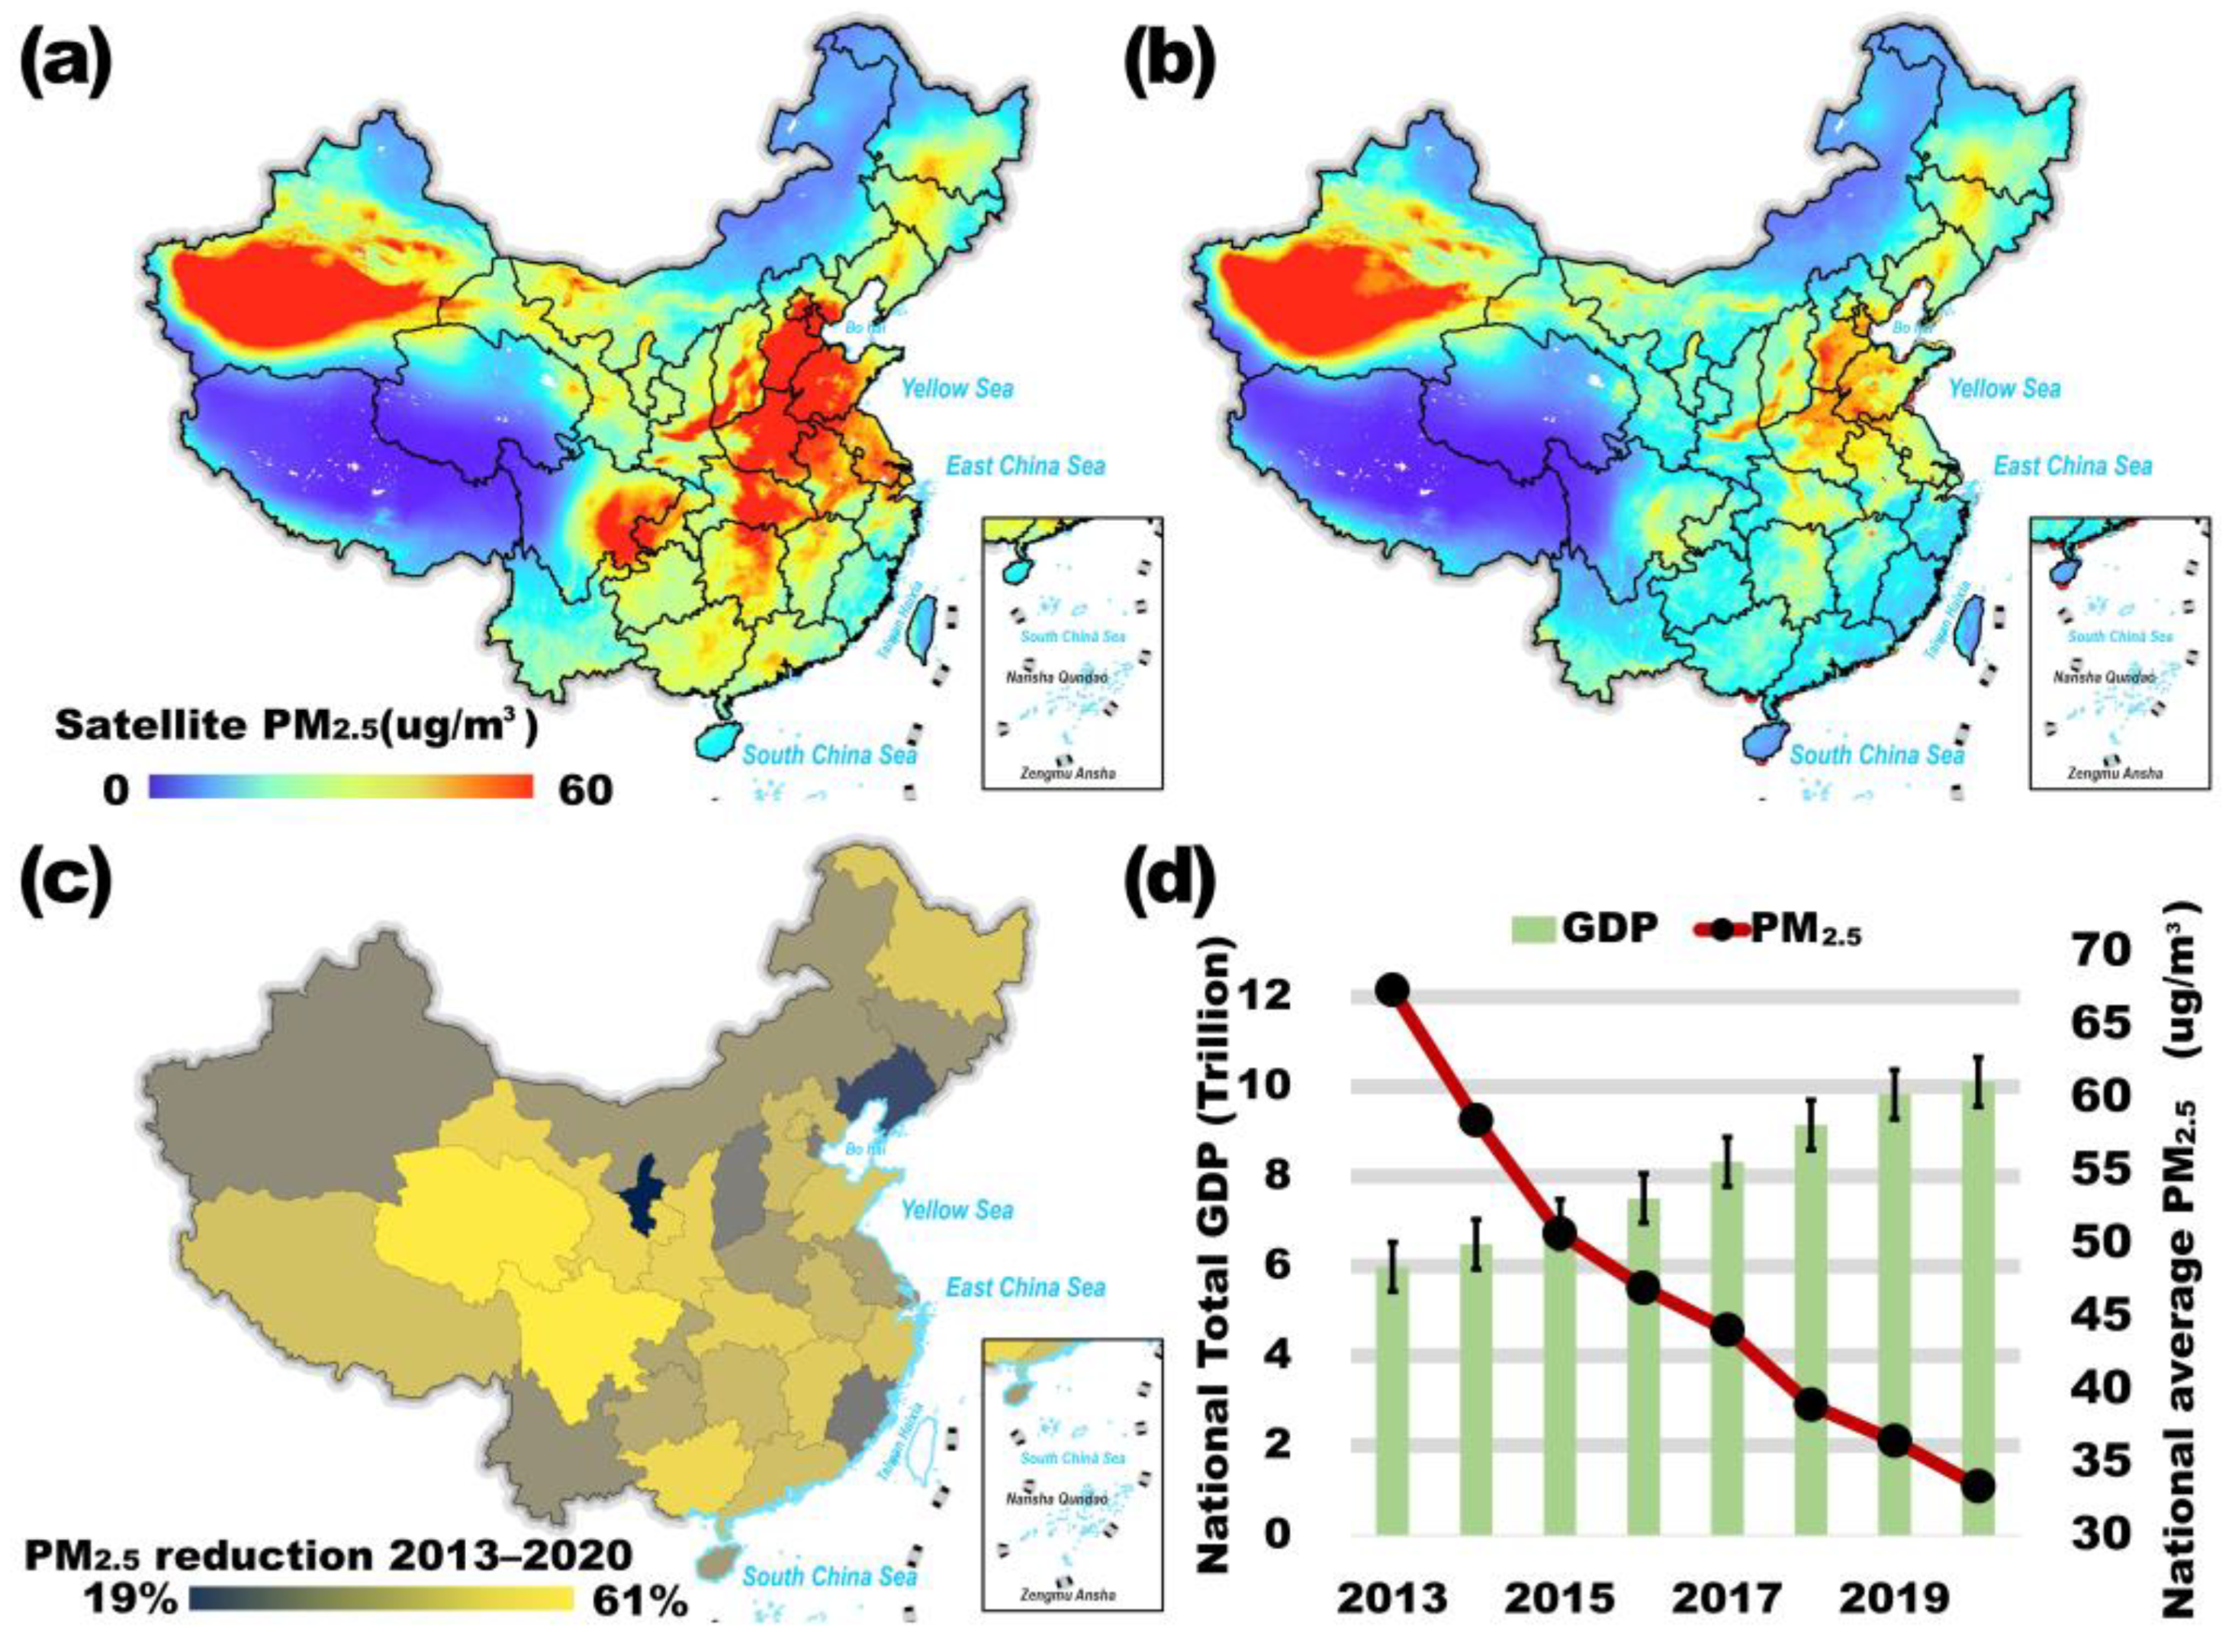
Figure 1. (a,b) Spatial distribution of PM2.5 in 2013 and 2020; (c) decrease in PM2.5 (%) in each province from 2013 to 2020; (d) time series of changes in the national total GDP and PM2.5 mean values from 2013 to 2020.
Atmosphere 16 00152 g001
Figure 2. Four subgroups of Chinese provinces based on GDP: (a) share of GDP contribution of each subgroup in 2017; (b) PM2.5 reduction (2013–2020) and average PM2.5 concentration: The colored bars represent the fractional decrease in PM2.5 from 2013 to 2020, while the yellow crosses indicate the average PM2.5 concentration during the same period. (c) Per capita GDP and PM2.5 reduction (2013–2020) by province: The colored bars represent per capita GDP in 2017 for the four subgroups, while the black line shows the fractional decrease in PM2.5 concentration from 2013 to 2020 for each province.
Atmosphere 16 00152 g002
Figure 3. Spatial distributions of county-level populations in 2020: (a) urban, (c) town, and (e) rural areas. (b) Percentage of urban, rural, and town population at the county level in 2010 vs. 2020, with “N” representing ‘Native’ populations (long-term residents) and “O” representing ‘Outsider’ populations (newcomers to the area). (d) Absolute population of urban, rural, and town areas at the county level in 2010 vs. 2020, with red indicating the Outsider population and gray representing the Native population. These data are derived from county-level census data to ensure granular analysis. (f) Difference in PM2.5 exposure between urban, rural, and town populations.
Atmosphere 16 00152 g003
Figure 4. (a,c,e) Differences in average PM2.5 exposure among populations with different occupations, age groups, genders, and education levels in 2020 (the red line indicates the percentage decrease in 2020 compared to 2013). (b,d,f) Proportions of populations with different occupations, age groups, genders, and education levels in 2017.
Atmosphere 16 00152 g004
Table 1. Data source.
Data NameData SourceResolutionTime Range
Population Occupational DataNational Bureau of StatisticsAnnual, County-level2013–2020
Population Gender and Age Data
Population EducationSixth and Seventh National Population CensusEvery ten years, County-level2010, 2020
Residence and Household Registration
PM2.5 DataACAGAnnual, 0.01° × 0.01°2013–2020
Disclaimer/Publisher’s Note: The statements, opinions and data contained in all publications are solely those of the individual author(s) and contributor(s) and not of MDPI and/or the editor(s). MDPI and/or the editor(s) disclaim responsibility for any injury to people or property resulting from any ideas, methods, instructions or products referred to in the content.