Abstract
Nitrogen dioxide (NO2) is broadly acknowledged as one of the six key air pollutants, posing a significant threat to environmental stability and human health. The profile of atmospheric nitrogen dioxide is required for quantifying NO2 emissions from fossil fuel combustion and industry. In continuous-wave differential absorption lidar (CW-DIAL) systems, the laser sources employed are subject to the issues of varying output characteristics and poor instability. This study presents a CW-DIAL system for remote sensing of atmospheric NO2 that employs a compact grating-based external cavity diode laser (ECDL) and Scheimpflug imaging. The laser in this system utilizes a piezoelectric transducer (PZT) for precise wavelength tuning, emitting at 448.1 nm and 449.7 nm with an output power of 2.97 W and a narrow linewidth of 0.16 nm. Signal capturing was achieved through a Newtonian telescope with a diameter of 200 mm and a 45° inclined CCD image sensor, satisfying the Scheimpflug principle. A case study near road traffic was used to verify the feasibility of ECDL-DIAL, which took place from 1 October to 2 October 2023 over an industrial park. The system generates precise NO2 distribution maps with sub-50 m resolution over 3 km, updating every 10 min.
1. Introduction
People are becoming increasingly aware of air pollution and are paying more attention to air quality issues in recent years. Nitrogen dioxide (NO2), as a significant atmospheric pollutant, independently affects human health by causing harm to the respiratory, cardiovascular, and nervous systems [1,2,3,4]. Additionally, NO2 reacts with organic compounds to generate photochemical smog, exacerbating photochemical pollution and reducing atmospheric visibility [5,6]. Furthermore, NO2 contributes to the formation of acid rain, causing environmental damage. The primary source of NO2 is human activities, including fossil fuel combustion, automobile exhaust emissions, and nitric acid production [7,8,9]. Therefore, monitoring local and global NO2 concentrations is essential for understanding atmospheric chemistry and environmental management.
Quantifying the contribution of various emission sources to NO2 emissions, in particular, their spatial mixing processes, is crucial for understanding the tropospheric nitrogen cycle, which in turn informs the development of effective emission reduction strategies [10]. Current optical monitoring techniques used for detecting atmospheric NO2 concentration include satellite remote sensing, lidar, differential absorption spectroscopy, and point-based monitoring devices. Satellite remote sensing provides large-scale spatial distribution of NO2, but its temporal and spatial resolution is relatively low [11]. Point-based monitoring devices, such as the Long Path Absorption Photometer (LOPAP), offer very low detection limits and high accuracy but cannot provide range-resolved information [12]. In contrast, lidar technology offers significant advantages in both detection range and measurement accuracy, effectively compensating for the limitations of the aforementioned techniques. Differential absorption lidar (DIAL) technology, as an active remote sensing tool, is useful for monitoring atmospheric gases and the transportation mechanisms of localized near-surface NO2 emissions [13,14,15]. Its basic principle involves emitting two laser beams with similar wavelengths into the atmosphere. The on-line wavelength (λon) is precisely adjusted to the absorption peak of the target gas, while the off-line wavelength (λoff) is set to the gas’s minimum absorption [16,17,18]. In pulsed NO2 DIAL systems based on Time-of-Flight (TOF) technology, it is typically necessary to use Nd: YAG lasers to pump dye lasers or flashlamp-pumped tunable titanium sapphire lasers to generate high-energy, high-frequency pulse lasers [19,20,21]. Due to the high requirement of the laser source, it poses a significant technical challenge for pulsed NO2 DIAL technology.
Scheimpflug lidar is a new type of range-resolved lidar technology that has been widely used in atmospheric monitoring since 2015 [22,23,24,25,26,27,28,29]. It replaces the traditional high-cost pulsed laser with a cost-effective continuous-wave laser and substitutes the photodetector with an image sensor. These optimization measures have brought about several significant advantages, including the compactness of the system structure, robust durability, cost-effectiveness, and a significant reduction in the detection blind area. In order to conduct effective differential absorption measurements of NO2, a narrow-band and tunable laser is usually essential. Wavelengths within the blue spectrum (~450 nm) are particularly important because of the high absorption of nitrogen dioxide in this region. The reported NO2 Scheimpflug lidar uses commercial GaN blue diode lasers, which have a relatively wide linewidth and exhibit significant instability in output power with shifts in wavelength [30]. However, the absorption peaks and minima of the spectral lines for atmospheric molecules are typically narrow. Therefore, the laser source used in differential absorption lidar must have a narrow linewidth and stable wavelength tunability to ensure high detection accuracy. Currently, distributed feedback (DFB) lasers and distributed Bragg reflector (DBR) lasers can achieve narrow spectral linewidths, but they are constrained to the infrared range and possess power outputs of only tens of milliwatts or a few hundred milliwatts [31,32,33,34,35]. Nevertheless, the external cavity diode laser (ECDL) using diffraction gratings and common laser diodes is able to achieve narrow linewidths in the blue spectrum, as anticipated. This advancement positions the ECDL as a viable option for Scheimpflug lidar applications [36,37,38].
In this study, to obtain the better quality of NO2 absorption lidar signals in terms of larger detectable range and higher lidar intensity, we developed a differential absorption Scheimpflug lidar for atmospheric NO2 concentration measurement with a blue light GaN ECDL. This ensures consistent output power and linewidth of the on-line and off-line wavelengths, optimizing the accuracy of the measurement of NO2 concentration. The system was tested in an industrial park, and the results confirmed its capability to monitor atmospheric NO2, successfully measuring NO2 concentrations along a 3 km atmospheric path.
2. Methodology and Instrumentation
2.1. Scheimpflug DIAL Principle
The experiment setup is based on the Scheimpflug lidar principle [22,39] and is configured for DIAL measurements. The Scheimpflug imaging principle can be expressed as follows: the imaging system’s object plane and phase plane, and the plane where the lens is located, intersect at the same point in the two-dimensional plane, allowing for a clear image of the object plane with an infinite depth of field [40]. Scheimpflug lidar uses a continuous-wave laser and receives the scattered echo signals generated by the laser and atmospheric particles through an optical telescope that has been modified to conform to the Scheimpflug imaging principle, as shown in Figure 1. Scattered light from different distances on the optical path passes through the telescope and converges at different angles to different pixel positions on the tilted image sensor, thus achieving distance resolution depending on the angle.
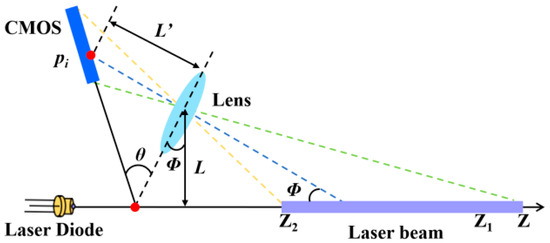
Figure 1.
A schematic diagram of Scheimpflug’s principle.
According to the geometric optics relationship between pixels and distance of the image sensor of the Scheimpflug lidar system, the relationship between pixel and distance can be expressed as follows [28]:
where θ is the inclination of the image plane relative to the imaging lens; Φ is the swing angle of the receiving telescope; L′ is the distance between lens and image plane; L is the distance between the receiving lens and the light source system; and pi indicates the signal intensity corresponding to each pixel of the image sensor, as shown in Figure 1.
The lidar echo measured by the Scheimpflug lidar technique can be described by [41]
where z is the measurement distance; P0 is the power spectral density; KS is the system constant; O(z) is the geometric overlap factor in the Scheimpflug lidar and is equal to 1; β(λ, z) is the atmosphere total backscattering coefficient; σ(λ, z) is the absorption cross-section; N(z) is the NO2 distribution in atmosphere; and αR(λ, z) and αM(λ, z) are the extinction coefficients of Rayleigh scattering extinction coefficient and Mie scattering extinction coefficient, respectively. By ignoring the impact of wavelength differences on the extinction coefficient and then measuring the absorption difference of NO2 at λon and λoff, range-resolved NO2 number density was obtained by using the DIAL equation [26]:
where Δσ is the effective absorption cross-section on and off the absorption line, i.e., Δσ = σ(λon, z) − σ(λoff, z); P(λon, z) and P(λoff, z) are the backscattered signals on and off the absorption line at the distance z.
2.2. Instrument Design
2.2.1. Wavelength Switching Blue ECDL
In our NO2 Scheimpflug lidar, a blue ECDL was utilized instead of the traditional broad linewidth LD. In traditional LDs, the linewidth of the laser is wider due to spontaneous emission and mode competition within the laser gain medium. However, the grating external cavity laser can effectively select and stabilize a single or a few frequency modes by introducing an external feedback cavity containing a grating or other optical elements, thereby compressing the laser linewidth. Figure 2 presents the schematic diagram and the structure of our custom-made ECDL, and Table 1 summarizes the ECDL specifications.
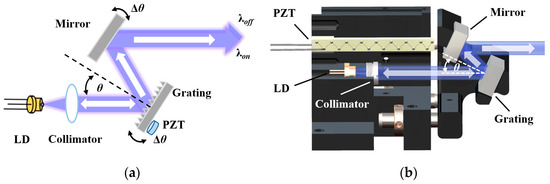
Figure 2.
(a) Schematic diagram of the principle; (b) structure of the ECDL.

Table 1.
Primary specifications of the ECDL employed in this work.
We adopted the Littrow configuration to maximize output power. The LD’s beam, after collimation, generates the first-order and the zeroth-order diffracted light at the grating. The first-order light is fed back into the laser diode, while the zeroth-order light exits as the output beam through a parallel-emitted reflecting mirror. A critical feature of our design is the co-mounting of the reflecting mirror and grating on a single bracket. Actuated by a piezoelectric transducer (PZT), the grating’s deflection is mirrored by the reflecting mirror, ensuring the output beam’s parallelism [42].
In the assembly phase of the ECDL, we captured the emission spectra with a spectrometer and tracked the output power via a power meter. Subsequently, these measurement results were compared with the performance characteristics of the raw laser diode. As shown in Figure 3a, it can be seen that the linewidth (~0.16 nm) of the ECDL is significantly narrower than the linewidth (~2 nm) of the original GaN LD, with the external-cavity structure compressing the linewidth by nearly a factor of 12. Figure 3b demonstrates that the diffraction grating can be precisely adjusted using a PZT to facilitate switching between the λon at 448.1 nm and the λoff at 449.7 nm. During the process of switching the grating angle, the emitted laser power remains stable at 2.97 W, and the linewidth consistently maintains a constant level of 0.16 nm.
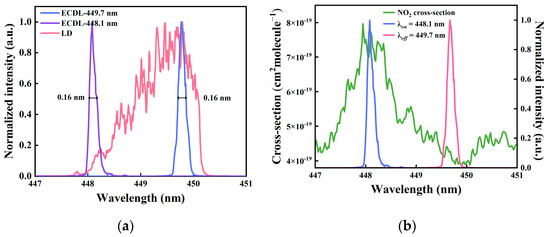
Figure 3.
(a) Spectrum comparison between linewidths of the LD and ECDL; (b) comparison of the NO2 absorption spectrum and switching wavelengths of the ECDL.
2.2.2. NO2 ECDL-DIAL System
The NO2 ECDL-DIAL system comprises a laser emitting unit, an optical receiving unit, and a system controlling unit for system control and data processing, including a microcomputer and other electronics. The system structure and specifications of the NO2 ECDL-DIAL are shown in Figure 4a.
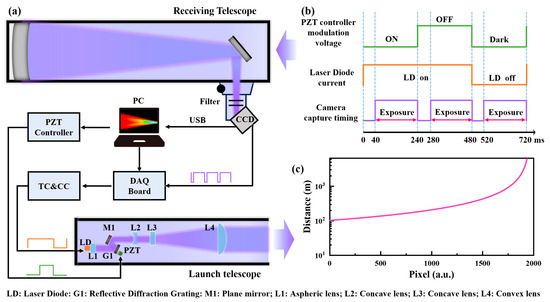
Figure 4.
(a) Schematic of the ECDL-DIAL based on the Scheimpflug principle; (b) time sequences of the PZT controller, the laser diode, and the camera exposure; (c) the pixel–distance relationship.
The laser beam emitted from the ECDL passes through a concave lens (Thorlabs, Newton, MA, USA, LK1753L1-A-15, f = −15 mm, Thorlabs, LK1753L1-A-50, f = −50 mm) and a convex lens (Hengyang, Guangzhou, China, GLA11-101.6-500-VIS, f = 500 mm, D = 101.6 mm) successively for beam expansion and collimation. The operating wavelength of the laser between λon and λoff is tuned by the diffraction angle of the grating. The emitted laser beam interacts with atmospheric molecules and particulates, resulting in scattering and absorption, and the corresponding backscattering light is collected and detected by the receiving optical unit.
The receiving unit is placed at a horizontal distance of L = 802 mm from the laser emission system, and the scattered echo signal is captured by an F4 Newtonian telescope (Skywatcher, Taiwan, China, f = 800 mm, D = 200 mm). An image sensor (LUMENERA, Ottawa, ON, Canda, Lt365R, 1456 × 1936 pixels) is set at a 45° angle relative to the central axis of the Newtonian telescope. The angle between the central axis of the telescope and the laser emitting unit is carefully adjusted to 0.2°. These angles between the image sensor, the telescope, and the laser beam, jointly establish the Scheimpflug imaging condition.
To achieve a narrower filtering effect, two bandpass filters (Edmund Optics, Barrington, IL, USA, CWL = 450 nm, FWHM = 10 nm; Edmund Optics, CWL = 438 nm, FWHM = 24 nm) are placed in front of the image sensor to suppress background light. The image of the transmitted laser beam is captured by a CCD camera and then transferred to the microcomputer for analysis. To facilitate the NO2 measurement in different directions, the lidar is mounted on a pan and tilt head. A data acquisition card (DAQ) is utilized to synchronize the trigger signals among the camera, the driver of the laser diode, and the PZT controller.
As shown in Figure 4b, an accurate timing sequence is crucial for performing differential absorption measurements of NO2. To reduce the interference of background signals on the lidar echo signal, we adopt the method of acquiring dark frames by turning off the laser diode. Within a single measurement cycle, the camera performs three distinct exposure operations to record the lidar signal with the laser on, the lidar signal with the laser off, and the background signal. The conversion of wavelengths is achieved by the data acquisition card (DAQ) sending modulation signals to the piezoelectric ceramic (PZT) driver, which alters the diffraction angle of the grating. Throughout the wavelength switching process, no additional modulation of the laser is required. The pixel–distance relationship after calibration is shown in Figure 4c.
2.3. Measurement
According to the Scheimpflug imaging principle, the scattered photons along the laser beam path are projected onto the corresponding pixels of the CCD camera. As a result, the captured images contain information about the position and strength of the echo signals. To minimize the background signal and thus improve the signal-to-noise ratio (SNR), an 800 × 1936 pixel region of interest (ROI) containing the complete image of the transmitted signal is depicted in Figure 5a. The triangular region represents the echo signal resulting from the interaction between the laser beam and atmospheric particles, while the remaining portion corresponds to background noise.
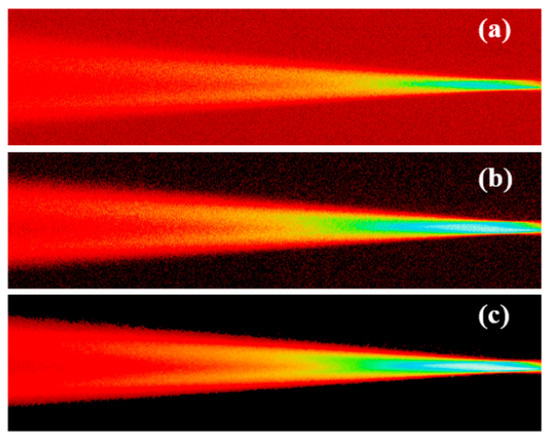
Figure 5.
A comparison of images at different stages of lidar data processing: (a) Raw image captured by CCD; (b) image after median filter; (c) image after beam path extraction.
To eliminate the background noise, the raw image is subtracted from the captured image obtained when the laser is turned off. Although some isolated noisy pixels remain, the overall noise level is significantly reduced. Therefore, a median filter is applied to further suppress the noise in the image, yielding the results displayed in Figure 5b. Finally, as shown in Figure 5c, by employing a method of image beam path extraction, only the signals within the beam shapes are extracted. As a result, the image is left with minimal background noise and system noise, which is embedded within the beam path. It is important to note that noise from background signals and image sensors cannot be completely subtracted, necessitating further signal processing for accurate measurements.
By summing the pixel intensities of Figure 5c along the longitudinal direction, the overall echo signal recorded by CCD is presented in Figure 6. Due to the continuity of atmospheric component distribution, a Savitzky–Golay filter is applied to smooth the curve [43]. The result of the algorithm processing and normalization is shown in Figure 6b. Due to the absorption of atmospheric nitrogen dioxide, the signal at on-wavelength is obviously weaker than that at off-wavelength.
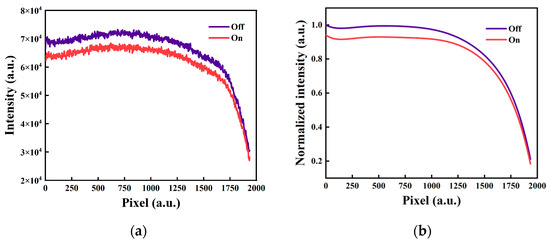
Figure 6.
(a) The pixelated lidar signal obtained by binning pixels along the longitudinal direction; (b) the normalized lidar signal after algorithmic processing.
The differential signal is obtained by comparing the echo signal of the λon to the echo signal of the λoff and combining it with the pixel–distance relationship. This signal attenuates with distance due to atmospheric absorption and scattering. The DIAL ratio curve is constructed from the division of the λon lidar signal by the λoff lidar signal, as depicted in Figure 7a. Figure 7b illustrates that the lidar system can achieve high precision of cm-level distance resolution for short-range detection. However, the resolution performance degrades as the detection range increases: at 440 m, the distance resolution is 1 m; at 1400 m, it decreases to 10 m; and at a detection range of 3 km, the resolution further drops to 44.8 m. Beyond this range, the distance resolution rapidly deteriorates, reaching nearly 200 m when the detection range extends to 6 km. The reliability of far-range lidar signals may be compromised in the presence of atmospheric turbulence or localized aerosol concentrations, due to this degradation of range resolution. Consequently, the maximum measurement distance is generally limited to 3 km.
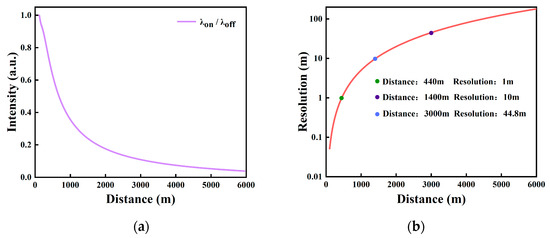
Figure 7.
(a) The DIAL ratio curve; (b) the lidar resolution curve.
3. Results and Discussion
Industrial Zone Environment
From 1 October to 2 October 2023, the weather was characterized by cloudy conditions and a northeasterly wind blowing at 4 m/s. An experiment was conducted to measure NO2 at the Shangyu Industrial Park in Shaoxing City, Zhejiang Province, to verify the feasibility of the NO2 ECDL-DIAL system. As shown in Figure 8, during the observation, the lidar maintained a fixed detection path, with the laser beam emitted nearly horizontally. The camera’s exposure time was set to 200 ms with an analog gain of 2, which is equivalent to approximately 2 min of single DIAL measurement for each profiling. In this experiment, considering the vast amount of image data accumulated from long-term monitoring, we adjusted the time resolution to once every 10 min to reduce the total volume of data processing. To further enhance the system’s time resolution, it is possible to consider upgrading the performance and storage capacity of the microcomputer. By doing so, the system’s data processing capability and efficiency will be significantly improved. The detection period was extended from 20:00 to 05:00 CST (China standard time zone).
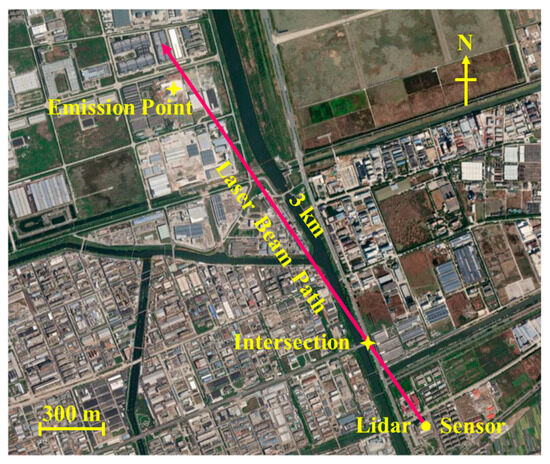
Figure 8.
Map and schematic drawing of the test range for the NO2 DIAL measurements.
Figure 9 presents the continuous monitoring data spanning from 20:00 to 05:00. In order to obtain a more appropriate distance resolution of less than 50 m, the analysis was confined to data collected within a 3 km range for this specific test. The spatial and temporal distribution map of NO2 effectively reveals the concentration changes. A traffic intersection exists at a location 650 m from the detection path. As the area is an industrial park, large trucks often pass through this intersection, resulting in relatively high NO2 concentrations at this location. As indicated by the dashed line in Figure 9, NO2 concentrations typically ranged around 80 ppb from 20:00 to 1:00. From 1:00 to 4:00, the concentration decreased, but after 4:00, it increased again, most likely due to the evolution of the diurnal planetary boundary layer. The spatial and temporal patterns of NO2 concentrations illustrate the dynamics of pollutant dispersion, exhibiting a marked occurrence of concentration peaks between 2000 and 3000 m. This range is characterized by the detection of several high-concentration maxima, which are presumably linked to the emission activities of the nearby industrial park within the designated proximity.
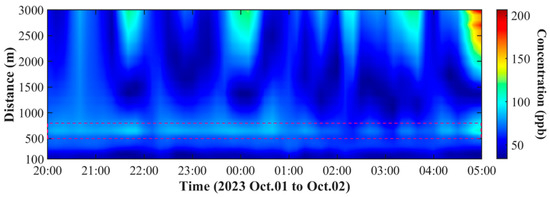
Figure 9.
The spatial and temporal distributions of the NO2 concentration.
To validate accuracy of the detection results, the inversion data from the aforementioned experiments (atmospheric NO2 concentration between 0.1 and 1 km) were compared with the data from the NO2 sensor (Longteng, Shijiazhuang, China, APPB3420-12), which has a detection resolution of 1 ppb and a measurement accuracy of ± 3%, located adjacent to the lidar. The results are shown in Figure 10.
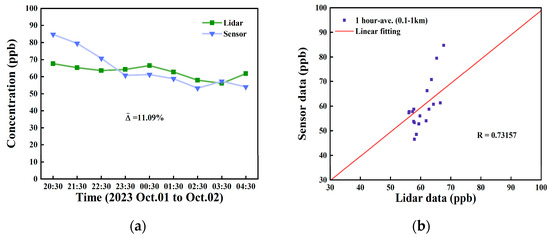
Figure 10.
(a) Comparison of lidar and sensor measurements; (b) correlation analysis between lidar and sensor data.
The mean relative bias of lidar measurements from 1 to 2 October 2023 was found to be approximately 11.09%, as illustrated in Figure 10a. A Pearson correlation coefficient of 0.73157 was calculated using continuous measurements over the two days, indicating a relatively high correlation between the two datasets, as shown in Figure 10b. Table 2 presents the relative bias between the lidar measurements and the sensor concentration. At 20:30, industrial activities, including transportation and factory operations, remain relatively active. Due to the distance between the lidar’s detection path and the point-based sensor, the uneven distribution of atmospheric pollutants, combined with the time required for transmission and diffusion, leads to a delay in the data. In contrast, by 3:00 a.m., industrial activities have essentially ceased, and pollutant diffusion has stabilized, resulting in a more uniform distribution of pollutants in the atmosphere. This makes the data from both sources more consistent.
Table 2.
Relative bias between the lidar and the sensor concentration.
Nonetheless, we noticed that the correlation coefficient had not reached a higher level. After in-depth analysis, we identified potential reasons for this result, including the following: firstly, due to the spatial distribution of buildings in the detection area, the point-based NO2 sensor we used has an effective detection path approximately 100 m away from the lidar. As a result, the differences in NO2 concentration distribution lead to some discrepancies between the results obtained from the two detection methods. Additionally, the time resolution of the point-based sensor is 15 min, which is significantly longer than the 2 min sampling time of our lidar; therefore, a campaign combined with more NO2 sensors along the lidar path probably could obtain better comparison results. Interfering factors may arise during NO2 measurements [44]. For instance, when using a chemiluminescence NOx analyzer with a photolytic converter under conditions of high pollution or intense light, special attention should be given to the interference of peroxy radicals generated by VOCs photolysis on NO, which may lead to underestimation of NO2 levels. Additionally, atmospheric species such as ozone (O3) and peroxyacetyl nitrate (PAN) may react with NO2 or decompose to produce NO2, further affecting the accuracy of NO2 measurements and causing biased results. Therefore, it is crucial to select instrumentation that is well suited to the specific application and atmospheric conditions, while accounting for potential interference sources, to ensure reliable and accurate measurements.
In a previous study, the NO2 Scheimpflug lidar, employing an LD laser with 1.6 W power and 1.2 nm linewidth and a 200 mm diameter telescope, could obtain a 3 km detectable range with 5 min temporal resolution in a clear atmospheric condition [45]. In this study, the NO2 Scheimpflug lidar employed an ECDL laser with 2.97 W power and 0.16 nm linewidth, and a 200 mm diameter telescope was used; as a result, it can obtain 3 km with 10 min temporal resolution. However, due to the lack of in situ NO2 sensors along the lidar measurement path, only the point uncertainty for the integrated range (0.1–1 km) was estimated. The Scheimpflug lidar uses the angular resolution to convert the range resolution; thus, the high quantitative measurement is difficult to achieve, in particular in the far range, which has been shown in our study and the previous study [30]. Due to the narrow linewidth of the λon and λoff emitted by the ECDL, their differential absorption cross-section is 3.7 × 10⁻¹⁹ cm2/molecule, which is approximately 70% higher than the optimal simulated. It is worth noting that a higher differential absorption cross-section is beneficial for obtaining a stronger differential absorption signal, which can increase both the detection limit and measurement accuracy [46]. Furthermore, the temperature-induced wavelengths shift can be restricted, as the output wavelength of an ECDL is constrained by the mechanical parameters of the grating in the ECDL.
The main shortcomings of a Scheimpflug lidar system are its inconsistent range resolution, which arises from the optical design based on the Scheimpflug principle, and the use of continuous-wave lasers and CMOS/CCD image sensors, which result in a signal-to-noise ratio that is not high enough to mitigate disturbances from sunlight, aerosols, and other atmospheric pollutants. Therefore, we are planning to increase the laser source power by combining multiple ECDLs and to employ a narrower linewidth blue filter to block unnecessary visible sunlight. Moreover, multi-wavelength differential absorption techniques are also promising methods that we aim to incorporate into our Scheimpflug lidar system to reduce the impact of other atmospheric components [20].
4. Conclusions
In this paper, a novel NO2 Scheimpflug lidar was developed and demonstrated based on a Littrow structured ECDL with the power of 2.97 W and linewidth of 0.16 nm. Attributed to the spectrum properties of the ECDL (narrow linewidth and high temperature stability), the lidar system has advantages in accuracy and a large temperature tolerance and can be used continuously in an outdoor environment. The system’s viability was effectively validated through on-site testing at an industrial park. The results demonstrate that this lidar can provide NO2 profiles with a spatial resolution of less than 50 m within 3 km and a temporal resolution of 10 min. The measurement results were compared with data obtained from a point NO2 sensor, yielding a Pearson correlation coefficient of 0.73157 and an average relative error of 11.09%.
The lidar system proposed in this paper offers a competitive and practical solution for atmospheric NO2 measurement and demonstrates a promising approach in Scheimpflug lidar improvement. Due to its lower cost and robust capability, the Scheimpflug NO2 DIAL might be an effective tool for monitoring small-scale pollutant areas.
Author Contributions
Conceptualization, X.P.; methodology, Y.Z.; software, W.L.; validation, W.L.; formal analysis, A.X.; investigation, W.L. and C.Y.; resources, Q.L.; data curation, W.L. and C.Y.; writing—original draft preparation, C.Y.; writing—review and editing, B.Z. and L.W.; visualization, L.W.; supervision, B.Z. and D.C.; project administration, D.C.; funding acquisition, Z.G. and L.W. All authors have read and agreed to the published version of the manuscript.
Funding
This work is supported by the “Pioneer” and “Leading Goose” R&D Program of Zhejiang (2022C03084 and 2022C03066) and the Natural Science Foundation of China (42475147 and 62105248).
Data Availability Statement
The raw data supporting the conclusions of this article will be made available by the authors on request.
Conflicts of Interest
The authors declare no conflicts of interest.
References
- Ji, J.S.; Liu, L.; Zhang, J.J.; Kan, H.; Zhao, B.; Burkart, K.G.; Zeng, Y. NO2 and PM2.5 air pollution co-exposure and temperature effect modification on pre-mature mortality in advanced age: A longitudinal cohort study in China. Environ. Health 2022, 21, 97. [Google Scholar] [CrossRef]
- Ritz, B.; Hoffmann, B.; Peters, A. The Effects of Fine Dust, Ozone, and Nitrogen Dioxide on Health. Dtsch. Arztebl. Int. 2019, 116, 881–886. [Google Scholar] [CrossRef]
- Meng, X.; Liu, C.; Chen, R.; Sera, F.; Vicedo-Cabrera, A.M.; Milojevic, A.; Guo, Y.; Tong, S.; de Sousa Zanotti Staglior Coelho, M.; Nascimento Saldiva, P.H.; et al. Short term associations of ambient nitrogen dioxide with daily total, cardiovascular, and respiratory mortality: Multilocation analysis in 398 cities. BMJ 2021, 372, n534. [Google Scholar] [CrossRef]
- Brunekreef, B.; Beelen, R.; Hoek, G.; Schouten, L.; Bausch-Goldbohm, S.; Fischer, P.; Armstrong, B.; Hughes, E.; Jerrett, M.; van den Brandt, P. Effects of long-term exposure to traffic-related air pollution on respiratory and cardiovascular mortality in The Netherlands: The NLCS-AIR study. Res. Rep. Health Eff. Inst. 2009, 139, 5–71. [Google Scholar]
- Krecl, P.; Targino, A.C.; Landi, T.P.; Ketzel, M. Determination of black carbon, PM2.5, particle number and NOx emission factors from roadside measurements and their implications for emission inventory development. Atmos. Environ. 2018, 186, 229–240. [Google Scholar] [CrossRef]
- Atkinson, R. Atmospheric chemistry of VOCs and NOx. Atmos. Environ. 2000, 34, 2063–2101. [Google Scholar] [CrossRef]
- Khan, J.; Ketzel, M.; Kakosimos, K.; Sørensen, M.; Jensen, S.S. Road traffic air and noise pollution exposure assessment—A review of tools and techniques. Sci. Total Environ. 2018, 634, 661–676. [Google Scholar] [CrossRef]
- Walters, W.W.; Tharp, B.D.; Fang, H.; Kozak, B.J.; Michalski, G. Nitrogen Isotope Composition of Thermally Produced NOx from Various Fossil-Fuel Combustion Sources. Environ. Sci. Technol. 2015, 49, 11363–11371. [Google Scholar] [CrossRef] [PubMed]
- Zhen, S.; Luo, M.; Shao, Y.; Xu, D.; Ma, L. Application of Stable Isotope Techniques in Tracing the Sources of Atmospheric NOx and Nitrate. Processes 2022, 10, 2549. [Google Scholar] [CrossRef]
- Jiang, Z.; Zhu, R.; Miyazaki, K.; McDonald, B.C.; Klimont, Z.; Zheng, B.; Boersma, K.F.; Zhang, Q.; Worden, H.; Worden, J.R.; et al. Decadal variabilities in tropospheric nitrogen oxides over United States, Europe, and China. J. Geophys. Res. Atmos. 2022, 127, e2021JD035872. [Google Scholar] [CrossRef]
- Liu, C.; Xing, C.Z.; Hu, Q.H.; Wang, S.; Zhao, S.; Gao, M. Stereoscopic hyperspectral remote sensing of the atmospheric environment: Innovation and prospects. Earth-Sci. Rev. 2022, 226, 103958. [Google Scholar] [CrossRef]
- Villena, G.; Bejan, I.; Kurtenbach, R.; Wiesen, P.; Kleffmann, J. Development of a new Long Path Absorption Photometer (LOPAP) instrument for the sensitive detection of NO2 in the atmosphere. Atmos. Meas. Tech. 2011, 4, 1663–1676. [Google Scholar] [CrossRef]
- Fredriksson, K.A.; Hertz, H.M. Evaluation of the DIAL technique for studies on NO2 using a mobile lidar system. Appl. Opt. 1984, 23, 1403–1411. [Google Scholar] [CrossRef]
- Cheng, Y.; Zhang, Z.; Hua, D.; Gong, Z.; Mei, L. Research progress of NO2 differential absorption lidar technology. Chin. J. Quantum Electron. 2021, 38, 580–592. [Google Scholar] [CrossRef]
- Cao, N.; Fujii, T.; Fukuchi, T.; Goto, N.; Nemoto, K.; Takeuchi, N. NO2 vertical concentration monitoring by DIAL with high accuracy. In Proceedings of the Second International Asia-Pacific Symposium on Remote Sensing of the Atmosphere, Environment, and Space, Sendai, Japan, 13 February 2001. [Google Scholar] [CrossRef]
- Huang, D.; Du, Y.; Xu, Q.; Ko, J.H. Quantification and control of gaseous emissions from solid waste landfill surfaces. J. Environ. Manag. 2022, 302, 114001. [Google Scholar] [CrossRef] [PubMed]
- Innocenti, F.; Robinson, R.; Gardiner, T.; Finlayson, A.; Connor, A. Differential Absorption Lidar (DIAL) Measurements of Landfill Methane Emissions. Remote Sens. 2017, 9, 953. [Google Scholar] [CrossRef]
- Browell, E.V.; Ismail, S.; Grant, W.B. Differential absorption lidar (DIAL) measurements from air and space. Appl. Phys. B 1998, 67, 399–410. [Google Scholar] [CrossRef]
- Cao, N.; Fukuchi, T.; Fujii, T.; Collins, R.L.; Li, S.; Wang, Z.; Chen, Z. Error analysis for NO2 DIAL measurement in the troposphere. Appl. Phys. B 2005, 82, 141–148. [Google Scholar] [CrossRef]
- Su, J.; McCormick, M.P.; Johnson, M.S.; Sullivan, J.T.; Newchurch, M.J.; Berkoff, T.A.; Kuang, S.; Gronoff, G.P. Tropospheric NO2 measurements using a three-wavelength optical parametric oscillator differential absorption lidar. Atmos. Meas. Tech. 2021, 14, 4069–4082. [Google Scholar] [CrossRef]
- Liu, Q.W.; Wang, X.B.; Chen, Y.F.; Cao, K.F.; Hu, S.X.; Huang, J. Atmospheric NO2 Concentration Detection by Dye Laser Based Differential Absorption Lidar. Acta. Opt. Sin. 2017, 37, 338–345. [Google Scholar] [CrossRef]
- Brydegaard, M.; Malmqvist, E.; Jansson, S.; Larsson, J.; Török, S.; Zhao, G. The Scheimpflug lidar method. In Proceedings of the Lidar Remote Sensing for Environmental Monitoring 2017, San Diego, CA, USA, 30 August 2017. [Google Scholar] [CrossRef]
- Larsson, J.; Bood, J.; Xu, C.T.; Yang, X.; Lindberg, R.; Laurell, F.; Brydegaard, M. Atmospheric CO2 sensing using Scheimpflug-lidar based on a 1.57-µm fiber source. Opt. Express 2019, 27, 17348–17358. [Google Scholar] [CrossRef] [PubMed]
- Sun, G.; Qin, L.; Hou, Z.; Jing, X.; He, F.; Tan, F.; Zhang, S. Small-scale Scheimpflug lidar for aerosol extinction coefficient and vertical atmospheric transmittance detection. Opt. Express 2018, 26, 7423–7436. [Google Scholar] [CrossRef] [PubMed]
- Mei, L.; Kong, Z.; Ma, T.; Li, L.; Liu, Z. Applications of the Scheimpflug lidar technique in atmospheric remote sensing. In Proceedings of the 2019 Photonics & Electromagnetics Research Symposium—Spring, Rome, Italy, 17–20 June 2019. [Google Scholar] [CrossRef]
- Liu, Z.; Li, L.; Li, H.; Mei, L. Preliminary studies on atmospheric monitoring by employing a portable unmanned Mie-scattering Scheimpflug lidar system. Remote Sens. 2019, 11, 837. [Google Scholar] [CrossRef]
- Mei, L.; Kong, Z.; Guan, P. Implementation of a violet Scheimpflug lidar system for atmospheric aerosol studies. Opt. Express 2018, 26, A260–A274. [Google Scholar] [CrossRef]
- Mei, L.; Brydegaard, M. Continuous-wave differential absorption lidar. Laser Photonics Rev. 2015, 9, 629–636. [Google Scholar] [CrossRef]
- Mei, L.; Guan, P.; Kong, Z. Remote sensing of atmospheric NO2 by employing the continuous-wave differential absorption lidar technique. Opt. Express 2017, 25, A953–A962. [Google Scholar] [CrossRef]
- Mei, L.; Cheng, Y.; Zhang, Z.; Kong, Z.; Yang, C.; Gong, Z.; Liu, K. Evaluation of systematic errors for the continuous-wave NO2 differential absorption lidar employing a multimode laser diode. Appl. Opt. 2020, 59, 9087–9097. [Google Scholar] [CrossRef]
- Tao, Y.; Zhang, S.; Jiang, M.; Li, C.; Zhou, P.; Jiang, Z. High power and high efficiency single-frequency 1030 nm DFB fiber laser. Opt. Laser Technol. 2021, 134, 107519. [Google Scholar] [CrossRef]
- Fu, S.; Zhu, X.; Zong, J.; Norwood, R.A.; Peyghambarian, N. Diode-pumped 1.15 W linearly polarized single-frequency Yb3+-doped phosphate fiber laser. Opt. Express 2021, 29, 30637–30643. [Google Scholar] [CrossRef]
- Sarzała, R.P.; Śpiewak, P.; Nakwaski, W.; Wasiak, M. Cavity designs for nitride VCSELs with dielectric DBRs operating efficiently at different temperatures. Opt. Laser Technol. 2020, 132, 106482. [Google Scholar] [CrossRef]
- Ishii, H.; Kasaya, K.; Oohashi, H. Spectral linewidth reduction in widely wavelength tunable DFB laser array. IEEE J. Sel. Top. Quantum Electron. 2009, 15, 514–520. [Google Scholar] [CrossRef]
- Dhoore, S.; Roelkens, G.; Morthier, G. III-V-on-silicon three-section DBR laser with over 12 nm continuous tuning range. Opt. Lett. 2017, 42, 1121–1124. [Google Scholar] [CrossRef]
- Peng, X.Q.; Luo, W.X.; Bai, Y.; Zhang, B.; Zhang, Y.S.; Ling, Q.; Chen, H.; Luo, S.; Guan, Z.Z.; Chen, D.R. Study of wavelength-switchable watt-level blue external cavity diode laser for NO2 S-DIAL. Laser Phys. 2022, 33, 015801. [Google Scholar] [CrossRef]
- Serafini, V.; Riva, M.; Pippione, G.; Mirigaldi, A.; Coriasso, C.; Codato, S.; Gotta, P.; Maina, A.; Paoletti, R.; Perrone, G. Compact high-brightness and highly manufacturable blue laser modules. In Proceedings of the SPIE High-Power Diode Laser Technology XIX, Online, 10 March 2021. [Google Scholar] [CrossRef]
- Chen, M.H.; Hsiao, S.C.; Shen, K.T.; Tsai, C.C.; Chui, H.C. Single longitudinal mode external cavity blue InGaN diode laser. Opt. Laser Technol. 2019, 116, 68–71. [Google Scholar] [CrossRef]
- Brydegaard, M.; Gebru, A.; Svanberg, S. Super resolution laser radar with blinking atmospheric particles. Prog. Electromagn. Res. 2014, 147, 141–151. [Google Scholar] [CrossRef]
- Carpentier, J. Improvements in Enlarging or Like Cameras. Great Britain Patent 1901.11.02.
- Mei, L.; Brydegaard, M. Development of a Scheimpflug lidar system for atmospheric aerosol monitoring. In Proceedings of the 27th International Laser Radar Conference, Online, 7 June 2016. [Google Scholar] [CrossRef]
- Hawthorrn, C.J.; Weber, K.P.; Scholten, R.E. Littrow configuration tunable external cavity diode laser with fixed direction output beam. Rev. Sci. Instrum. 2001, 72, 4477–4479. [Google Scholar] [CrossRef]
- Mei, L.; Zhang, L.; Kong, Z.; Li, H. Noise modeling, evaluation and reduction for the atmospheric lidar technique employing an image sensor. Opt. Commun. 2018, 426, 463–470. [Google Scholar] [CrossRef]
- Villena, G.; Bejan, I.; Kurtenbach, R.; Wiesen, P.; Kleffmann, J. Interferences of commercial NO2 instruments in the urban atmosphere and in a smog chamber. Atmos. Meas. Tech. 2012, 5, 149–159. [Google Scholar] [CrossRef]
- Cheng, Y.; Yu, J.; Kong, Z.; Mei, L. Diode-laser based field deployable continuous-wave differential absorption lidar for atmospheric NO2 monitoring. Opt. Lasers Eng. 2024, 181, 108344. [Google Scholar] [CrossRef]
- Liu, Q.W.; Chen, F.Y.; Wang, J.; Huang, J.; Hu, S.X. Effects of wavelength shift and energy fluctuation on inversion of NO2 differential absorption lidar. Opt. Prec. Eng. 2018, 26, 253–260. [Google Scholar] [CrossRef]
Disclaimer/Publisher’s Note: The statements, opinions and data contained in all publications are solely those of the individual author(s) and contributor(s) and not of MDPI and/or the editor(s). MDPI and/or the editor(s) disclaim responsibility for any injury to people or property resulting from any ideas, methods, instructions or products referred to in the content. |
© 2025 by the authors. Licensee MDPI, Basel, Switzerland. This article is an open access article distributed under the terms and conditions of the Creative Commons Attribution (CC BY) license (https://creativecommons.org/licenses/by/4.0/).