Predicting Lightning from Near-Surface Climate Data in the Northeastern United States: An Alternative to CAPE
Abstract
1. Introduction
2. Materials and Methods
2.1. Data
2.2. Model Definitions
2.2.1. Baseline Models (C1–C5)
- C1 (Power Law Model): = a(CAPE × Pr)b, where a and b are estimated via log-log regression.
- C2 (Power Law, Linear Optimization): Follows the same functional form as C1 but applies nonlinear least squares optimization directly without log transformation.
- 3.
- C3 (Scaling Model): = a(CAPE × Pr), assumes direct proportionality between and CAPE × Pr.
- 4.
- C4 (Non-Parametric Model): Uses a lookup table of mean strike rates across binned values of CAPE × Pr.
- 5.
- C5 (Ensemble Model): Applies the ensemble mean of C1–C4.
2.2.2. Linear Models (N1–N13)
2.2.3. Gamma GLMs (G1–G13)
2.2.4. Gamma Bayesian Models (B1–B13)
2.3. Model Evaluation
3. Results
4. Discussion
- 1.
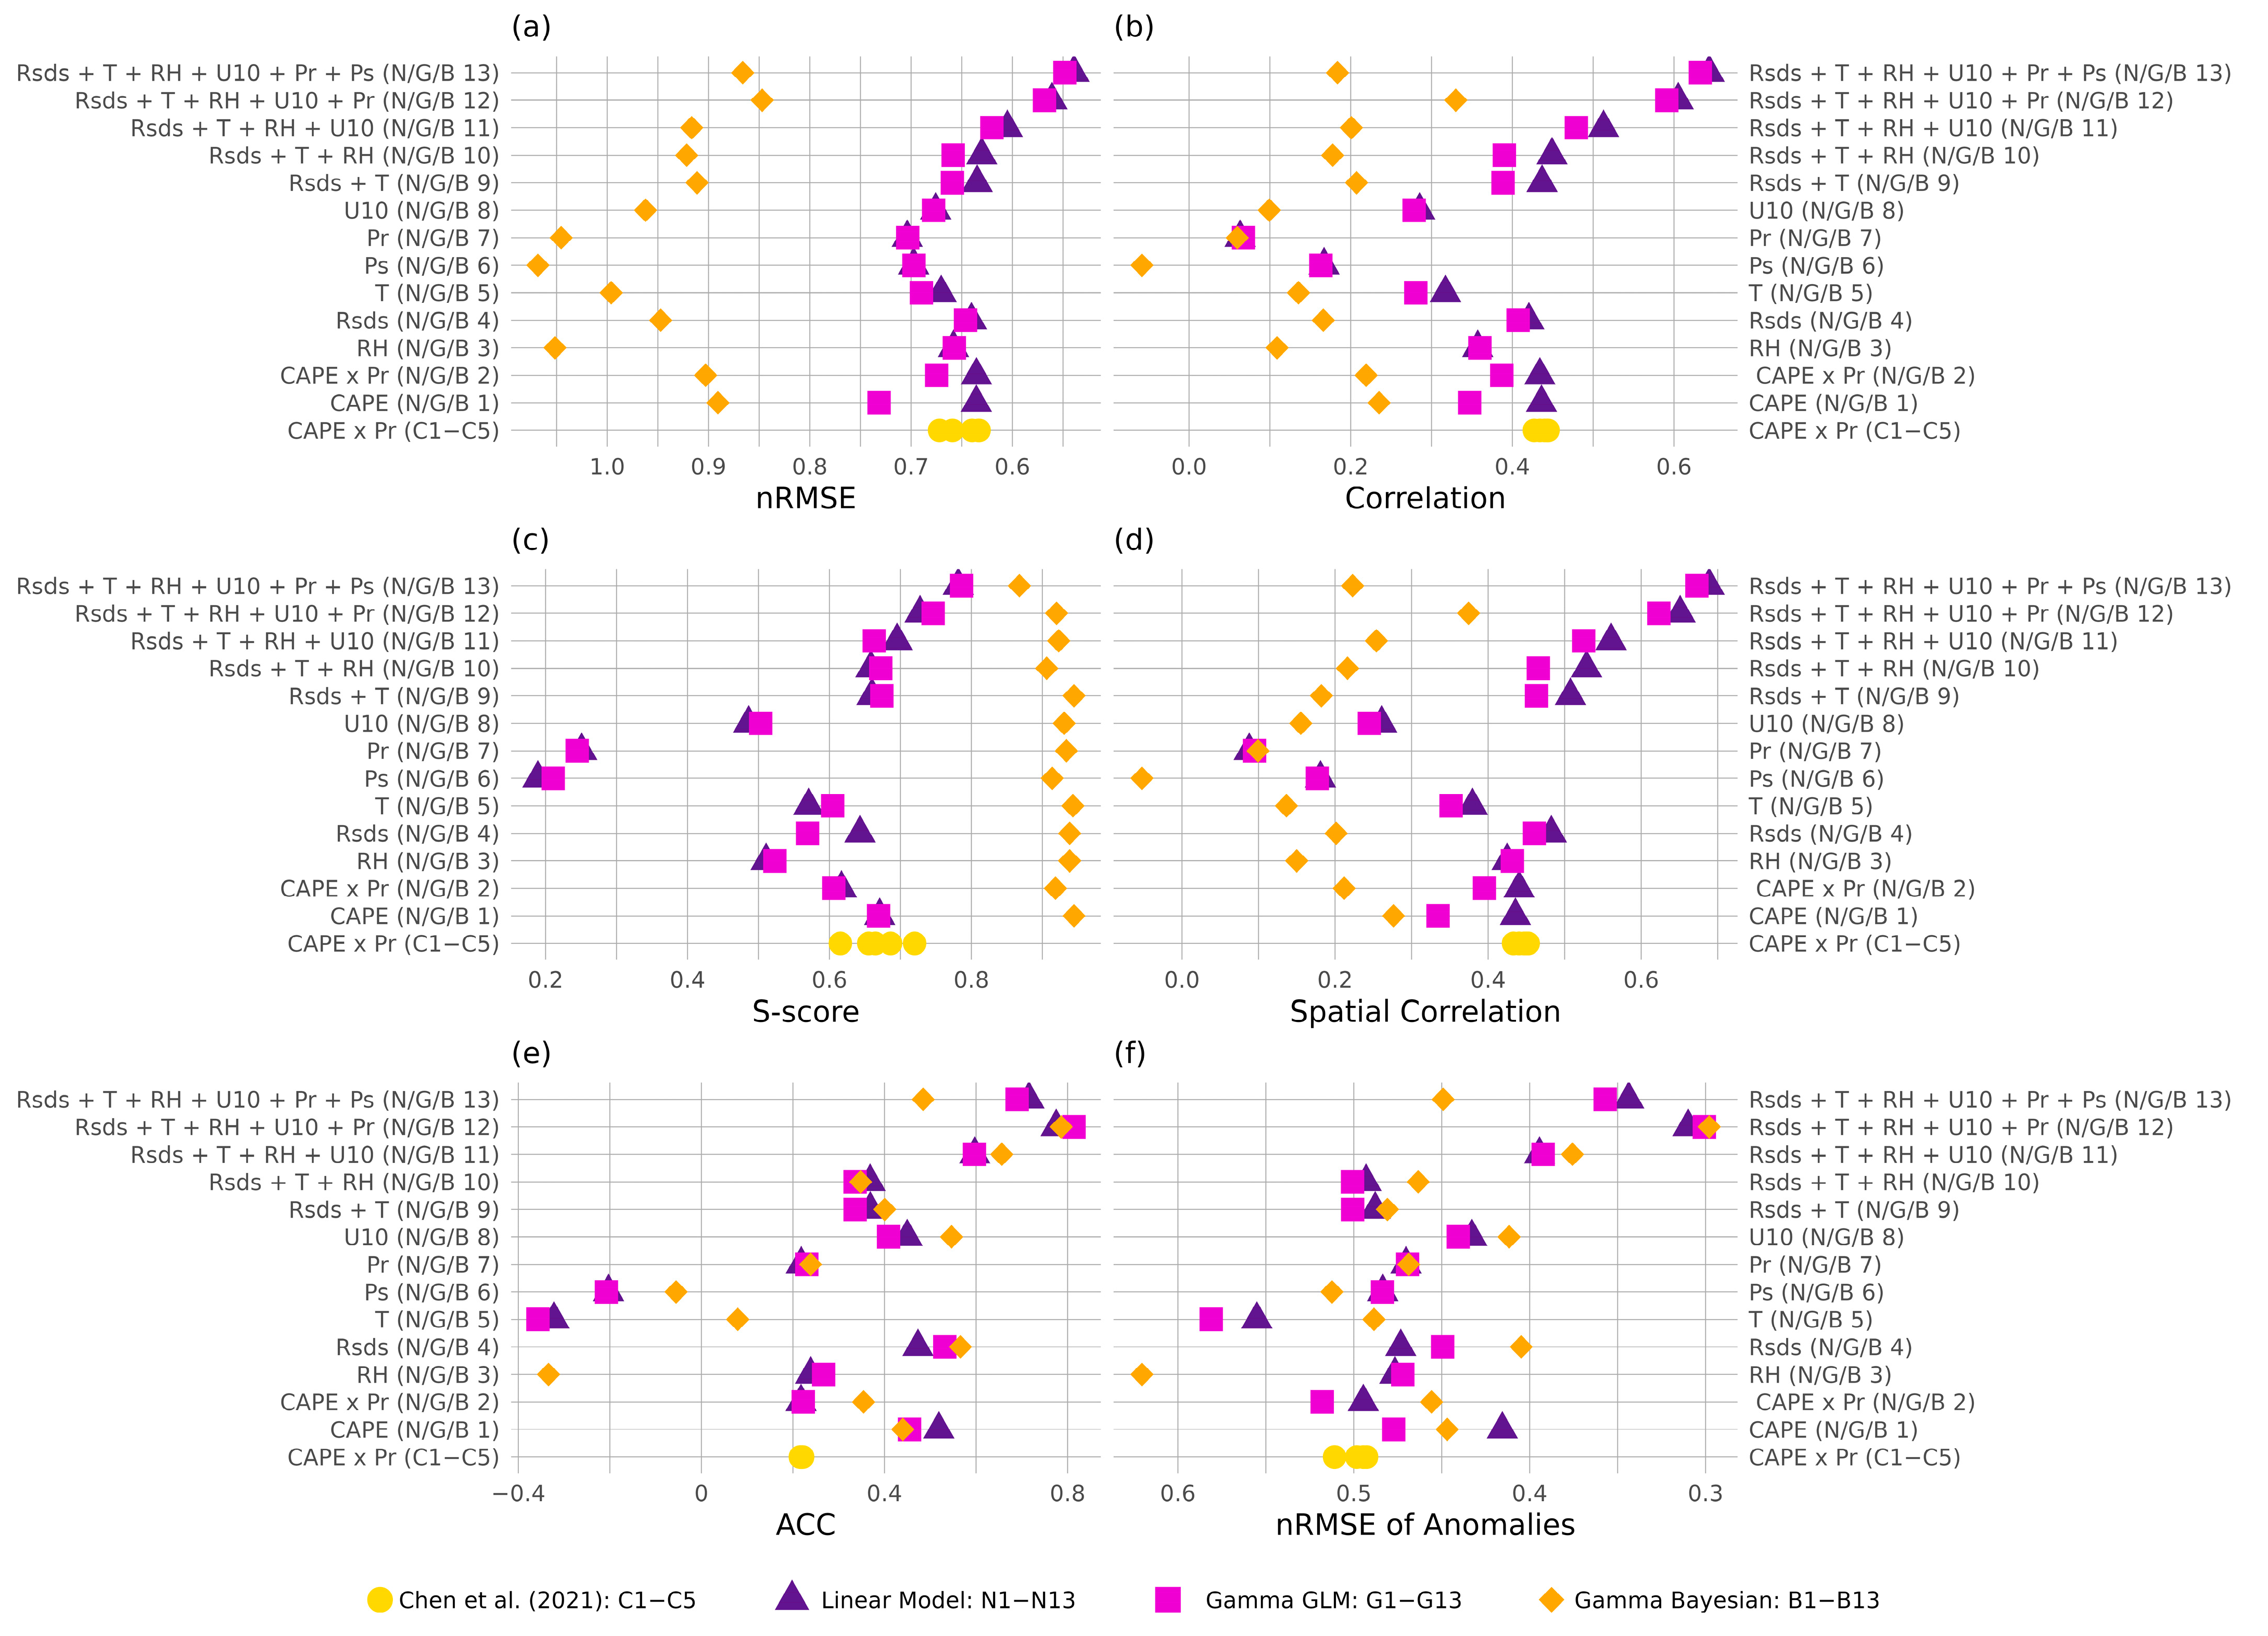
- Surface pressure saw high importance in the random forest analysis, but low stand-alone performance and degraded temporal accuracy when used in combination with the other five near-surface variables. This is reflected by [43], who found that pressure-derived indices can successfully identify convective environments, but cannot capture the timing of individual events. Pressure does not show large year-to-year variability, particularly at a seasonal resolution, reducing its ability to track interannual changes in lightning.
- 2.
- Surface temperature demonstrated moderate predictive skill relative to other single variable models. Prior studies have shown that elevated surface temperatures coincide with lightning [44], which may reflect boundary-layer thermodynamics, where warmer surface temperatures increase air buoyancy.
- 3.
- Wind speed demonstrated moderate to low importance in the random forest analysis, but performed well in terms of temporal accuracy. Wind near the surface plays a dual role in convective processes. It can aid in the development of a convective storm by delivering warm, humid air and enhancing heat exchange. However, strong surface wind speeds will prevent the temperature and humidity layers associated with convection from forming [45].
- 4.
- Precipitation, by contrast, ranked low in both importance and predictive skill when used alone. While precipitation is often used as a proxy for convective activity, its poor performance here may come from two factors. First, aggregating to a seasonal scale smooths out storm-level events. Second, the ERA5 precipitation data we used includes both convective and stratiform components [27]. Including stratiform precipitation, which is not usually associated with lightning, likely dilutes the signal.
- 5.
- Finally, relative humidity also had low stand-alone importance and temporal accuracy but improved model performance when included with other variables. While relative humidity has been linked to lightning occurrence through its role in cloud formation and convective efficiency [46], it alone does not trigger convection; high relative humidity reduces the energy required for saturation, but without accompanying factors such as instability and lift, storms are unlikely to form. Moreover, surface relative humidity may not represent layers of low or high moisture in the upper atmosphere important to convection.
5. Conclusions
Author Contributions
Funding
Institutional Review Board Statement
Informed Consent Statement
Data Availability Statement
Acknowledgments
Conflicts of Interest
Abbreviations
| NE US | Northeastern United States |
| CAPE | Convective Available Potential Energy |
| Pr | Precipitation |
| RH | Relative humidity |
| Rsds | Shortwave radiation |
| T | Temperature |
| Ps | Surface Pressure |
| U10 | Wind speed |
| CG | Cloud-to-ground |
| IC | Intra-cloud |
| GLM | Generalized linear model |
| nRMSE | Normalized Root Mean Squared Error |
| ACC | Anomaly correlation coefficient |
References
- Pausas, J.G.; Keeley, J.E. A Burning Story: The Role of Fire in the History of Life. BioScience 2009, 59, 593–601. [Google Scholar] [CrossRef]
- Allen, H.D. Fire: Plant functional types and patch mosaic burning in fire-prone ecosystems. Prog. Phys. Geogr. 2008, 32, 421–437. [Google Scholar] [CrossRef]
- Weir, J.M.H.; Johnson, E.A.; Miyanishi, K. Fire Frequency and the Spatial Age Mosaic of the Mixed-Wood Boreal Forest in Western Canada. Ecol. Appl. 2000, 10, 1162–1177. [Google Scholar] [CrossRef]
- He, T.; Lamont, B.B.; Pausas, J.G. Fire as a key driver of Earth’s biodiversity. Biol. Rev. 2019, 94, 1983–2010. [Google Scholar] [CrossRef]
- Hessilt, T.D.; Abatzoglou, J.T.; Chen, Y.; Randerson, J.T.; Scholten, R.C.; van der Werf, G.; Veraverbeke, S. Future increases in lightning ignition efficiency and wildfire occurrence expected from drier fuels in boreal forest ecosystems of western North America. Environ. Res. Lett. 2022, 17, 054008. [Google Scholar] [CrossRef]
- Peterson, D.; Wang, J.; Ichoku, C.; Remer, L.A. Effects of lightning and other meteorological factors on fire activity in the North American boreal forest: Implications for fire weather forecasting. Atmospheric Chem. Phys. 2010, 10, 6873–6888. [Google Scholar] [CrossRef]
- Song, Y.; Xu, C.; Li, X.; Oppong, F. Lightning-Induced Wildfires: An Overview. Fire 2024, 7, 79. [Google Scholar] [CrossRef]
- Romps, D.M.; Seeley, J.T.; Vollaro, D.; Molinari, J. Projected increase in lightning strikes in the United States due to global warming. Science 2014, 346, 851–854. [Google Scholar] [CrossRef] [PubMed]
- Chen, Y.; Romps, D.M.; Seeley, J.T.; Veraverbeke, S.; Riley, W.J.; Mekonnen, Z.A.; Randerson, J.T. Future increases in Arctic lightning and fire risk for permafrost carbon. Nat. Clim. Change 2021, 11, 404–410. [Google Scholar] [CrossRef]
- Hayhoe, K.; Wake, C.; Anderson, B.; Liang, X.-Z.; Maurer, E.; Zhu, J.; Bradbury, J.; DeGaetano, A.; Stoner, A.M.; Wuebbles, D. Regional climate change projections for the Northeast USA. Mitig. Adapt. Strateg. Glob. Change 2008, 13, 425–436. [Google Scholar] [CrossRef]
- Thibeault, J.M.; Seth, A. Changing climate extremes in the Northeast United States: Observations and projections from CMIP5. Clim. Change 2014, 127, 273–287. [Google Scholar] [CrossRef]
- Gao, P.; Terando, A.J.; Kupfer, J.A.; Varner, J.M.; Stambaugh, M.C.; Lei, T.L.; Hiers, J.K. Robust projections of future fire probability for the conterminous United States. Sci. Total Environ. 2021, 789, 147872. [Google Scholar] [CrossRef] [PubMed]
- Kerr, G.H.; DeGaetano, A.T.; Stoof, C.R.; Ward, D. Climate change effects on wildland fire risk in the Northeastern and Great Lakes states predicted by a downscaled multi-model ensemble. Theor. Appl. Climatol. 2018, 131, 625–639. [Google Scholar] [CrossRef]
- Miller, D. Wildfires in the Northeastern United States: Evaluating Fire Occurrence and Risk in the Past, Present, and Future. Doctor Dissertation, University of Massachusetts Amherst, Amherst, MA, USA, 2019. [Google Scholar] [CrossRef]
- Tang, Y.; Zhong, S.; Luo, L.; Bian, X.; Heilman, W.E.; Winkler, J. The Potential Impact of Regional Climate Change on Fire Weather in the United States. Ann. Assoc. Am. Geogr. 2015, 105, 1–21. [Google Scholar] [CrossRef]
- Etten-Bohm, M.; Yang, J.; Schumacher, C.; Jun, M. Evaluating the Relationship Between Lightning and the Large-Scale Environment and its Use for Lightning Prediction in Global Climate Models. J. Geophys. Res. Atmos. 2021, 126, e2020JD033990. [Google Scholar] [CrossRef]
- Moon, S.-H.; Kim, Y.-H. Forecasting lightning around the Korean Peninsula by postprocessing ECMWF data using SVMs and undersampling. Atmospheric Res. 2020, 243, 105026. [Google Scholar] [CrossRef]
- Price, C.; Rind, D. What determines the cloud-to-ground lightning fraction in thunderstorms? Geophys. Res. Lett. 1993, 20, 463–466. Available online: https://ntrs.nasa.gov/citations/19930047912 (accessed on 14 August 2023). [CrossRef]
- Price, C.; Rind, D. Modeling Global Lightning Distributions in a General Circulation Model. Mon. Weather Rev. 1994, 122, 1930–1939. [Google Scholar] [CrossRef]
- Clark, S.K.; Ward, D.S.; Mahowald, N.M. Parameterization-based uncertainty in future lightning flash density. Geophys. Res. Lett. 2017, 44, 2893–2901. [Google Scholar] [CrossRef]
- Magi, B.I. Global Lightning Parameterization from CMIP5 Climate Model Output. J. Atmospheric Ocean. Technol. 2015, 32, 434–452. [Google Scholar] [CrossRef]
- Baker, M.B.; Christian, H.J.; Latham, J. A computational study of the relationships linking lightning frequency and other thundercloud parameters. Q. J. R. Meteorol. Soc. 1995, 121, 1525–1548. [Google Scholar] [CrossRef]
- Bao, R.; Zhang, Y.; Ma, B.J.; Zhang, Z.; He, Z. An Artificial Neural Network for Lightning Prediction Based on Atmospheric Electric Field Observations. Remote Sens. 2022, 14, 4131. [Google Scholar] [CrossRef]
- Brown, J.L.; Hill, D.J.; Dolan, A.M.; Carnaval, A.C.; Haywood, A.M. PaleoClim, high spatial resolution paleoclimate surfaces for global land areas. Sci. Data 2018, 5, 180254. [Google Scholar] [CrossRef] [PubMed]
- Hakim, G.J.; Emile-Geay, J.; Steig, E.J.; Noone, D.; Anderson, D.M.; Tardif, R.; Steiger, N.; Perkins, W.A. The last millennium climate reanalysis project: Framework and first results. J. Geophys. Res. Atmos. 2016, 121, 6745–6764. [Google Scholar] [CrossRef]
- Kageyama, M.; Braconnot, P.; Harrison, S.P.; Haywood, A.M.; Jungclaus, J.H.; Otto-Bliesner, B.L.; Peterschmitt, J.-Y.; Abe-Ouchi, A.; Albani, S.; Bartlein, P.J.; et al. The PMIP4 contribution to CMIP6—Part 1: Overview and over-arching analysis plan. Geosci. Model Dev. 2018, 11, 1033–1057. [Google Scholar] [CrossRef]
- Hersbach, H.; Bell, B.; Berrisford, P.; Hirahara, S.; Horányi, A.; Muñoz-Sabater, J.; Nicolas, J.; Peubey, C.; Radu, R.; Schepers, D.; et al. The ERA5 global reanalysis. Q. J. R. Meteorol. Soc. 2020, 146, 1999–2049. [Google Scholar] [CrossRef]
- Vaisala, Inc. Vaisala National Lightning Detection Network [CSV]. Available online: https://www.vaisala.com/en/lp/request-vaisala-lightning-data-research-use (accessed on 24 January 2023).
- Kumar, J.; Brooks, B.-G.J.; Thornton, P.E.; Dietze, M.C. Sub-daily Statistical Downscaling of Meteorological Variables Using Neural Networks. Procedia Comput. Sci. 2012, 9, 887–896. [Google Scholar] [CrossRef]
- Alduchov, O.A.; Eskridge, R.E. Improved Magnus Form Approximation of Saturation Vapor Pressure. J. Appl. Meteorol. 1988-2005 1996, 35, 601–609. [Google Scholar] [CrossRef]
- Abarca, S.F.; Corbosiero, K.L.; Galarneau, T.J., Jr. An evaluation of the Worldwide Lightning Location Network (WWLLN) using the National Lightning Detection Network (NLDN) as ground truth. J. Geophys. Res. Atmos. 2010, 115, D18206. [Google Scholar] [CrossRef]
- Cummins, K.L.; Murphy, M.J. An Overview of Lightning Locating Systems: History, Techniques, and Data Uses, With an In-Depth Look at the U.S. NLDN. IEEE Trans. Electromagn. Compat. 2009, 51, 499–518. [Google Scholar] [CrossRef]
- Murphy, M.J.; Nag, A. Cloud lightning performance and climatology of the U.S. based on the upgraded U.S. National Lightning Detection Network. In Proceedings of the 95th Annual AMS Meeting 2015, Phoenix, AZ, USA, 4–8 January 2015; p. 8.2. Available online: https://ui.adsabs.harvard.edu/abs/2015AMS....9562391M (accessed on 28 August 2025).
- Zhu, Y.; Rakov, V.A.; Tran, M.D.; Nag, A. A study of National Lightning Detection Network responses to natural lightning based on ground truth data acquired at LOG with emphasis on cloud discharge activity. J. Geophys. Res. Atmos. 2016, 121, 14651–14660. [Google Scholar] [CrossRef]
- R Core Team. R: A Language and Environment for Statistical Computing; R Foundation for Statistical Computing: Vienna, Austria, 2024; Available online: https://www.R-project.org/ (accessed on 1 November 2024).
- Stan Development Team. RStan: The R interface to Stan. 2024. Available online: https://mc-stan.org/ (accessed on 1 November 2024).
- Perkins, S.E.; Pitman, A.J.; Holbrook, N.J.; McAneney, J. Evaluation of the AR4 Climate Models’ Simulated Daily Maximum Temperature, Minimum Temperature, and Precipitation over Australia Using Probability Density Functions. J. Clim. 2007, 20, 4356–4376. [Google Scholar] [CrossRef]
- Katz, R.W.; Brown, B.G. Extreme events in a changing climate: Variability is more important than averages. Clim. Change 1992, 21, 289–302. [Google Scholar] [CrossRef]
- Scoccimarro, E.; Gualdi, S.; Bellucci, A.; Zampieri, M.; Navarra, A. Heavy precipitation events over the Euro-Mediterranean region in a warmer climate: Results from CMIP5 models. Reg. Environ. Change 2016, 16, 595–602. [Google Scholar] [CrossRef]
- Westra, S.; Fowler, H.J.; Evans, J.P.; Alexander, L.V.; Berg, P.R.; Johnson, F.; Kendon, E.J.; Lenderink, G.; Roberts, N.M. Future changes to the intensity and frequency of short-duration extreme rainfall. Rev. Geophys. 2014, 52, 522–555. [Google Scholar] [CrossRef]
- Mostajabi, A.; Finney, D.L.; Rubinstein, M.; Rachidi, F. Nowcasting lightning occurrence from commonly available meteorological parameters using machine learning techniques. Npj Clim. Atmospheric Sci. 2019, 2, 1–15. [Google Scholar] [CrossRef]
- Siingh, D.; Singh, R.P.; Singh, A.K.; Kulkarni, M.N.; Gautam, A.S.; Singh, A.K. Solar Activity, Lightning and Climate. Surv. Geophys. 2011, 32, 659–703. [Google Scholar] [CrossRef]
- Kunz, M. The skill of convective parameters and indices to predict isolated and severe thunderstorms. Nat. Hazards Earth Syst. Sci. 2007, 7, 327–342. [Google Scholar] [CrossRef]
- Goenka, R.; Taori, A.; Rao, G.S.; Chauhan, P. Leveraging INSAT-3D Indian Geostationary Satellite for Advanced Lightning Detection and Analysis. Geophys. Res. Lett. 2025, 52, e2024GL112764. [Google Scholar] [CrossRef]
- Helfer, K.C.; Nuijens, L.; de Roode, S.R.; Siebesma, A.P. How Wind Shear Affects Trade—Wind Cumulus Convection. J. Adv. Model. Earth Syst. 2020, 12, e2020MS002183. [Google Scholar] [CrossRef] [PubMed]
- Shi, Z.; Tan, Y.; Liu, Y.; Liu, J.; Lin, X.; Wang, M.; Luan, J. Effects of relative humidity on electrification and lightning discharges in thunderstorms. Terr. Atmos. Ocean. Sci. 2018, 29, 695–708. [Google Scholar] [CrossRef]


| Model Set | Probability Distribution | Label | Predictor Variable * | Predictions |
|---|---|---|---|---|
| Baseline models (Chen et al., 2021 [9]) | Normal error, constant variance | C1–C5 | Upper-air | Expected mean response |
| Linear model | Normal error, constant variance | N1–N2 | Upper-air | Expected mean response |
| N3–N13 | Near-surface | |||
| Gamma GLM | Gamma-distributed errors, variance proportional to mean | G1–G2 | Upper-air | Expected mean response, always positive |
| G3–G13 | Near-surface | |||
| Gamma Bayesian | Gamma distribution with full posterior uncertainty | B1–B2 | Upper-air | Full predictive distribution accounting for uncertainty |
| B3–B13 | Near-surface |
| Model Label | a | b | |
|---|---|---|---|
| C1 | a(CAPE × Pr)b | 4.441 ± 0.337 | 1.206 ± 0.069 |
| C2 | a(CAPE × Pr)b | 15.090 ± 4.596 | 0.794 ± 0.066 |
| C3 | a(CAPE × Pr) | 32.753 ± 2.565 | NA * |
| C4 | Non-parametric model | NA | NA |
| C5 | Ensemble mean | NA | NA |
| Model Label | 1 | a | b | c | d | e | f | g |
|---|---|---|---|---|---|---|---|---|
| N1 | a + b × CAPE | 0.335 ± 0.009 | 0.117 ± 0.009 | NA 2 | NA | NA | NA | NA |
| N2 | a + b × (CAPE × Pr) | 0.335 ± 0.009 | 0.111 ± 0.009 | NA | NA | NA | NA | NA |
| N3 | a + b × RH | 0.335 ± 0.009 | −0.089 ± 0.009 | NA | NA | NA | NA | NA |
| N4 | a + b × Rsds | 0.335 ± 0.009 | 0.114 ± 0.009 | NA | NA | NA | NA | NA |
| N5 | a + b × T | 0.335 ± 0.009 | 0.095 ± 0.009 | NA | NA | NA | NA | NA |
| N6 | a + b × Ps | 0.335 ± 0.010 | −0.018 ± 0.010 | NA | NA | NA | NA | NA |
| N7 | a + b × Pr | 0.335 ± 0.010 | −0.024 ± 0.010 | NA | NA | NA | NA | NA |
| N8 | a + b × U10 | 0.335 ± 0.009 | −0.075 ± 0.009 | NA | NA | NA | NA | NA |
| N9 | a + b × Rsds + c × T | 0.335 ± 0.009 | 0.089 ± 0.010 | 0.044 ± 0.010 | NA | NA | NA | NA |
| N10 | a + b × Rsds + c × T + d × RH | 0.335 ± 0.009 | 0.082 ± 0.011 | 0.035 ± 0.012 | −0.021 ± 0.012 | NA | NA | NA |
| N11 | a + b × Rsds + c × T + d × RH + e × U10 | 0.335 ± 0.008 | 0.087 ± 0.011 | 0.014 ± 0.012 | −0.020 ± 0.011 | −0.056 ± 0.009 | NA | NA |
| N12 | a + b × Rsds + c × T + d × RH + e × U10 + f × Pr | 0.335 ± 0.008 | 0.130 ± 0.011 | 0.001 ± 0.011 | −0.060 ± 0.012 | −0.053 ± 0.008 | 0.095 ± 0.011 | NA |
| N13 | a + b × Rsds + c × T + d × RH + e × U10 + f × Pr + g × Ps | 0.335 ± 0.008 | 0.113 ± 0.011 | 0.052 ± 0.013 | −0.027 ± 0.012 | −0.068 ± 0.008 | 0.069 ± 0.011 | −0.071 ± 0.010 |
| Model Label | Functional Form for E[rs] 1 | a | b | c | d | e | f | g |
|---|---|---|---|---|---|---|---|---|
| G1 | exp(a + b × CAPE) | −1.168 ± 0.028 | 0.444 ± 0.028 | NA 2 | NA | NA | NA | NA |
| G2 | exp(a + b × CAPE × Pr) | −1.153 ± 0.029 | 0.369 ± 0.029 | NA | NA | NA | NA | NA |
| G3 | exp(a + b × RH) | −1.130 ± 0.027 | −0.267 ± 0.027 | NA | NA | NA | NA | NA |
| G4 | exp(a + b × Rsds) | −1.151 ± 0.026 | 0.337 ± 0.026 | NA | NA | NA | NA | NA |
| G5 | exp(a + b × T) | −1.141 ± 0.027 | 0.332 ± 0.027 | NA | NA | NA | NA | NA |
| G6 | exp(a + b × Ps) | −1.096 ± 0.029 | −0.060 ± 0.029 | NA | NA | NA | NA | NA |
| G7 | exp(a + b × Pr) | −1.097 ± 0.029 | −0.067 ± 0.029 | NA | NA | NA | NA | NA |
| G8 | exp(a + b × U10) | −1.121 ± 0.028 | −0.236 ± 0.028 | NA | NA | NA | NA | NA |
| G9 | exp(a + b × Rsds + c × T) | −1.164 ± 0.026 | 0.246 ± 0.032 | 0.195 ± 0.032 | NA | NA | NA | NA |
| G10 | exp(a + b × Rsds + c × T + d × RH) | −1.164 ± 0.026 | 0.244 ± 0.033 | 0.193 ± 0.035 | −0.004 ± 0.035 | NA | NA | NA |
| G11 | exp(a + b × Rsds + c × T + d × RH + e × U10) | −1.173 ± 0.026 | 0.256 ± 0.034 | 0.124 ± 0.037 | 0.000 ± 0.035 | −0.150 ± 0.028 | NA | NA |
| G12 | exp(a + b × Rsds + c × T + d × RH + e × U10 + f × Pr) | −1.197 ± 0.026 | 0.382 ± 0.037 | 0.077 ± 0.037 | −0.145 ± 0.038 | −0.150 ± 0.027 | 0.305 ± 0.035 | NA |
| G13 | exp(a + b × Rsds + c × T + d × RH + e × U10 + f × Pr + g × Ps) | −1.223 ± 0.024 | 0.324 ± 0.036 | 0.299 ± 0.042 | −0.017 ± 0.039 | −0.218 ± 0.027 | 0.214 ± 0.036 | −0.313 ± 0.032 |
| Model Label | Functional Form for α 1,3 | aα | bα | cα | dα | eα | fα | gα |
|---|---|---|---|---|---|---|---|---|
| B1 | aα + bα × CAPE | 2.631 ± 0.136 | 1.156 ± 0.104 | NA | NA | NA | NA | NA |
| B2 | aα + bα × (CAPE × Pr) | 2.474 ± 0.132 | 1.060 ± 0.108 | NA | NA | NA | NA | NA |
| B3 | aα + bα × RH | 1.860 ± 0.093 | 0.007 ± 0.013 | NA | NA | NA | NA | NA |
| B4 | aα + bα × Rsds | 2.108 ± 0.106 | 0.604 ± 0.059 | NA | NA | NA | NA | NA |
| B5 | aα + bα × T | 2.054 ± 0.106 | 0.549 ± 0.056 | NA | NA | NA | NA | NA |
| B6 | aα + bα × Ps | 1.699 ± 0.086 | 0.007 ± 0.014 | NA | NA | NA | NA | NA |
| B7 | aα + bα × Pr | 1.713 ± 0.085 | 0.120 ± 0.083 | NA | NA | NA | NA | NA |
| B8 | aα + bα × U10 | 1.818 ± 0.091 | 0.006 ± 0.012 | NA | NA | NA | NA | NA |
| B9 | aα + bα × Rsds + cα × T | 2.204 ± 0.115 | 0.103 ± 0.106 | 0.458 ± 0.106 | NA | NA | NA | NA |
| B10 | aα + bα × Rsds + cα × T + dα × RH | 2.208 ± 0.113 | 0.127 ± 0.115 | 0.503 ± 0.113 | 0.094 ± 0.120 | NA | NA | NA |
| B11 | aα + bα × Rsds + cα × T + dα × RH + eα × U10 | 2.390 ± 0.132 | 0.204 ± 0.128 | 0.394 ± 0.137 | 0.089 ± 0.130 | −0.186 ± 0.096 | NA | NA |
| B12 | exp(aα + bα × Rsds + cα × T + dα × RH + eα × U10 +fα × Pr) | 0.970 ± 0.050 | 0.276 ± 0.077 | 0.009 ± 0.085 | −0.144 ± 0.078 | −0.172 ± 0.057 | 0.303 ± 0.073 | NA |
| B13 | exp(aα + bα × Rsds + cα × T + dα × RH + eα × U10 +fα × Pr + gα × Ps | 1.096 ± 0.051 | 0.181 ± 0.080 | 0.174 ± 0.098 | 0.028 ± 0.088 | −0.265 ± 0.061 | 0.128 ± 0.077 | −0.281 ± 0.071 |
| Model Label | Functional Form for β 2,3 | aβ | bβ | cβ | dβ | eβ | fβ | gβ |
| B1 | aβ + bβ × CAPE | 7.552 ± 0.415 | 0.683 ± 0.282 | NA 4 | NA | NA | NA | NA |
| B2 | aβ + bβ × CAPE × Pr | 7.116 ± 0.411 | 0.654 ± 0.287 | NA | NA | NA | NA | NA |
| B3 | aβ + bβ × RH | 5.860 ± 0.331 | 1.291 ± 0.151 | NA | NA | NA | NA | NA |
| B4 | aβ + bβ × Rsds | 6.247 ± 0.355 | 0.020 ± 0.039 | NA | NA | NA | NA | NA |
| B5 | aβ + bβ × T | 6.080 ± 0.351 | 0.049 ± 0.088 | NA | NA | NA | NA | NA |
| B6 | aβ + bβ × Ps | 5.063 ± 0.298 | 0.295 ± 0.152 | NA | NA | NA | NA | NA |
| B7 | aβ + bβ × Pr | 5.141 ± 0.297 | 0.714 ± 0.284 | NA | NA | NA | NA | NA |
| B8 | aβ + bβ × U10 | 5.664 ± 0.325 | 1.212 ± 0.167 | NA | NA | NA | NA | NA |
| B9 | aβ + bβ × Rsds + cβ × T | 6.849 ± 0.394 | −1.282 ± 0.329 | 0.403 ± 0.344 | NA | NA | NA | NA |
| B10 | aβ + bβ × Rsds + cβ × T + dβ × RH | 6.880 ± 0.386 | −1.136 ± 0.354 | 0.706 ± 0.378 | 0.571 ± 0.360 | NA | NA | NA |
| B11 | aβ + bβ × Rsds + cβ × T + dβ × RH + eβ × U10 | 7.601 ± 0.469 | −1.138 ± 0.404 | 0.695 ± 0.458 | 0.559 ± 0.405 | 0.622 ± 0.325 | NA | NA |
| B12 | exp(aβ + bβ × Rsds + cβ × T + dβ × RH + eβ × U10 + fβ × Pr) | 2.163 ± 0.056 | −0.102 ± 0.083 | −0.052 ± 0.089 | 0.001 ± 0.094 | −0.020 ± 0.066 | 0.026 ± 0.083 | NA |
| B13 | exp(aβ + bβ × Rsds + cβ × T + dβ × RH + eβ × U10 + fβ × Pr + gβ×Ps) | 2.312 ± 0.056 | −0.132 ± 0.082 | −0.079 ± 0.105 | 0.085 ± 0.097 | −0.061 ± 0.069 | −0.087 ± 0.083 | −0.020 ± 0.083 |
Disclaimer/Publisher’s Note: The statements, opinions and data contained in all publications are solely those of the individual author(s) and contributor(s) and not of MDPI and/or the editor(s). MDPI and/or the editor(s) disclaim responsibility for any injury to people or property resulting from any ideas, methods, instructions or products referred to in the content. |
© 2025 by the authors. Licensee MDPI, Basel, Switzerland. This article is an open access article distributed under the terms and conditions of the Creative Commons Attribution (CC BY) license (https://creativecommons.org/licenses/by/4.0/).
Share and Cite
Uden, C.; Clemins, P.J.; Beckage, B. Predicting Lightning from Near-Surface Climate Data in the Northeastern United States: An Alternative to CAPE. Atmosphere 2025, 16, 1298. https://doi.org/10.3390/atmos16111298
Uden C, Clemins PJ, Beckage B. Predicting Lightning from Near-Surface Climate Data in the Northeastern United States: An Alternative to CAPE. Atmosphere. 2025; 16(11):1298. https://doi.org/10.3390/atmos16111298
Chicago/Turabian StyleUden, Charlotte, Patrick J. Clemins, and Brian Beckage. 2025. "Predicting Lightning from Near-Surface Climate Data in the Northeastern United States: An Alternative to CAPE" Atmosphere 16, no. 11: 1298. https://doi.org/10.3390/atmos16111298
APA StyleUden, C., Clemins, P. J., & Beckage, B. (2025). Predicting Lightning from Near-Surface Climate Data in the Northeastern United States: An Alternative to CAPE. Atmosphere, 16(11), 1298. https://doi.org/10.3390/atmos16111298


