Article

The Spatiotemporal Dynamics of Air Pollutants and the Universal Thermal Climate Index in 370 Chinese Cities

1
Aerospace Information Research Institute, Chinese Academy of Sciences, Beijing 100094, China
2
University of Chinese Academy of Sciences, Beijing 100049, China
3
Key Laboratory of Earth Observation of Hainan Province, Hainan Aerospace Information Research Institute, Sanya 572029, China
4
Ministry of Water Resources and Irrigation Egypt (MWRI), Giza 3855402, Egypt
5
Institute of Remote Sensing Satellite, China Academy of Space Technology, Beijing 100094, China
*
Author to whom correspondence should be addressed.
Atmosphere 2025, 16(11), 1263; https://doi.org/10.3390/atmos16111263
Submission received: 1 October 2025 / Revised: 31 October 2025 / Accepted: 3 November 2025 / Published: 5 November 2025
(This article belongs to the Section Air Quality)

Abstract

Outdoor thermal comfort is a critical determinant of urban livability and public health, particularly in the face of the increasing frequency and intensity of extreme weather events. While meteorological variables are well-established drivers of thermal stress, the influence of ambient air pollution on human thermal perception remains poorly understood and largely overlooked in urban climate research. To address this gap, this study investigates the multidimensional effects of six major air pollutants PM2.5, PM10, SO2, NO2, O3, and CO on the Universal Thermal Climate Index (UTCI) across 370 Chinese cities from 2020 to 2024. Using integrated spatiotemporal analysis, we found significant seasonal, diurnal, and climatic heterogeneity in pollutant–UTCI interactions. Our findings reveal that O3 and PM10 amplify thermal stress during summer daytime through photochemical heating and radiative forcing, whereas PM2.5 and CO reduce nocturnal heat loss in winter by trapping long-wave radiation, effectively acting as thermal insulators. These effects are further modulated by local climate: arid regions (e.g., Lanzhou) experience exacerbated O3-driven heat stress, while cold zones (e.g., Harbin) benefit from particulate-induced warming in winter. Meteorological factors serve as dual regulators; temperature and solar radiation directly elevate the UTCI, while wind and humidity govern pollutant dispersion and thus indirectly shape thermal comfort. This study not only advances the scientific understanding of air pollution’s role in urban thermal environments but also provides actionable, data-driven insights for climate-resilient urban planning, public health interventions, and integrated environmental policies that jointly address air quality and thermal comfort in rapidly urbanizing regions.

1. Introduction

In modern life, individuals increasingly prefer engaging in outdoor leisure activities across all seasons, leading to continual exposure to varying thermal environments. With the accelerating pace of urban development and the influence of global climate change, densely populated cities are experiencing intensified urban heat island effects and a growing frequency of extreme urban weather events [1]. Over the past thirty years, outdoor thermal comfort has emerged as a critical metric in assessing the quality and sustainability of urban environments, attracting increasing academic and practical interest [2]. To meet growing interdisciplinary needs, the Universal Thermal Climate Index (UTCI) was developed by integrating core environmental variables to assess thermal stress more effectively [3]. However, thermal comfort perception is not only determined by ambient environmental parameters but also shaped by individual acclimatization processes, behavioral adaptations, and culturally embedded expectations regarding thermal environments [4]. Studies across European cities revealed the seasonal dynamics of thermal neutrality, suggesting that both physiological and psychological adaptation play key roles in shaping neutral temperature preferences throughout the year [5]. Comparative research has further revealed substantial spatial variability in comfort thresholds, with Physiologically Equivalent Temperature (PET) ranges differing notably across climatic and cultural contexts [6,7]. In response to such disparities, various index calibration approaches have been developed to account for regional and population-specific characteristics [8]. Further work evaluated the predictive performance of PET and similar indices [9,10], though some showed limited accuracy. This study aims to advance the understanding of outdoor thermal comfort by investigating how major urban air pollutants modulate UTCI levels across China.
In China, rapid industrialization has contributed to highly heterogeneous air pollution patterns [11,12], characterized by complex interactions between particulate and gaseous pollutants [13]. In recent decades, alongside increasing interest in outdoor thermal comfort, researchers have begun to pay closer attention to its complex interactions with urban air quality. These two atmospheric dimensions—thermal environment and air pollution—not only coexist but also influence each other through a series of physical and chemical processes. For instance, elevated air temperatures and strong solar radiation can enhance atmospheric turbulence and deepen the boundary layer, thereby facilitating the vertical dispersion of pollutants [14]. Conversely, lower concentrations of particulate matter (PM) reduce the scattering of solar radiation back into space, allowing more solar energy to reach urban surfaces and potentially intensify thermal stress [15]. Moreover, intense solar radiation and high temperatures accelerate photochemical reactions, contributing to the formation of secondary pollutants such as ozone [16]. It is worth noting that due to the enhanced photochemical activity, the concentration of ground-level O3 tends to rise in warmer months, indicating a clear seasonal interaction between thermal conditions and the formation of secondary pollutants [17]. These findings underscore the bidirectional feedbacks between air pollution and urban thermal dynamics. Current research has laid a strong foundation for understanding micro-level interactions, but broader-scale, long-term studies remain limited, particularly in quantifying how these feedbacks shape outdoor thermal comfort under diverse environmental conditions.
Beyond these physical linkages, growing evidence suggests that air pollution and thermal comfort are jointly influenced by urban form, population density, and anthropogenic activities. Some studies have focused on indoor conditions, examining how specific building features—such as air purifiers, wind catchers, or solar chimneys—affect both thermal perception and indoor air quality [18,19]. In contrast, research on outdoor settings has increasingly considered how urban form and green infrastructure shape both thermal and air quality outcomes. For example, Rui et al. and Yilmaz et al. investigated how landscape elements and urban morphology impacted outdoor thermal comfort and pollutant dispersion in cities like Nanjing and Erzurum [20,21]. In the southeastern United States, Fahad et al. proposed a geospatial framework integrating outdoor thermal comfort and air quality indices to assess environmental health risks [22]. Miao et al. further compared tree-covered and open sites, finding that vegetated areas exhibited lower PM concentrations during hot summer conditions [23]. While these studies have significantly contributed to understanding the co-evolution of thermal and pollution conditions in urban spaces, most remain localized or limited in scale, often focusing on specific neighborhoods, microclimates, or architectural interventions. Few have approached the issue from a large-scale, data-driven, and multidimensional perspective that systematically quantifies the dynamic coupling between thermal comfort and air quality across broad spatial and temporal domains.
This study investigates how atmospheric chemical pollutants interact with outdoor thermal comfort under varying spatiotemporal conditions across China. Specifically, we aim to address three core research questions: (1) What are the overall impacts of major air pollutants on the UTCI across multiple temporal scales (diurnal to seasonal) and spatial contexts (national to climate zone level)? (2) To what extent do key meteorological variables—such as air temperature, humidity, wind speed, and solar radiation—influence or regulate these pollutant–thermal comfort interactions? (3) What are the underlying mechanisms through which pollutants exert synergistic or antagonistic effects on thermal comfort, and how do these mechanisms vary across time and space? The findings support the development of adaptive, region-specific environmental health strategies, aligning with Sustainable Development Goals for good health and well-being (SDG 3) and sustainable cities and communities (SDG 11) [24,25].

2. Materials and Methods

2.1. Study Area

This study focuses on the geographical scope of mainland China, which spans a vast area with diverse climatic conditions, topographical features, and ecological environments. To systematically analyze spatial differences in thermal comfort and air quality, the Köppen climate classification system [26] was adopted to categorize China. The classification was performed based on long-term meteorological data, including monthly mean air temperature and precipitation, obtained from China Meteorological Administration. According to the standard Köppen climate classification system, the entire territory of China was divided into four major climate zones using ArcGIS 10.8, with the distinguishing features of each zone summarized in Table 1.
A distribution map of these four climate zones across China based on the Köppen classification is presented in Figure 1. This figure also highlights the representative cities used for climate regional analysis with red markings.

2.2. Universal Thermal Climate Index

The UTCI is a widely used biometeorological index designed to evaluate outdoor thermal comfort based on the physiological response of the human body to atmospheric conditions. The UTCI is calculated based on a multi-node model of human thermoregulation and requires the following four core meteorological variables as input: (1) air temperature, (2) Mean Radiant Temperature (which encompasses the radiative effects of the sun and surrounding surfaces), (3) wind speed (at 10 m height, adjusted to the human height level), and (4) relative humidity.
In this study, gridded UTCI data were obtained from the thermal comfort indices derived from the ERA5 reanalysis dataset, provided by the Copernicus Climate Data Store (CDS) [https://cds.climate.copernicus.eu]. The data are based on ERA5 hourly reanalysis and offer global coverage at a horizontal resolution of 0.25° × 0.25°. For our analysis, we extracted daily mean UTCI values across mainland China from June to August (summer) and from December to February (winter) during the period 2020–2024.

2.3. Air Quality Data

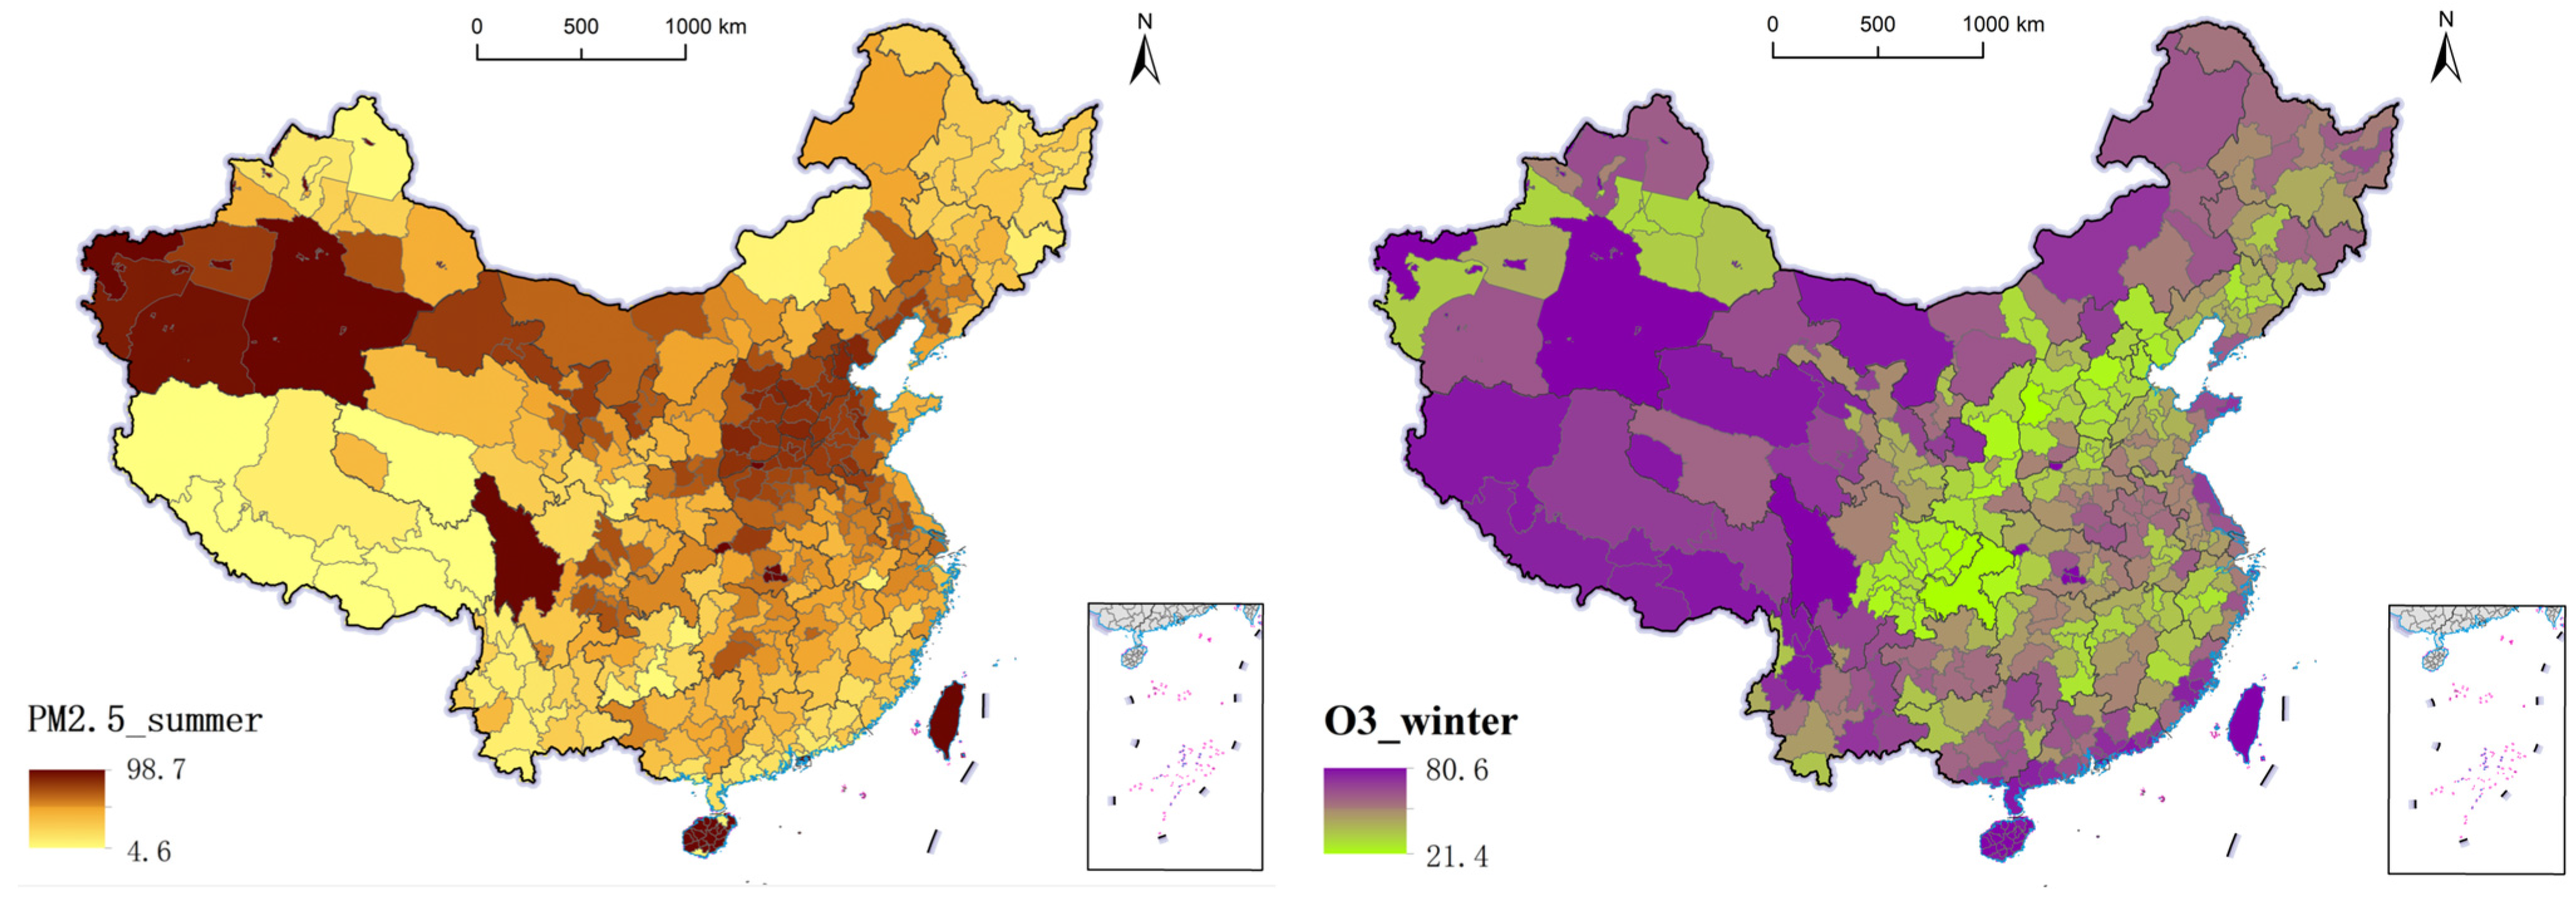
The air quality data used in this study were obtained from the publicly available platform maintained by Quotsoft, which compiles and archives hourly air pollution observations originally released by the China National Environmental Monitoring Center (CNEMC). The dataset includes six major air pollutants: fine particulate matter (PM2.5), inhalable particulate matter (PM10), sulfur dioxide (SO2), nitrogen dioxide (NO2), ozone (O3), and carbon monoxide (CO). These pollutants are reported in micrograms per cubic meter (μg/m3), depending on the compound, and follow the national ambient air quality monitoring standards (GB 3095–2012) [27]. The data were stored in daily CSV files, each containing hourly air quality records from urban monitoring stations across China. For consistency and analytical purposes, the data were processed to obtain hourly pollutant concentrations at the prefecture-level city scale. Missing values were imputed using interpolation based on data from other stations in the same city during the same period. Figure 2 presents the distribution of PM2.5 in summer and O3 in winter across the country, averaged over the entire study period (2020–2024).

2.4. Meteorological Data

The meteorological data used in this study were derived from the ERA5 hourly reanalysis dataset provided by the European Centre for Medium-Range Weather Forecasts (ECMWF) via the Copernicus Climate Data Store (https://cds.climate.copernicus.eu/). ERA5 provides high-resolution atmospheric parameters at a spatial resolution of 0.25° × 0.25° and an hourly temporal resolution, covering the period from 1940 to the present. For this study, five key meteorological variables were extracted from 2020 to 2024: 2 m air temperature (°C), downward short-wave radiation (W/m2), downward long-wave radiation (W/m2), 10 m wind components (u and v, m/s), and 2 m dew point temperature (°C).
Wind speed (m/s) was calculated from the 10 m u- and v-components of wind [28] using the following equation:
Wind   =   u 2   +   v 2
Relative humidity ( R H , %) was derived from the 2 m air temperature ( T , °C) and dew point temperature ( T d , °C) [29] using the following empirical formulation based on the August–Roche–Magnus equation:
RH   =   100     exp ( 17.625     T d 243.04   +   T d ) exp ( 17.625     T 243.04   +   T )
All the data were spatially processed using ArcGIS software. netCDF data were converted to raster format and spatially clipped to the geographical scope of China, and then the mean value of all raster cells within each prefecture-level city’s administrative boundary was calculated for each hourly time step. The processed variables were then used to analyze the interactions between meteorological conditions and air quality.

2.5. XGBoost Regression Modeling

Given the complex, nonlinear relationships between thermal comfort and its environmental drivers, the eXtreme Gradient Boosting (XGBoost) algorithm was selected due to its superior performance in handling high-dimensional, heterogeneous datasets and its robustness against multicollinearity and missing data. The input features used in the XGBoost model included both air quality indicators and meteorological variables (Table 2). To account for temporal heterogeneity, the dataset was stratified by diurnal period—daytime (solar radiation > 0) and nighttime (solar radiation = 0)—and by seasonal windows: summer (June–August) and winter (December–February). Independent models were trained at the city level under each temporal setting to better capture nonlinear and context-specific interactions between thermal comfort and its predictors.
The XGBoost regression model optimizes an additive objective function using a regularized gradient boosting framework [30]. The model prediction at step t, denoted by y i ^ ( t ) , is updated as follows:
y i ^ ( t ) =   y i ^ ( t   1 )   +   f t ( x i ) ,   f t     F
where x i is the feature vector of instance i,  f t is the decision tree added at iteration t, and F is the space of regression trees.
Model hyperparameters (e.g., learning rate, maximum tree depth, subsample ratio) were tuned via grid search and 5-fold cross-validation, with performance evaluated using the coefficient of determination (R2) and root mean square error (RMSE). This modeling framework allows us to assess how the UTCI responds to both pollutant levels and meteorological variables and to explore regional differences across climate zones and diurnal/seasonal contexts.

2.6. SHAP Model Interpretation

To interpret the contributions of individual predictors to UTCI estimation, we employed SHapley Additive exPlanations (SHAP), a unified framework grounded in cooperative game theory that attributes the model output to each feature [31]. Specifically, for each trained XGBoost model, we conducted both global and local interpretability analyses.
Global Interpretability: We computed the mean absolute SHAP values across all samples to quantify the overall importance of each feature in UTCI prediction. This approach enables the ranking of features by their average marginal contribution to the model’s output [32].
Climate Zone-Specific Local Interpretation: To further investigate spatial heterogeneity, we conducted single-point SHAP analyses for representative cities selected from distinct Köppen climate zones. Cities were chosen based on their geographic representativeness and data completeness. For each selected city, individual SHAP value decompositions were visualized using waterfall plots, allowing us to interpret the magnitude and direction of each feature’s contribution to a specific UTCI prediction [33]. This method is especially useful for identifying the dominant drivers of thermal discomfort in different climatic contexts.
Interaction and Dependence Analysis: To explore nonlinear and synergistic effects among features (e.g., between O3 and temperature), we generated SHAP dependence and interaction plots. These visualizations help reveal complex feature relationships that influence thermal comfort beyond marginal effects [34].
The SHAP value for feature i in prediction f(x) is computed as follows:
i   =   S F \ { i } | S | ! ( | F | | S | 1 ) ! | F | ! [ f S { i } ( x )     f s ( x ) ]
where F is the set of all features, and S is a subset of features excluding and denotes the model prediction when only features in S are used. This formulation ensures fair and consistent feature attribution.
The total number of samples (city-day observations) available for modeling varied across the four spatiotemporal conditions. Each subset was independently partitioned into training and testing sets using a consistent 80:20 ratio. The sample sizes for each condition are summarized in Table 3.

3. Results

3.1. Thermal Comfort and Extreme Weather Analysis

3.1.1. Summer Thermal Conditions

The spatial distribution of the average UTCI during summer (June to September) from 2020 to 2024 across China is illustrated in Figure 3. Substantial regional heterogeneity is observed, with the mean UTCI values ranging from 5.3 °C to 31.7 °C at the city level. Higher thermal stress was concentrated in the eastern, central, and southern regions, while cooler conditions were mainly found in the western inland and high-altitude areas. Correspondingly, the national average UTCI for each summer exhibited a slight but consistent upward trend, increasing from 24.9 °C in 2020 to 26.0 °C in 2024, despite minor fluctuations in 2022 and 2023. This trend indicates a gradual intensification of summer thermal conditions across China over the five-year period, leading to higher baseline thermal discomfort.
The cumulative hours and evolution of strong thermal stress events (defined as hourly UTCI ≥ 32 °C) further support this observation [35]. The spatial distribution of such events reveals widespread exposure in many cities, with the most affected areas accumulating up to 4889 h over five summers. These hotspots were mainly located in the eastern and central parts of the country, where high population density and urban heat island effects may contribute to elevated thermal stress. Nationally, the total number of extreme heat events increased from 156,384 h in 2020 to 166,769 h in 2024, with pronounced peaks in 2020 (194,313 h) and 2022 (191,861 h).

3.1.2. Winter Thermal Conditions

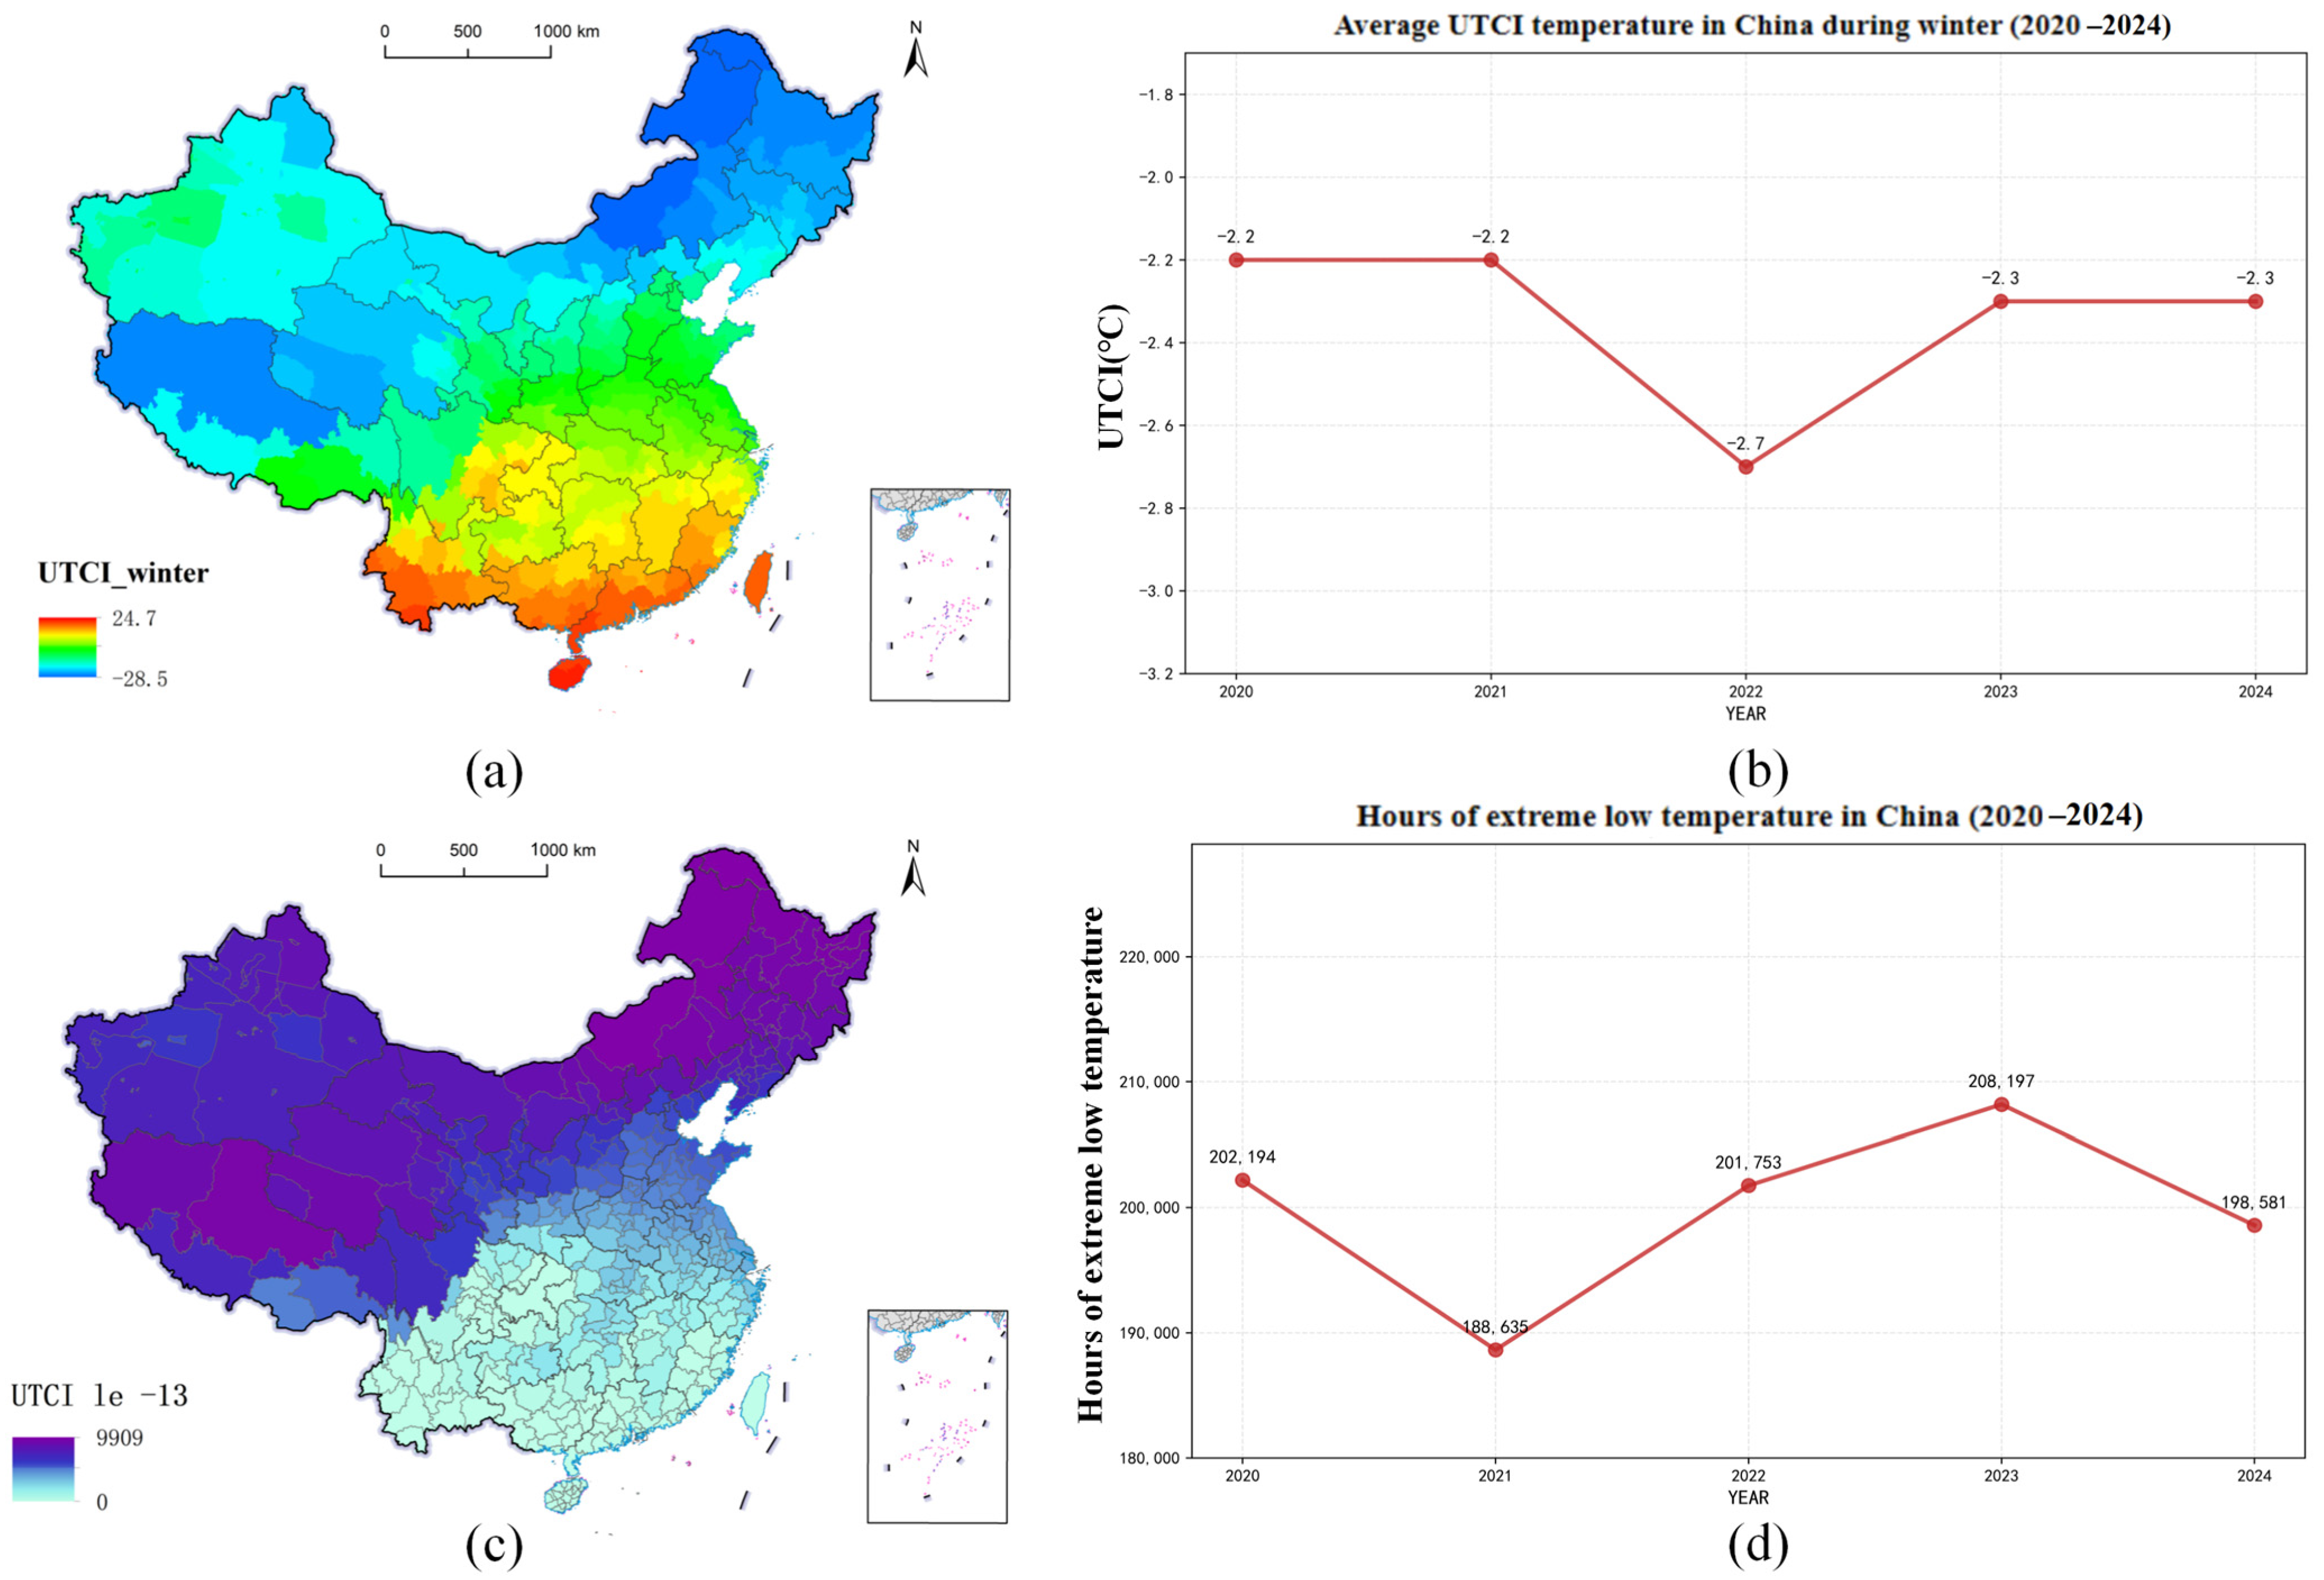
As shown in Figure 4, during winter (December to February) from 2020 to 2024, the spatial distribution of the UTCI across China exhibited strong regional contrasts, with average values ranging from −28.5 °C in the coldest areas to 24.7 °C in the warmest southern regions. The national average winter UTCI demonstrated limited interannual variability, fluctuating within a 0.5 °C range. For example, it reached its lowest value of −2.7 °C in 2022 but returned to −2.3 °C in both 2023 and 2024. The overall stability is evidenced by four of the five years falling within a much tighter 0.1 °C range (−2.3 °C to −2.2 °C), with 2022 being the sole outlier, indicating limited interannual variability in overall winter thermal comfort. In contrast, the frequency of extreme cold stress events (UTCI ≤ −13 °C) showed notable spatial concentration in northern and western regions and considerable temporal variation. While some cities experienced nearly 10,000 h of extreme cold during the study period, others recorded none. Nationally, the annual occurrence of extreme cold events varied between 188,635 and 208,197 h, without a clear upward or downward trend, suggesting that wintertime thermal extremes are influenced more by short-term climatic fluctuations than by long-term systematic change.

3.2. Contributions of Air Pollutants to UTCI

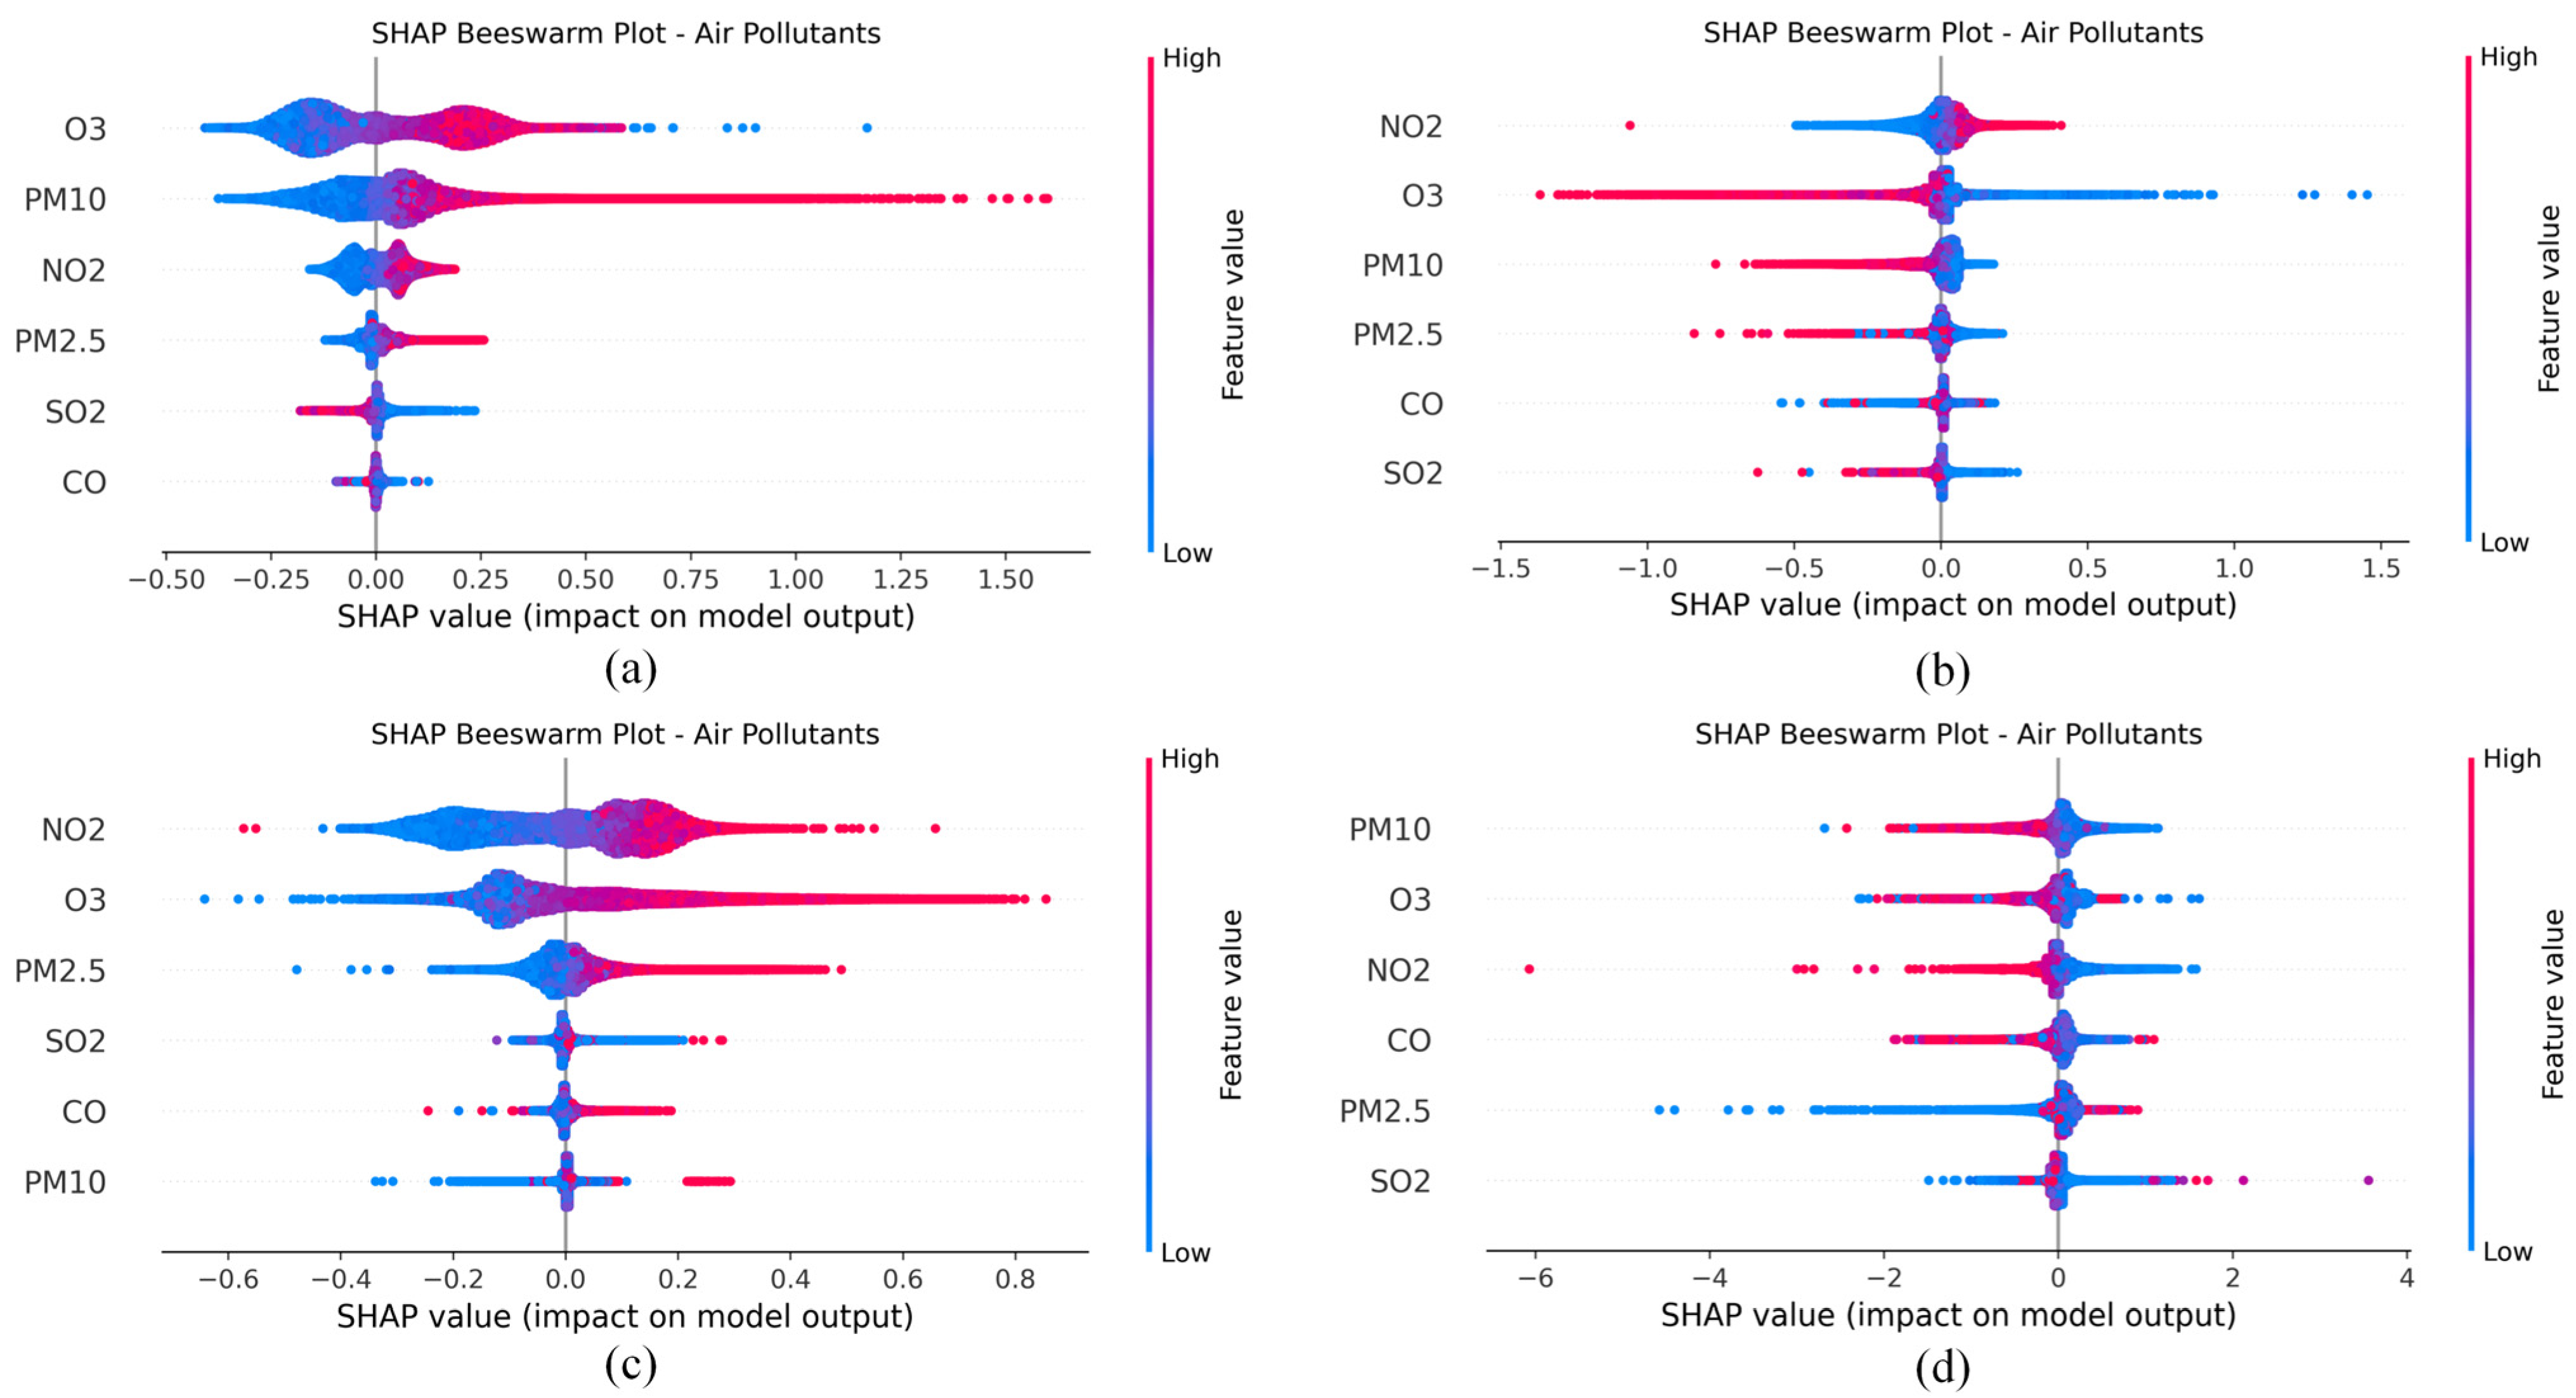
To explore how different air pollutants contribute to the UTCI under varying environmental conditions, SHAP beeswarm plots were generated for four distinct scenarios: summer daytime, summer nighttime, winter daytime, and winter nighttime (Figure 5). These plots visualize the relative importance and directionality of feature contributions across all samples, with feature values color-coded to distinguish high (red) and low (blue) pollutant concentrations. The SHAP value on the x-axis indicates each feature’s marginal impact on UTCI prediction. The model interpretation shown here is supported by the quantitative performance metrics summarized in Table 4, which reports the R2 and RMSE values achieved by the trained models. These results confirm the reliability of the model predictions underlying the SHAP analysis.
In summer daytime, O3 emerged as the dominant contributor: high-concentration O3 (red) exhibited a broad SHAP distribution strongly skewed toward positive values, indicating a persistent enhancement in thermal stress. PM10 followed, with the increase in concentration (red) extending to the positive SHAP range, indicating the intensification of the UTCI by particulate matter during the summer daytime. PM2.5 displays a moderate positive bias at high values (red), contributing to an increased UTCI albeit with a narrower distribution than PM10. NO2 showed a more symmetric SHAP spread around zero, implying context-dependent effects with both weak positive and negative contributions. In contrast, SO2 and CO exerted minimal impact, with SHAP values tightly clustered near zero, indicating their negligible role in modulating daytime thermal comfort. Collectively, these patterns highlight the synergistic warming effect of elevated O3 and particulate matter (PM10, PM2.5) on the summer daytime UTCI, while other pollutants play a subordinate role.
In contrast to the daytime scenario, the summer nighttime SHAP plot revealed a directional reversal in the effect of key pollutants. For O3, high-concentration values (red) predominantly occupied the negative SHAP range, signifying a cooling effect on the UTCI, while low-concentration O3 (blue) exhibited mild positive contributions. PM10 and PM2.5 followed a parallel pattern: elevated concentrations (red) align with negative SHAP values, indicating their role in mitigating thermal stress at night, a stark contrast to their daytime warming effect. The distribution of NO2 is roughly symmetrical around zero, but the high concentrations of NO2 (in the red part) tend to have negative SHAP values, indicating that it has a suppressive effect that is dependent on environmental conditions. The influence of CO and SO2 is negligible, with their SHAP values closely clustered around zero, reflecting that their importance decreases in the absence of solar radiation. Overall, these patterns highlight this complex diurnal variation pattern: heat pollutants intensify during the day but become alleviated during the night.
During winter daytime, the SHAP beeswarm plot revealed distinct pollutant impacts on the UTCI, diverging from summer dynamics. O3 exhibited a strong positive skew in SHAP values at high concentrations (red), consistently amplifying thermal stress. NO2 demonstrated a broad distribution spanning both positive and negative ranges, with high-concentration values (red) leaning toward positive contributions, indicative of context-dependent effects. PM2.5 showed a clear positive bias at high concentrations (red), though its SHAP range was narrower than in summer, suggesting a persistent yet moderated warming influence. CO emerged as a more prominent contributor compared to summer, with high-concentration values (red) displaying marked positive SHAP values, highlighting its increased relevance. In contrast, PM10 and SO2 remained minimally impactful, with their SHAP values tightly clustered around zero, underscoring their subordinate role in modulating winter daytime thermal comfort.
The SHAP beeswarm plot for winter nighttime revealed the weakest overall pollutant influence on the UTCI, consistent with stable nocturnal boundary layers. CO exhibited the broadest SHAP distribution: high-concentration values (red) extended into both the positive and negative ranges, indicating substantial effect heterogeneity. O3 demonstrated a nearly symmetric distribution around zero, reflecting limited regulatory impact. PM2.5 and NO2 showed mild negative skews at high concentrations (red), suggesting a weak association with a reduced nighttime UTCI. PM10 maintained a narrow, centered distribution, while SO2’s sparse, scattered points indicated negligible influence. Collectively, these patterns underscored the diminished and heterogeneous pollutant–UTCI interactions during winter nights, likely driven by reduced radiative exchange and stable atmospheric conditions.
The SHAP analysis revealed significant seasonal and diurnal differences in the interaction between pollutants and the UTCI. In different seasons, pollutants in summer exhibited a strong and directionally specific heat regulation effect, while the impact in winter was more moderate and varied depending on the specific circumstances. Notably, during winter nights characterized by stable boundary layers, the pollutant–UTCI interaction emerged as the weakest and most heterogeneous. These patterns collectively highlighted the complex, time-varying roles of air pollutants in modulating thermal comfort across seasonal and diurnal cycles.

3.3. SHAP-Based Interpretation Across Climate Zones

Under the Köppen climate classification, China encompasses different climate zones where air pollutants’ impacts on the UTCI vary significantly across seasonal, diurnal, and regional meteorological contexts. To systematically reveal these specific interactions, we selected representative cities for four major Köppen types in China: Guangzhou (type A), Lanzhou (type B), Chengdu (type C), and Harbin (type D). These cities were chosen not only based on their distinct climatic characteristics but also for their geographic distribution, urbanization level, and data completeness, thereby serving as prototypical examples of each climate zone.
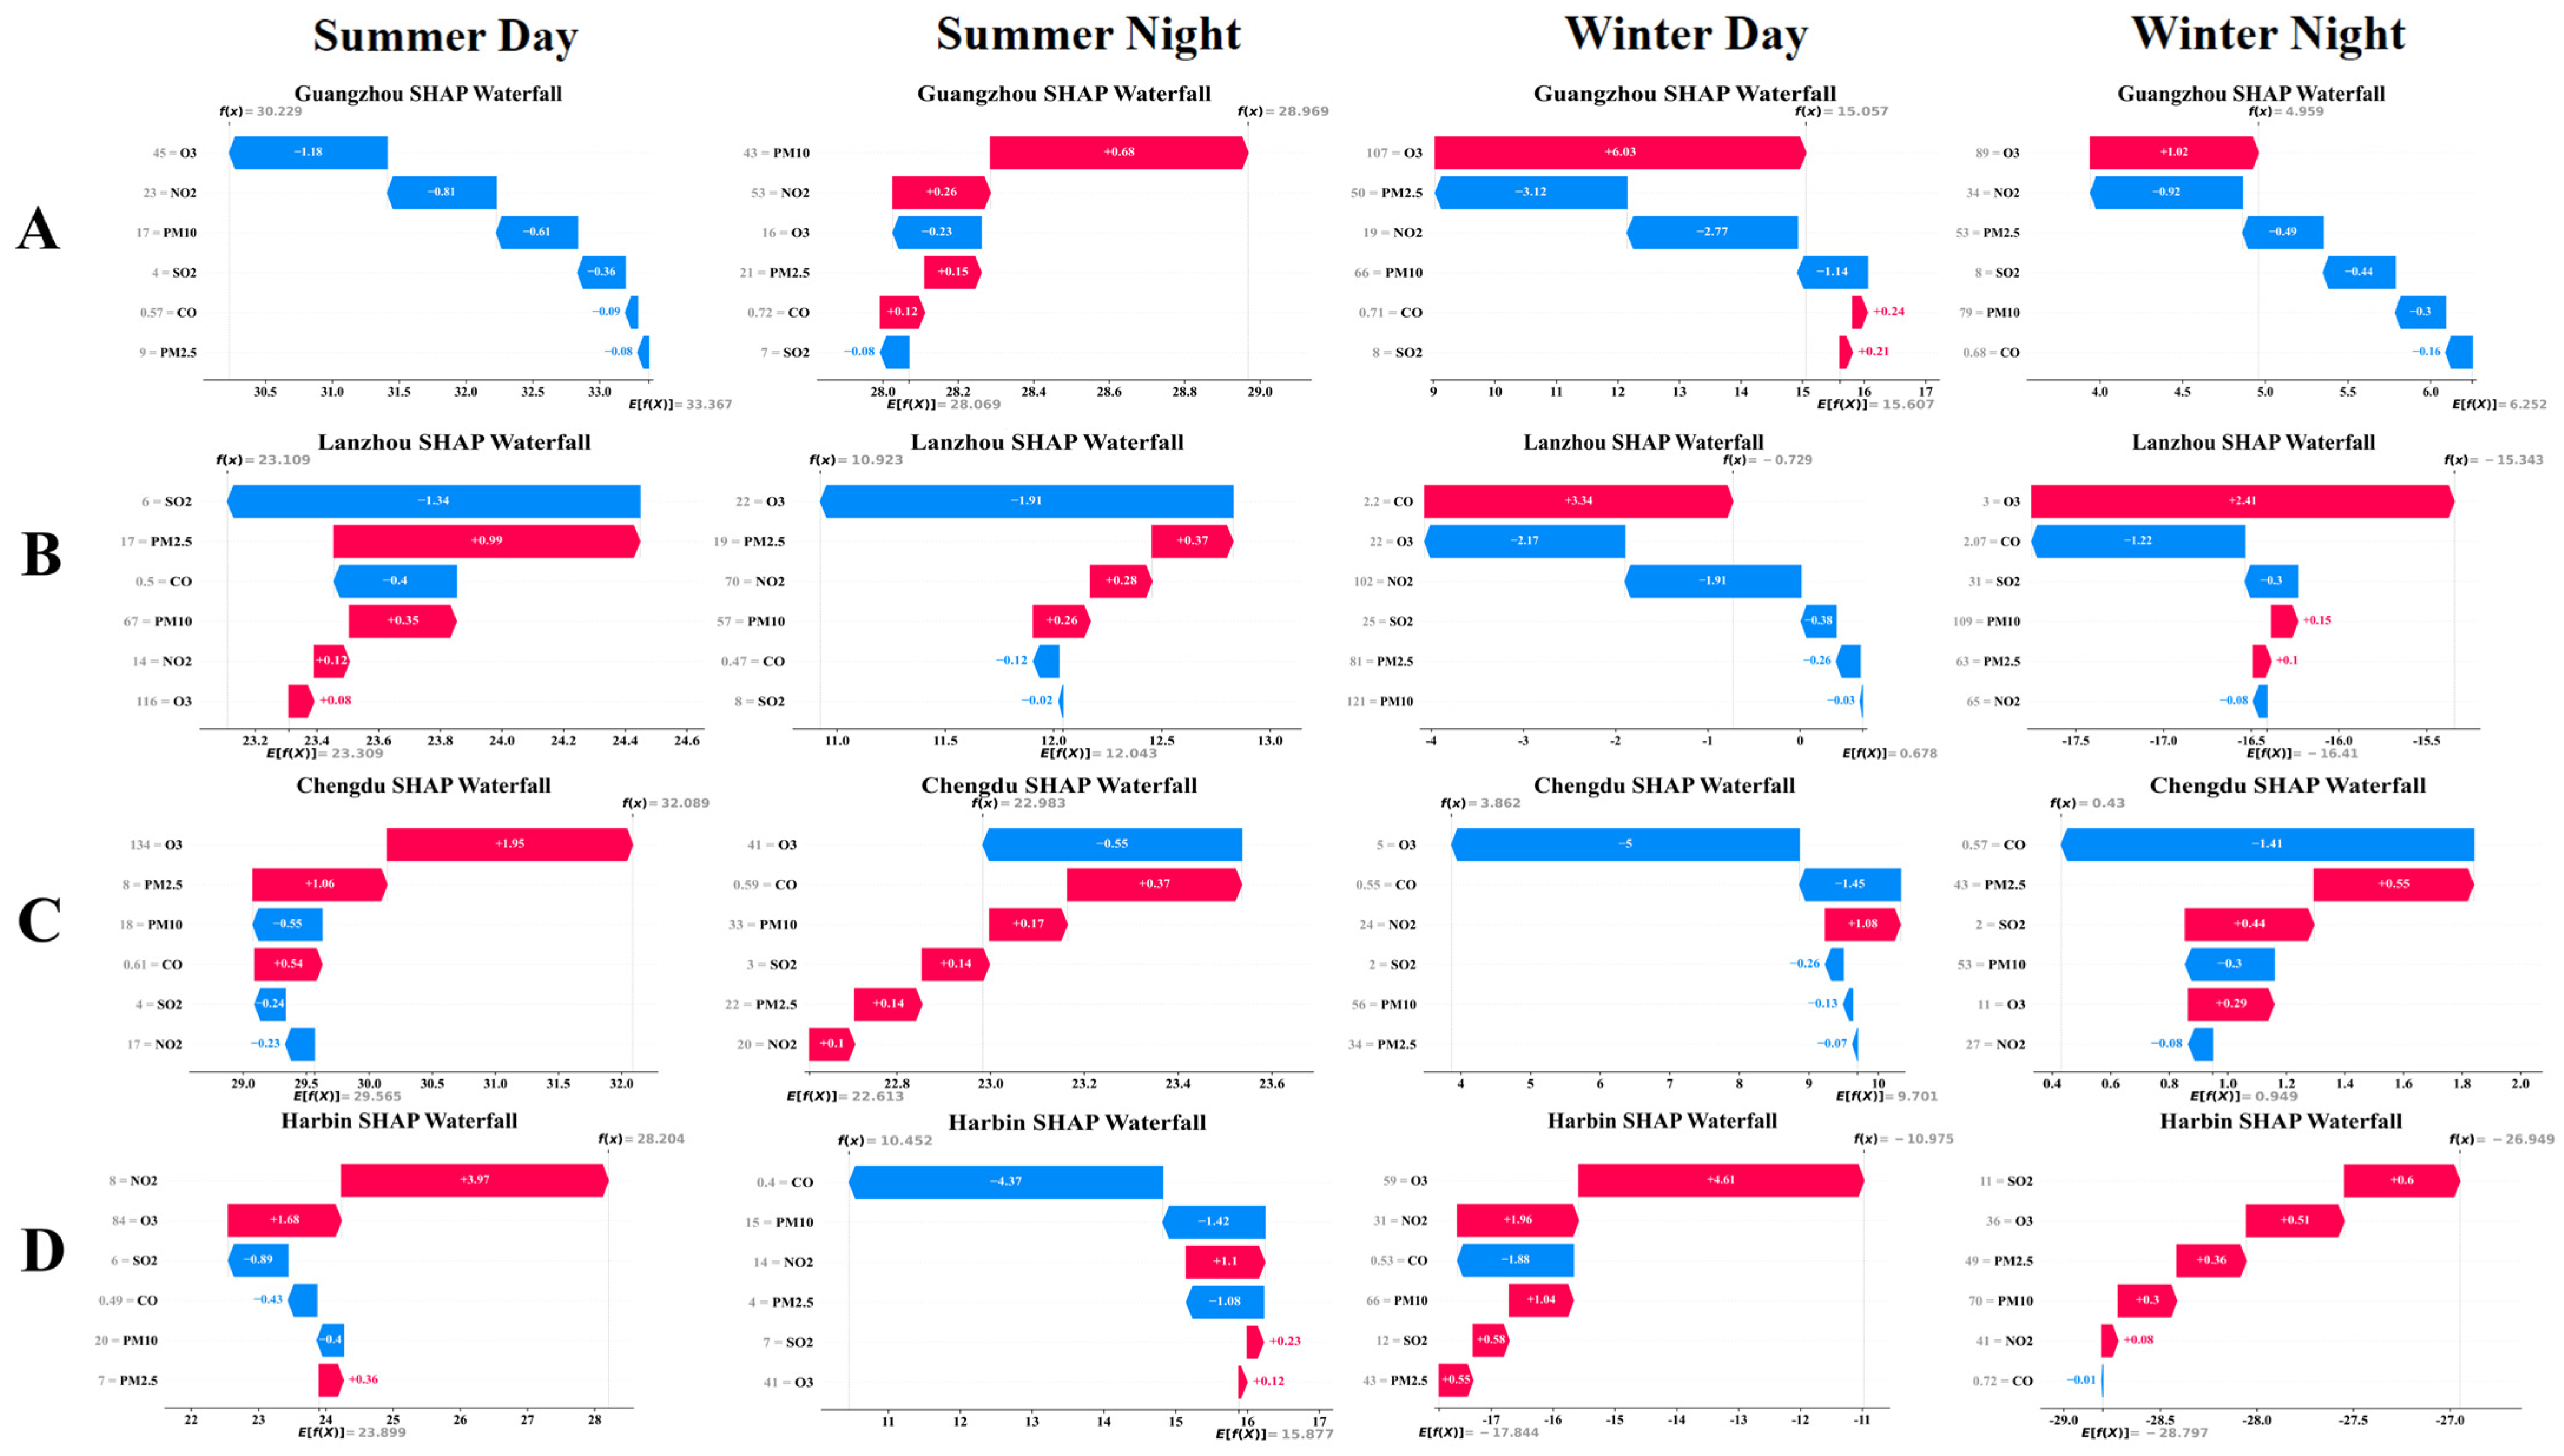
While our broader model framework encompasses over 300 cities nationwide, this focused SHAP-based analysis enables a more interpretable and mechanistic understanding of pollutant–thermal comfort interactions within well-defined climatic contexts. This city-level analysis complements large-scale statistical modeling by offering in-depth insight into region-specific driving factors, which is crucial for localized policy formulation. Using SHAP waterfall plots, we quantified the direction (warming or cooling) and magnitude of each pollutant’s contribution to UTCI predictions, relative to the model’s average output ( E [ f ( X ) ] ). This method reveals how pollutants modulate thermal comfort across seasonal and diurnal scales. The following analysis dissects these patterns for the four cities, as illustrated in Figure 6. The reliability of these city-specific interpretations is underpinned by the robust performance of the predictive models, with detailed R2 and RMSE metrics for each model type provided in Table 5.
For Guangzhou (Köppen climate type A), for summer daytime, the model’s average prediction ( E [ f ( X ) ] ) was 33.367, while the target sample’s UTCI ( f ( x ) ) reached 30.229, lower than the average. All pollutants (O3, NO2, PM10, SO2, CO, PM2.5) exhibited negative contributions, with O3 (45 μg/m3) showing the largest reduction (−1.18). This suggested that pollutants, especially O3 and particulates, cooled the environment via solar radiation scattering or photochemical interactions under strong daytime solar radiation. During summer nights, the average prediction (28.069) was exceeded by the target’s UTCI (28.969). PM10 (43 μg/m3, +0.68) and NO2 dominated warming, likely due to thermal inversion trapping pollutants and enhancing long-wave radiation retention. In contrast, O3 (16 μg/m3, −0.23) contributed to cooling as its photochemical production declined at night. In contrast to B-type or D-type climates, Guangzhou’s elevated night humidity may further support pollutant heat-trapping, intensifying nocturnal warming. For winter daytime, the average (15.607) was higher than the target’s UTCI (15.057). O3 (107 μg/m3, +6.03) exerted a strong warming effect, likely via its greenhouse effect under stable winter conditions. However, PM2.5 (50 μg/m3, −3.12) and NO2 counteracted this by scattering weak solar radiation, leading to net cooling. On winter nights, the target’s UTCI (4.959) fell below the average (6.252). O3 (89 μg/m3, +1.02) provided limited warming, but NO2 (34 μg/m3, −0.92) and particulates dominated cooling. Their accumulation under thermal inversion failed to retain heat, possibly due to low humidity or wind, resulting in a net UTCI reduction.
For Lanzhou (Köppen climate type B), in summer daytime, the predicted UTCI (23.109) was slightly lower than the average (23.309). SO2 (6 μg/m3) delivered the largest negative contribution (−1.34), while PM2.5 (17 μg/m3, +0.99) and PM10 (67 μg/m3, +0.35) acted as prominent warming factors. In sharp contrast to the tropical climate of Guangzhou, the arid environment of Lanzhou intensifies the impact of gases like SO2, whose strong radiative effects are less obscured by atmospheric moisture. On summer nights, the UTCI (10.923) dropped significantly below the average (12.043). O3 (22 μg/m3) made a substantial negative contribution (−1.91), serving as the dominant cooling force. Although PM2.5 (+0.37), NO2 (+0.28), and PM10 (+0.26) contributed to warming, their combined positive effects were vastly overshadowed by O3’s powerful cooling. Unlike humid A-type climates, the dry B-type night air restricts the accumulation of long-wave radiation, which makes the consumption of O3 at night the dominant factor in cooling. As for winter daytime, the UTCI (−0.729) was far lower than the average (0.678). CO (2.2 μg/m3) showed a striking positive contribution (+3.34). However, this was countered by strong negative impacts from O3 (−2.17), NO2 (−1.91), along with additional cooling from SO2 (−0.38), PM2.5 (−0.26), and PM10 (−0.03). The collective negative effects of these pollutants counteracted CO’s warming, leading to a sharp UTCI drop. At nighttime in winter, the predicted UTCI (−15.343) was slightly higher than the average (−16.41). O3 (3 μg/m3) emerged as the dominant warming factor (+2.41), partially offsetting minor cooling from CO (−1.22) and SO2 (−0.3). Weak positive contributions from PM10 (+0.15) and PM2.5 (+0.1) further bolstered the slight UTCI increase above the average.
For Chengdu (Köppen climate type C), in summer daytime, the predicted UTCI (32.089) was significantly higher than the model’s average (29.565). O3 (134 μg/m3) exerted the largest positive contribution (+1.95), followed by PM2.5 (8 μg/m3, +1.06) and CO (0.61 μg/m3, +0.54). Distinct from both humid A-type and arid B-type climates, C-type climates like Chengdu’s feature moderate humidity and cloud cover, which may limit solar scattering and allow more pollutants to enhance surface heating. On summer nights, the target UTCI (22.983) marginally exceeded the average (22.613). O3 (41 μg/m3) was the sole pollutant with a negative contribution (−0.55), while CO (0.59 μg/m3, +0.37), PM10 (33 μg/m3, +0.17), SO2 (3 μg/m3, +0.14), PM2.5 (22 μg/m3, +0.14), and NO2 (20 μg/m3, +0.1) all contributed positively. Despite O3’s cooling effect, the cumulative weak warming from other pollutants pushed the UTCI slightly above the average. As for winter, in daytime, the predicted UTCI (3.862) was far lower than the average (9.701). O3 (5 μg/m3) and CO (0.55 μg/m3) delivered dominant negative contributions (−5.0 and −1.45, respectively). Unlike D-type climates where O3 may warm, in Chengdu’s cloudy and moisture-laden winters, the pollutant acts dominantly to suppress solar gains, reinforcing the C-type climate’s transitional cooling tendencies. At night, the target UTCI (0.43) was slightly lower than the average (0.949). CO (0.57 μg/m3, −1.41) and PM10 (53 μg/m3, −0.3) drove cooling, while PM2.5 (43 μg/m3, +0.55), SO2 (2 μg/m3, +0.44), and O3 (11 μg/m3, +0.29) contributed to warming. NO2 (27 μg/m3, −0.08) had a negligible negative effect. The balance between cooling (CO, PM10) and warming (PM2.5, SO2, O3) resulted in a minor UTCI decline relative to the average.
For Harbin (Köppen climate type D), in summer daytime, the predicted UTCI (28.204) was substantially higher than the model’s average (23.899). NO2 (8 μg/m3) exerted the dominant positive contribution (+3.97), followed by O3 (84 μg/m3, +1.68). What sets D-type climates apart is their low baseline radiation and dry cold air, allowing trace gas warming (especially from NO2) to exert disproportionate impacts compared to A or C climates. At night, the UTCI (10.452) was much lower than the average (15.877), as CO (−4.37), PM10 (−1.42), and PM2.5 (−1.08) dominated cooling. Compared to tropical climates, Harbin’s strong nocturnal inversion layers trap pollutants but fail to retain heat due to a lack of humidity, highlighting D-type climates’ vulnerability to nighttime cold stress. As for winter, in daytime, the predicted UTCI (−10.975) was notably higher (less cold) than the average (−17.844). O3 (59 μg/m3) acted as the dominant warming agent (+4.61), followed by NO2 (31 μg/m3, +1.96), PM10 (66 μg/m3, +1.04), SO2 (12 μg/m3, +0.58), and PM2.5 (43 μg/m3, +0.55). Only CO (0.53 μg/m3, −1.88) exhibited a cooling effect, which was insufficient to counteract the collective warming from other pollutants. At night, the UTCI (−26.949) also remained higher than the average (−28.797), as most pollutants (SO2, O3, PM2.5, PM10) contributed to warming. This further confirms that the D-type climate is prone to severe cold weather in winter, and due to the effect of pollutants, heat loss at night is significantly reduced—this contrasts sharply with the usual cooling effect of B-type nights.

4. Discussion

4.1. Meteorological Driving Mechanism of Impact of Air Pollution on Thermal Comfort

Meteorological factors modulate outdoor thermal comfort both directly—through radiation balance and heat flux—and indirectly by affecting air pollution levels and their thermal impacts. Our results confirm that air temperature and short-wave radiation are strong positive contributors to the UTCI across seasons, consistent with the findings from Bröde et al., 2013 [3] and Lu et al., 2020 [14]. This dual influence—direct physical control and indirect modulation via air pollution—forms a complex feedback loop that shapes thermal comfort in a nonlinear, spatiotemporally dynamic manner. At the mechanistic level, higher air temperatures increase skin–air temperature gradients and promote heat stress but simultaneously accelerate photochemical reactions, particularly the formation of O3 and secondary aerosols, which themselves carry radiative properties that further impact heat perception.
Notably, SHAP analysis reveals that O3 and PM10 contribute the most positively to the UTCI under high solar radiation and air temperature, especially during summer daytime in temperate and arid zones. This pattern reflects a multi-stage interaction chain: intense solar radiation triggers photochemical smog formation, particularly O3, which absorbs UV and near-infrared radiation, enhancing sensible heat flux to the human body. PM10, often comprising dust and coarse-mode particles in arid zones, increases atmospheric optical depth, trapping outgoing long-wave radiation and enhancing perceived warmth. This nonlinear amplification confirms prior findings by Miao et al. [16], who identified enhanced photochemical reactions and pollutant-induced radiative feedback loops during heatwaves.
In winter, the role of CO and PM2.5 becomes more pronounced, especially at night. SHAP waterfall plots demonstrate that these pollutants act as insulation layers, limiting long-wave radiation loss and increasing perceived thermal comfort in northern cities like Harbin. PM2.5, with its fine particle size and high surface area, is particularly effective in altering radiative transfer processes. It reduces outgoing long-wave radiation and increases atmospheric emissivity near the surface, functioning as a nocturnal “blanket” that suppresses radiative cooling. CO, on the other hand, indirectly indicates combustion-related activities and stable atmospheric conditions that coexist with shallow boundary layers, further intensifying nocturnal warming. This aligns with the urban climate literature that highlights boundary layer trapping as a mechanism for nocturnal warming [21]. Wind speed and relative humidity further mediate pollutant–UTCI interactions. In southern humid zones like Guangzhou, high humidity and convective activity disperse PM effectively, reducing its thermal impact, whereas in cold and dry regions, pollutant buildup is favored under weak wind and inversion conditions, enhancing the UTCI.
Overall, meteorological conditions exert a dual influence on outdoor thermal comfort, functioning both as direct physical determinants of thermal environments and as modulators of air pollutant behavior. This dual role highlights the importance of employing integrated modeling approaches that explicitly capture the interactions among atmospheric dynamics, pollutant dispersion, and human thermal perception. Neglecting meteorological regulation in such analyses may result in a significant misrepresentation of thermal stress, particularly in pollution-prone settings. Therefore, incorporating meteorological variability is essential for accurately assessing the compound effects of air pollution on thermal comfort across heterogeneous climatic regions.

4.2. Seasonal and Diurnal Synergies

The SHAP-based seasonal and diurnal analyses highlight strong synergies between pollutant behaviors and meteorological dynamics. During summer daytime, elevated levels of O3, PM10, and CO contribute positively to the UTCI, driven by intensified solar radiation and photochemical reactions. These findings are consistent with previous evidence of enhanced secondary pollutant formation during high-radiation events [23]. The positive SHAP contributions from O3 often exceed +2.0 in arid zones like Lanzhou, exacerbating urban heat exposure. This enhancement in diurnal variation is due to a synergistic feedback mechanism: Intense solar radiation not only increases the UTCI through direct heating but also promotes the formation of O3 in the troposphere through the photochemical reaction of volatile organic compounds—nitrogen oxides [36]. At the same time, the stagnation caused by heat and the decrease in the height of the boundary layer trap pollutants near the ground, thereby strengthening this feedback effect. Therefore, daytime peaks in thermal discomfort are often co-modulated by both meteorological extremity and pollution-induced radiative effects.
In contrast, during summer nights, the thermal effects of pollutants shift markedly. O3 and particulate matter exhibit negative SHAP values, reflecting their radiative cooling effects through solar scattering and nocturnal radiation retention. At night, the absence of solar forcing alters the radiative role of pollutants. O3, being reactive and short-lived, dissipates rapidly, while PM—particularly PM2.5—plays a more dominant role in modulating long-wave radiation [37]. However, this regulatory effect varies depending on the composition of the aerosols and the humidity level, resulting in alternating between cooling (due to enhanced radiation outward under clear skies) and warming (in hazy, humid air layers). These changes highlight that pollutants not only act as heat amplifiers but also function as heat regulators according to the diurnal cycle. Chengdu and Harbin are typical examples of this transition, and the SHAP graph shows that the contributions of PM2.5 and PM10 change from positive to negative during the day and night.
The observations in winter show that CO and PM2.5 have a more significant impact on the UTCI, especially at night. This might be because at lower boundary layer heights, pollutants accumulate on the surface [38]. However, the magnitudes of these effects are still smaller than those in summer. This seasonal attenuation aligns with the reduced solar input and weaker convective mixing during winter [22]. Furthermore, during winter, anthropogenic heating sources such as coal burning contribute both thermal and pollution loads to the environment. While emissions increase, the thermodynamic conditions (e.g., reduced sensible heat flux, higher albedo due to snow) constrain pollutant–heat synergy [39]. Thus, the thermal impact of pollution in winter is more indirect and moderated by background meteorology.
Collectively, these findings confirm that the thermal impacts of pollutants are temporally dynamic and context-dependent. Pollutants exert bidirectional thermal effects—warming during the day, cooling at night; amplifying during heatwaves, dampening under low-radiation conditions—highlighting the necessity of diurnal resolution in thermal risk assessment. The accurate risk assessment of thermal discomfort thus requires fine-resolution modeling that integrates meteorological, temporal, and pollutant-specific dimensions. Such models should also account for feedback processes, including urban heat island effects, anthropogenic heat release, and secondary pollutant dynamics, to avoid oversimplification.

4.3. Implications and Limitations

Policy Guidance: In cold climates, wintertime heating policies should consider the insulating effect of particulates—balancing air quality goals with urban heat retention. In arid zones, summer O3 control strategies must integrate meteorological forecasts, especially temperature and radiation, to mitigate synergistic thermal stress.
Methodological Considerations: While ERA5 provides consistent reanalysis coverage, it may underrepresent fine-scale urban heterogeneity. Future work should incorporate higher-resolution, ground-based observations and extend modeling frameworks (e.g., causal inference or hybrid physics–ML models) to enhance robustness.
In summary, this study demonstrates that meteorology plays a dual and temporally dynamic role in shaping thermal comfort—both directly and through the modulation of air pollution’s thermal effects. The combination of machine learning and interpretable modeling provides a scalable framework for anticipating urban thermal risks under evolving climatic and pollution regimes.

5. Conclusions

This study systematically investigated the spatiotemporal patterns of the Universal Thermal Climate Index (UTCI) and its interactions with air quality across China from 2020 to 2024. Leveraging ERA5 reanalysis data, hourly urban air quality records, and advanced machine learning methodologies (XGBoost regression coupled with SHAP interpretability), we addressed research objectives through data preprocessing, spatiotemporal visualization, diurnal–seasonal cross-scale modeling, and climate zone-specific analysis. The key findings reveal the following: (1) Nationally, the summer UTCI exhibited a gradual upward trend from 2020 to 2024, accompanied by an increasing frequency and intensity of strong thermal stress events, while the winter UTCI remained relatively stable, with extreme cold stress showing significant spatial heterogeneity but no consistent temporal trend. (2) Air quality factors exert dynamic influences on the UTCI, with O3 and PM10 showing pronounced diurnal and seasonal variability—enhancing thermal stress during daytime and suppressing it at night—highlighting their dual roles in modulating urban heat discomfort. (3) Meteorological factors serve as dual regulators of thermal comfort by directly influencing the UTCI through temperature and radiation and indirectly modulating pollutant effects—as evidenced by SHAP dependence plots showing that O3 enhances the UTCI under high temperature and strong solar radiation during the day but suppresses it at night under low-radiation, stable atmospheric conditions. (4) The thermal effect of air pollutants on the UTCI varies greatly in the Köppen climate zone and time scale. Through single-point SHAP analysis, it can be observed that O3 and CO show frequent role reversal between day and night or across seasons in typical cities, emphasizing the necessity of considering the climatic background and diurnal variation in pollution–thermal stress assessment.
By integrating machine learning with interpretable SHAP analysis, this study deciphers the complex nonlinear relationships and provides a data-driven, interpretable framework for understanding the key drivers and interactions in UTCI dynamics. The findings inform region- and season-tailored strategies to enhance thermal comfort and mitigate air pollution while highlighting the need for future research on high-resolution, long-term interactions under climate change.

Author Contributions

Conceptualization, K.H.; methodology, K.H. and Q.M.; software, K.H. and X.L.; validation, K.H. and L.Z.; formal analysis, K.H. and S.C.; investigation, K.H.; resources, Q.M.; data curation, L.Z. and J.P.; writing—original draft preparation, K.H.; writing—review and editing, L.Z., A.M. and Q.M.; visualization, K.H.; supervision, L.Z.; project administration, L.Z., M.S. and Q.M.; funding acquisition, Q.M. All authors have read and agreed to the published version of the manuscript.

Funding

This research was funded by National Natural Science Foundation of China Major Program (42192580, 42192581), FY-3 Lot 03 Meteorological Satellite Engineering Ground Application System Ecological Monitoring and Assessment Application Project (Phase I): ZQC-R22227, and Youth Innovation Promotion Association CAS (2023139).

Institutional Review Board Statement

Not applicable.

Informed Consent Statement

Not applicable.

Data Availability Statement

UTCI data were obtained from the thermal comfort indices derived from the ERA5 reanalysis dataset, provided by the Copernicus Climate Data Store (CDS) (https://cds.climate.copernicus.eu/). The air quality data used in this study were obtained from the publicly available platform maintained by Quotsoft (https://quotsoft.net/air/ (accessed on 23 March 2025)). Meteorological data were derived from the ERA5 hourly reanalysis dataset provided by the European Centre for Medium-Range Weather Forecasts (ECMWF) via the Copernicus Climate Data Store (https://cds.climate.copernicus.eu/).

Conflicts of Interest

The authors declare that they have no known competing financial interests or personal relationships that could have appeared to influence the work reported in this paper.

References

  1. Adnan, M.S.G.; Dewan, A.; Botje, D.; Shahid, S.; Hassan, Q.K. Vulnerability of Australia to Heatwaves: A Systematic Review on Influencing Factors, Impacts, and Mitigation Options. Environ. Res. 2022, 213, 113703. [Google Scholar] [CrossRef]
  2. Li, J.; Liu, N. The Perception, Optimization Strategies and Prospects of Outdoor Thermal Comfort in China: A Review. Build. Environ. 2020, 170, 106614. [Google Scholar] [CrossRef]
  3. Bröde, P.; Błazejczyk, K.; Fiala, D.; Havenith, G.; Holmér, I.; Jendritzky, G.; Kuklane, K.; Kampmann, B. The Universal Thermal Climate Index UTCI Compared to Ergonomics Standards for Assessing the Thermal Environment. Ind. Health 2013, 51, 16–24. [Google Scholar] [CrossRef]
  4. Golasi, I.; Salata, F.; de Vollaro, E.L.; Coppi, M.; Vollaro, A.d.L. Thermal Perception in the Mediterranean Area: Comparing the Mediterranean Outdoor Comfort Index (MOCI) to Other Outdoor Thermal Comfort Indices. Energies 2016, 9, 550. [Google Scholar] [CrossRef]
  5. Nikolopoulou, M.; Baker, N.; Steemers, K. Thermal Comfort in Outdoor Urban Spaces: Understanding the Human Parameter. Sol. Energy 2001, 70, 227–235. [Google Scholar] [CrossRef]
  6. Salata, F.; Golasi, I.; de Lieto Vollaro, R.; de Lieto Vollaro, A. Outdoor Thermal Comfort in the Mediterranean Area. A Transversal Study in Rome, Italy. Build. Environ. 2016, 96, 46–61. [Google Scholar] [CrossRef]
  7. Yahia, M.W.; Johansson, E. Evaluating the Behaviour of Different Thermal Indices by Investigating Various Outdoor Urban Environments in the Hot Dry City of Damascus, Syria. Int. J. Biometeorol. 2013, 57, 615–630. [Google Scholar] [CrossRef] [PubMed]
  8. Pantavou, K.; Santamouris, M.; Asimakopoulos, D.; Theoharatos, G. Empirical Calibration of Thermal Indices in an Urban Outdoor Mediterranean Environment. Build. Environ. 2014, 80, 283–292. [Google Scholar] [CrossRef]
  9. Pantavou, K.; Santamouris, M.; Asimakopoulos, D.; Theoharatos, G. Evaluating the Performance of Bioclimatic Indices on Quantifying Thermal Sensation for Pedestrians. Adv. Build. Energy Res. 2013, 7, 170–185. [Google Scholar] [CrossRef]
  10. Xu, T.; Yao, R.; Du, C.; Li, B.; Fang, F. A Quantitative Evaluation Model of Outdoor Dynamic Thermal Comfort and Adaptation: A Year-Long Longitudinal Field Study. Build. Environ. 2023, 237, 110308. [Google Scholar] [CrossRef]
  11. Zheng, B.; Tong, D.; Li, M.; Liu, F.; Hong, C.; Geng, G.; Li, H.; Li, X.; Peng, L.; Qi, J.; et al. Trends in China’s Anthropogenic Emissions since 2010 as the Consequence of Clean Air Actions. Atmos. Chem. Phys. 2018, 18, 14095–14111. [Google Scholar] [CrossRef]
  12. Connerton, P.; Vicente de Assunção, J.; Maura de Miranda, R.; Dorothée Slovic, A.; José Pérez-Martínez, P.; Ribeiro, H. Air Quality during COVID-19 in Four Megacities: Lessons and Challenges for Public Health. Int. J. Environ. Res. Public Health 2020, 17, 5067. [Google Scholar] [CrossRef]
  13. Huang, R.-J.; Zhang, Y.; Bozzetti, C.; Ho, K.-F.; Cao, J.-J.; Han, Y.; Daellenbach, K.R.; Slowik, J.G.; Platt, S.M.; Canonaco, F.; et al. High Secondary Aerosol Contribution to Particulate Pollution during Haze Events in China. Nature 2014, 514, 218–222. [Google Scholar] [CrossRef] [PubMed]
  14. Lu, K.-F.; He, H.-D.; Wang, H.-W.; Li, X.-B.; Peng, Z.-R. Characterizing Temporal and Vertical Distribution Patterns of Traffic-Emitted Pollutants near an Elevated Expressway in Urban Residential Areas. Build. Environ. 2020, 172, 106678. [Google Scholar] [CrossRef]
  15. Miao, C.; He, X.; Gao, Z.; Chen, W.; He, B.-J. Assessing the Vertical Synergies between Outdoor Thermal Comfort and Air Quality in an Urban Street Canyon Based on Field Measurements. Build. Environ. 2023, 227, 109810. [Google Scholar] [CrossRef]
  16. Miao, C.; Chen, W.; Yu, S. Assessing Ozone Distribution Vertically and Horizontally in Urban Street Canyons Based on Field Investigation and ENVI-Met Modelling. Buildings 2022, 12, 262. [Google Scholar] [CrossRef]
  17. Zhan, C.; Xie, M.; Liu, J.; Wang, T.; Xu, M.; Chen, B.; Li, S.; Zhuang, B.; Li, M. Surface Ozone in the Yangtze River Delta, China: A Synthesis of Basic Features, Meteorological Driving Factors, and Health Impacts. J. Geophys. Res. Atmos. 2021, 126, e2020JD033600. [Google Scholar] [CrossRef]
  18. Ahmed, T.; Kumar, P.; Mottet, L. Natural Ventilation in Warm Climates: The Challenges of Thermal Comfort, Heatwave Resilience and Indoor Air Quality. Renew. Sustain. Energy Rev. 2021, 138, 110669. [Google Scholar] [CrossRef]
  19. Cooper, E.; Wang, Y.; Stamp, S.; Burman, E.; Mumovic, D. Use of Portable Air Purifiers in Homes: Operating Behaviour, Effect on Indoor PM2.5 and Perceived Indoor Air Quality. Build. Environ. 2021, 191, 107621. [Google Scholar] [CrossRef]
  20. Rui, L.; Buccolieri, R.; Gao, Z.; Ding, W.; Shen, J. The Impact of Green Space Layouts on Microclimate and Air Quality in Residential Districts of Nanjing, China. Forests 2018, 9, 224. [Google Scholar] [CrossRef]
  21. Yilmaz, S.; Sezen, I.; Irmak, M.A.; Külekçi, E.A. Analysis of Outdoor Thermal Comfort and Air Pollution under the Influence of Urban Morphology in Cold-Climate Cities: Erzurum/Turkey. Environ. Sci. Pollut. Res. Int. 2021, 28, 64068–64083. [Google Scholar] [CrossRef]
  22. Fahad, M.G.R.; Karimi, M.; Nazari, R.; Sabrin, S. Developing a Geospatial Framework for Coupled Large Scale Thermal Comfort and Air Quality Indices Using High Resolution Gridded Meteorological and Station Based Observations. Sustain. Cities Soc. 2021, 74, 103204. [Google Scholar] [CrossRef]
  23. Miao, C.; Li, P.; Huang, Y.; Sun, Y.; Chen, W.; Yu, S. Coupling Outdoor Air Quality with Thermal Comfort in the Presence of Street Trees: A Pilot Investigation in Shenyang, Northeast China. J. For. Res. 2023, 34, 831–839. [Google Scholar] [CrossRef]
  24. Gu, B.; Zhang, X.; Lam, S.K.; Yu, Y.; van Grinsven, H.J.M.; Zhang, S.; Wang, X.; Bodirsky, B.L.; Wang, S.; Duan, J.; et al. Cost-Effective Mitigation of Nitrogen Pollution from Global Croplands. Nature 2023, 613, 77–84. [Google Scholar] [CrossRef] [PubMed]
  25. Zhang, Q.; Zheng, Y.; Tong, D.; Shao, M.; Wang, S.; Zhang, Y.; Xu, X.; Wang, J.; He, H.; Liu, W.; et al. Drivers of Improved PM2.5 Air Quality in China from 2013 to 2017. Proc. Natl. Acad. Sci. USA 2019, 116, 24463–24469. [Google Scholar] [CrossRef] [PubMed]
  26. Lasantha, V.; Oki, T.; Tokuda, D. Data-Driven versus Köppen–Geiger Systems of Climate Classification. Adv. Meteorol. 2022, 2022, 3581299. [Google Scholar] [CrossRef]
  27. GB 3095-2012; Ambient Air Quality Standards. China Environmental Science Press: Beijing, China.
  28. Wu, S.; Liu, J.; Zhang, G.; Han, B.; Wu, R.; Chen, D. Evaluation of NCEP-CFSv2, ERA5, and CCMP Wind Datasets against Buoy Observations over Zhejiang Nearshore Waters. Ocean Eng. 2022, 259, 111832. [Google Scholar] [CrossRef]
  29. Gao, B.; Coon, E.T.; Thornton, P.E.; Lu, D. Improving the Estimation of Atmospheric Water Vapor Pressure Using Interpretable Long Short-Term Memory Networks. Agric. For. Meteorol. 2024, 347, 109907. [Google Scholar] [CrossRef]
  30. Park, H.; Park, D.Y. Prediction of Individual Thermal Comfort Based on Ensemble Transfer Learning Method Using Wearable and Environmental Sensors. Build. Environ. 2022, 207, 108492. [Google Scholar] [CrossRef]
  31. Kong, G.; Peng, J.; Corcoran, J. Modelling Urban Heat Island Effects: A Global Analysis of 216 Cities Using Machine Learning Techniques. Comput. Urban Sci. 2025, 5, 18. [Google Scholar] [CrossRef]
  32. Lundberg, S.M.; Erion, G.; Chen, H.; DeGrave, A.; Prutkin, J.M.; Nair, B.; Katz, R.; Himmelfarb, J.; Bansal, N.; Lee, S.-I. From Local Explanations to Global Understanding with Explainable AI for Trees. Nat. Mach. Intell. 2020, 2, 56–67. [Google Scholar] [CrossRef]
  33. Li, Y.; Jia, C.; Chen, H.; Su, H.; Chen, J.; Wang, D. Machine Learning Assessment of Damage Grade for Post-Earthquake Buildings: A Three-Stage Approach Directly Handling Categorical Features. Sustainability 2023, 15, 13847. [Google Scholar] [CrossRef]
  34. Bian, C.; Lee, C.C.; Chen, X.; Li, C.Y.; Hu, P. Quantifying the Thermal and Energy Impacts of Urban Morphology Using Multi-Source Data: A Multi-Scale Study in Coastal High-Density Contexts. Buildings 2025, 15, 2266. [Google Scholar] [CrossRef]
  35. Bröde, P.; Fiala, D.; Błażejczyk, K.; Holmér, I.; Jendritzky, G.; Kampmann, B.; Tinz, B.; Havenith, G. Deriving the Operational Procedure for the Universal Thermal Climate Index (UTCI). Int. J. Biometeorol. 2012, 56, 481–494. [Google Scholar] [CrossRef] [PubMed]
  36. Meehl, G.A.; Tebaldi, C. More Intense, More Frequent, and Longer Lasting Heat Waves in the 21st Century. Science 2004, 305, 994–997. [Google Scholar] [CrossRef]
  37. Jacobson, M.Z. Enhancement of Local Air Pollution by Urban CO2 Domes. Environ. Sci. Technol. 2010, 44, 2497–2502. [Google Scholar] [CrossRef]
  38. Huang, X.; Ding, A.; Wang, Z.; Ding, K.; Gao, J.; Chai, F.; Fu, C. Amplified Transboundary Transport of Haze by Aerosol–Boundary Layer Interaction in China. Nat. Geosci. 2020, 13, 428–434. [Google Scholar] [CrossRef]
  39. Luo, M.; Wu, S.; Lau, G.N.-C.; Pei, T.; Liu, Z.; Wang, X.; Ning, G.; Chan, T.O.; Yang, Y.; Zhang, W. Anthropogenic Forcing Has Increased the Risk of Longer-Traveling and Slower-Moving Large Contiguous Heatwaves. Sci. Adv. 2024, 10, eadl1598. [Google Scholar] [CrossRef]
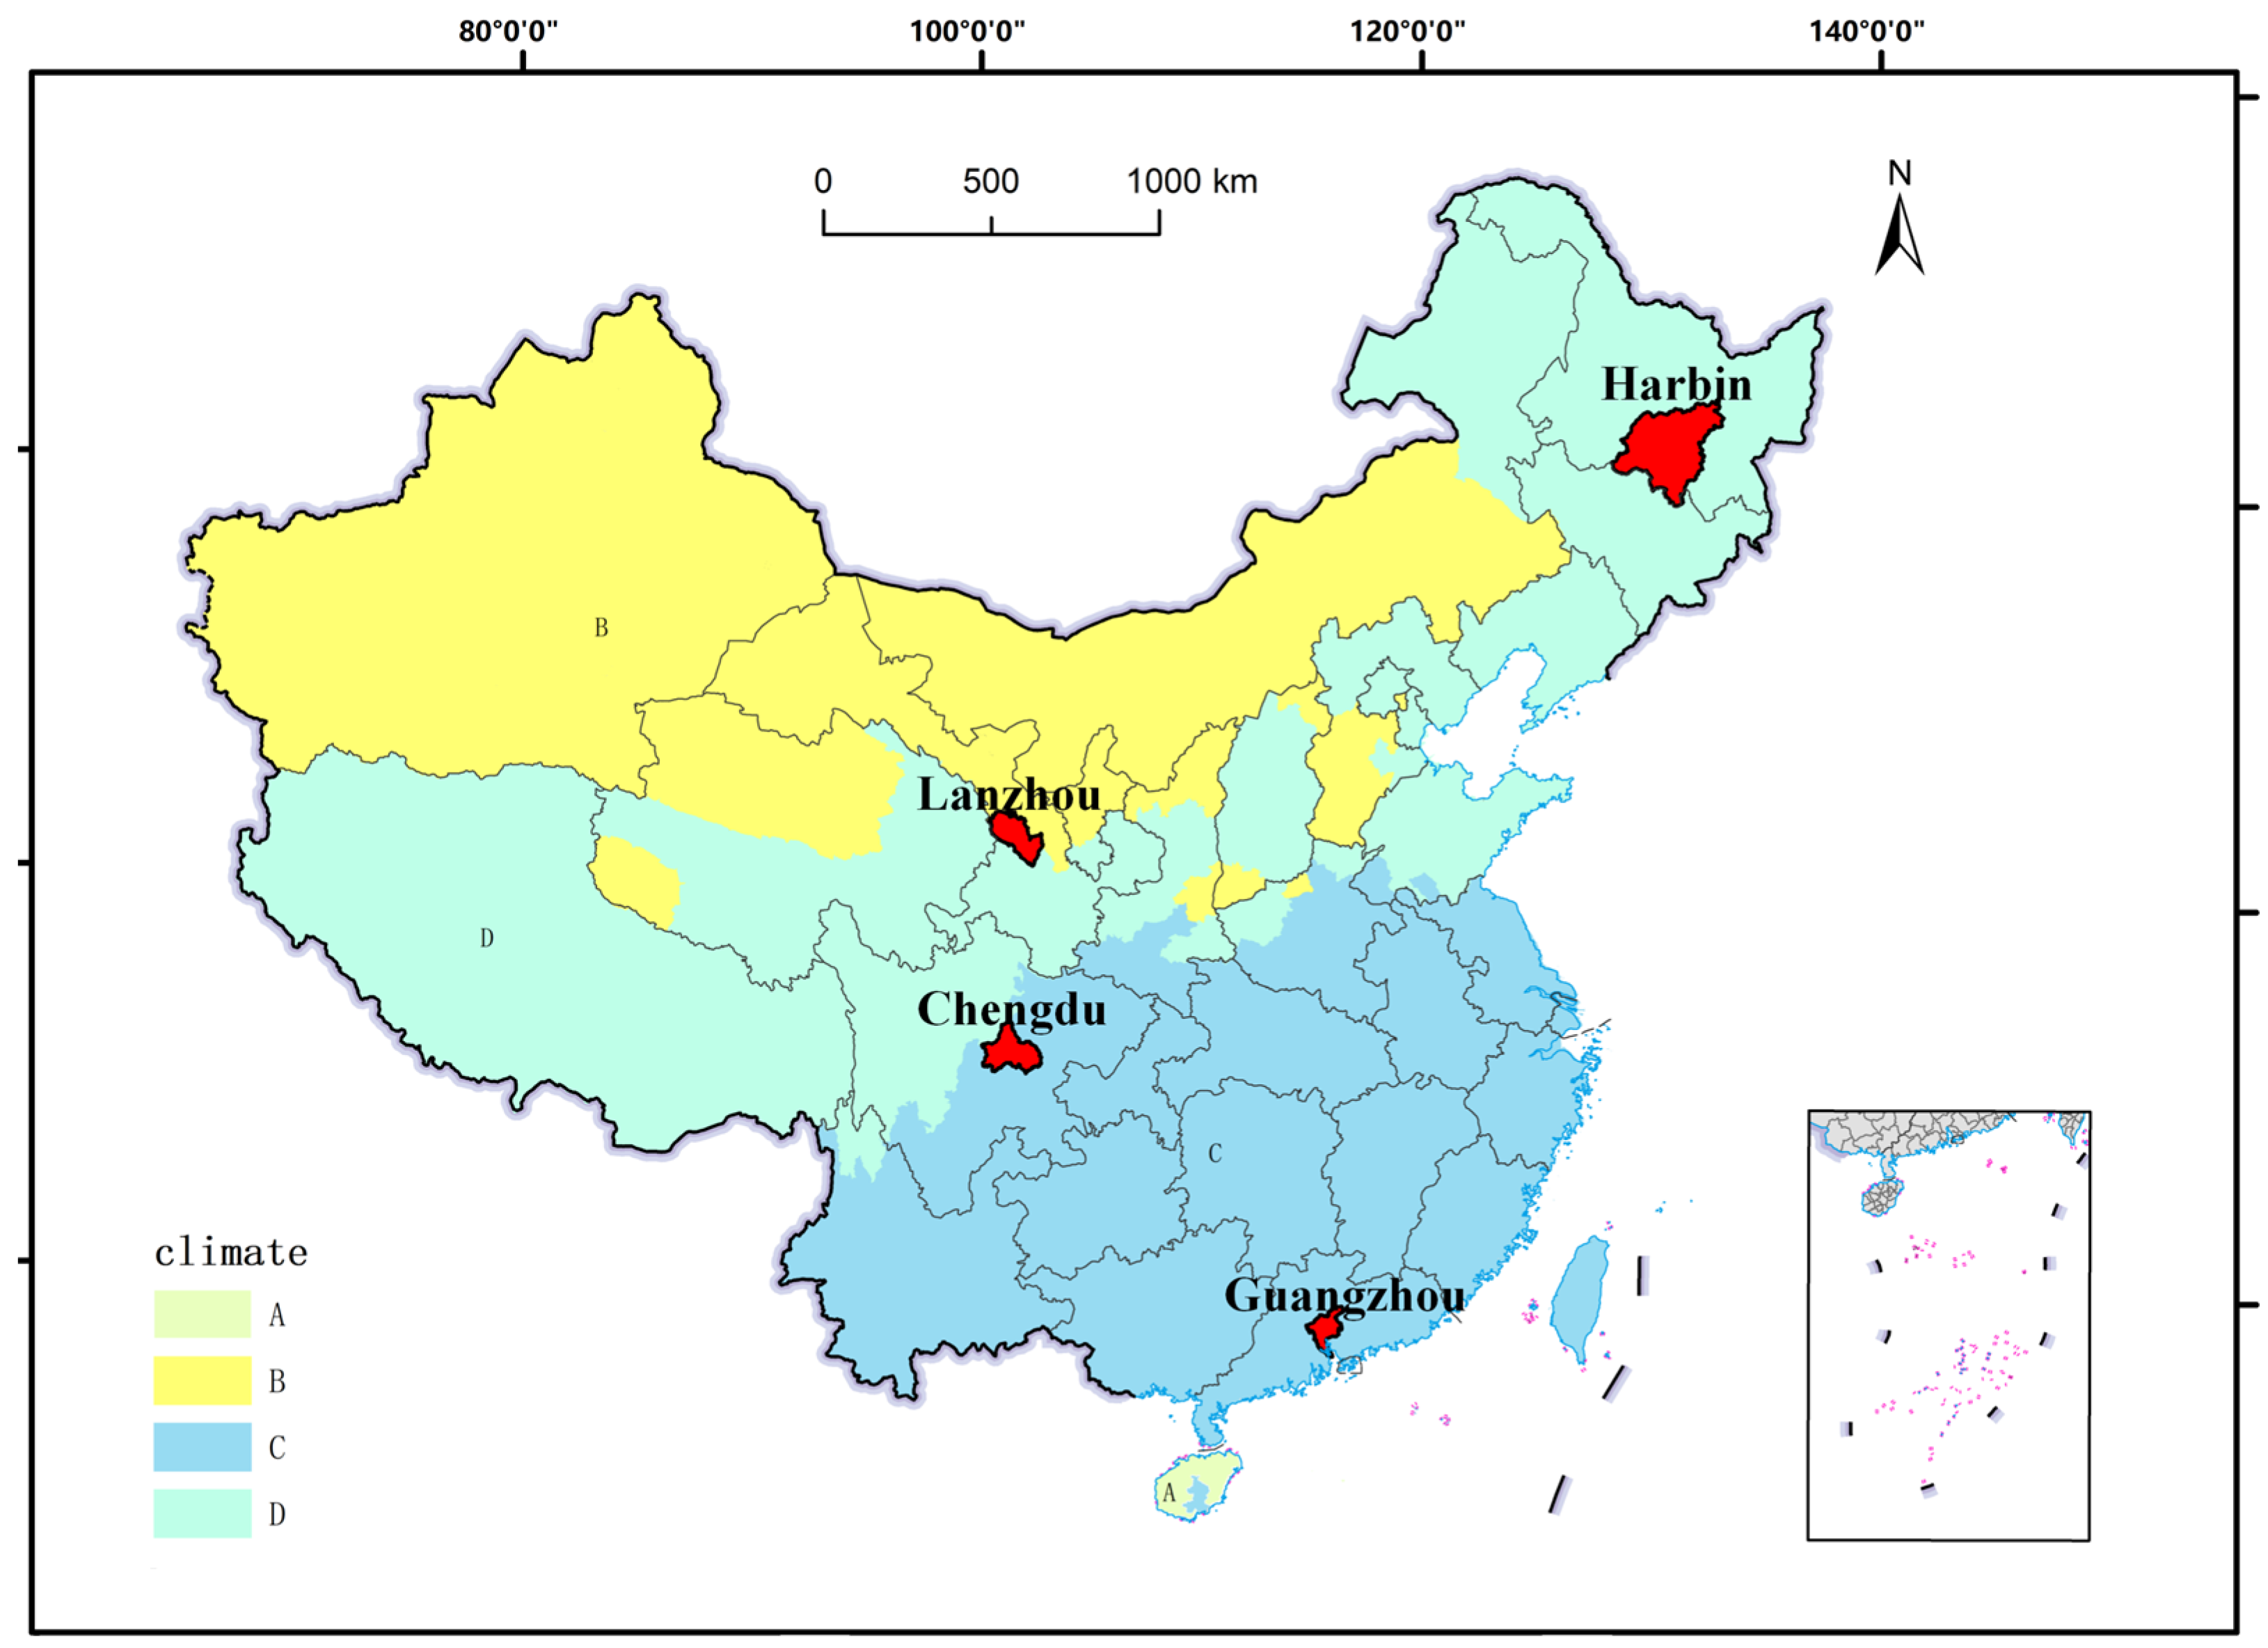
Figure 1. A Köppen climate classification map of China, categorized into four major climate zones: A (Tropical), B (Arid), C (Temperate), and D (Cold/Continental). Red-marked areas indicate selected representative cities used for climate zone analysis. The inset in the bottom right corner shows the location of the South China Sea islands.
Atmosphere 16 01263 g001
Figure 2. Spatial distribution of summer PM2.5 and winter O3 across China, averaged over entire study period (2020–2024).
Atmosphere 16 01263 g002
Figure 3. (a) The distribution of the UTCI in China during summer. (b) The average UTCI value in China during summer (2020–2024). (c) The distribution of severe heat stress events in summer in China. (d) The cumulative hours of severe heat stress events in summer (2020–2024) in China.
Atmosphere 16 01263 g003
Figure 4. (a) The distribution of the UTCI in China during winter. (b) The average UTCI value in China during winter (2020–2024). (c) The distribution of severe cold stress events in winter in China. (d) The cumulative hours of severe cold stress events in winter (2020–2024) in China.
Atmosphere 16 01263 g004
Figure 5. SHAP beeswarm plot of air pollutant contributions to UTCI during summer daytime (a), summer nighttime (b), winter daytime (c), and winter nighttime (d).
Atmosphere 16 01263 g005
Figure 6. SHAP waterfall plots depicting air pollutant contributions to UTCI across seasonal (summer, winter) and diurnal (day, night) contexts for representative cities of four Köppen climate zones in China ((A): Guangzhou; (B): Lanzhou; (C): Chengdu; (D): Harbin).
Atmosphere 16 01263 g006
Table 1. The classification of climate zones in mainland China based on the Köppen system.
CodeClimate ZoneMain CharacteristicsGeographical Distribution
ATropicalHigh temperatures year-round; significant annual precipitation.Southernmost China, including parts of Hainan and southern Yunnan.
BAridLow precipitation; large diurnal temperature variation; includes desert and steppe areas.Northwestern China, especially Xinjiang and parts of Inner Mongolia.
CTemperateMild temperatures; distinct four seasons with moderate rainfall.Eastern and southeastern China, including the Yangtze River basin and coastal provinces.
DCold/ContinentalCold winters and warm summers; strong seasonality.Northern and northeastern China, such as Heilongjiang, Jilin, and parts of Inner Mongolia.
Table 2. Input features for the XGBoost model.
CategoryVariables/Settings
Air quality variablesPM2.5, PM10, SO2, NO2, O3, CO
Meteorological covariates2 m air temperature, relative humidity, wind speed, downward long-wave radiation, short-wave radiation
Diurnal periodDaytime (solar radiation > 0), nighttime (solar radiation = 0)
Seasonal windowsSummer (June–August), winter (December–February)
Table 3. Sample sizes for XGBoost model training and testing across different spatiotemporal conditions.
ConditionTotal SamplesTraining Samples (80%)Testing Samples (20%)
Summer Daytime653352261307
Summer Nighttime44173533884
Winter Daytime16911352339
Winter Nighttime19651572393
Table 4. Performance metrics (R2 and RMSE) of models.
R2/RMSESummerWinter
Daytime0.9646/1.40050.9865/1.5423
Nighttime0.9346/1.93040.9188/3.7710
Table 5. Performance metrics (R2 and RMSE) of different types of models.
R2/RMSEABCD
Summer Daytime0.604/2.450.616/4.360.580/3.260.509/4.65
Summer Nighttime0.446/1.170.459/3.390.391/2.240.429/3.92
Winter Daytime0.635/4.740.483/6.530.468/4.100.422/6.79
Winter Nighttime0.638/4.250.528/3.150.482/2.900.487/4.63
Disclaimer/Publisher’s Note: The statements, opinions and data contained in all publications are solely those of the individual author(s) and contributor(s) and not of MDPI and/or the editor(s). MDPI and/or the editor(s) disclaim responsibility for any injury to people or property resulting from any ideas, methods, instructions or products referred to in the content.