Article

Causes of the Extremely Heavy Rainfall Event in Libya in September 2023

1
State Key Laboratory of Climate System Prediction and Risk Management/Key Laboratory of Meteorological Disaster, Ministry of Education/Collaborative Innovation Center on Forecast and Evaluation of Meteorological Disasters, Nanjing University of Information Science and Technology, Nanjing 210044, China
2
School of Atmospheric Sciences, Nanjing University of Information Science and Technology, Nanjing 210044, China
*
Author to whom correspondence should be addressed.
Atmosphere 2025, 16(11), 1259; https://doi.org/10.3390/atmos16111259
Submission received: 18 September 2025 / Revised: 22 October 2025 / Accepted: 30 October 2025 / Published: 2 November 2025
(This article belongs to the Section Meteorology)

Abstract

This study conducts a diagnostic analysis of an extremely heavy rainfall event and its causative factors that occurred in Libya, North Africa on 10 September 2023. The Weather Research and Forecasting (WRF) model was also employed to perform some sensitivity experiments for this heavy rainfall event and further reveal its causes. Results indicate that the primary synoptic system responsible for this extreme precipitation event was an extratropical cyclone (storm) named “Daniel”. During the formation and development of this cyclone, the circulation at the 500 hPa level from the eastern Atlantic to western Asia exhibited a stable “two troughs and one ridge” pattern, with a upper-level cold vortex over the eastern Atlantic, a high-pressure ridge over central Europe, and a cut-off low over western Asia, collectively facilitating the formation and development of this cyclone. As this cyclone moved southward, it absorbed substantial energy from the Mediterranean Sea; following landfall, the intrusion of weak cold air enabled the cyclone to continue intensifying. Meanwhile, the northwest low-level jet stream to the west of the extratropical cyclone moved alongside the cyclone to the coastal regions of northeastern Libya, where it converged with water vapor transport belts originating from the Ionian Sea, the Aegean Sea, and the coastal waters of northeastern Libya. This convergence provided abundant water vapor for the rainstorm event, and under the combined effects of convergence and orographic lifting on the windward slopes of the coastal mountains, extreme precipitation was generated. In addition, the atmosphere over the coastal regions of northeastern Libya exhibited strong stratification instability, which was conducive to the occurrence of extreme heavy precipitation. Although WRF successfully reproduced the precipitation process, the precipitation amount was underestimated. Sensitivity experiments revealed that both the topography in the precipitation area and the sea surface temperature (SST) of the Mediterranean Sea contributed to this extreme heavy precipitation event.

1. Introduction

Libya, situated in northern Africa, shares its northern border with the Mediterranean Sea. The coastal zones are characterized by a Mediterranean climate, with warm, dry, and low-precipitation conditions prevailing during summer [1]. Winter precipitation in these areas is predominantly driven by Mediterranean extratropical cyclones [2,3]. In contrast, the inland regions exhibit a typical desert climate, marked by persistent hot and arid conditions throughout the year. Northern Libya is subject to the influence of extratropical cyclones during winter, with annual mean rainfall ranging approximately from 200 mm to 500 mm, characteristic of an arid climatic regime [4,5]. Studies have shown that over the past few decades, annual mean precipitation in North Africa has exhibited a significant decreasing trend [6], with a continuous increase in the frequency of droughts [7]. Recent studies have also pointed out that in the future, not only will the precipitation in Libya show a decreasing trend [8], but the precipitation in the Mediterranean Sea will also decrease [9].
Notably, the arid and rain-scarce northeastern region of Libya experienced an unprecedented extreme heavy rainfall event from 10–11 September 2023. The maximum 24 h accumulated precipitation reached 414.1 mm [10], with rainfall amounts ranging from 150 to 250 mm across most areas—nearly equivalent to the region’s annual total precipitation. Impacted by this extreme heavy rainfall, the Abu Mansour Dam and Bilad Dam in central Derna, northern Libya, collapsed due to their inability to hold the massive volume of rainwater. This led to the destruction of the city of Derna, located in northern Derna, by catastrophic floods, resulting in severe casualties. Beyond Derna, extensive areas in northeastern Libya were also affected by the floods, with a smaller number of additional casualties reported. The estimated death toll from this event exceeded 4000 people [10,11].
Against the backdrop of global warming, the frequency of extreme precipitation events has increased in most regions [12,13,14]. Even in areas with a decreasing annual mean precipitation, studies have shown that despite a reduction in total precipitation in the Mediterranean region, extreme precipitation events are on the rise [15]. One of the primary driving factors for extreme precipitation in the Mediterranean region is low-level instability, specifically the temperature difference between the sea surface and the lower troposphere, which modulates the atmospheric potential instability [16]. Furthermore, studies have indicated that Mediterranean extratropical cyclones also serve as one of the major contributors to extreme precipitation in this region [17]. Extratropical cyclones typically bring precipitation and, under certain conditions, can lead to the occurrence of extreme precipitation events [18,19,20]. For example, extratropical cyclones are conducive to the formation of extreme precipitation under the influence of orographic convergence in mountainous terrain and interactions between extratropical cyclone circulation and topography [21,22,23]. Additionally, low-level jets can also interact with terrain to generate active mesoscale strong convective activities, thereby contributing to the formation of extreme precipitation [24].
Our preliminary analysis indicates that the formation of this extreme heavy precipitation event in Libya is associated with the activity of a Mediterranean extratropical cyclone named “Daniel”. Previously, the cyclone also caused the critical areas of Greece devastated by extreme precipitation [25]. Some abnormally developing Mediterranean extratropical cyclones in the Mediterranean region cause severe disasters to the areas they pass through. It was not until the 1980s that such anomalously developing medicanes began to attract attention [26,27]. These intensely developing extratropical cyclones exhibit an eye-like feature at their center on satellite imagery, surrounded by intense, highly symmetric concentric cloud bands—structurally resembling tropical cyclones [28]. Base on numerical simulations and large-sample composite analyses, Miglietta et al. [29] further confirmed that such anomalously developing medicanes share similar dynamic characteristics with tropical cyclones. Accordingly, such anomalously developing cyclones have also been referred to as medicanes or “Mediterranean hurricanes” in recent years [30]. Studies have revealed that this extratropical cyclone Daniel is recognized as a medicane [25]. The genesis of medicanes is closely linked to the upper-level potential vorticity bands [31,32]. Fita and Flaounas pointed out that the latent heat of condensation released by convective precipitation is also a crucial factor for the intensification of medicanes [33]. By simulating different SST anomalies, Noyelle et al. proposed a linear relationship between the intensity of cyclones and SST: the higher the SST, the stronger the cyclone’s intensity [34]. Studies have shown that deep convection may contribute to the formation of a warm-core structure, which is similar to that of tropical cyclones in Mediterranean extratropical cyclones [35,36]. Based on numerical simulation experiments, Argüeso et al. also revealed that the long-term global warming signal in SST significantly increased the intensity and precipitation of “Daniel” [11].
This study primarily employs synoptic diagnostic analysis methods, combined with numerical simulation experiments, aiming to reveal the causes of this extreme heavy precipitation event in Libya, the contributions of SST and terrain to the extreme heavy precipitation, and the role played by the Mediterranean extratropical cyclone “Daniel” in the event. It is expected to provide certain references for future studies on extreme precipitation associated with Mediterranean extratropical cyclones in North Africa, and play an important role in improving forecasting, preparedness, and adaptation measures in the future.

2. Data and Methods

2.1. Data

Reanalysis data: Hourly reanalysis data from the 5th generation of the European Centre for Medium-Range Weather Forecasts (ECMWF) [37], including temperature, latent heat flux, sensible heat flux, vertical velocity, sea level pressure, specific humidity, geopotential height, and horizontal wind, with a spatial resolution of 0.25° × 0.25° were used for synoptic analysis.
SST observation data: the Daily Optimum Interpolation Sea Surface Temperature Version 2 (OISST V2) dataset from the National Oceanic and Atmospheric Administration (NOAA) [38], with a spatial resolution of 0.25° × 0.25°, was used for SST and its anomaly analysis. The study period covers 30 years from 1994 to 2023.
Precipitation data: Half-hourly precipitation data were obtained from the Integrated Multi-satellite Retrievals for Global Precipitation Measurement (IMERG) product [39]. As the latest generation of multi-satellite merged precipitation retrieval datasets under the Global Precipitation Measurement (GPM) mission, IMERG is designated as a Level 3 product of the GPM program. It fully leverages observations from all satellite sensors aboard the GPM platform, including active and passive microwave sensors as well as various infrared sensors, while also incorporating well-validated satellite precipitation retrieval algorithms inherited from the predecessor Tropical Rainfall Measuring Mission (TRMM) for data integration. A spatial resolution of 0.1° × 0.1° was used for precipitation analysis within this dataset.
Driving Data for the HYSPLIT Model: Global atmospheric assimilation data provided by the Global Data Assimilation System (GDAS) of the National Centers for Environmental Prediction (NCEP) in the United States, with a spatial resolution of 1° × 1°.
Simulation data: The Final Operational Global Analysis (FNL) data provided by the National Center for Atmospheric Research (NCAR) were used as the initial and boundary conditions for numerical simulation experiments. It has a horizontal spatial resolution of 0.25° × 0.25° and a temporal resolution of output every 6 h.

2.2. Methods

Vertical wind shear (VWS): VWS was calculated following Palmer et al. [40] Centered on the hurricane center, average wind speeds at 850 hPa and 200 hPa were computed separately within a 10° × 10° grid. The vector difference between the two levels’ average wind fields in this grid was then derived, with its magnitude defined as follows:
V W S = u 200 u 850 2 + v 200 v 850 2 ,
where u 200 and u 850 represent the average zonal wind speeds at 200 hPa and 850 hPa, respectively; v 200 and v 850 represent the average meridional wind speeds at 200 hPa and 850 hPa, respectively.
HYSPLIT Model: The HYSPLIT model was used to conduct a 48 h backward trajectory simulation of water vapor trajectories in the heavy precipitation area, aiming to identify the water vapor sources at different levels. The zonal and meridional components of wind, vertical velocity (omega), and geopotential height from GDAS meteorological data were employed to drive the HYSPLIT model, so as to analyze the water vapor transport paths.
WRF Simulation Experiment Scheme: The Weather Research and Forecasting Model (WRF 4.0) was used to conduct numerical simulation of this extreme rainstorm event in Libya. The integration start time was set to 0000 UTC on 10 September, when the medicane “Daniel” was about to make landfall in Libya. The integration lasted for 48 h, with a single-layer nesting configuration and output results generated every 6 h. The model was driven by FNL and ERA reanalysis datasets, with geographic data sourced from the official WRF website. The resolution of the topographic data was 10 m. The horizontal grid spatial resolution was 27 km, with horizontal grid points of 101 × 101. The Lambert projection was adopted, and the vertical direction was divided into 34 layers. The simulation domain ranged from 10° E to 40° E in longitude and 20° N to 40° N in latitude. For the physical parameterization schemes, the Lin scheme was selected for the microphysical process; the Kain–Fritsch scheme was used for the cumulus parameterization; the RRTMG schemes were adopted for both longwave and shortwave radiation; the thermal diffusion scheme was chosen for the land surface process; and the YSU scheme was selected for the boundary layer process.
Topographic Sensitivity Experiment: Static geographic data (geo_em.nc) for the simulation domain was generated by running WPS (Weather Research and Forecasting Preprocessing System). The land topographic elevation (HGT_M) within the region of 31° N–33° N and 20° E–24° E in this dataset was modified to 5 m. Subsequently, WPS was used to integrate the modified topographic data with meteorological data to form the driving data (met_em.nc) for WRF. Finally, this driving data was used to run WRF, completing the simulation experiment.
SST Sensitivity Experiment: Terrain–meteorology integrated data (met_em.nc) for the simulation domain at each time step was generated by running WPS (Weather Research and Forecasting Preprocessing System). The SST within this dataset was replaced with the climatological SST calculated from the driving data. Finally, this modified dataset was used to drive the WRF model, completing the simulation experiment.

3. Results

3.1. Characteristics of the Spatial and Temporal Distribution of Precipitation

Figure 1a shows the 24 h accumulated precipitation from 0600 UTC 10 September to 0600 UTC 11 September 2023. Precipitation was primarily concentrated in northeastern coastal Libya, with most areas receiving over 75 mm of 24 h accumulated precipitation. Notably, along the Mediterranean coastline, 24 h accumulated precipitation exceeded 150 mm, and rainfall even extended to inland desert areas.
To analyze the event’s extremeness, two grid points were selected from the rainfall zone: one corresponding to the maximum hourly accumulated precipitation (Point A, Figure 1a) and the other to the maximum 24 h accumulated precipitation (Point B, Figure 1a). Combined with Figure 1b, during this extreme event, the maximum hourly precipitation occurred at Point A, reaching 61.7 mm/h, while the maximum accumulated precipitation was recorded at Point B, with 24 h rainfall of approximately 225 mm—equivalent to the total annual precipitation in most northern Libyan regions—highlighting the extremeness of this event. Two distinct precipitation types were observed: (1) persistent precipitation at Point B and its vicinity, lasting from 0600 UTC 10 September to 0000 UTC 11 September, with intensity maintained at 8–24 mm/h; (2) convective heavy precipitation at Point A and its surroundings (central Derna), where precipitation was low before 2200 UTC 10 September but surged to 61.7 mm/h thereafter, showing clear severe cumulus convection characteristics.

3.2. Synoptic Systems and Circulation Characteristics

3.2.1. Circulation Characteristics at 500 hPa in the Mid-Troposphere

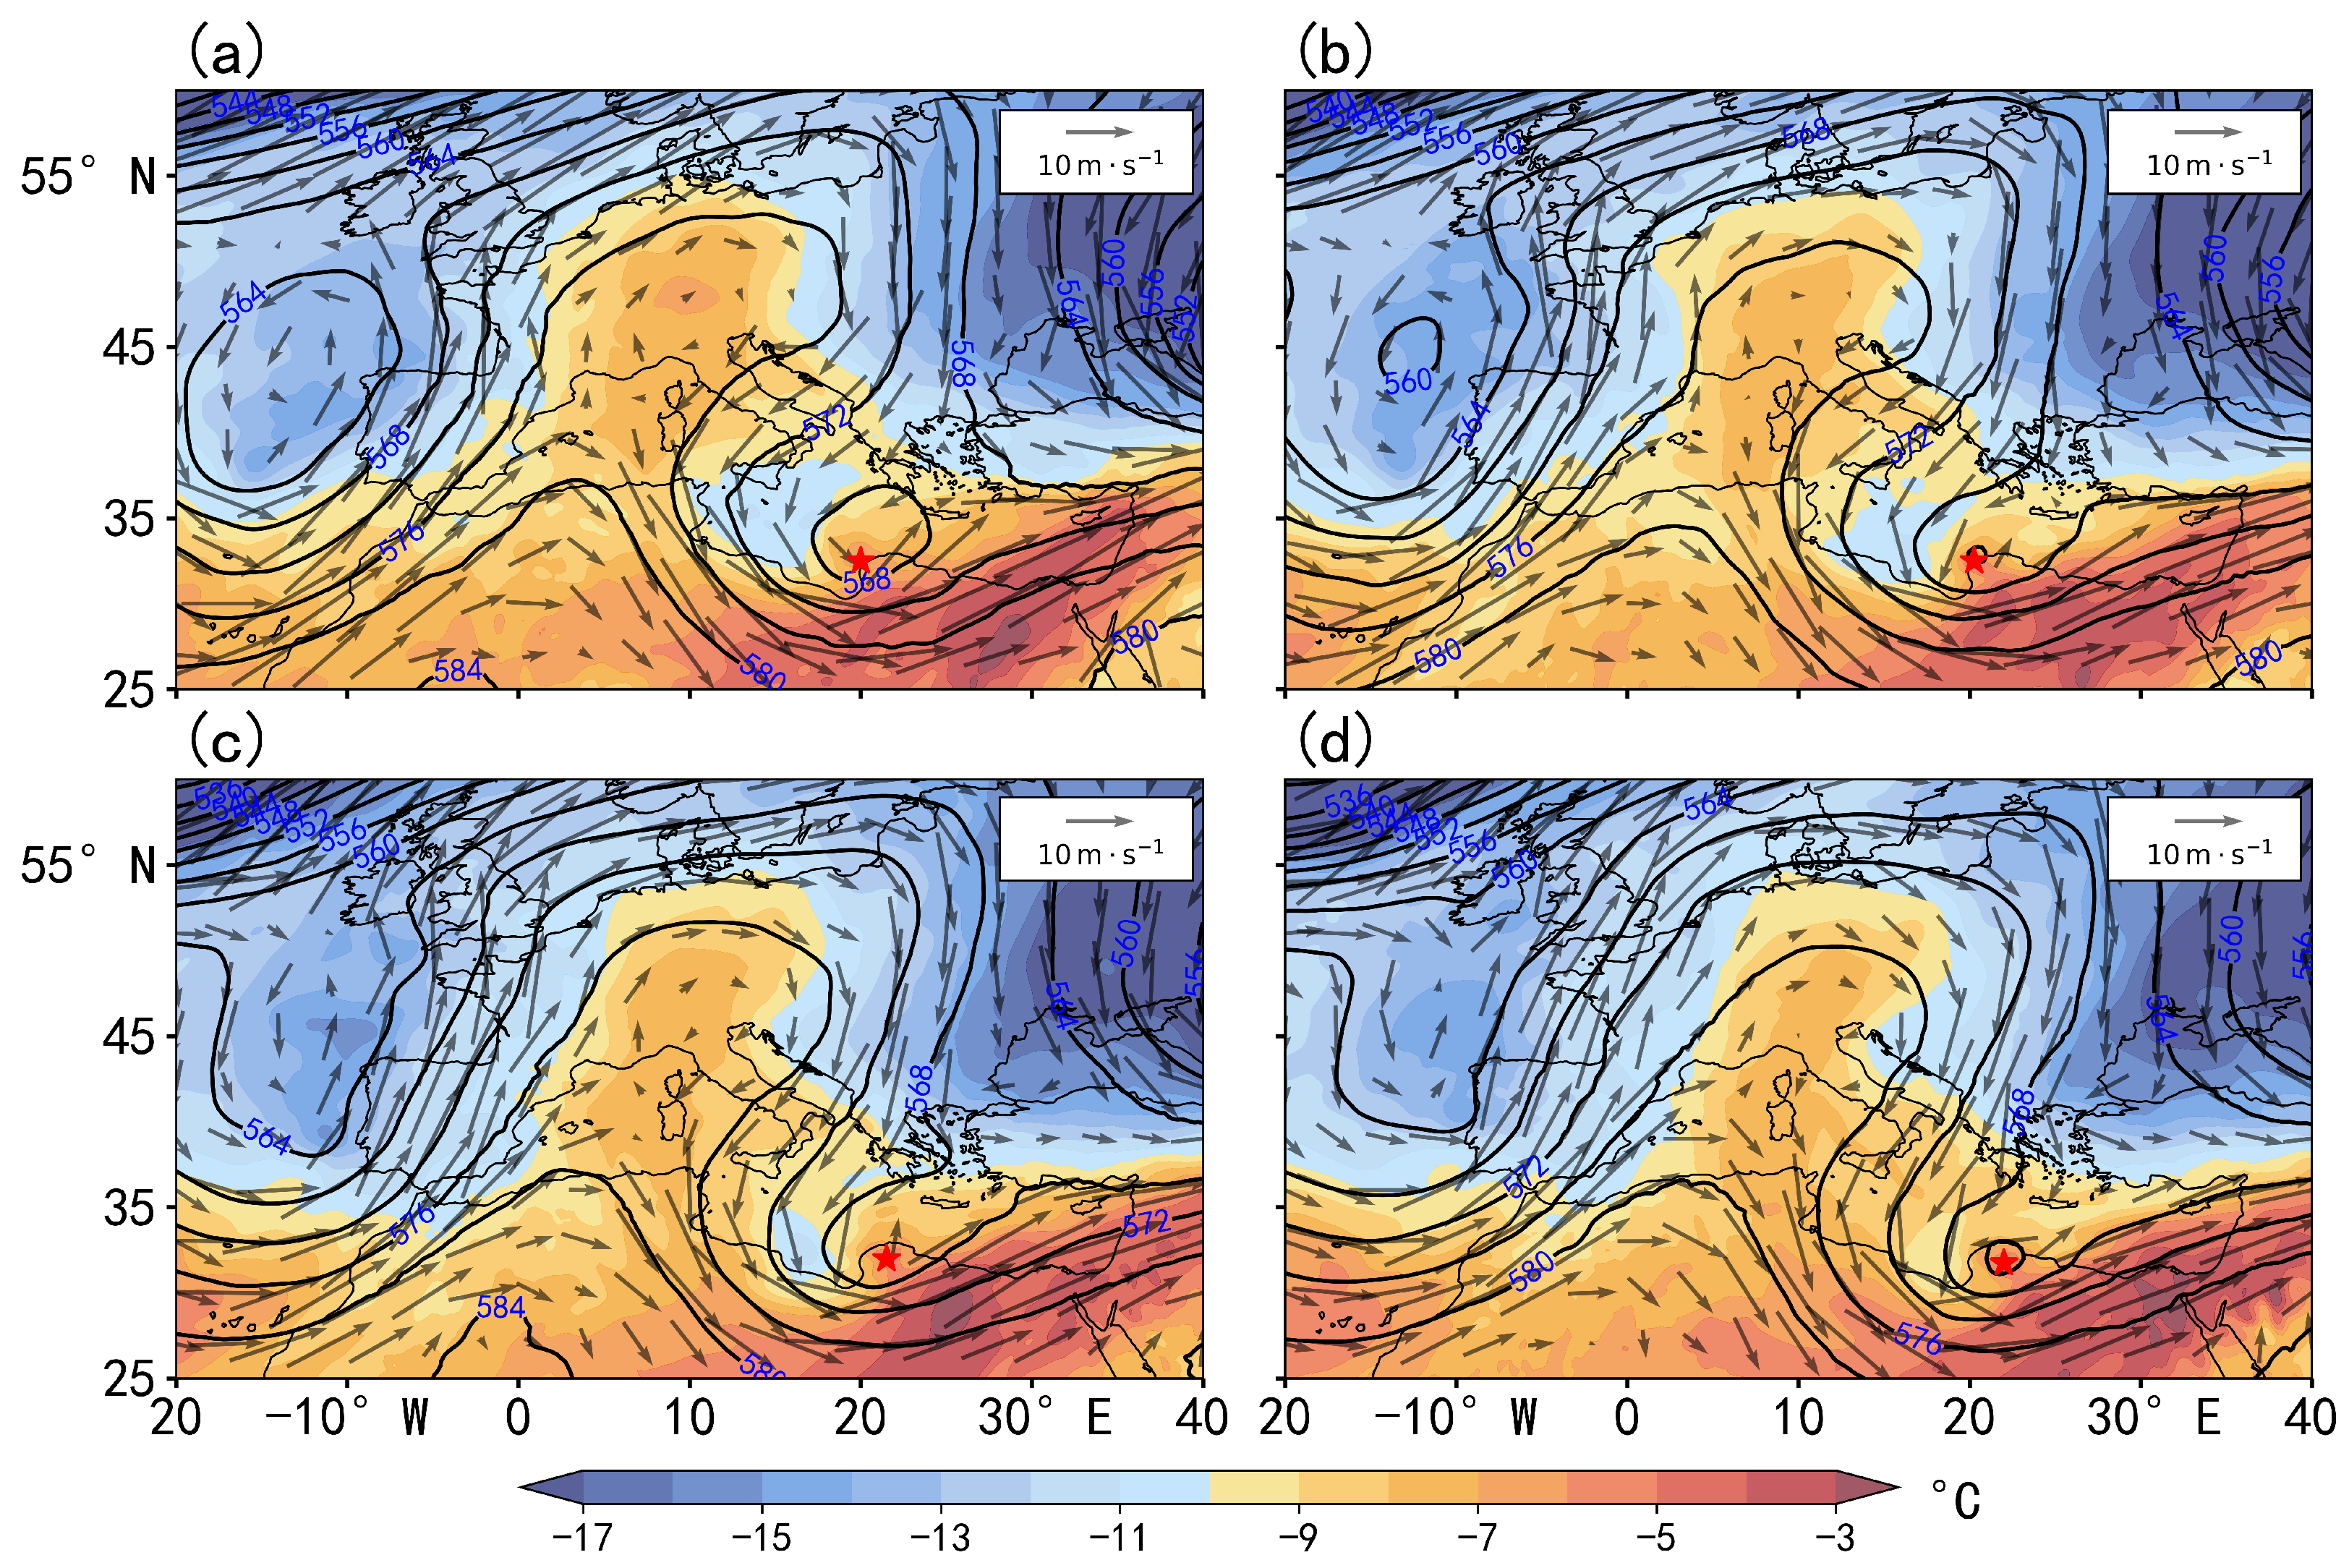
Figure 2 shows the distributions of 500 hPa geopotential height, temperature, and wind fields over the Mediterranean region at different times on 10 September 2023. At 0000 UTC, a cold vortex existed over the eastern Atlantic Ocean, central Europe was dominated by a strong high-pressure ridge with anticyclonic circulation, and northeastern coastal Libya was primarily affected by “Daniel” (Figure 2a). These three systems formed an Ω pattern (“two troughs and one ridge”). The northerly flow ahead of the high-pressure ridge facilitated the southward transport of cold air from high-latitude western Asia, continuously supplying cold air to the medicane’s periphery; meanwhile, the warm air mass in central Europe’s high-pressure ridge extended southeastward to form a warm tongue, which converged with the medicane’s peripheral warm air and inhibited cold air transport by northerly winds.
By 0600 UTC (Figure 2b), the eastern Atlantic cold vortex and central European anticyclone had weakened slightly. Driven by the trough’s steering flow, the medicane moved southeastward and induced landfall over northeastern Libya, with the overall circulation pattern remaining largely unchanged. Over the northwest flank of the medicane, the cold air supply was blocked by the ridge air mass’s eastward-extending warm tongue, causing the upper-level cold air area to shrink continuously; meanwhile, weak cold air was entrained into the medicane’s periphery under the guidance of the trough’s northwest flow. Previous studies have noted that moderate cold air intrusion into the medicane’s periphery can induce cold–warm air confrontation, enhance the environmental temperature gradient, and thus strengthen vorticity [41], serving as a conducive process to the accumulation and release of atmospheric baroclinic energy, stimulating the medicane’s secondary development [42]. From 1200 UTC to 1800 UTC (Figure 2c,d), the cold vortex continued to weaken, while the ridge anticyclone gradually dissipated and shifted southward, leading to the collapse of the Ω pattern.

3.2.2. Circulation Characteristics at 850 hPa in the Lower Troposphere

Figure 3 presents the 850 hPa circulation patterns at different times on 10 September 2023. From 0000 UTC to 1800 UTC, the 850 hPa circulation and temperature distributions exhibited no significant changes. At 0000 UTC (Figure 3a), northeastern Libya began to be affected by “Daniel”. The medicane showed a distinct asymmetric structure, with wind speeds on its western side significantly higher than those on the eastern side. A low-level northwesterly jet stream (wind speed >12 m/s) on the medicane’s western side gradually influenced the northeastern coastal Libya as the medicane moved, continuously transporting abundant moisture from the Mediterranean Sea to the region and providing sufficient water vapor for extreme heavy precipitation. Meanwhile, the cold air mass on the medicane’s western side corresponded to that on the western side of the 500 hPa cyclone, indicating a relatively deep cold air layer. By 0600 UTC (Figure 3b), with the support of the jet stream, cold air on the medicane’s western side further intruded into its periphery. This promoted the secondary development of “Daniel”, allowing the medicane to continue intensifying even after making landfall over Libya, favoring the generation and enhancement of precipitation. At 1200 UTC (Figure 3c), the jet stream over the medicane’s western part intensified and merged with the jet stream over Greece, facilitating increased moisture transport to northeastern Libya. However, the cold air on the medicane’s western side weakened due to insufficient cold air supply. By 1800 UTC (Figure 3d), the jet stream continued to develop, providing sufficient moisture for subsequent convective heavy precipitation in Derna. Additionally, the jet stream facilitated the formation of a distinct cold air channel between two cold air masses, which transported cold air from high-latitude western Asia to supply the medicane’s peripheral cold air. This led to cold air intrusion toward the medicane’s center, inhibiting the medicane’s development [43].
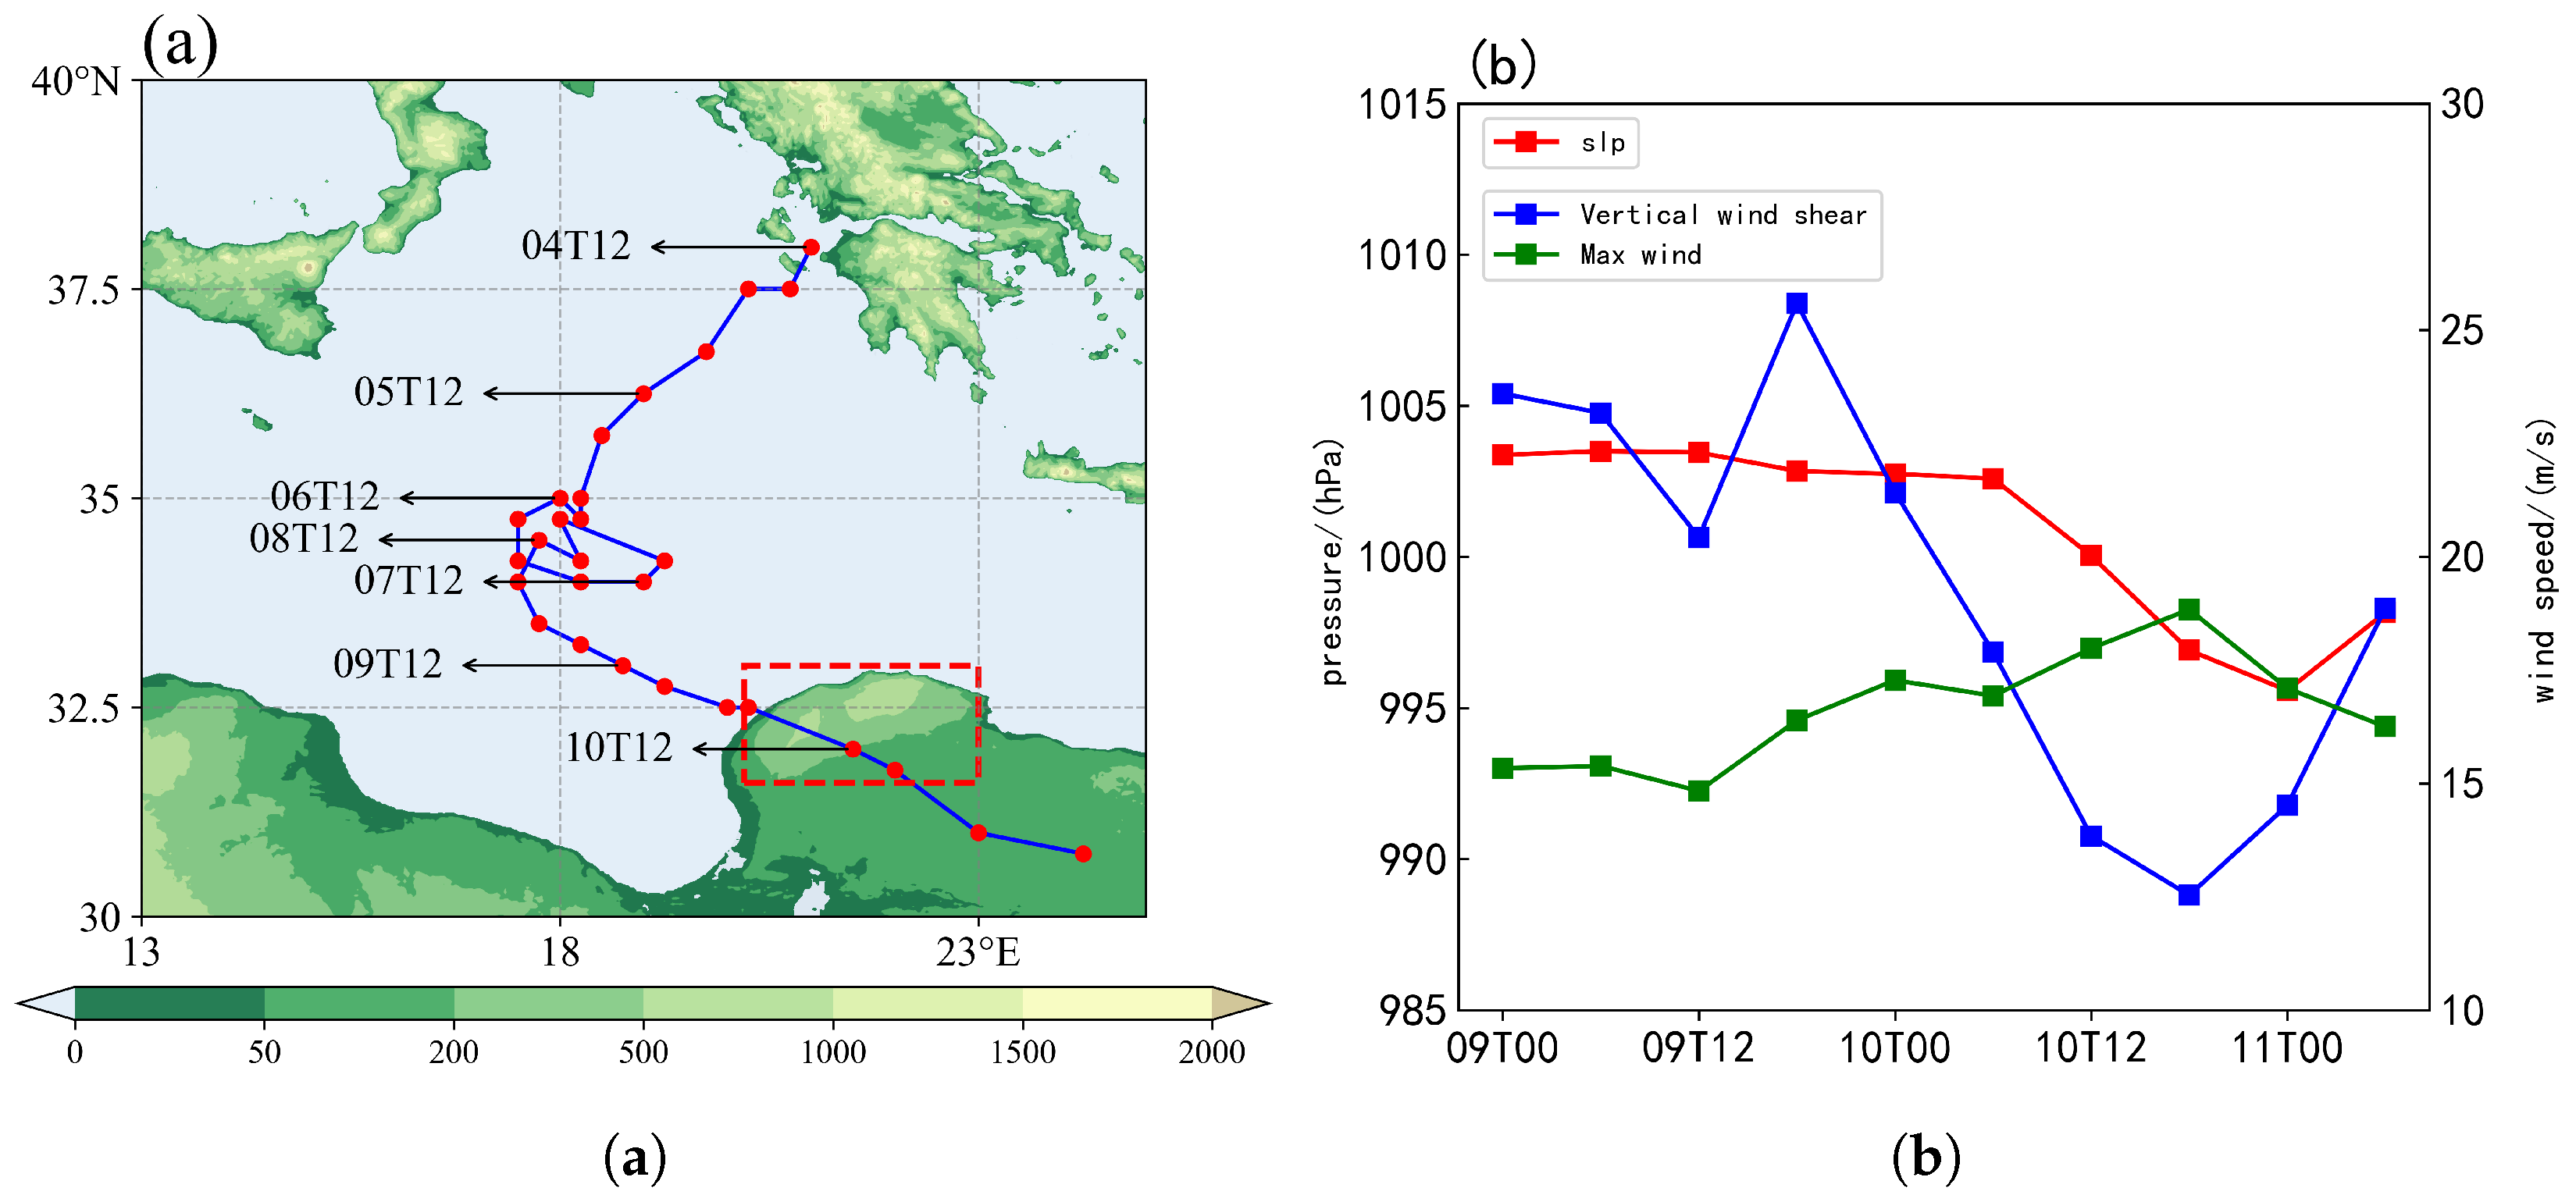
Figure 4a shows the track of “Daniel”. This formed over the Ionian Sea (west of Greece) on 4 September 2023 (UTC). It intensified and moved southward over time, hovering and developing over the central Mediterranean from 6 September onward. On 9 September, the medicane changed direction and moved southeastward toward northeastern coastal Libya, making landfall there on 10 September. Figure 4b presents the evolution of the medicane’s minimum central pressure, VWS, and maximum 2 m surface wind speed before and after landfall. Unlike typical cyclones that weaken continuously after landfall, “Daniel” exhibited a significant post-landfall decrease in central pressure, dropping from about 1004 hPa pre-landfall to a minimum of 995.6 hPa, indicating marked intensification after landfall. This trend is also reflected in the medicane’s maximum wind speed, which increased steadily during its development to a peak of 18.8 m/s. As a key environmental factor influencing medicane intensity, VWS not only modulates cyclone development but also affects cyclone-associated precipitation by altering cyclone strength [44]. Stronger VWS can cause cyclone center tilting and barotropic structure collapse, with its impact on cyclone intensity and structure increasing with magnitude; conversely, weaker VWS promotes cyclone development [45]. The vertical wind shear around “Daniel” began to weaken continuously at 1800 UTC on the 9th, while the cyclone intensity kept strengthening after landfall. The wind shear weakened to its minimum at 1800 UTC on the 10th and then gradually increased, and the cyclone intensity also started to weaken afterward. It can be seen that the change in environmental vertical wind shear around the cyclone may be one of the reasons why “Daniel” continued to develop after landfall.

3.3. Causes of Extreme Precipitation

3.3.1. Moisture Conditions

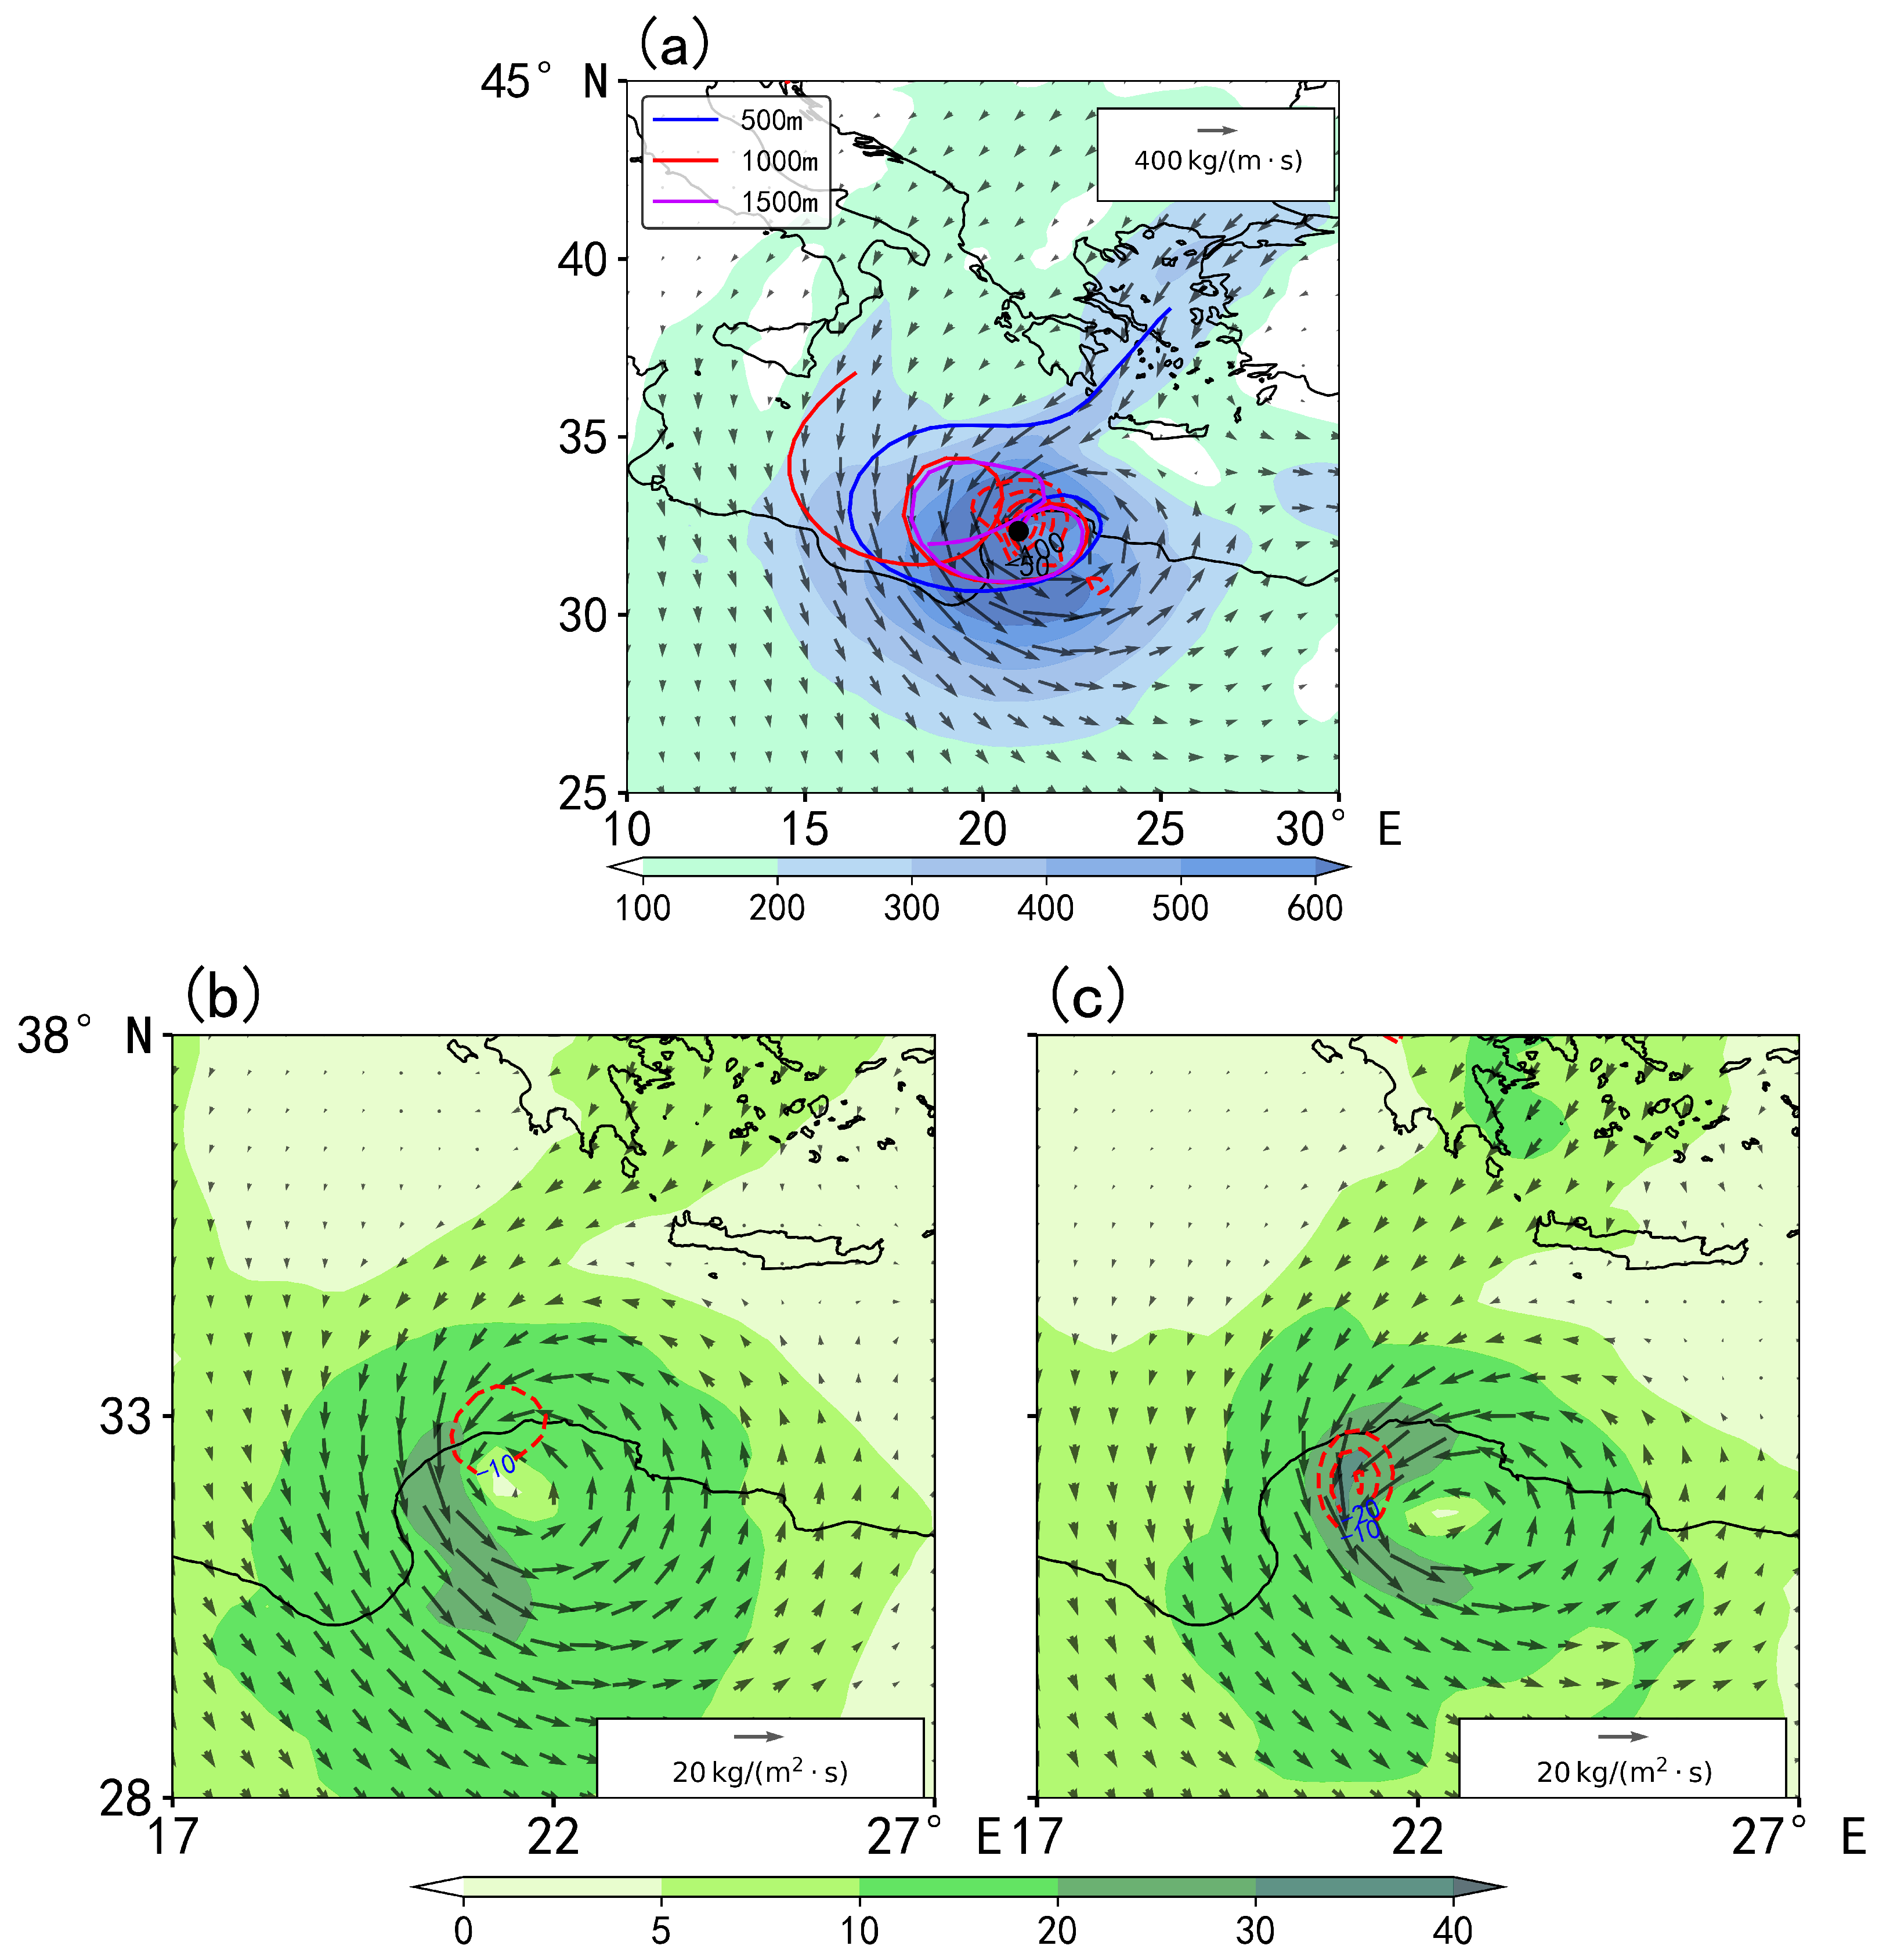
Adequate moisture supply is a critical factor for extreme heavy precipitation [46,47]. Northeastern coastal Libya is perennially arid with minimal rainfall, so local moisture conditions are insufficient to drive such extreme events; therefore, external moisture transport is essential. Since water vapor is primarily concentrated below 300 hPa, this study calculates the integrated column water vapor flux by integrating water vapor flux from 300 hPa to 1000 hPa.
From the perspective of water vapor transport before and after “Daniel’s” landfall (Figure 5a), moisture for the entire extreme rainstorm originated mainly from the moisture channel on the extratropical medicane’s western side. This channel was associated with the northwesterly low-level jet stream (Figure 3), which persisted throughout the precipitation process and provided abundant moisture. The Mediterranean Sea, meanwhile, provided abundant water vapor for Cyclone “Daniel”. To quantitatively analyze the source and transport characteristics of water vapor, the Lagrangian trajectories of air parcels at different levels over the heavy precipitation area for a 48 h period starting at 12:00 UTC on 10 September were simulated using the HYSPLIT model (Figure 5a). The results show that three water vapor channels continuously transported water vapor into the cyclone: specifically, from west to east, the channels originated from the Ionian Sea (eastern Italy), the Aegean Sea (eastern Greece), and the northeastern coastal area of Libya, respectively. These water vapor channels were crucial factors enabling the cyclone to maintain its strength for an extended period and redevelop after landing. Strong convergence of the total atmospheric column water vapor flux occurred near the medicane’s landfall area, indicating significant local moisture accumulation. Notably, this convergence zone coincided with the maximum accumulated precipitation area in Figure 1a, further confirming that adequate moisture supply and strong moisture convergence are crucial for heavy precipitation formation.
Distributions of 850 hPa water vapor flux (Figure 5b,c) show that moisture from the seas adjacent to medicane “Daniel” and from the Aegean Sea to the medicane was transported and converged into the medicane’s western-side low-level jet stream. This led to an asymmetric water vapor flux distribution around the medicane, with significantly higher flux on the western side than the eastern side—consistent with the location of heavy precipitation areas. Similarly, the water vapor flux convergence zone was situated on the medicane’s western side, overlapping with both the water vapor flux high-value zone and the precipitation high-value zone (Figure 2a). This further verifies that adequate moisture supply and strong moisture convergence are important conditions for extreme heavy precipitation. Compared with 1200 UTC 10 September, the overlapping area of water vapor flux divergence and water vapor flux was wider and more intense at 1800 UTC 10 September. As the medicane moved, this area also shifted southward to central Derna, indicating sufficient local moisture, which, combined with strong convergent ascending motion, favored the formation of convective heavy precipitation.

3.3.2. Dynamic Conditions

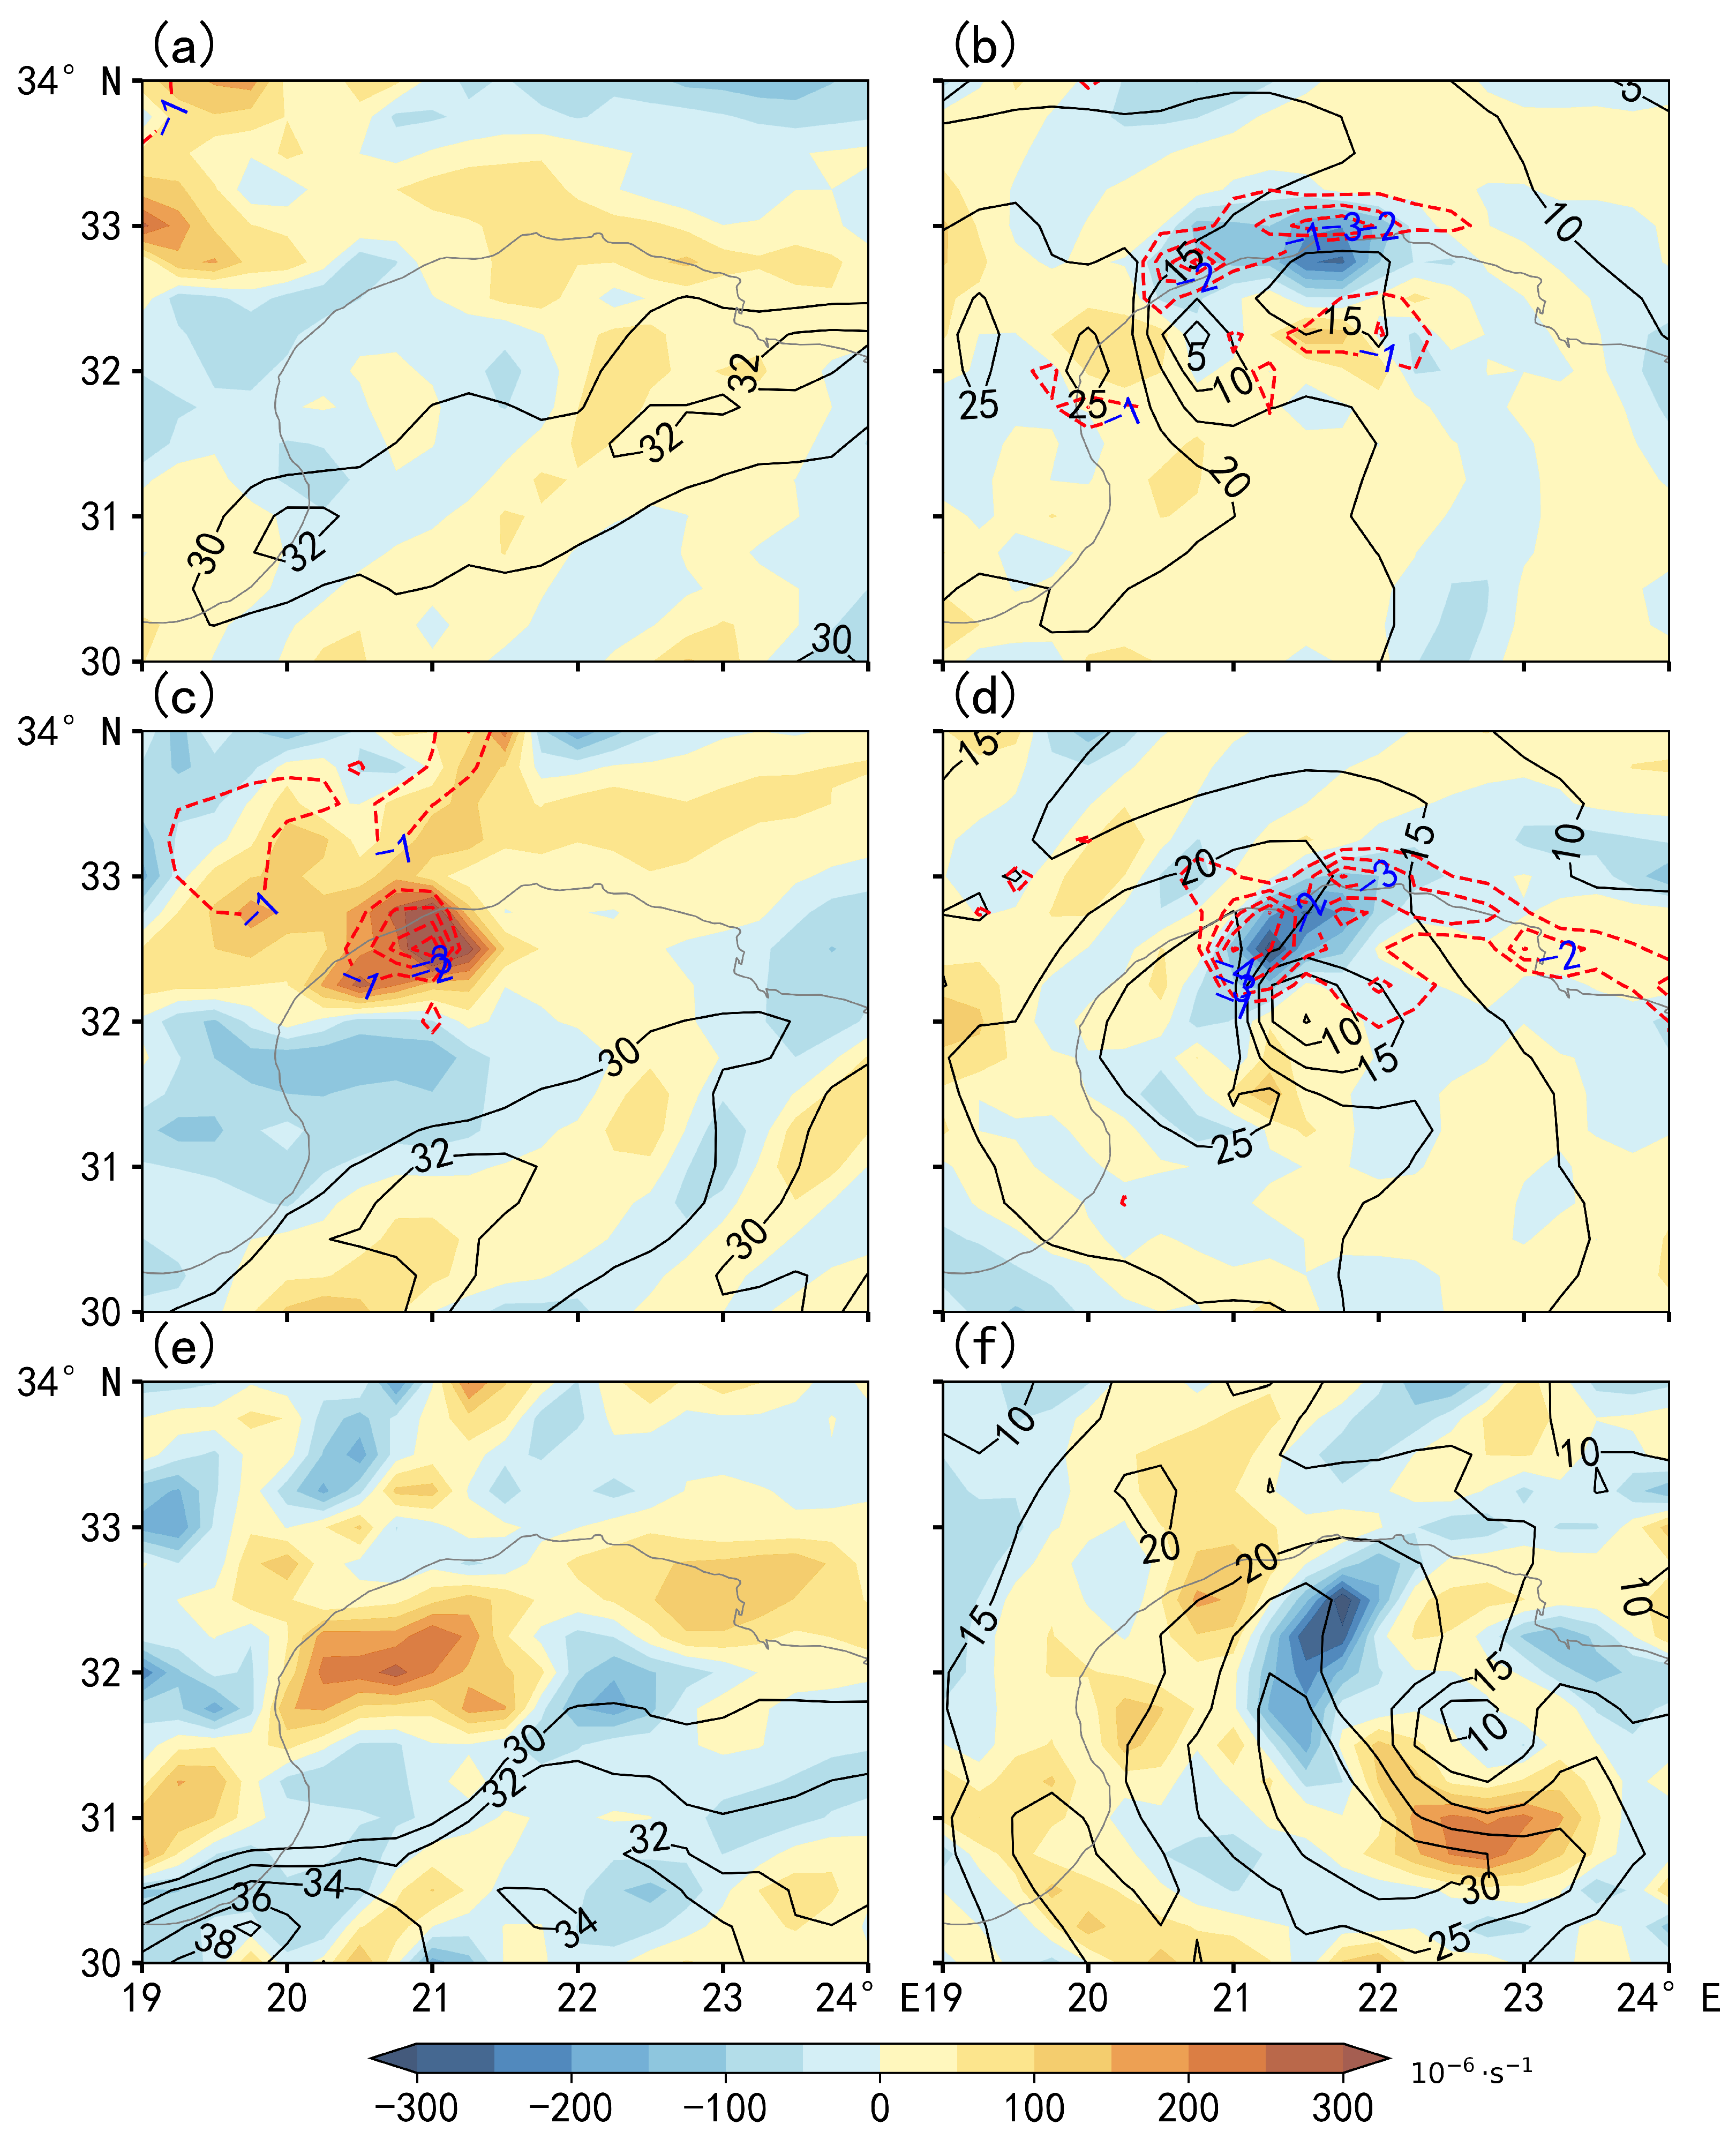
Existing studies have demonstrated that strong upper-level divergent flow over a cyclone promotes enhanced low-level convergence, thereby extending the overland maintenance period of the cyclone’s low-pressure system [48,49]. During the landfall of “Daniel” (Figure 6a,b), no significant convergence or divergence was observed at 300 hPa over northeastern Libyan coastal areas. In contrast, weak convergent ascending motion was present along the coast at 850 hPa. These features indicate that convective activity had not yet initiated at this stage; coastal precipitation was primarily driven by the medicane’s peripheral cloud systems, manifesting as continuous precipitation.
At 1200 UTC 10 September (Figure 6c,d), a positive-value zone emerged at 300 hPa over the coastal areas, signifying the development and intensification of an upper-level divergence area. Based on 300 hPa wind speed data, this area is located on the left side of the upper-level jet stream exit region; under the influence of geostrophic deviation, this position favors further development and enhancement of the upper-level divergence zone. Meanwhile, the 850 hPa convergence zone shifted southward with a concurrent increase in intensity, which is likely associated with orographic lifting (Figure 4a). A maximum vertical velocity exceeding 4 Pa/s was detected in the overlapping region of low-level convergence and upper-level divergence. This finding reveals that the coupling of upper-level divergence and low-level convergence dynamically drives atmospheric ascending motion, providing favorable conditions for the initiation and development of severe convective weather. At this stage, the northwesterly low-level jet stream in the medicane’s western sector also migrated to the Libyan coast alongside the medicane; while transporting water vapor to the region, the cyclonic vorticity on the jet stream’s eastern side further facilitated convergence zone development. By 1800 UTC 10 September (Figure 6e,f), although upper-level divergence over Libyan coastal areas had weakened, the further development of the low-level jet stream, which is coupled with substantial latent heat released by earlier precipitation, supported the further development of convective activity.
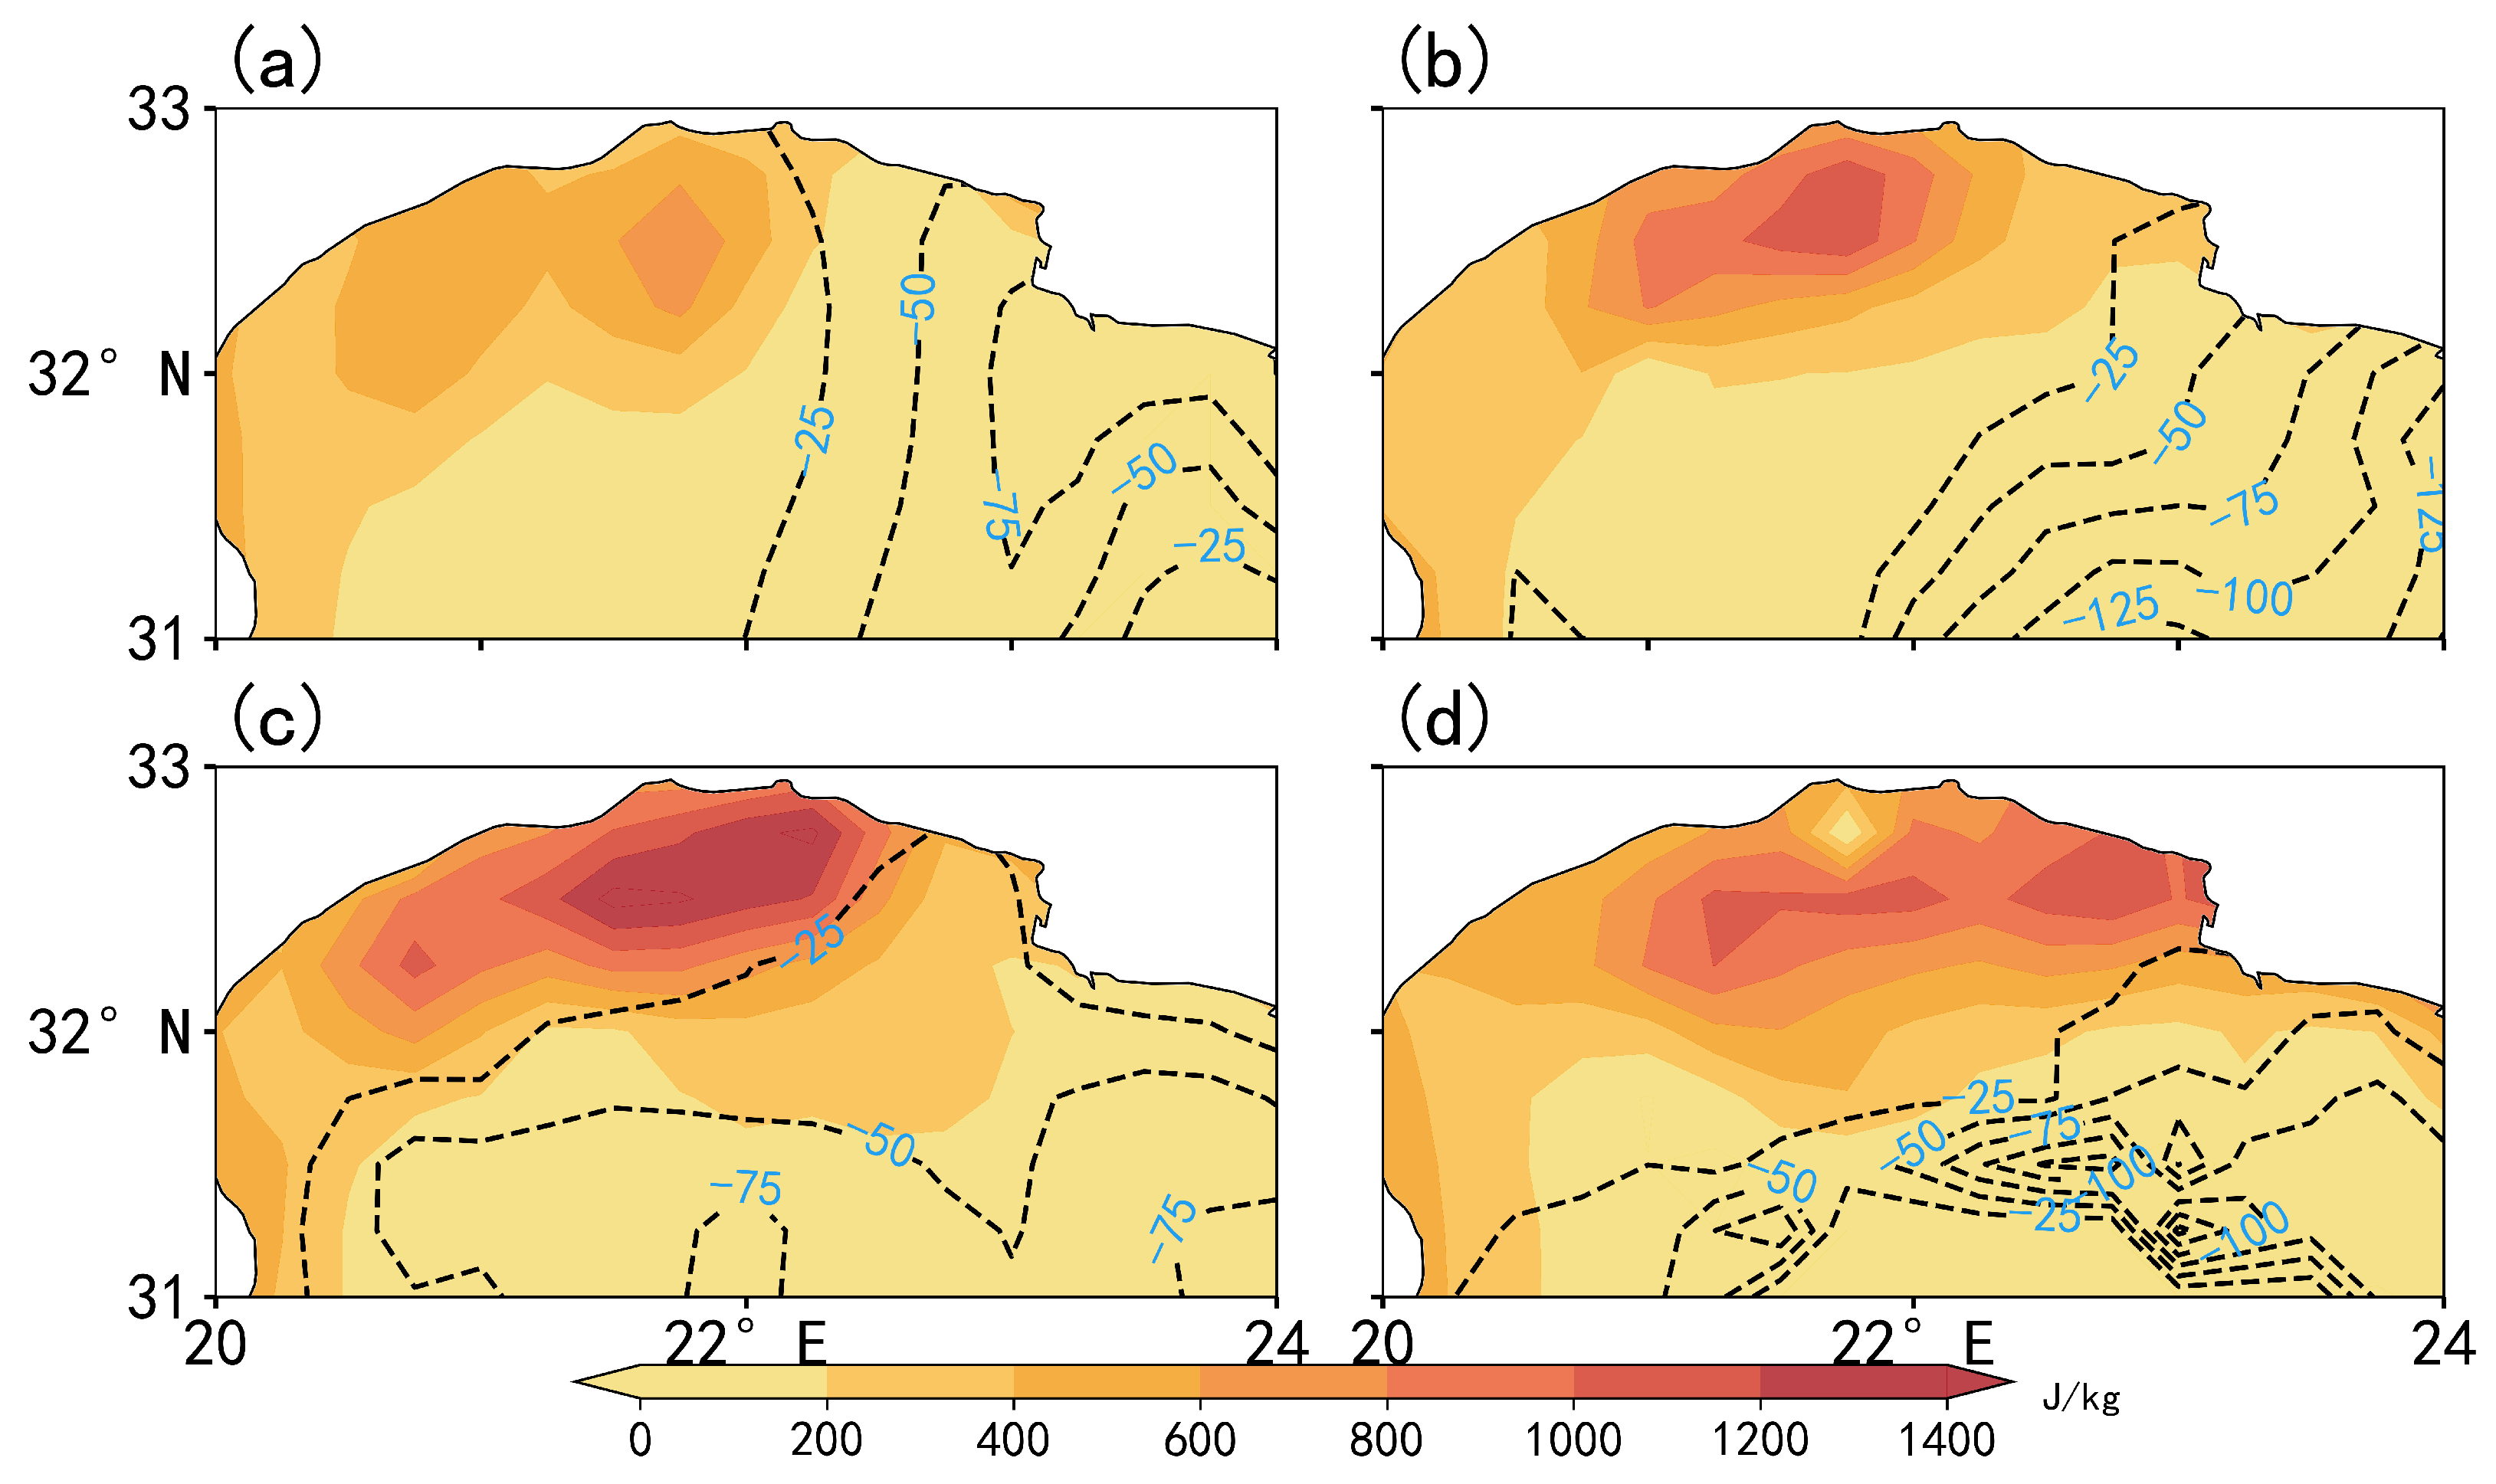
Studies have shown that severe convective activities are closely linked to convective available potential energy (CAPE) and convective inhibition (CIN). Specifically, larger CAPE and smaller absolute values of CIN increase the likelihood of convection initiation [50]. For extreme heavy precipitation processes dominated by convective precipitation, vertical ascending velocity is primarily associated with CAPE release, while convective development height is closely tied to CAPE magnitude [51]. An analysis of CAPE and CIN (Figure 7) reveals that over Libyan coastal areas, CAPE developed continuously from 0000 UTC to 1200 UTC 10 September, peaking at over 1400 J/kg. Concurrently, convective development height reached its maximum, and CIN in this region remained relatively small. These features indicate unstable atmospheric stratification, which strongly favored convective initiation and thus provided favorable conditions for subsequent extreme heavy precipitation in Derna. By 1800 UTC 10 September (Figure 7d), CAPE began to decrease, convective development height declined, and convective activity intensity weakened accordingly. The spatial distribution of CAPE was highly consistent with the precipitation area, effectively reflecting the location of precipitation. Meanwhile, the CAPE high-value zone (>800 J/kg) corresponded to the region of severe convection, indicating significant atmospheric instability here. Under the suction effect of the secondary circulation, large amounts of water vapor were forced to ascend and condense, forming severe convective precipitation.

3.4. Impact of Topography and SST Anomalies

The above analysis primarily explored the drivers of this extreme precipitation event using synoptic meteorological approaches. However, do external forcings, such as Mediterranean SST and topography, also exert impacts on this extreme heavy precipitation? To address this question, we further investigate the influences of Mediterranean SST anomalies and the topography of northern Libya on the event through a series of numerical experiments.

3.4.1. Impact of Topography

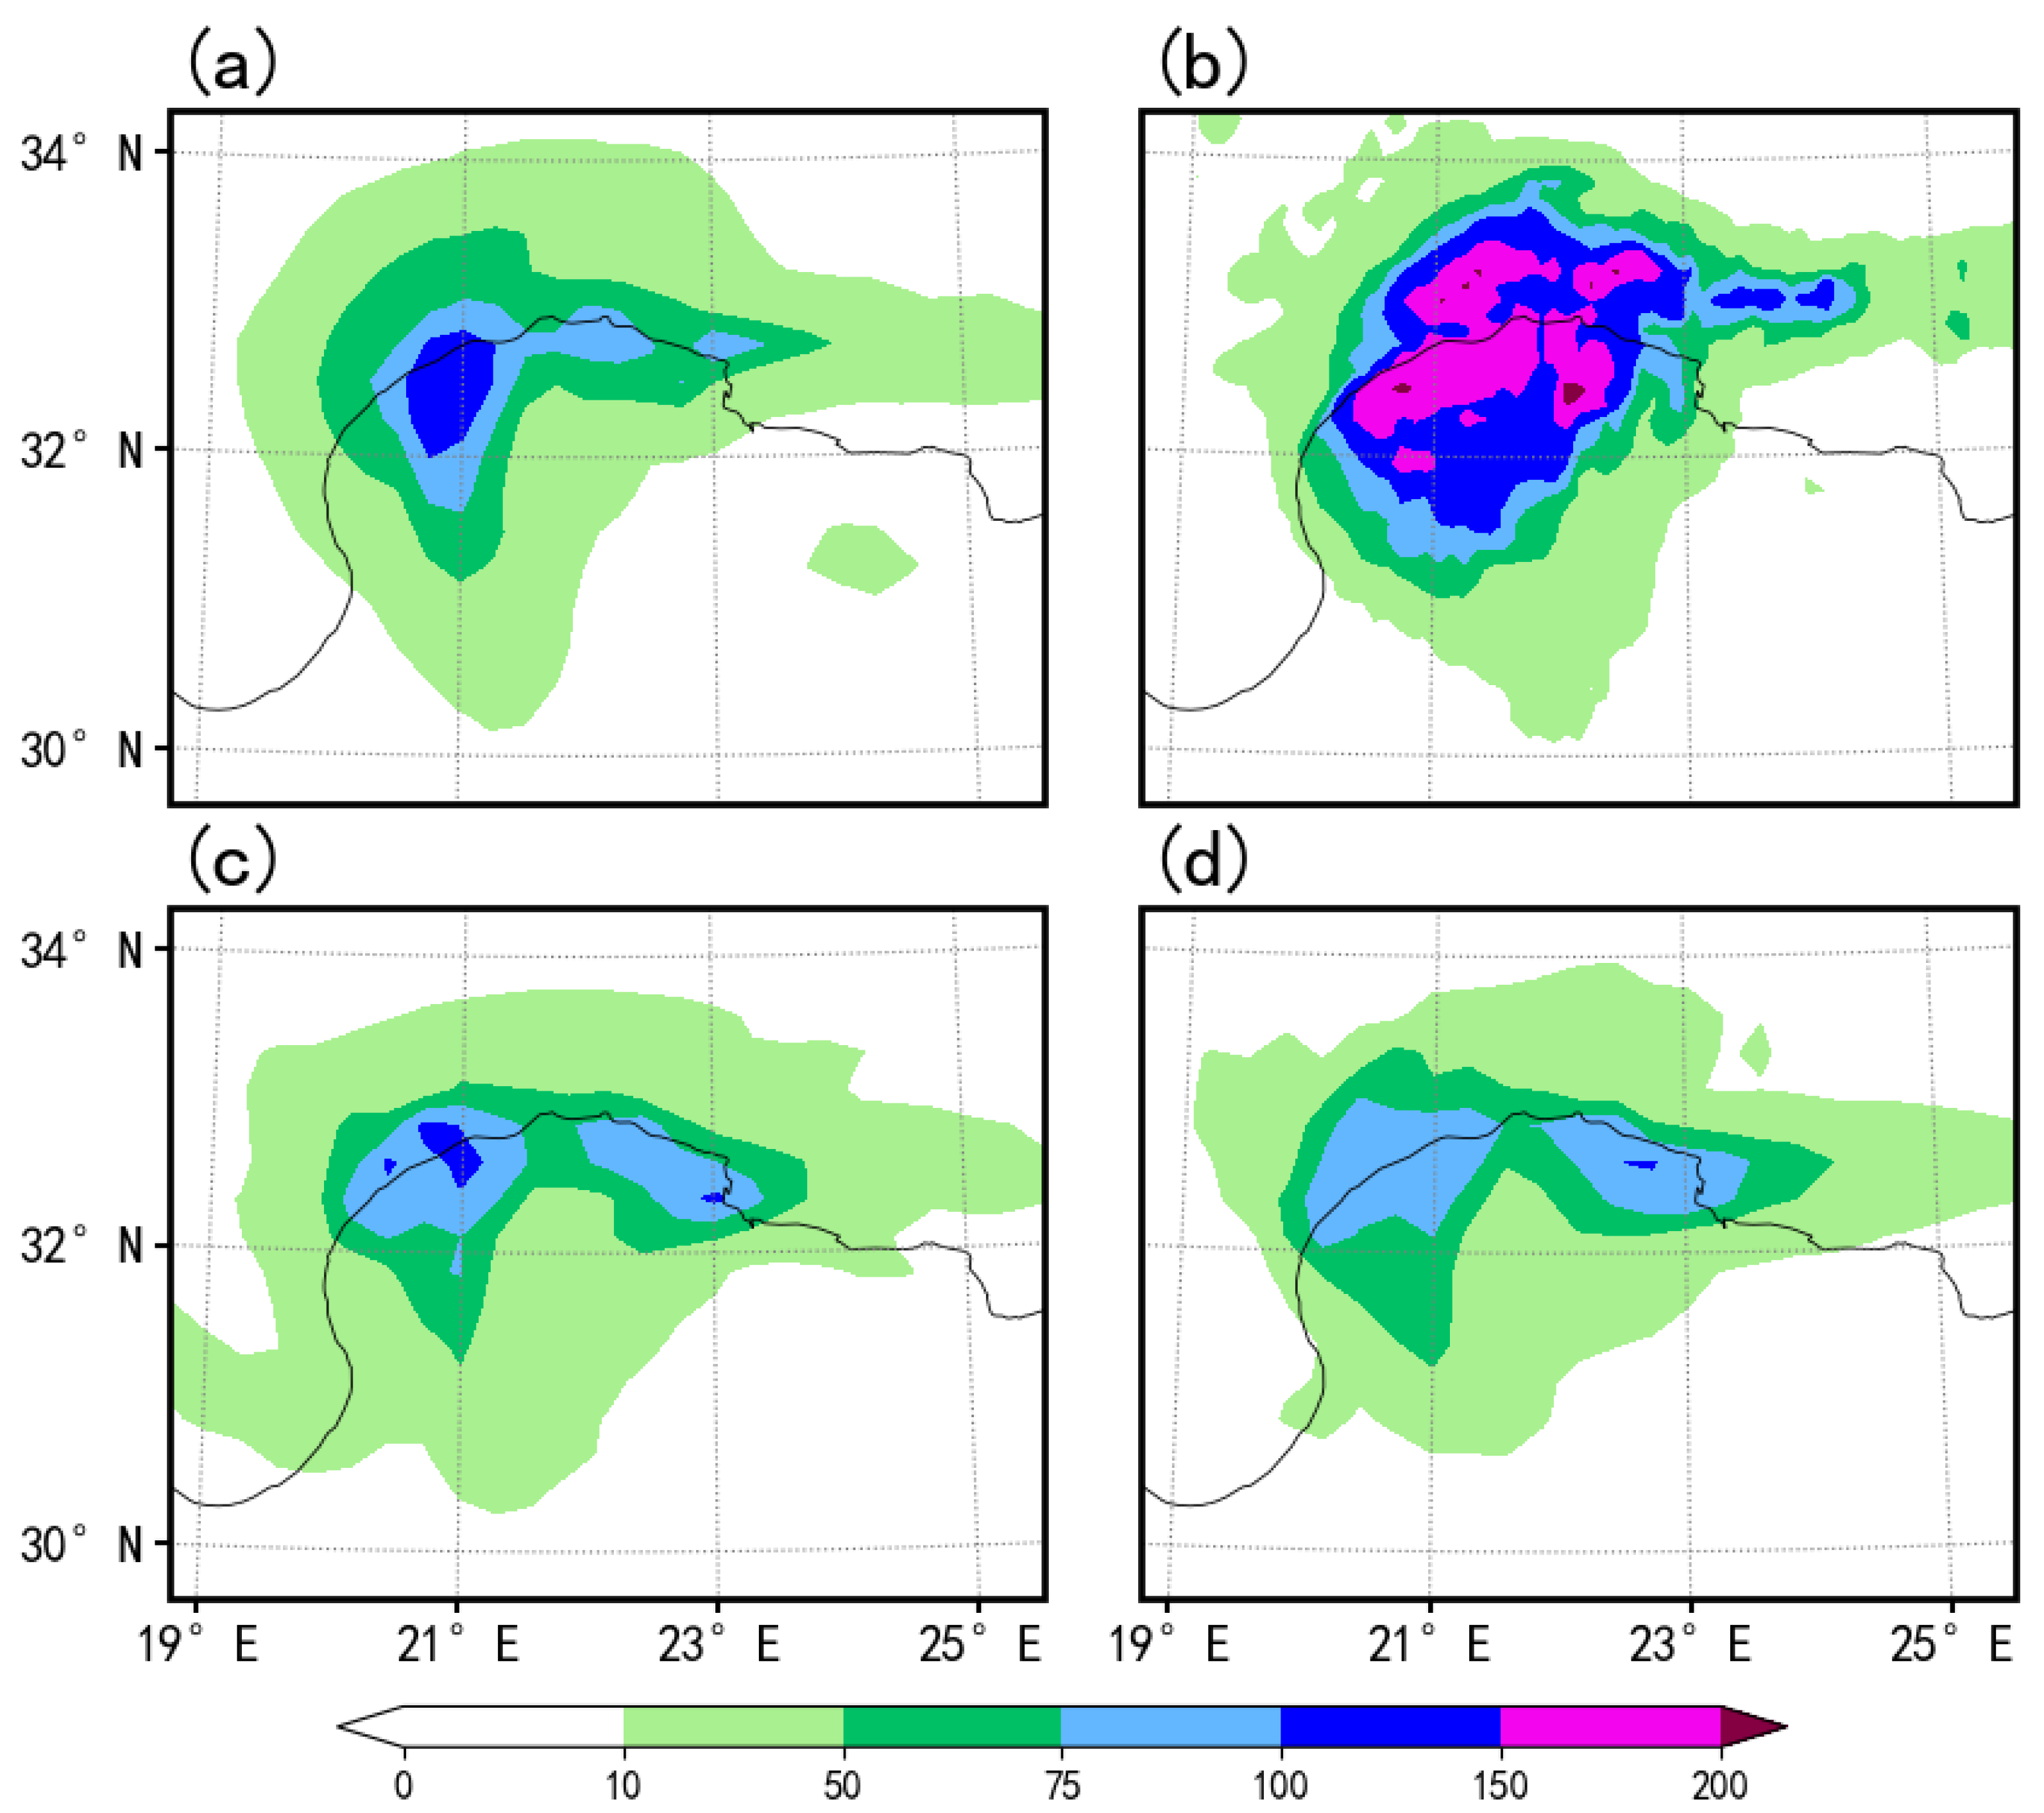
Figure 8 presents the 24 h accumulated precipitation distributions from the simulation experiments driven by ERA5, satellite data, FNL data, and ERA data. By comparing Figure 8a,b, it can be observed that although there exists a significant difference between the 24 h accumulated precipitation from ERA5 and that from satellite data, the regions of heavy precipitation are generally consistent. By comparing ERA5 with the two sets of simulation experiments (Figure 8c,d), the results of accumulated precipitation are generally similar. However, the area of heavy precipitation simulated by FNL is more consistent with the ERA5 reanalysis data. Therefore, FNL data was used for the simulation and sensitivity experiments in this study.
Topography is critical for extreme heavy precipitation [52]. An approximately east–west mountain (Jabal al Akhdar) range runs along northeastern Libya’s coast (Figure 4a), and, as shown in Figure 1a, areas with >150 mm 24 h accumulated precipitation are mainly on its windward slope. This is likely due to orographic lifting: the northwesterly low-level jet (west of “Daniel”) forms precipitation when encountering this terrain.
To further reveal the impact of Jabal al Akhdar on this extreme precipitation event, this study used FNL data to drive the WRF4.0 model for sensitivity experiments by modifying terrain height in northeastern Libya’s coast (31°–33° N, 20°–24° E; red line in Figure 9b). Two experiments were designed: (1) a control experiment (unmodified terrain); (2) a sensitivity experiment (terrain adjusted to a plain, height = 5 m). Figure 8 shows the 24 h accumulated precipitation from both experiments and their differences.
Comparing the sensitivity and control experiments, removing terrain shifts the simulated heavy precipitation center from the coast to inland (Figure 9b), and the >75 mm precipitation range also changes. The control–sensitivity difference map (Figure 9c) shows coastal mountain increase coastal precipitation by >10 mm, with a maximum 57 mm increment in Derna, a city in northeastern Libya. This confirms that Jabal al Akhdar significantly affects precipitation distribution: this mountain range traps part of the precipitation on the windward side via orographic lifting, while orographic forced ascent and convergence notably enhance convective heavy precipitation intensity there.

3.4.2. Impact of SST

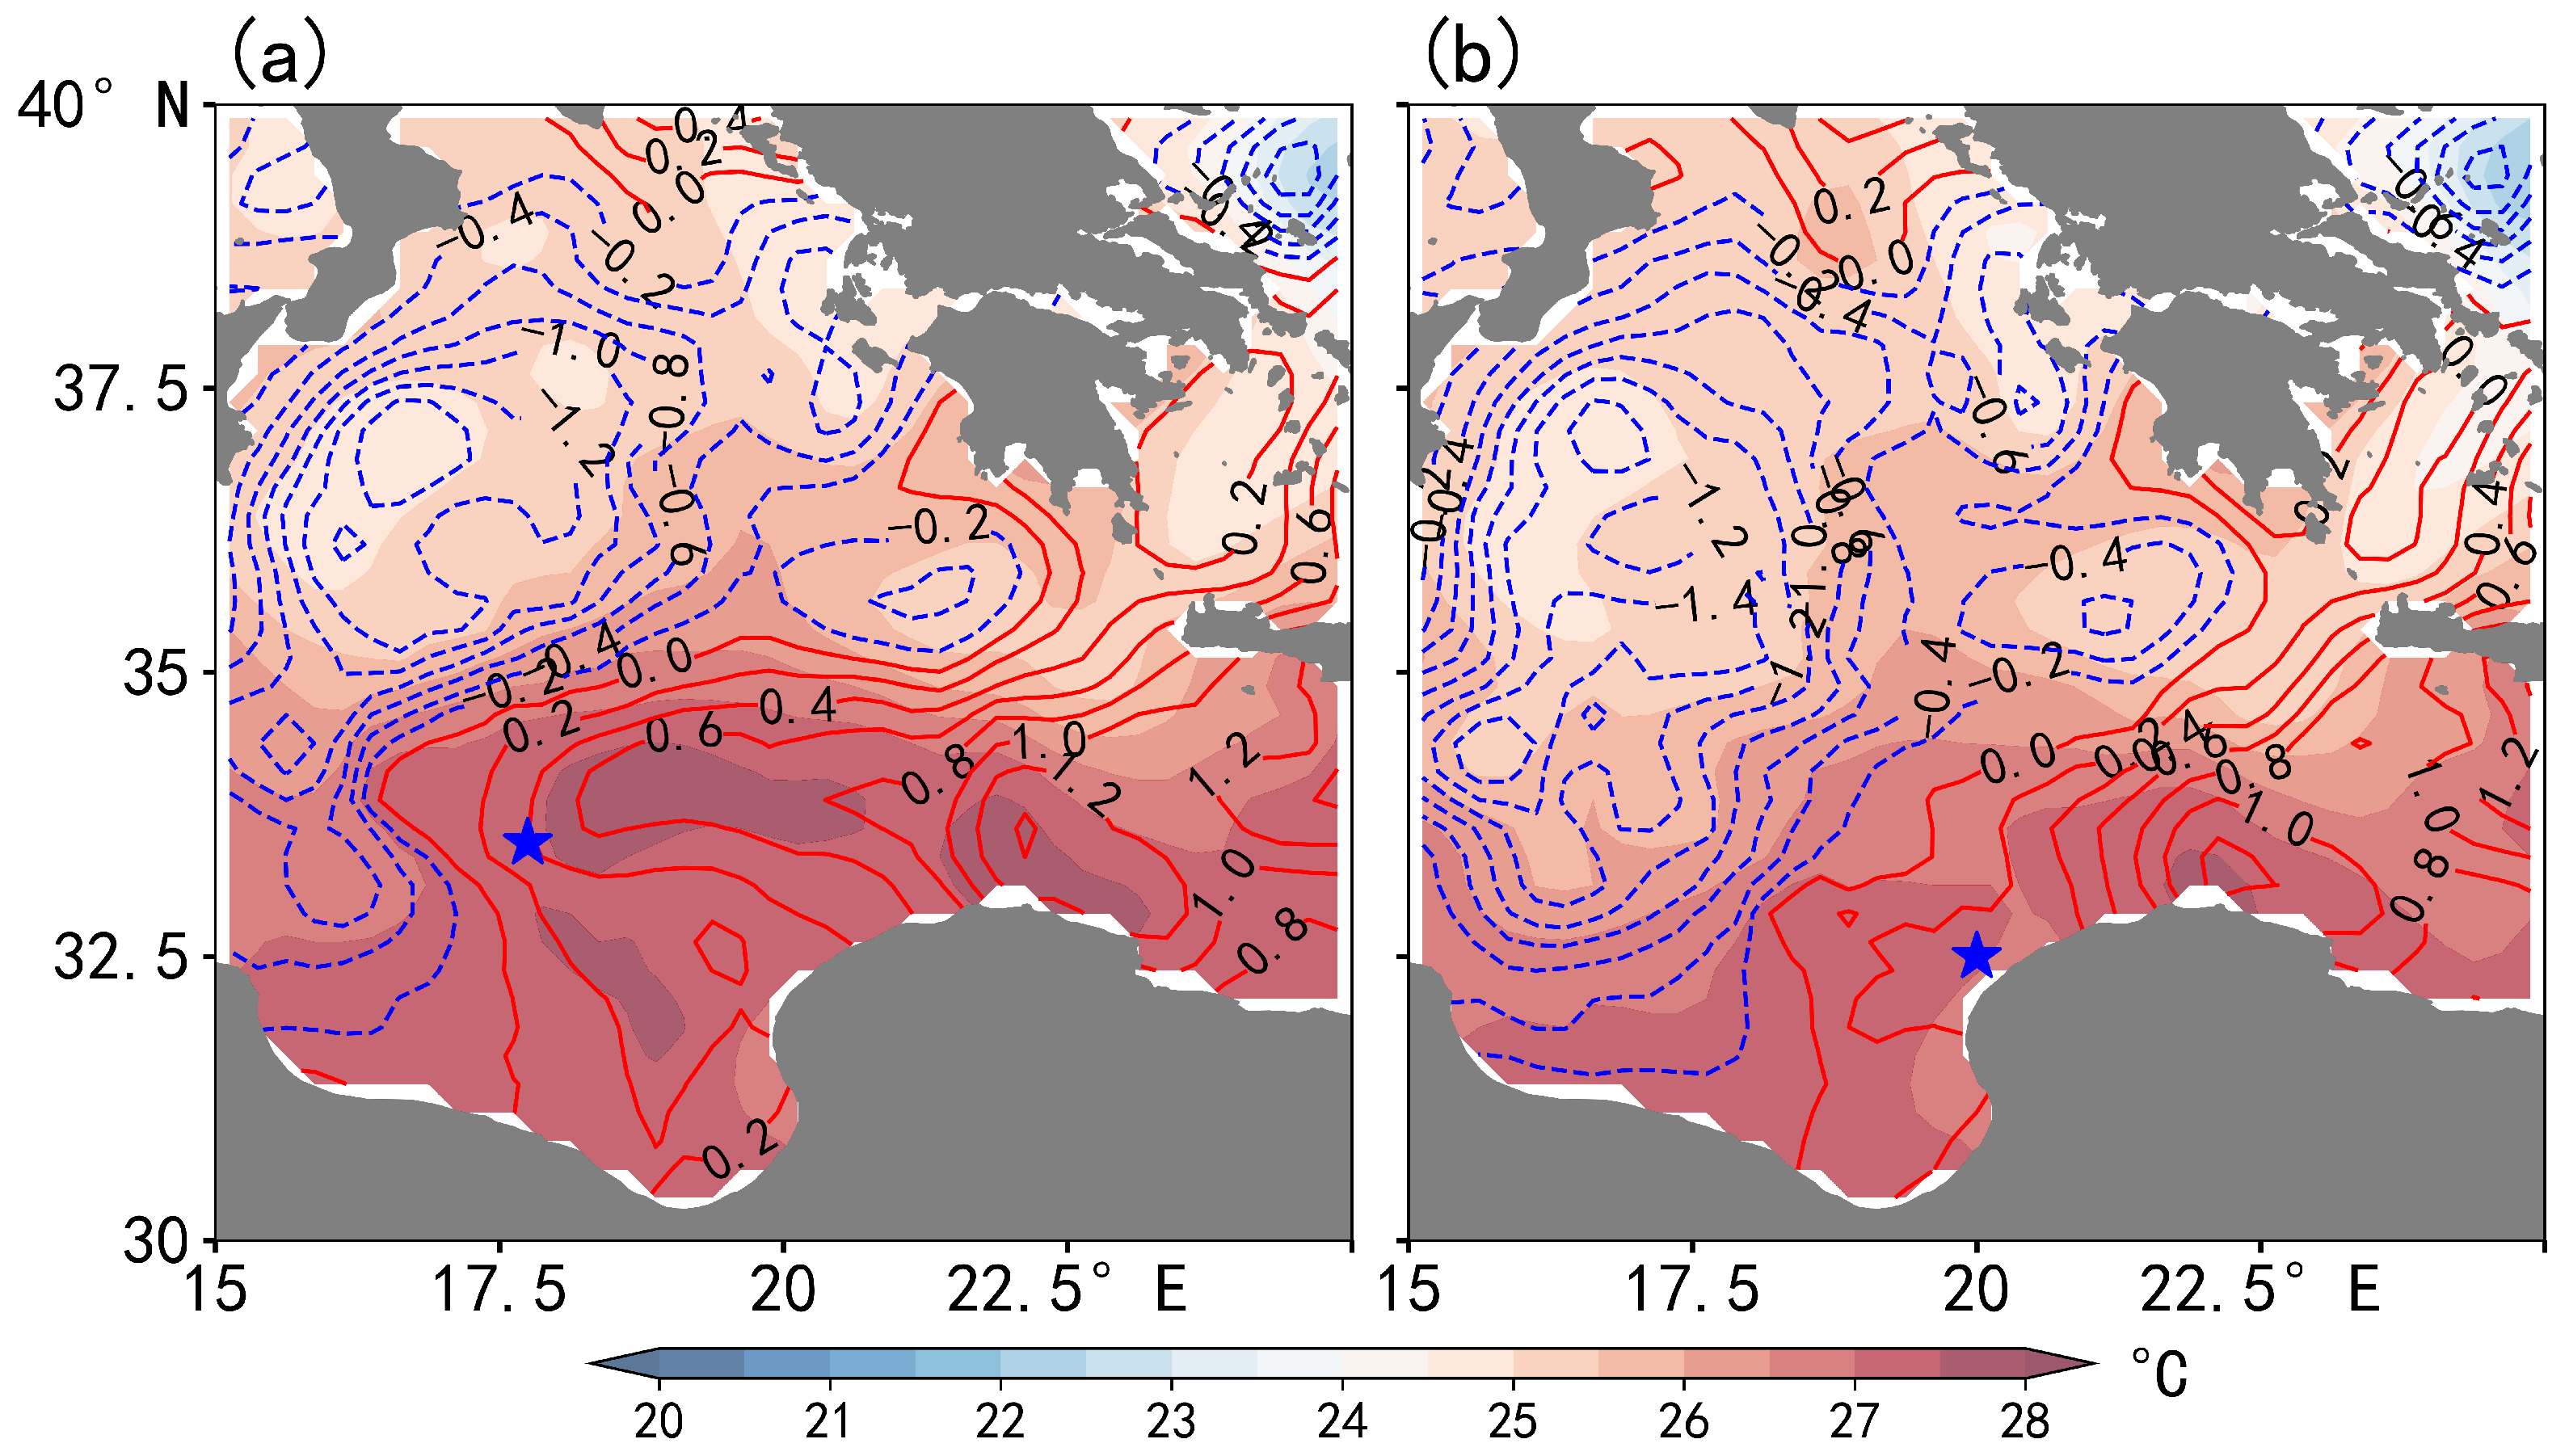
From the perspective of Mediterranean SST before and after the landfall of “Daniel” (Figure 10), the overall Mediterranean SST exceeded 24°C—such warm waters act as a cradle for medicane formation and development. Notably, the SST off northern Libya was significantly higher than the multi-year average for the same period, with a maximum positive anomaly of up to 1.42°C in some areas. In contrast, the Ionian Sea exhibited negative SST anomalies relative to previous years, and the extent of these anomalies expanded over time. This SST cooling anomaly is primarily driven by two factors: first, medicane passage induced upwelling of colder subsurface seawater, lowering surface temperatures; second, heavy precipitation associated with the medicane further reduced SST in the affected region. The Mediterranean’s anomalous SST distribution—coupled with the tendency of medicane to migrate toward warmer waters—facilitated a track deflection of “Daniel” on the 9th, steering it toward northeastern Libya. The anomalous warm SST ahead of the cyclone’s track supplied energy to the atmosphere, which was conducive to maintaining the cyclone’s intensity and also provided sufficient energy, facilitating the development of the cyclone after landing. Meanwhile, the warm SST also promoted extensive seawater evaporation, increasing the water vapor content into the atmosphere. The cyclone that continued to develop after landing, combined with the abundant water vapor supplied by the ocean surface, created favorable conditions for the formation of extreme heavy precipitation.
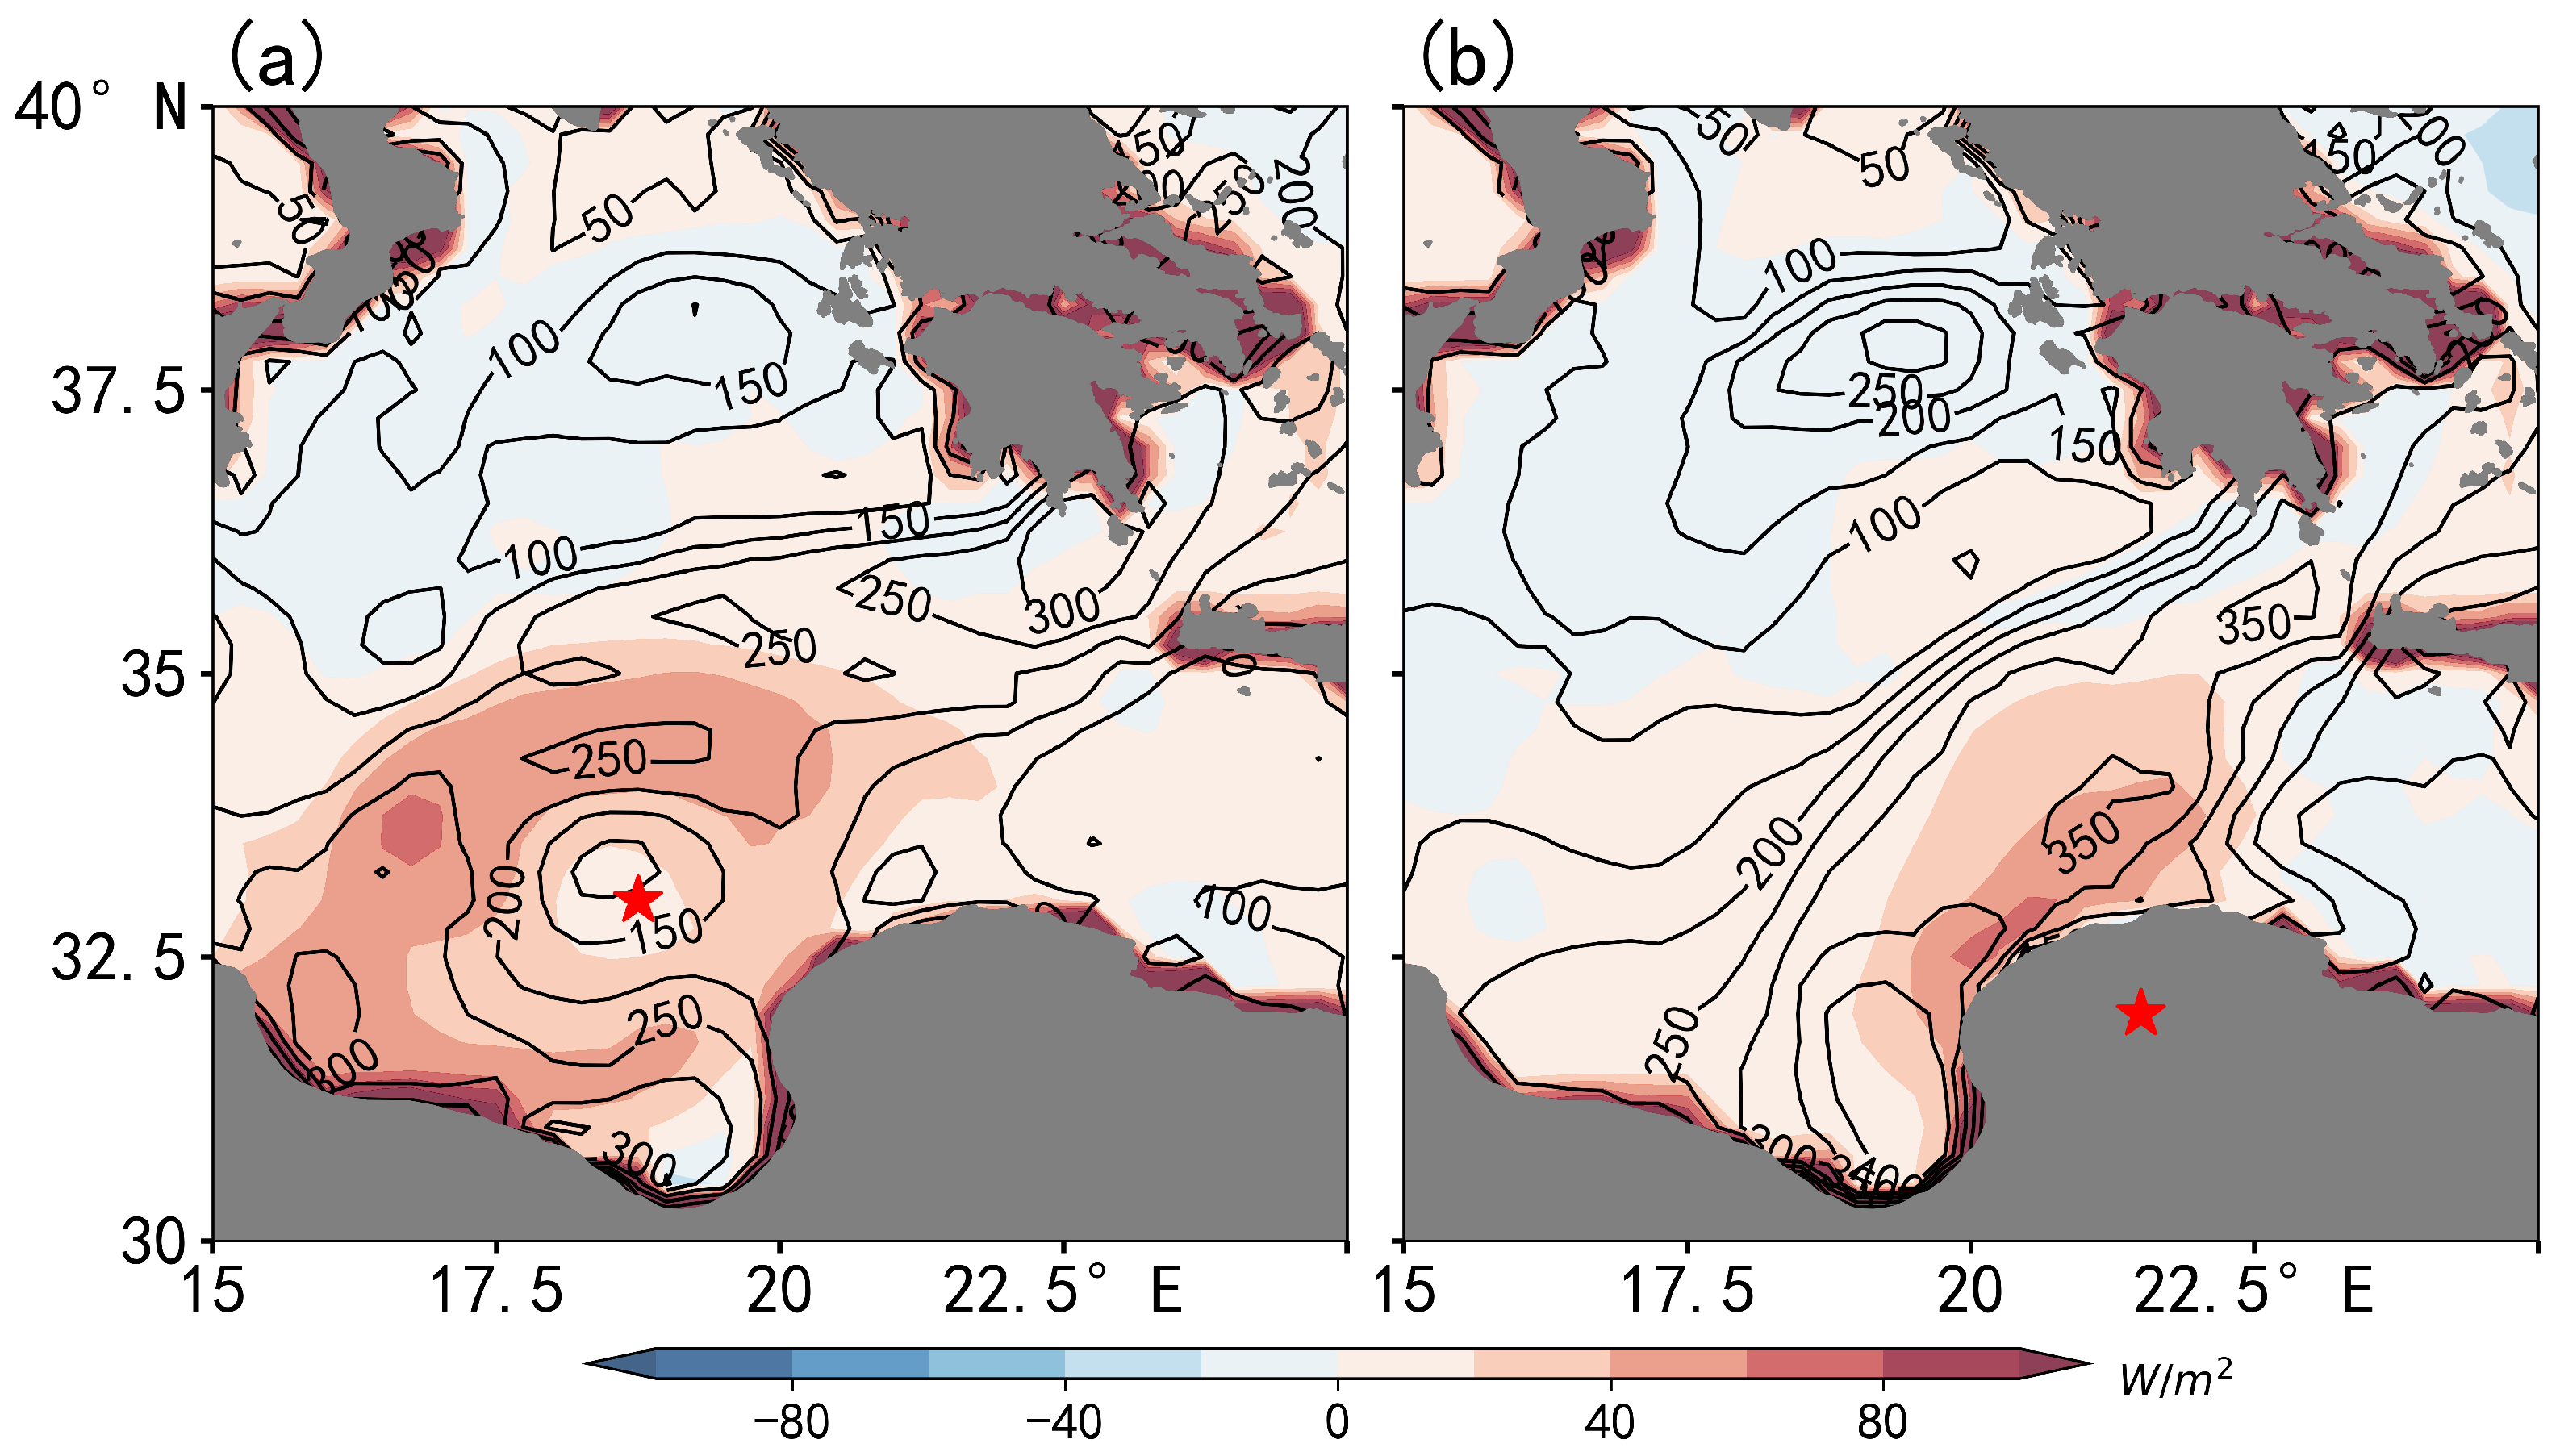
Figure 11 shows substantial upward sensible and latent heat transport over the sea surface in the medicane’s outer periphery, which overlaps with the aforementioned anomalously high SST zone. This indicates that during medicane development, the anomalously warm sea surface not only continuously transported energy to the atmosphere (promoting the development of “Daniel”) but also provided sufficient water vapor for extreme precipitation formation. After the medicane passed, upward sensible and latent heat transport from the sea surface decreased significantly, with downward sensible heat transport even occurring. This is primarily due to reduced SST: when SST fell below atmospheric temperature, the reversed sea–air temperature difference altered heat transport direction, causing heat to transfer from the atmosphere to the ocean. Additionally, high-value zones of upward sensible and latent heat fluxes were distributed around the medicane, continuously supplying energy and water vapor to the system. Sensitivity numerical experiments by Naud et al. [53] (supported by satellite observations) confirmed that both latent and sensible heat flux transport favor medicane maintenance and intensification. Other studies have further noted that increased SST enhances sea-to-atmosphere sensible and latent heat fluxes, providing sufficient energy for cyclone development [54]. These findings confirm that the Mediterranean’s anomalous SST distribution during this event provided indispensable conditions for the medicane’s post-landfall development and the occurrence of extreme precipitation.
To further reveal the impact of anomalous warm SST in the Mediterranean Sea on this extreme heavy precipitation event, similarly, we conducted SST sensitivity experiments for the extreme precipitation event in Libya. The simulation experiment with normal SST serves as the control experiment (without modifying SST), while the simulation experiment that replaces the original SST with climatological SST is designated as the SST sensitivity experiment. The purpose of this design is to eliminate the influence of SST anomalies during the simulation period. Comparison of Figure 12a (control experiment) and Figure 12b (SST sensitivity experiment) shows that the 24 h accumulated precipitation has nearly consistent spatial distribution between the two experiments, but significant differences in intensity. Specifically, the area with accumulated precipitation >75 mm in the sensitivity experiment is notably smaller than that in the control experiment. The experiment difference map (Figure 12c) more clearly illustrates the impact of warm SST anomalies: these anomalies enhanced precipitation in northeastern Libya’s coastal areas, with a 31.25 mm increment in Derna—accounting for about 40% of the region’s total accumulated precipitation. This confirms that Mediterranean warm SST anomalies are also a key factor influencing the precipitation intensity of medicane “Daniel”.

4. Discussion and Conclusions

This study investigates the main synoptic systems, atmospheric circulation characteristics, and causes of the extreme precipitation event that occurred in northern Libya on 10 September 2023. The main conclusions are as follows:
This Libya’s extreme heavy precipitation event was primarily triggered by the Mediterranean “Daniel”, which traversed the entire Mediterranean Sea before making landfall in northwestern Libya. Post-landfall, the medicane further developed, driven by two key factors: the intrusion of weak cold air and the weakening of environmental VWS. In the lower levels of the medicane’s western sector, a strong northwesterly low-level jet stream persisted. This jet stream played a dual role in facilitating extreme precipitation: it not only promoted the dynamic conditions for precipitation formation but also supplied abundant water vapor. Notably, the water vapor supporting this extreme heavy precipitation originated from three main sources: the Ionian Sea (east of Italy), the Aegean Sea (east of Greece), and the coastal areas of northeastern Libya.
During the formation and movement of this “Daniel”, the large-scale circulation over the eastern Atlantic to the European continent maintained a persistent Ω pattern. Guided by the northerly airflow ahead of the European warm ridge, the medicane moved southward across the Mediterranean Sea and eventually made landfall along the coastal areas.
Sensitivity experiments on topography and SST anomalies indicate that the mountains in northeastern Libya affect the intensity and distribution of this extreme precipitation through topographic forced lifting and convergence. The anomalous warm SSTs in the Mediterranean Sea also constitute one of the important factors influencing the intensity of the extreme precipitation event in Libya.
The results of this paper indicate that the formation of this extreme precipitation event in Libya is related to the medicane and the unique Ω pattern above it. As one of the main influencing systems, medicanes have attracted the attention of experts and scholars because they often exert significant impacts on the regions they traverse [55,56]. Although the simulation results of recent climate models indicate that the frequency of medicanes will decrease in the future due to global warming [57], their intensity and duration are continuously increasing [57]. Studies have pointed out that extreme precipitation events caused by the unique Ω pattern in the Mediterranean region are not accidental; there have been several similar cases in history, but the 2023 event was the most extreme [58]. Affected by global warming, extratropical cyclones show a tendency to shift their paths poleward [59,60,61]. However, the abnormal southward movement of this cyclone, which led to the historically rare extreme precipitation in Libya, may be related to the special circulation situation or the abnormal blocking situation in Europe. The specific conclusions still need to be further verified through simulation experiments.

Author Contributions

Y.Z. and H.X. designed the study; Y.Z. visualized the results; Y.Z. implemented the software and conducted the formal analysis; X.G. and S.Y. validated the data and results; Y.Z. prepared the original draft, which was reviewed and revised by H.X. and X.G.; Supervision was provided by H.X. and X.G.; Project administration was handled by H.X. All authors have read and agreed to the published version of the manuscript.

Funding

National Natural Science Foundation of China (41975106).

Data Availability Statement

OISST V2 data can be obtained online via the web portal (https://psl.noaa.gov/data/gridded/data.noaa.oisst.v2.highres.html, accessed on 13 December 2023). The ERA5 reanalysis data can be obtained online via the web portal (https://climate.copernicus.eu, accessed on 13 February 2024). IMERG data can be obtained online via the web portal (https://disc.gsfc.nasa.gov/datasets/GPM_3IMERGHHL_07/summary?keywords=%22-IMERG%20late%22, accessed on 6 April 2024). FNL data can be obtained online via the web portal (https://gdex.ucar.edu/datasets/d083003, accessed on 8 May 2024). GDAS can be obtained online via the web portal (ftp://arlftp.arlhq.noaa.gov/pub/archives/gdas1, accessed on 11 March 2024).

Acknowledgments

We particularly thank the European Centre for Medium-Range Weather Forecasts, Optimum Interpolation SST Version 2, Final Operational Global Analysis and Global Precipitation Measurement for providing the data.

Conflicts of Interest

The authors declare no conflicts of interest.

Abbreviations

The following abbreviations are used in this manuscript:
ECMWFEuropean Centre for Medium-Range Weather Forecasts
OISST V2Optimum Interpolation Sea Surface Temperature Version 2
IMERGIntegrated Multi-satellitE Retrievals for Global
GPMGlobal Precipitation Measurement
TRMMTropical Rainfall Measuring Mission
FNLFinal Operational Global Analysis
NCARNational Center for Atmospheric Research
VWSvertical wind shear
CAPEconvective available potential energy
CINconvective inhibition
SSTsea surface temperature

References

  1. Seager, R.; Murtugudde, R.; Naik, N.; Clement, A.; Gordon, N.; Miller, J. Air–Sea Interaction and the Seasonal Cycle of the Subtropical Anticyclones. J. Clim. 2003, 16, 1948–1996. [Google Scholar] [CrossRef]
  2. Campins, J.; Genovés, A.; Picornell, M.Á.; Jansà, A. Climatology of Mediterranean cyclones using the ERA-40 dataset. Int. J. Climatol. 2011, 31, 1596–1614. [Google Scholar] [CrossRef]
  3. Zhang, W.; Villarini, G.; Scoccimarro, E.; Napolitano, F. Examining the precipitation associated with medicanes in the high-resolution ERA-5 reanalysis data. Int. J. Climatol. 2021, 41, E126–E132. [Google Scholar] [CrossRef]
  4. Zelenakova, M.; Purcz, P.; Gargar, I.; Hlavatá, H. Comparison of precipitation trends in Libya and Slovakia. WIT Trans. Ecol. Environ. 2013, 172, 365–374. [Google Scholar]
  5. Rustemeier, E.; Ziese, M.; Meyer-Christoffer, A.; Schneider, U.; Finger, P.; Becker, A. Uncertainty Assessment of the ERA-20C Reanalysis Based on the Monthly In Situ Precipitation Analysis of the Global Precipitation Climatology Centre. J. Hydrometeorol. 2019, 20, 231–250. [Google Scholar] [CrossRef]
  6. Zittis, G. Observed rainfall trends and precipitation uncertainty in the vicinity of the Mediterranean, Middle East and North Africa. Theor. Appl. Climatol. 2018, 134, 1207–1230. [Google Scholar] [CrossRef]
  7. Caloiero, T.; Veltri, S.; Caloiero, P.; Frustaci, F. Drought Analysis in Europe and in the Mediterranean Basin Using the Standardized Precipitation Index. Water 2018, 10, 1043. [Google Scholar] [CrossRef]
  8. Elfadli, K.I.; Wahab, M.M.A.; Khalil, A.A.E.L. Chapter 4—Impacts of climate change on drought in Libya. In Hydroclimatic Extremes in the Middle East and North Africa; Ahmed, M., Kenawy, E., et al., Eds.; Elsevier: Amsterdam, The Netherlands, 2024; pp. 49–74. [Google Scholar]
  9. Seager, R.; Osborn, T.J.; Kushnir, Y.; Simpson, I.R.; Nakamura, J.; Liu, H. Climate Variability and Change of Mediterranean-Type Climates. J. Clim. 2019, 32, 2887–2915. [Google Scholar] [CrossRef]
  10. WMO. Storm Daniel Leads to Extreme Rain and Floods in Mediterranean, Heavy Loss of Life in Libya; WMO: Geneva, Switzerland, 2023. [Google Scholar]
  11. Argüeso, D.; Marcos, M.; Amores, A. Storm Daniel fueled by anomalously high sea surface temperatures in the Mediterranean. npj Clim. Atmos. Sci. 2024, 7, 307. [Google Scholar] [CrossRef]
  12. Wehner, M.F. Predicted twenty-first-century changes in seasonal extreme precipitation events in the parallel climate model. J. Clim. 2004, 17, 4281–4290. [Google Scholar] [CrossRef]
  13. Groisman, P.Y.; Knight, R.W. Prolonged Dry Episodes over the Conterminous United States: New Tendencies Emerging during the Last 40 Years. J. Clim. 2008, 21, 1850–1862. [Google Scholar] [CrossRef]
  14. Trenberth, K.E. Changes in precipitation with climate change. Clim. Res. 2011, 47, 123. [Google Scholar] [CrossRef]
  15. Giorgi, F.; Lionello, P. Climate change projections for the Mediterranean region. Glob. Planet. Change 2008, 63, 90–104. [Google Scholar] [CrossRef]
  16. Lebeaupin, C.; Ducrocq, V.; Giordani, H. Sensitivity of torrential rain events to the sea surface temperature based on high-resolution numerical forecasts. J. Geophys. Res. 2006, 111, D12110. [Google Scholar] [CrossRef]
  17. Jansa, A.; Alpert, P.; Arbogast, P.; Buzzi, A.; Ivancan-Picek, B.; Kotroni, V.; Llasat, M.C.; Ramis, C.; Richard, E.; Romero, R.; et al. MEDEX: A general overview. Nat. Hazards Earth Syst. Sci. 2014, 14, 1965–1984. [Google Scholar] [CrossRef]
  18. Field, P.R.; Wood, R. Precipitation and cloud structure in midlatitude cyclones. J. Clim. 2007, 20, 233–254. [Google Scholar] [CrossRef]
  19. Rappaport, E.N. Loss of life in the United States associated with recent Atlantic tropical cyclones. Bull. Am. Meteorol. Soc. 2002, 81, 2065–2073. [Google Scholar] [CrossRef]
  20. Ulbrich, U.; Brücher, T.; Fink, A.H.; Leckebusch, G.C.; Krüger, A.; Pinto, J.G. The central European floods of August 2002: Part 2—Synoptic causes and considerations with respect to climatic change. Weather 2003, 58, 434–442. [Google Scholar] [CrossRef]
  21. Lin, Y.; Chiao, S.; Wang, T.; Kaplan, M.L.; Weglarz, R.P. Some Common Ingredients for Heavy Orographic Rainfall. Weather. Forecast. 2001, 16, 633–660. [Google Scholar] [CrossRef]
  22. Ogura, Y.; Yoshizaki, M. Numerical study of orographic–convective precipitation over the Eastern Arabian Sea and the Ghat Mountains during the summer monsoon. J. Atmos. Sci. 1988, 45, 2097–2122. [Google Scholar] [CrossRef]
  23. Houze, R.A., Jr. Orographic effects on precipitating clouds. Rev. Geophys. 2012, 50, RG1001. [Google Scholar] [CrossRef]
  24. Buzzi, A.; Tartaglione, N.; Malguzzi, P. Numerical simulations of the 1994 Piemont flood: Role of orography and moist processes. Mon. Weather. Rev. 1998, 126, 2369–2383. [Google Scholar] [CrossRef]
  25. Avgoustoglou, E.; Muskatel, H.B.; Khain, P.; Levi, Y. The Performance of ICON (Icosahedral Non-Hydrostatic) Regional Model for Storm Daniel with an Emphasis on Precipitation Evaluation over Greece. Atmosphere 2025, 16, 1043. [Google Scholar] [CrossRef]
  26. Ernst, J.A.; Matson, M. A Mediterranean tropical storm. Weather 1983, 38, 332–337. [Google Scholar] [CrossRef]
  27. Rasmussen, E.; Zick, C. A subsynoptic vortex over the Mediterranean with some resemblance to polar lows. Tellus A Dyn. Meteorol. Oceanogr. 1987, 39, 408–425. [Google Scholar] [CrossRef]
  28. Tous, M.; Romero, R. Meteorological environments associated with medicane development. Int. J. Climatol. 2013, 33, 1–14. [Google Scholar] [CrossRef]
  29. Miglietta, M.M.; Laviola, S.; Malvaldi, A.; Conte, D.; Levizzani, V.; Price, C. Analysis of tropical-like cyclones over the Mediterranean Sea through a combined modelling and satellite approach. Geophys. Res. Lett. 2013, 40, 2400–2405. [Google Scholar] [CrossRef]
  30. Miglietta, M.M.; Flaounas, E.; González-Alemán, J.J. Defining Medicanes: Bridging the Knowledge Gap between Tropical and Extratropical Cyclones in the Mediterranean. Bull. Am. Meteorol. Soc. 2025, 106, E1955–E1971. [Google Scholar] [CrossRef]
  31. Homar, V.; Romero, R.; Stensrud, D.J.; Ramis, C.; Alonso, S. Numerical diagnosis of a small, quasi-tropical cyclone over the western Mediterranean: Dynamical vs. boundary factors. Q. J. R. Meteorol. Soc. 2003, 12, 1469–1490. [Google Scholar] [CrossRef]
  32. Carrió, D.; Homar, V.; Jansa, A.; Romero, R.; Picornell, M. Tropicalization process of the 7 November 2014 Mediterranean cyclone: Numerical sensitivity study. Atmos. Res. 2017, 197, 300–312. [Google Scholar] [CrossRef]
  33. Fita, L.; Flaounas, E. Medicanes as subtropical cyclones: The December 2005 case from the perspective of surface pressure tendency diagnostics and atmospheric water budget. Q. J. R. Meteorol. Soc. 2018, 144, 1028–1044. [Google Scholar] [CrossRef]
  34. Noyelle, R.; Ulbrich, U.; Becker, N.; Meredith, E.P. Assessing the impact of sea surface temperatures on a simulated medicane using ensemble simulations. Nat. Hazards Earth Syst. Sci. 2019, 19, 941–955. [Google Scholar] [CrossRef]
  35. Davolio, S.; Fera, S.D.; Laviola, S.; Miglietta, M.M.; Levizzani, V. Heavy Precipitation over Italy from the Mediterranean Storm “Vaia” in October 2018: Assessing the Role of an Atmospheric River. Mon. Weather. Rev. 2020, 148, 3571–3588. [Google Scholar] [CrossRef]
  36. Pantillon, F.; Davolio, S.; Avolio, E.; Calvo-Sancho, C.; Carrió, D.S.; Dafis, S.; Gentile, E.S.; Gonzalez-Aleman, J.J.; Gray, S.; Miglietta, M.M.; et al. The crucial representation of deep convection for the cyclogenesis of Medicane Ianos. Weather. Clim. Dyn. 2024, 5, 1187–1205. [Google Scholar] [CrossRef]
  37. Hersbach, H.; Bell, B.; Berrisford, P.; Biavati, G.; Horányi, A.; Muñoz Sabater, J.; Nicolas, J.; Peubey, C.; Radu, R.; Rozum, I.; et al. ERA5 Hourly Data on Single/Pressure Levels from 1940 to Present; Copernicus Climate Change Service (C3S) Climate Data Store (CDS): Reading, UK, 2023. [Google Scholar]
  38. Banzon, V.; Smith, T.M.; Chin, T.M.; Liu, C.; Hankins, W. A long-term record of blended satellite and in situ sea-surface temperature for climate monitoring, modeling and environmental studies. Earth Syst. Sci. Data 2016, 8, 165–176. [Google Scholar] [CrossRef]
  39. Hou, A.Y.; Kakar, R.K.; Neeck, S.; Azarbarzin, A.A.; Kummerow, C.D.; Kojima, M.; Oki, R.; Nakamura, K.; Iguchi, T. The global precipitation measurement mission. Bull. Am. Meteorol. Soc. 2014, 95, 701–722. [Google Scholar] [CrossRef]
  40. Palmer, C.K.; Barnes, G.M. The effects of vertical wind shear as diagnosed by the NCEP/NCAR reanalysis data on northeast Pacific hurricane intensit. In Proceedings of the 25th Conference on Hurricanes and Tropical Meteorology, San Diego, CA, USA, 28 April–3 May 2002; pp. 28–29. [Google Scholar]
  41. Yao, C.; Lou, S.S.; Ye, J.Y. Mesoscale analysis and numerical simulation of a typhoon rainstrom event affected by cold air. Torrential Rain Disasters 2019, 38, 204–211. [Google Scholar]
  42. Lu, J.L.; Guo, P.W. Impacts of the intrusion intensity of cold air on extratropical transition of Typhoon Krosa. J. Meteorol. Sci. 2012, 32, 355–364. [Google Scholar]
  43. Dong, M.Y.; Chen, L.S.; Li, Y.; Cheng, Z.Q. Numerical study of cold air impact on rainfall reinforcement associated with Tropical Cyclone Talim (2005): I. Impact of different cold air intensity. J. Trop. Meteorol. 2013, 19, 87–96. [Google Scholar]
  44. Rodgers, E.B.; Pierce, H.F. Environmental Influence on Typhoon Bobbie’s Precipitation Distribution. J. Appl. Meteorol. Climatol. 1995, 34, 2513–2532. [Google Scholar] [CrossRef]
  45. Frank, W.M.; Ritchie, E.A. Effects of vertical wind shear on the intensity and structure of numerically simulated hurricanes. Mon. Weather. Rev. 2001, 129, 2249–2269. [Google Scholar] [CrossRef]
  46. Schumacher, R.S.; Rasmussen, K.L. The formation, character and changing nature of mesoscale convective systems. Nat. Rev. Earth Environ. 2020, 1, 300–314. [Google Scholar] [CrossRef]
  47. Trenberth, K.E. Atmospheric moisture residence times and cycling: Implications for rainfall rates and climate change. Clim. Change 1998, 39, 667–694. [Google Scholar] [CrossRef]
  48. Merrill, R.T. Environmental influences on hurricane intensification. J. Atmos. Sci. 1988, 45, 1678–1687. [Google Scholar] [CrossRef]
  49. Dai, Y.; Majumdar, S.J.; Nolan, D.S. The outflow–rainband relationship induced by environmental flow around tropical cyclones. J. Atmos. Sci. 2019, 76, 1845–1863. [Google Scholar] [CrossRef]
  50. Wu, F.; Lombardo, K. Investigation of a mesoscale convective system over the eastern United States in future climates. Part II: Storm-scale processes. J. Clim. 2025, 38, 3533–3562. [Google Scholar] [CrossRef]
  51. Sullivan, S.C.; Vautravers, P.; Beucler, T.; Makgoale, T.; Yin, J. Moisture–precipitation couplings for mesoscale convective systems in tracking data and idealized simulations. J. Atmos. Sci. 2025, 82, 1885–1902. [Google Scholar] [CrossRef]
  52. Demirdjian, R.; Doyle, J.D.; Finocchio, P.M.; Reynolds, C.A. On the influence of surface latent heat fluxes on idealized extratropical cyclones. J. Atmos. Sci. 2022, 79, 2229–2242. [Google Scholar] [CrossRef]
  53. Naud, C.M.; Crespo, J.A.; Posselt, D.J.; Booth, J.F. Cloud and precipitation in low-latitude extratropical cyclones conditionally sorted on CYGNSS surface latent and sensible heat fluxes. J. Clim. 2023, 36, 5659–5680. [Google Scholar] [CrossRef]
  54. Gyakum, J.R.; Danielson, R.E. Analysis of Meteorological Precursors to Ordinary and Explosive Cyclogene-sis in the Western North Pacific. Mon. Weather. Rev. 2000, 128, 851–863. [Google Scholar] [CrossRef]
  55. Gutiérrez-Fernández, J.; González-Alemán, J.J.; de la Vara, A.; Cabos, W.; Sein, D.V.; Gaertner, M.Á. Impact of ocean–atmosphere coupling on future projection of Medicanes in the Mediterranean sea. Int. J. Climatol. 2021, 41, 2226–2238. [Google Scholar] [CrossRef]
  56. Toomey, T.; Amores, A.; Marcos, M.; Orfila, A.; Romero, R. Coastal hazards of tropical-like cyclones over the Mediterranean Sea. J. Geophys. Res. Ocean. 2022, 127, e2021JC017964. [Google Scholar] [CrossRef]
  57. González-Alemán, J.J.; Pascale, S.; Gutierrez-Fernandez, J.; Murakami, H.; Gaertner, M.A.; Vecchi, G.A. Potential increase in hazard from Mediterranean hurricane activity with global warming. Geophys. Res. Lett. 2019, 46, 1754–1764. [Google Scholar] [CrossRef]
  58. Guo, Y.; Beyerle, U.; Bevacqua, E.; Zscheischler, J.; Suarez-Gutierrez, L.; Mittermeier, M.; Fu, Z.; Fischer, E. European compound flood-heat-flood events associated with Omega patterns cannot be easily reproduced by a fully coupled model. Commun. Earth Environ. 2025, 6, 491. [Google Scholar] [CrossRef]
  59. Trigo, I.F. Climatology and interannual variability of storm-tracks in the Euro-Atlantic sector: A comparison between ERA-40 and NCEP/NCAR reanalyses. Clim. Dyn. 2006, 26, 127–143. [Google Scholar] [CrossRef]
  60. Flocas, H.A.; Simmonds, I.; Kouroutzoglou, J.; Keay, K.; Hatzaki, M.; Bricolas, V.; Asimakopoulos, D. On Cyclonic Tracks over the Eastern Mediterranean. J. Clim. 2010, 23, 5243–5257. [Google Scholar] [CrossRef]
  61. Tilinina, N.; Gulev, S.K.; Rudeva, I.; Koltermann, P. Comparing cyclone life cycle characteristics and their interannual variability in different reanalyses. J. Clim. 2013, 26, 6419–6438. [Google Scholar] [CrossRef]
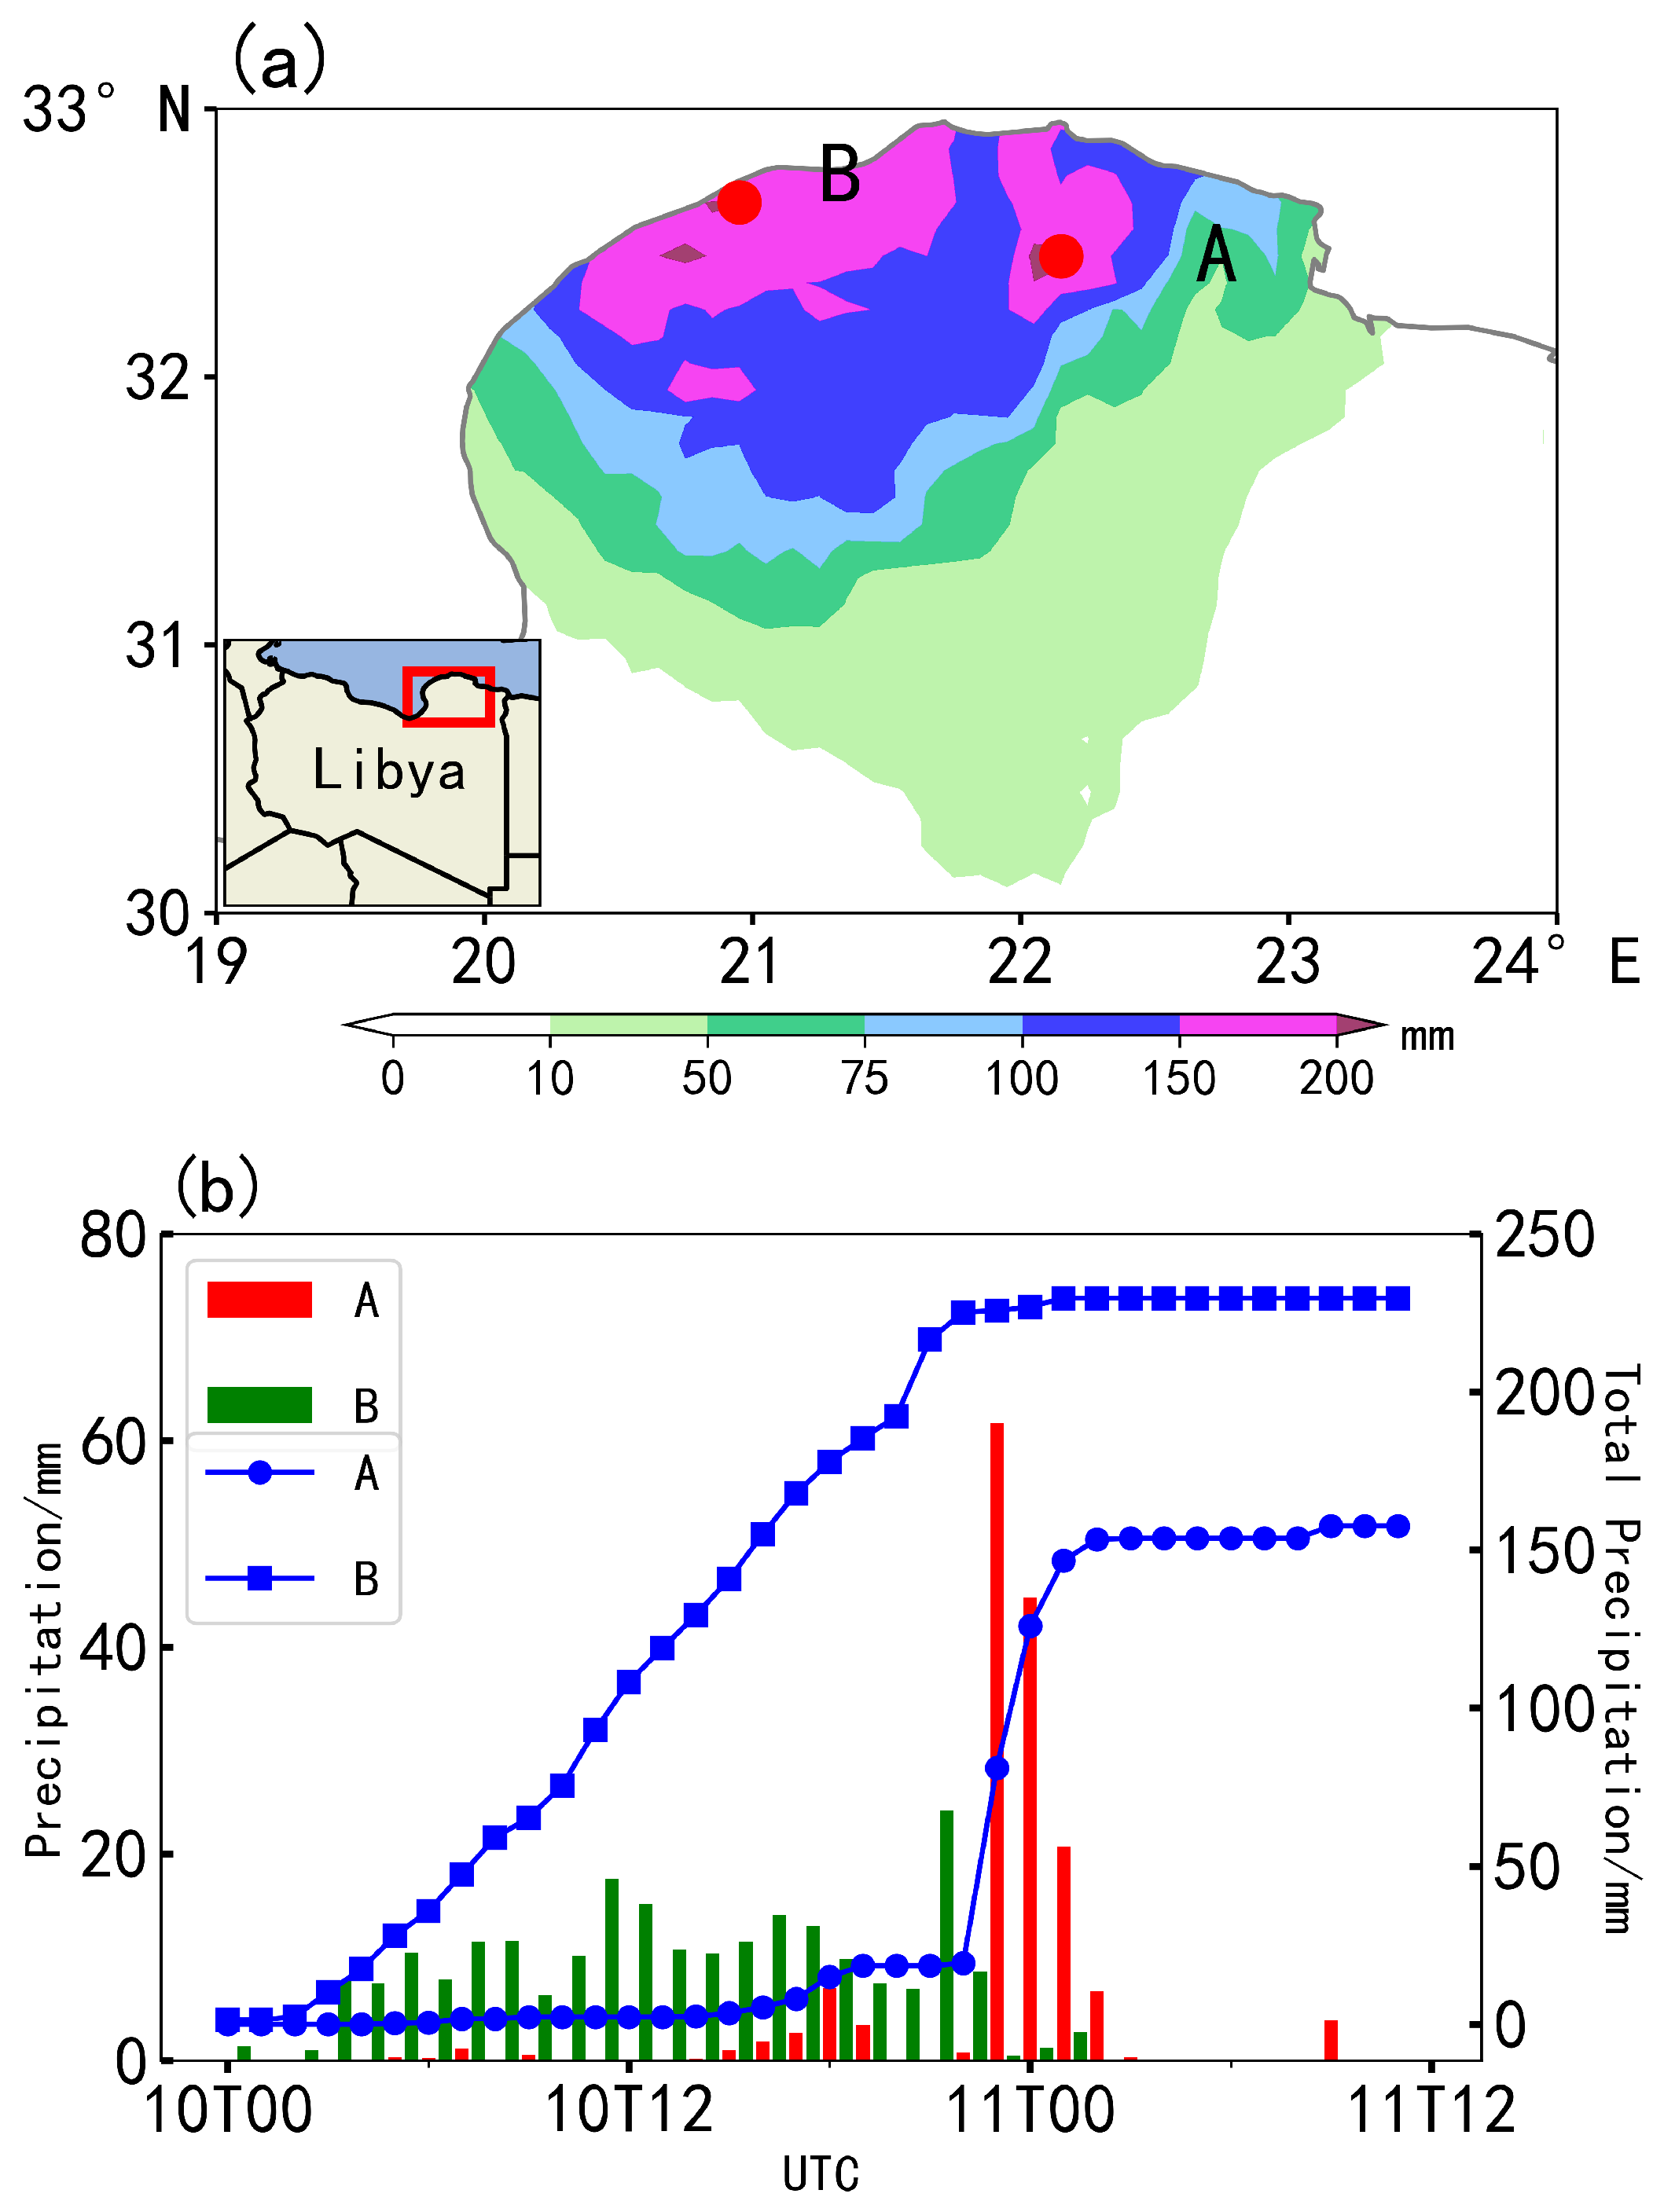
Figure 1. (a) Accumulated precipitation (shading) over the northeastern coastal regions of Libya from 0600 UTC 10 September to 1200 UTC 11 September 2023; (b) temporal evolution of hourly and accumulated precipitation at Point A (grid point with maximum hourly precipitation during the event) and Point B (grid point with maximum accumulated precipitation during the event) from 0000 UTC 10 September to 1200 UTC 11 September 2023.
Atmosphere 16 01259 g001
Figure 2. Distributions of 500 hPa geopotential height (black contour, unit: dagpm), temperature (shading, unit: °C), and wind fields (arrows, unit: m/s) over the Mediterranean region at (a) 0000 UTC, (b) 0600 UTC, (c) 1200 UTC, and (d) 1800 UTC on 10 September 2023. (The red five-pointed star denotes the location of the minimum pressure center of medicane “Daniel”).
Atmosphere 16 01259 g002
Figure 3. Distributions of 850 hPa geopotential height (black contour, unit: dagpm), temperature (shading, units: °C), and wind fields (arrows, unit: m/s) over the Mediterranean region at (a) 0000 UTC, (b) 0600 UTC, (c) 1200 UTC, and (d) 1800 UTC on 10 September 2023. (The red five-pointed star denotes the location of the minimum pressure center of medicane “Daniel”. Blue contour represent wind speed isopleths greater than 12 m/s, unit: m/s).
Atmosphere 16 01259 g003
Figure 4. (a) Track changes of “Daniel” (the red dashed box indicates the area where Jabal al Akhdar (the Akhdar Mountain) is located; shading areas represent topographic height, unit: m) and (b) changes in minimum central pressure (unit: hPa), maximum surface wind speed at 2 m height, and VWS values (unit: m/s) of the cyclone before and after landfall.
Atmosphere 16 01259 g004
Figure 5. (a) Vertically integrated water vapor flux (shading, unit: kg/(m · s)) and water vapor flux divergence (red contour, unit: kg/(m2 · s)) on 10 September 2023 (UTC) and the water vapor transport paths at various heights; (b) 850 hPa water vapor flux (shading, unit: kg/(m2 · s)) and water vapor flux divergence (red contour, unit: kg/(m3 · s)) at 1200 UTC on 10 September; (c) at 1800 UTC on 10 September. (Vectors represent the magnitude and direction of water vapor flux).
Atmosphere 16 01259 g005
Figure 6. Divergence (shading, unit: s−1), vertical velocity field (red contour, with only ascending regions plotted, unit: Pa/s), and wind speed field (black contours, unit: m/s) at 300 hPa (a,c,e) and 850 hPa (b,d,f) over the coastal areas of northeastern Libya at 0600 UTC (a,b), 1200 UTC (c,d), and 1800 UTC (e,f) on 10 September 2023.
Atmosphere 16 01259 g006
Figure 7. CAPE (shading, unit: J/kg) and CIN (contour, unit: J/kg) over the coastal areas of northeastern Libya at (a) 0000 UTC, (b) 0600 UTC, (c) 1200 UTC, and (d) 1800 UTC on 10 September 2023.
Atmosphere 16 01259 g007
Figure 8. Accumulated 24h precipitation (0600 UTC 10 September–0600 UTC 11 September 2023; unit: mm) for (a) ERA5, (b) satellite data, (c) FNL-driven WRF simulation, (d) ERA5-driven WRF simulation.
Atmosphere 16 01259 g008
Figure 9. Accumulated 24 h precipitation (0600 UTC 10 September–0600 UTC 11 September 2023) from (a) control experiment, (b) topographic sensitivity experiment, (c) their difference (control minus topographic sensitivity experiment; dotted areas: passed the 90 % confidence level test). (Lambert projection; unit: mm).
Atmosphere 16 01259 g009
Figure 10. SST (shading, unit: °C; SST distribution (contours unit: °C) in the Mediterranean Sea on (a) 9 September and (b) 10 September 2023 (UTC). (The blue five-pointed star denotes the location of the minimum pressure center of medicane “Daniel”).
Atmosphere 16 01259 g010
Figure 11. Sensibleheat flux (shading, unit: W/m2) and latent heat flux (red/blue contour: positive/negative SST anomaly, unit: W/m2) in the Mediterranean Sea at (a) 1200 UTC on 9 September and (b) 1200 UTC on 10 September 2023. (The red five-pointed star denotes the location of the minimum pressure center of medicane “Daniel”).
Atmosphere 16 01259 g011
Figure 12. Accumulated 24 h precipitation (shading, 0600 UTC 10 September–0600 UTC 11 September 2023) from (a) control experiment, (b) SST sensitivity experiment, (c) their difference (control minus topographic sensitivity experiment; dotted areas: passed the 90% confidence level test). (Lambert projection; unit: mm).
Atmosphere 16 01259 g012
Disclaimer/Publisher’s Note: The statements, opinions and data contained in all publications are solely those of the individual author(s) and contributor(s) and not of MDPI and/or the editor(s). MDPI and/or the editor(s) disclaim responsibility for any injury to people or property resulting from any ideas, methods, instructions or products referred to in the content.