Article

Spatiotemporal Characterization and Transfer Patterns of Aerosols and Trace Gases over the Region of Northeast China

1
School of Environmental Science, Liaoning University, Shenyang 110036, China
2
Key Lab of Environmental Optics & Technology, Chinese Academy of Sciences, Hefei 230031, China
*
Authors to whom correspondence should be addressed.
Atmosphere 2025, 16(11), 1258; https://doi.org/10.3390/atmos16111258
Submission received: 26 September 2025 / Revised: 27 October 2025 / Accepted: 31 October 2025 / Published: 2 November 2025
(This article belongs to the Special Issue Study of Air Pollution Based on Remote Sensing (2nd Edition))

Abstract

This study examined air quality data collected from 2015 to 2023 across Shenyang, Dalian, Changchun, and Harbin to assess interannual and monthly variations in PM2.5, PM10, SO2, NO2, and O3, along with their correlations, seasonal meteorological influences, and potential source regions. Annual mean concentrations of PM2.5, PM10, SO2, and NO2 declined substantially (by 39.9–79.3%), whereas O3 showed a fluctuating pattern, remaining persistently high in the coastal city of Dalian. Seasonally, PM2.5, PM10, SO2, and NO2 concentrations peaked in winter and decreased in summer, while O3 displayed the opposite trend. Particulate levels in Liaoning rebounded earlier in spring than in Jilin and Heilongjiang. Correlation analysis revealed strong positive relationships among particulate and gaseous pollutants, but O3 generally exhibited negative correlations with other species. Haze events occurred mainly in winter, whereas complex pollution episodes were more frequent in summer. Meteorological analysis indicated that relative humidity was negatively correlated with PM2.5, PM10, SO2, and NO2 in summer but positively correlated in winter. Elevated temperatures outside the winter months promoted NO2 dispersion and enhanced O3 formation. Strong winds in spring and winter markedly reduced PM2.5 and SO2 levels, though this effect was less evident in Shenyang. WPSCF results identified significant cross-regional transport from the southwest contributing to PM2.5, PM10, and NO2 during spring and winter, while O3 was primarily affected by long-range transport in spring and only marginally in winter. In Dalian, sea–land breeze circulation further intensified transport processes in summer and autumn. Overall, this work provides an integrated, multi-year, and multi-city assessment of pollution dynamics, meteorological drivers, and transboundary transport in Northeast China, offering new insights into regional air quality improvement and its spatial heterogeneity relative to other regions of China.

1. Introduction

Rapid urbanization and industrialization have made air pollution a critical public health concern. In 2019, the World Health Organization (WHO) listed air pollution among the top global threats to human health, recognizing it as one of the most severe environmental hazards [1]. Air pollution accounts for nearly seven million premature deaths globally each year and is strongly associated with elevated mortality from stroke, cardiovascular disease, lung cancer, and acute respiratory infections [2]. Consequently, growing public, media, and governmental attention has been directed toward this issue. Elevated levels of trace gases—including nitrogen oxides (NOx), sulfur oxides (SOx), tropospheric ozone (O3), volatile organic compounds (VOCs), and particulate matter (PM)—constitute the primary contributors to ambient air pollution [3]. Although various control strategies have effectively reduced concentrations of criteria pollutants such as NO2, SO2, and PM10, mitigating near-surface PM2.5 and secondary pollution driven by excessive O3 remains a major challenge [4]. A major challenge in China is the frequent co-occurrence of high O3 and PM2.5 levels, when daily mean PM2.5 exceeds 35 μg m−3 and O3 exceeds 160 μg m−3—both surpassing the National Ambient Air Quality Standards (NAAQS) on the same day [5].
Northeast China has experienced profound transformations driven by rapid industrialization and urbanization, emerging as one of the country’s earliest hubs of heavy chemical industry [6,7]. However, this rapid development has also created complex environmental challenges, with urban expansion strongly correlated with elevated air pollution levels across the region [8]. Among the various contributing factors, industrialization remains the dominant driver of deteriorating air quality, while city size and economic development also exert considerable influence [9]. The region’s distinctive geography—vast plains encircled by mountain ranges—interacts with its temperate monsoon climate to govern pollutant dispersion and accumulation, particularly during the long, dry winters dominated by northwesterly winds [2].
The complex nature of air pollution in Northeast China stems from the combined effects of intensive anthropogenic activities and unfavorable meteorological conditions. Industrial emissions remain the primary source, reflecting the region’s long-standing reliance on heavy industry [10]. Extensive coal combustion for residential heating during the long winter season is another major contributor, often leading to severe haze episodes and elevated pollutant concentrations. Previous studies indicate that coal-fired sources contribute a substantial share of regional emissions, exceeding 62% in some major cities [11]. In addition, open burning of crop residues during spring and autumn markedly elevates PM2.5 and other gaseous pollutants, further deteriorating air quality [12]. The rapid increase in motor vehicles, a direct consequence of urbanization, has further exacerbated air pollution through exhaust emissions [10]. Unfavorable meteorological conditions—characterized by weak winds and frequent temperature inversions—trap pollutants near the surface, thereby intensifying pollution episodes [13]. Chemical analyses of precipitation in central Liaoning Province reveal that sulfate (SO42−) and nitrate (NO3) are the dominant anions, highlighting the strong influence of SOx and NOx emissions from industrial and combustion sources [14].
Since 2013, China has established over 4000 air quality monitoring stations to measure key trace gases and particulate matter, including PM2.5, PM10, NO2, SO2, and O3 [15]. The extensive datasets generated by these stations have been widely used to examine the spatial and temporal characteristics of air pollution across China [3]. Nevertheless, comprehensive studies on the spatiotemporal variations in air pollution and their driving factors in Northeast Chinese cities remain scarce.
To address this gap, this study uses data from the National Environmental Monitoring Center to provide a comprehensive assessment of air pollution in four major cities across Northeast China, offering a systematic characterization of regional air quality. Specifically, it (a) analyzes the long-term temporal trends of trace gases and particulate matter; (b) investigates the effects of key meteorological parameters on pollutant concentrations; and (c) identifies dominant pollution sources and their potential contributions using the Potential Source Contribution Function (PSCF) coupled with Hybrid Single-Particle Lagrangian Integrated Trajectory (HYSPLIT) backward trajectory analysis. The results provide essential scientific evidence and practical guidance for developing effective air pollution prevention and control strategies in large urban areas.

2. Materials and Methods

2.1. Description of the Studied Area

The Northeast Administrative Region of China includes the provinces of Liaoning (38°43′–43°26′ N, 118°53′–125°46′ E), Jilin (40°50′–46°19′ N, 121°38′–131°19′ E), and Heilongjiang (43°25′–53°33′ N, 121°11′–135°05′ E), together with the four eastern leagues of Inner Mongolia (41°35′–53°20′ N, 115°31′–126°04′ E).
This study focuses on four major cities—Shenyang, Dalian, Changchun, and Harbin—selected for their population density, industrial activity, regional representativeness, and data completeness. Shenyang, Changchun, and Harbin, the provincial capitals of Liaoning, Jilin, and Heilongjiang, respectively, serve as the political, economic, and cultural centers of their provinces. Dalian, situated in southern Liaoning, is a key coastal and industrial hub characterized by extensive port logistics and heavy manufacturing. Collectively, these cities constitute the core urban and industrial belt of Northeast China, accounting for a substantial share of the region’s population and energy consumption. Each city maintains long-term, high-quality air quality monitoring records provided by the China Environmental Monitoring Centre (CEMC), ensuring data consistency and reliability. Given their demographic and economic significance, as well as the availability of continuous monitoring data, these cities are representative of the broader air pollution characteristics of Northeast China. Their geographical locations are shown in Figure 1.

2.2. Dataset

Air quality data used in this study were obtained from the China Environmental Monitoring Centre (CEMC; http://www.cnemc.cn/, accessed on 30 December 2025). The monitored pollutants included fine particulate matter (PM2.5; aerodynamic diameter < 2.5 μm), inhalable particulate matter (PM10; <10 μm), sulfur dioxide (SO2), nitrogen dioxide (NO2), and ozone (O3).
To ensure data reliability, all measurements underwent strict quality control, with outliers beyond physically plausible ranges removed. At the station level, a daily mean value was calculated only when at least 75% of hourly data were available; records not meeting this completeness criterion were treated as missing and excluded from further analysis.
For cities with multiple stations, the city-level daily mean concentration was computed as the arithmetic average of all valid station-level daily means, consistent with national air quality assessment protocols. In total, 13 stations were included in Harbin, 13 in Shenyang, 10 in Dalian, and 10 in Changchun. These stations are relatively evenly distributed across the principal urban areas, providing representative coverage of citywide air quality. Fewer sites are located in suburban areas, reflecting lower population density and weaker anthropogenic influence in those zones.
In this study, city-level pollutant concentrations were derived as the average of all monitoring stations within each city. Separate analyses distinguishing urban, suburban, and industrial subzones were not performed; therefore, functional station classifications were not applied. The geographical coordinates of all monitoring stations are listed in Table S1 and shown in Figures S1–S4 to ensure transparency and reproducibility.
Meteorological parameters for the same period—including temperature, relative humidity, wind speed, and dew point temperature—were obtained from the U.S. National Climatic Data Center (NCDC; https://www.ncei.noaa.gov/, accessed on 30 December 2025). In addition, meteorological fields for the backward trajectory analysis were derived from the Global Data Assimilation System (GDAS) of the National Centers for Environmental Prediction (NCEP; https://ready.arl.noaa.gov/archives.php, accessed on 30 December 2025).

2.3. Categorization of Different Pollution Episodes

2.3.1. Haze Pollution

To assess the impact of haze days on PM2.5, PM10, NO2, SO2, and O3 concentrations across the study region, the observation period was categorized into haze and non-haze days. Haze is defined as a condition of reduced atmospheric visibility caused mainly by fine particles that scatter and absorb visible light, diminishing optical clarity [16]. In this study, haze and non-haze days were classified following criteria commonly used in previous studies. Haze days were defined as periods with relative humidity below 80% and PM2.5 concentrations exceeding 40 μg m−3, while non-haze days had relative humidity below 80% and PM2.5 concentrations under this threshold [17].

2.3.2. Complex Pollution

Previous studies defined complex pollution days as periods when daily mean PM2.5 concentrations exceeded 35 μg m−3 and daily mean O3 concentrations surpassed 160 μg m−3 [3,4]. The same classification approach was applied in this study to the Northeast Chinese cities of Shenyang, Dalian, Changchun, and Harbin.

2.4. Potential Source Contribution Function (PSCF)

The PSCF analysis was employed to identify probable source regions based on air mass backward trajectories. Trajectories were computed for the period from January 2015 to December 2023, with four starting times per day (local time 00:00, 06:00, 12:00, and 18:00). Meteorological input data were obtained from the Global Data Assimilation System (GDAS) with a spatial resolution of 1° × 1° [18].
The PSCF value for each grid cell was calculated as the ratio of trajectory endpoints associated with pollutant concentrations above a defined threshold to the total number of endpoints within that cell [19]. Because PSCF values become less reliable with increasing distance from the receptor site, a weighting function (Wij) was applied to minimize bias in grid cells containing fewer trajectory endpoints than the domain-wide average.
Incorporating this correction yields the weighted PSCF (WPSCF), which more accurately represents the relative intensity of potential source regions. Higher WPSCF values in a grid cell indicate that air masses traversing the region are more likely to contribute to elevated pollutant levels at the receptor site. Accordingly, these areas are identified as potential high-contribution source regions for the long-range transport of pollutants to the study area. Details of the weighting function’s formulation and application are provided in Text S1 of the Supplementary Materials [20,21].

2.5. Data Processing and Analysis Methods

Data collation and preliminary processing were performed in Microsoft Excel. Graphical illustrations were generated using OriginPro 2021 (version: 9.8.0.200), whereas correlation analyses were conducted in Rstudio (version:1.4.1717) with the “stats” package (version: 4.4.1) and visualized using “ggplot2” package (version: 4.0.0). The PSCF analysis was conducted with MeteoInfoMap (version: 1.5.5), and spatial kriging interpolation was performed in QGIS (version: 3.28.2).

3. Results and Discussion

3.1. Annual Average Change of Pollutants

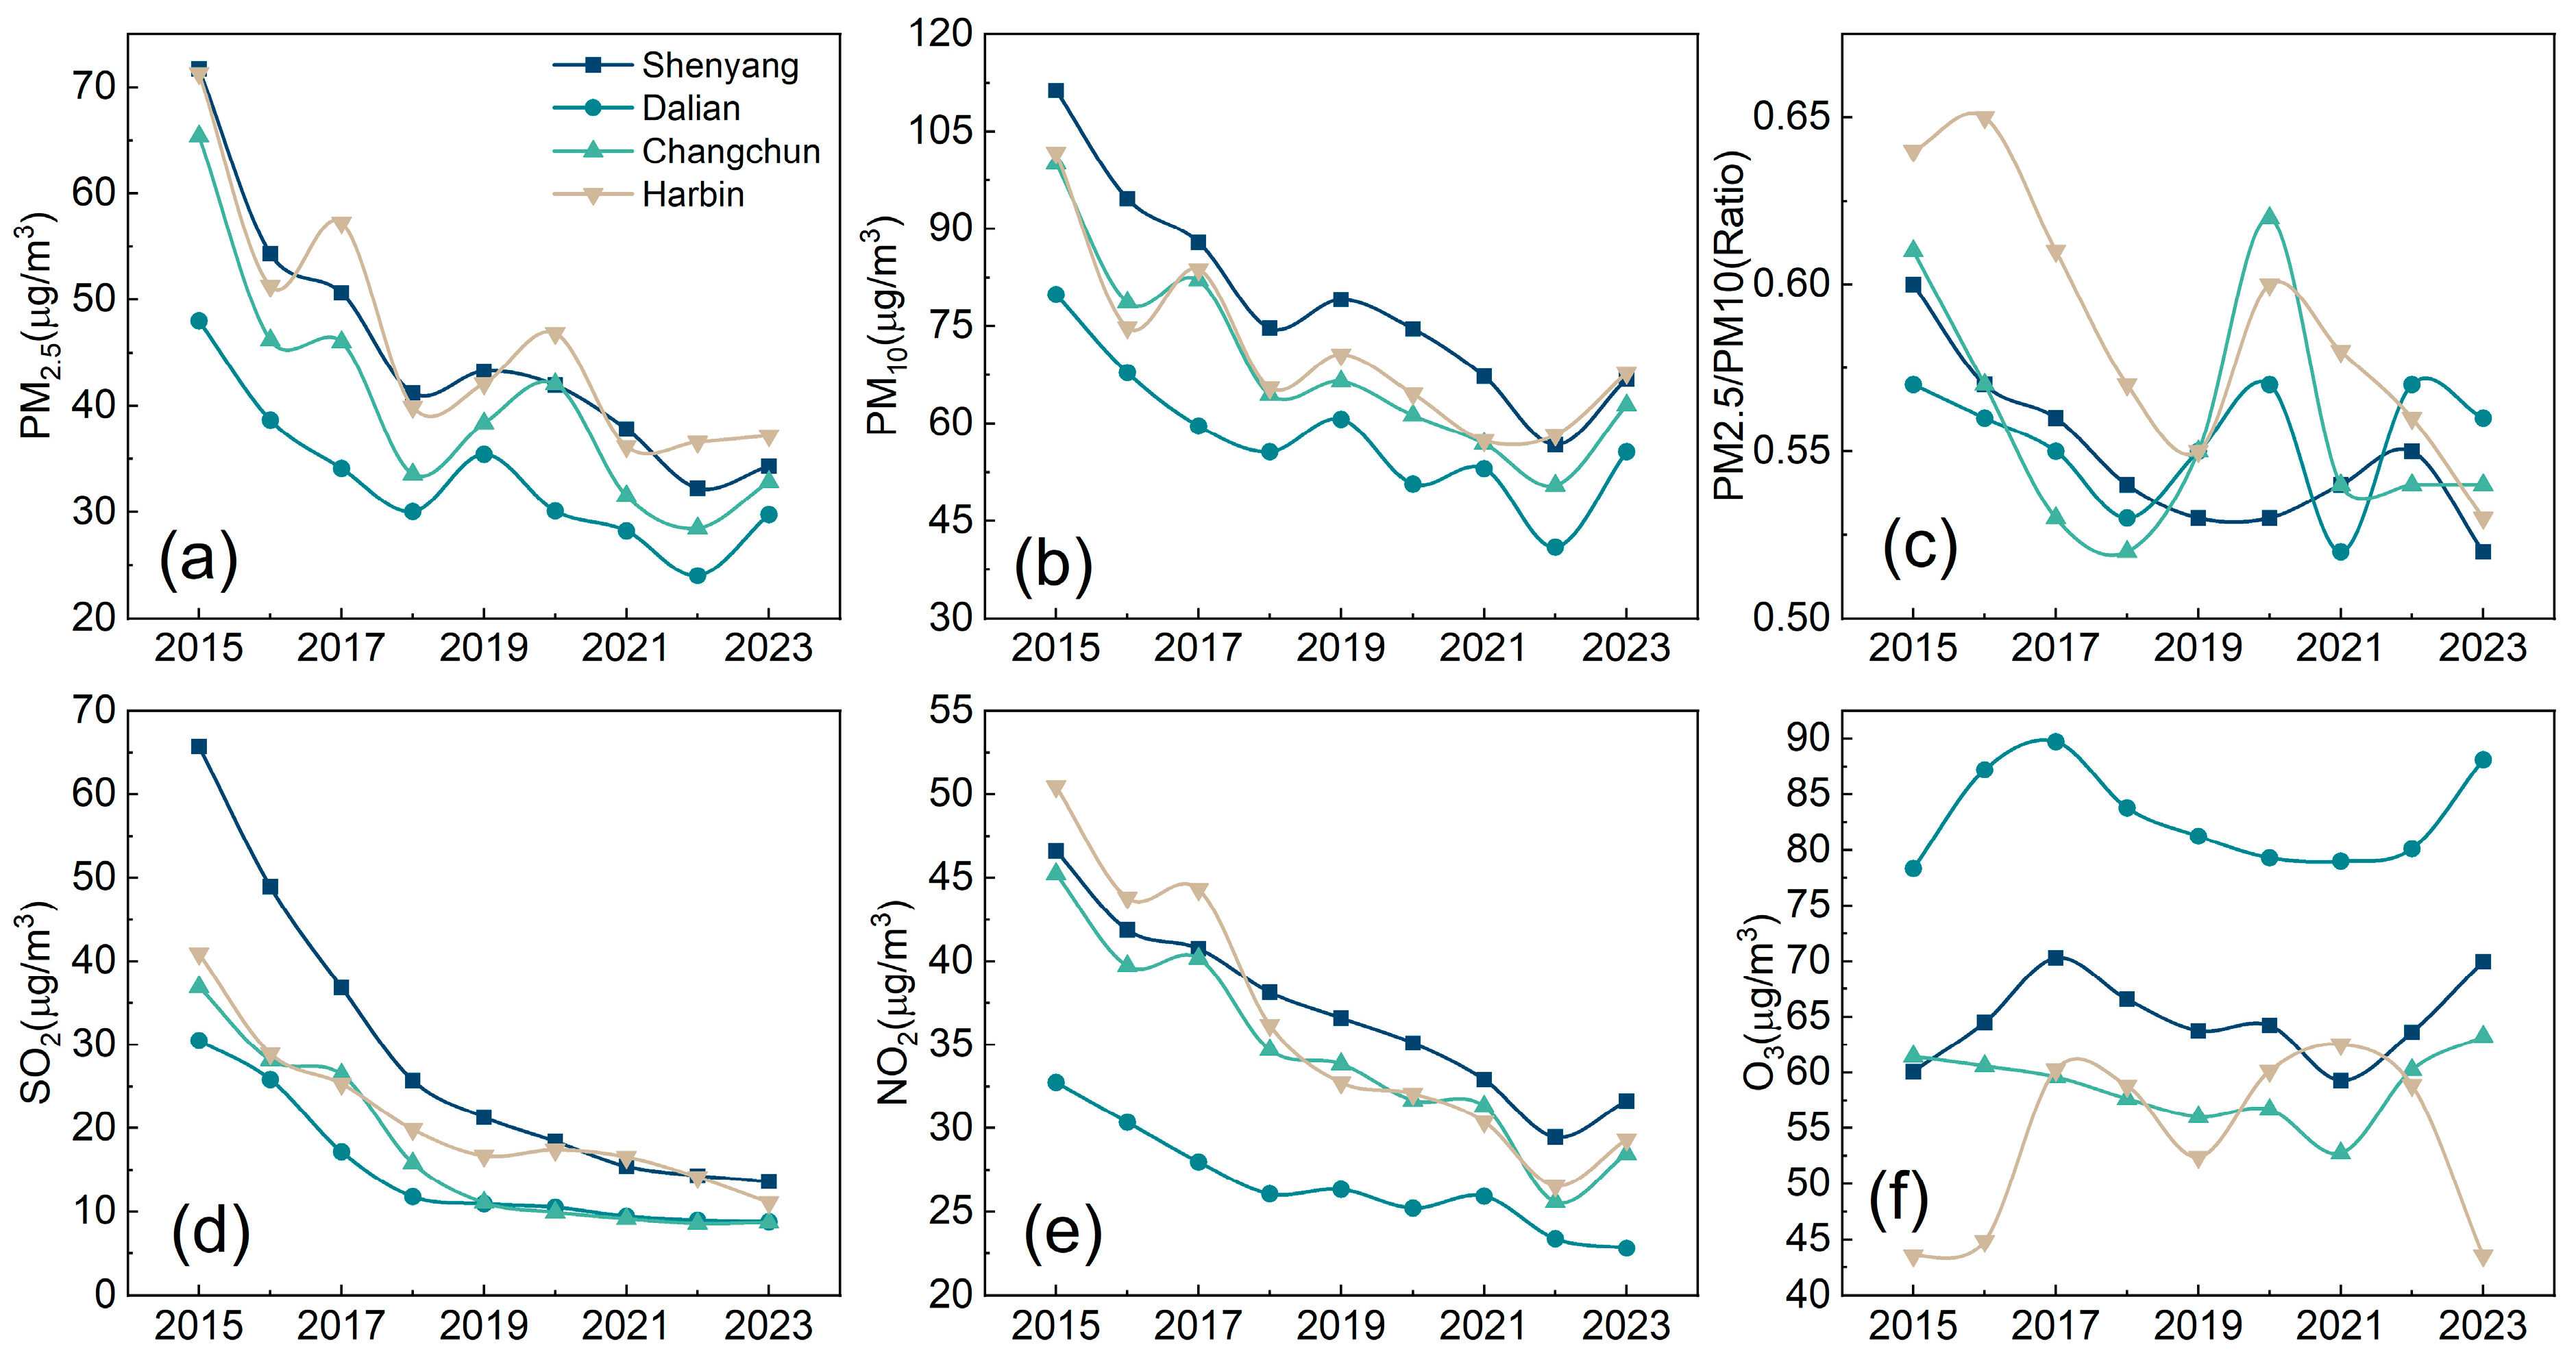
As shown in Figure 2 and Tables S2–S7, annual mean concentrations of PM2.5, PM10, SO2, and NO2 in Shenyang, Dalian, Changchun, and Harbin exhibited significant declines from 2015 to 2023 (p < 0.05). Among the four cities, Shenyang recorded the largest reductions in PM10 (−39.9%), PM2.5 (−52.1%), and SO2 (−79.3%), while Harbin showed the steepest decrease in NO2 (−41.9%). In contrast, O3 concentrations (expressed as MDA8) in Dalian consistently exceeded those in the other cities, peaking at 89.7 μg m−3 in 2017. Overall, Dalian maintained comparatively low concentrations of most pollutants, whereas Changchun and Harbin displayed periodic rebounds despite an overall downward trend.
From 2015 to 2018, all four cities experienced substantial PM2.5 reductions—42.4% in Shenyang, 37.4% in Dalian, 48.2% in Changchun, and 43.7% in Harbin—coinciding with the implementation of China’s Clean Air Action Plan and nationwide ultra-low-emission retrofits across key industries. Although a minor rebound occurred in 2019, the overall decline continued through 2023. Despite these notable improvements, average annual PM2.5 concentrations (24.0–71.7 μg m−3) in all four cities remained above the Level I NAAQS (15 μg m−3). Harbin frequently recorded the highest PM2.5 levels, indicating the city’s persistently severe particulate pollution.
Temporal variations in PM10 closely mirrored those of PM2.5, with annual means ranging from 41.0 to 111.3 μg m−3, generally exceeding the Grade I standard (40 μg m−3). In 2022, PM10 levels in Dalian declined to 41.0 μg m−3, approaching the national threshold. Shenyang recorded the highest PM10 concentrations between 2015 and 2021, but Harbin surpassed it after 2022. Combined with its elevated PM2.5 levels, Harbin exhibited a persistently high particle burden, underscoring the need for sustained, integrated emission control—particularly targeting fugitive dust and regional transport in cold-climate regions.
To further characterize particulate matter pollution, the PM2.5/PM10 ratio was calculated (Figure 2c; Table S6). This ratio is widely used to distinguish fine-particle-dominated pollution (high ratios, typically driven by combustion sources and secondary aerosols) from coarse-particle-dominated pollution (low ratios, mainly associated with dust and sand) [18]. From 2015 to 2018, Harbin consistently exhibited the highest annual PM2.5/PM10 ratio among the four cities, indicating a stronger influence of combustion emissions and secondary aerosol formation (e.g., NO3, SO42−, NH4+) [22,23]. These elevated ratios reflect the city’s prolonged heating season and intensive coal consumption, where the continued operation of low-efficiency boilers further reinforced fine-particle dominance [24,25,26]. By 2023, the PM2.5/PM10 ratio in Harbin had significantly declined (p < 0.05), demonstrating the positive effects of clean-energy transitions and strengthened emission control. Notably, although the COVID-19 lockdown (24 January–31 March 2020) led to nationwide reductions in air pollutants [27], the PM2.5/PM10 ratios in Harbin and Changchun increased significantly compared with 2019 (p < 0.05). This temporary rise was likely attributable to firework emissions during the Spring Festival, the continued operation of coal-fired power and petrochemical facilities, and stagnant meteorological conditions during the lockdown period [28,29,30]. To investigate the potential sources of particulate matter in different cities, the correlations between PM2.5 and CO, SO2, and NO2 were analyzed (Figures S5–S7). The results show that PM2.5 concentrations were strongly correlated with CO (r = 0.69–0.75) across all four cities, with the highest correlation observed in Changchun, indicating a significant contribution from combustion sources such as residential heating, industrial activities, and vehicle emissions. In contrast, the correlations between PM2.5 and SO2 were weaker (r = 0.41–0.53), suggesting a limited influence of secondary sulfate formation. The correlations between PM2.5 and NO2 were moderate to strong (r = 0.57–0.66), particularly in Harbin and Shenyang, implying that secondary nitrate formation also played an important role in particulate matter accumulation.
SO2 primarily originates from fossil fuel combustion for heating and power generation [27]. Shenyang recorded the highest annual SO2 concentrations between 2015 and 2020, but levels declined significantly during 2015–2019 (p < 0.05; Figure 2d, Table S7). This reduction reflects the combined effects of flue gas desulfurization (FGD) installation, ultra-low-emission retrofits, clean-energy substitution, and industrial restructuring toward lower energy intensity [31]. The coastal city of Dalian also benefited from stringent marine fuel sulfur limits and port energy optimization, maintaining consistently lower SO2 concentrations than the inland cities [32]. Since 2020, SO2 concentrations in all four cities have remained below the Grade I standard (20 μg m−3), with no statistically significant differences in their rates of decline (p > 0.05).
NO2, the principal component of NOx, is primarily emitted from fossil fuel combustion [33]. From 2015 to 2023, annual mean NO2 concentrations decreased by 32.1% in Shenyang, 30.3% in Dalian, 37.0% in Changchun, and 41.9% in Harbin, with all cities falling below the Grade I NAAQS limit (40 μg m−3) after 2018 (Figure 2e). This decline mainly reflects enhanced NOx emission control across the power, industrial, and transportation sectors, together with the increasing adoption of new energy vehicles [34]. Dalian consistently recorded the lowest NO2 concentrations, likely due to the dispersive effect of sea–land breeze circulation.
O3 is produced through photochemical reactions involving CO and non-methane volatile organic compounds (NMVOCs) in the presence of NOx [35], and its variability is strongly modulated by meteorological conditions [36]. Between 2017 and 2021, O3 concentrations in Dalian, Shenyang, and Changchun exhibited a declining trend, likely associated with changes in the photochemical environment driven by reduced NO2 levels [37]. From 2021 to 2023, however, O3 levels in these three cities rebounded. Notably, in 2023, Dalian maintained elevated O3 concentrations despite further reductions in NO2 levels. Similar behavior has been observed in other coastal regions, such as the Pearl River Delta and the South China Sea, where O3 pollution tends to be more pronounced. This pattern underscores the complexity of O3 formation in coastal environments, where reductions in NOx emissions alone do not necessarily result in lower O3 levels. Instead, meteorological variability, regional transport, sea–land breeze recirculation, and coastal recycling processes can collectively enhance surface O3 concentrations [38,39]. In contrast, Harbin exhibited an opposite pattern compared with the other three cities from 2019 to 2023, displaying atypical O3 variability likely influenced by asynchronous photochemical processes under low temperatures, limited solar radiation, and distinct regional transport dynamics.
Overall, since 2015, PM2.5, PM10, SO2, and NO2 have declined significantly (p < 0.05), demonstrating the effectiveness of multisectoral air-quality control measures. Nevertheless, O3 remains a persistent challenge for regional air quality improvement, reflecting the nonlinear nature of its photochemical formation and the amplifying influence of meteorological factors.

3.2. Monthly Mean Change in Pollutants

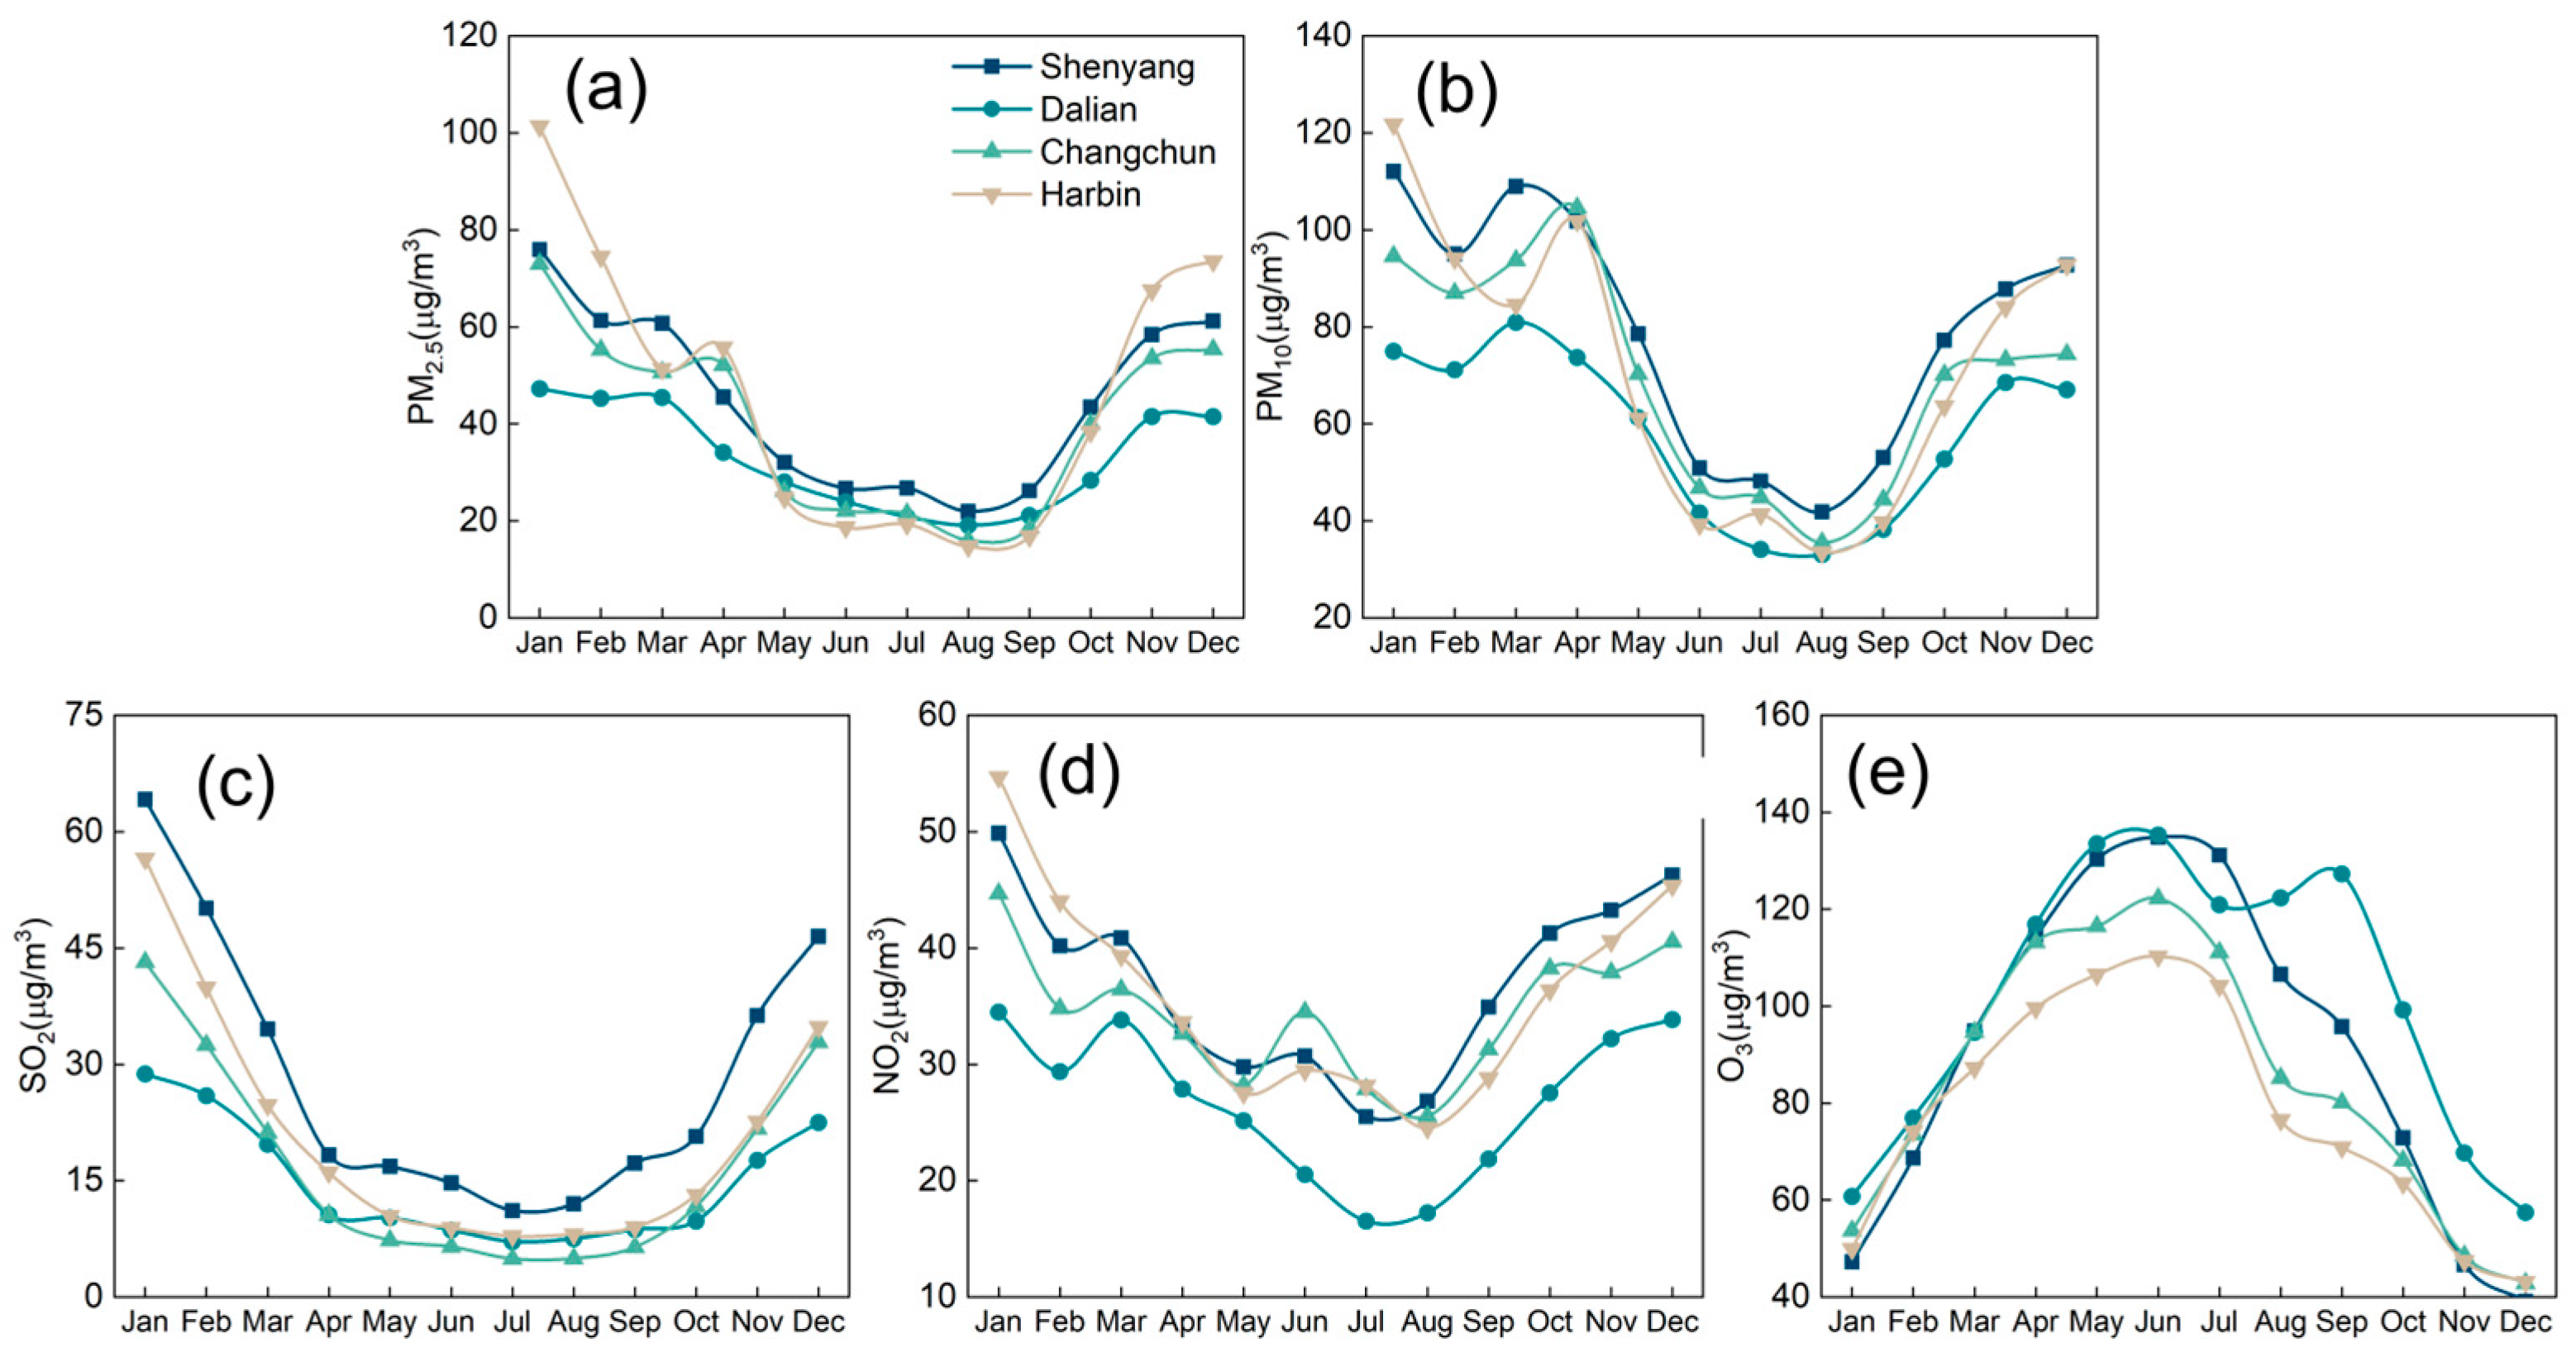
To examine the temporal variability of air pollution, monthly variations in five major pollutants (PM2.5, PM10, SO2, NO2, and O3) were analyzed for the four cities from 2015 to 2023 (Figure 3; Tables S8–S12). The results revealed clear and recurring seasonal cycles. Concentrations of PM2.5, PM10, SO2, and NO2 were markedly higher in winter and significantly lower in summer (p < 0.05). These pollutants typically began to rise in August or September and reached their annual peaks in January of the following year. The temporal patterns of PM2.5 and PM10 closely tracked those of NO2, indicating common emission sources and synchronized accumulation under stagnant winter conditions. In Liaoning Province, PM10 concentrations increased sharply in March (p < 0.05), whereas this rise was delayed until April in Changchun and Harbin. Moreover, SO2 concentrations across all four cities decreased significantly until April (p < 0.05), remained relatively stable from April to October (p > 0.05), and then increased markedly from October to December (p < 0.05). Overall, Shenyang and Harbin exhibited higher pollution levels than Dalian and Changchun (Figure 3a–d).
In contrast, O3 displayed an opposite seasonal pattern, increasing in summer and peaking in June, with Dalian experiencing the most severe O3 pollution. A secondary peak in September was also observed, consistent with previous reports that coastal cities north of 38.3° N exhibit a bimodal O3 pattern [40]. This bimodality has been linked to meteorological factors such as low relative humidity, high temperature, strong solar radiation, reduced cloud cover, specific wind regimes, and vertical dynamic structures [41]. These results suggest that, compared with inland cities, O3 formation in coastal regions like Dalian is more strongly modulated by meteorological conditions and the complexity of sea–land breeze circulations.
The winter peak in particulate matter concentrations may be associated with reduced precipitation, enhanced wind speeds, and the formation of secondary organic–inorganic aerosols from both fresh emissions and coal combustion during the heating season [42,43]. The summer rise in O3 was primarily driven by photochemical reactions. Notably, the onset of PM2.5 and PM10 increases in Liaoning Province occurred earlier than in Changchun and Harbin, likely reflecting latitudinal differences in seasonal warming. Owing to its lower latitude, spring temperatures in Liaoning increase earlier, advancing the onset of construction activities and spring tillage, which in turn enhances soil disturbance and dust emissions. In addition to these latitude-dependent factors and anthropogenic rhythms, prevailing northerly winds in spring can transport dry, cold air masses from upstream regions, further facilitating local dust uplift. The combined effects of meteorological and human influences therefore contributed to the earlier spring resurgence of particulate matter in Liaoning.

3.3. Principal Component Analysis

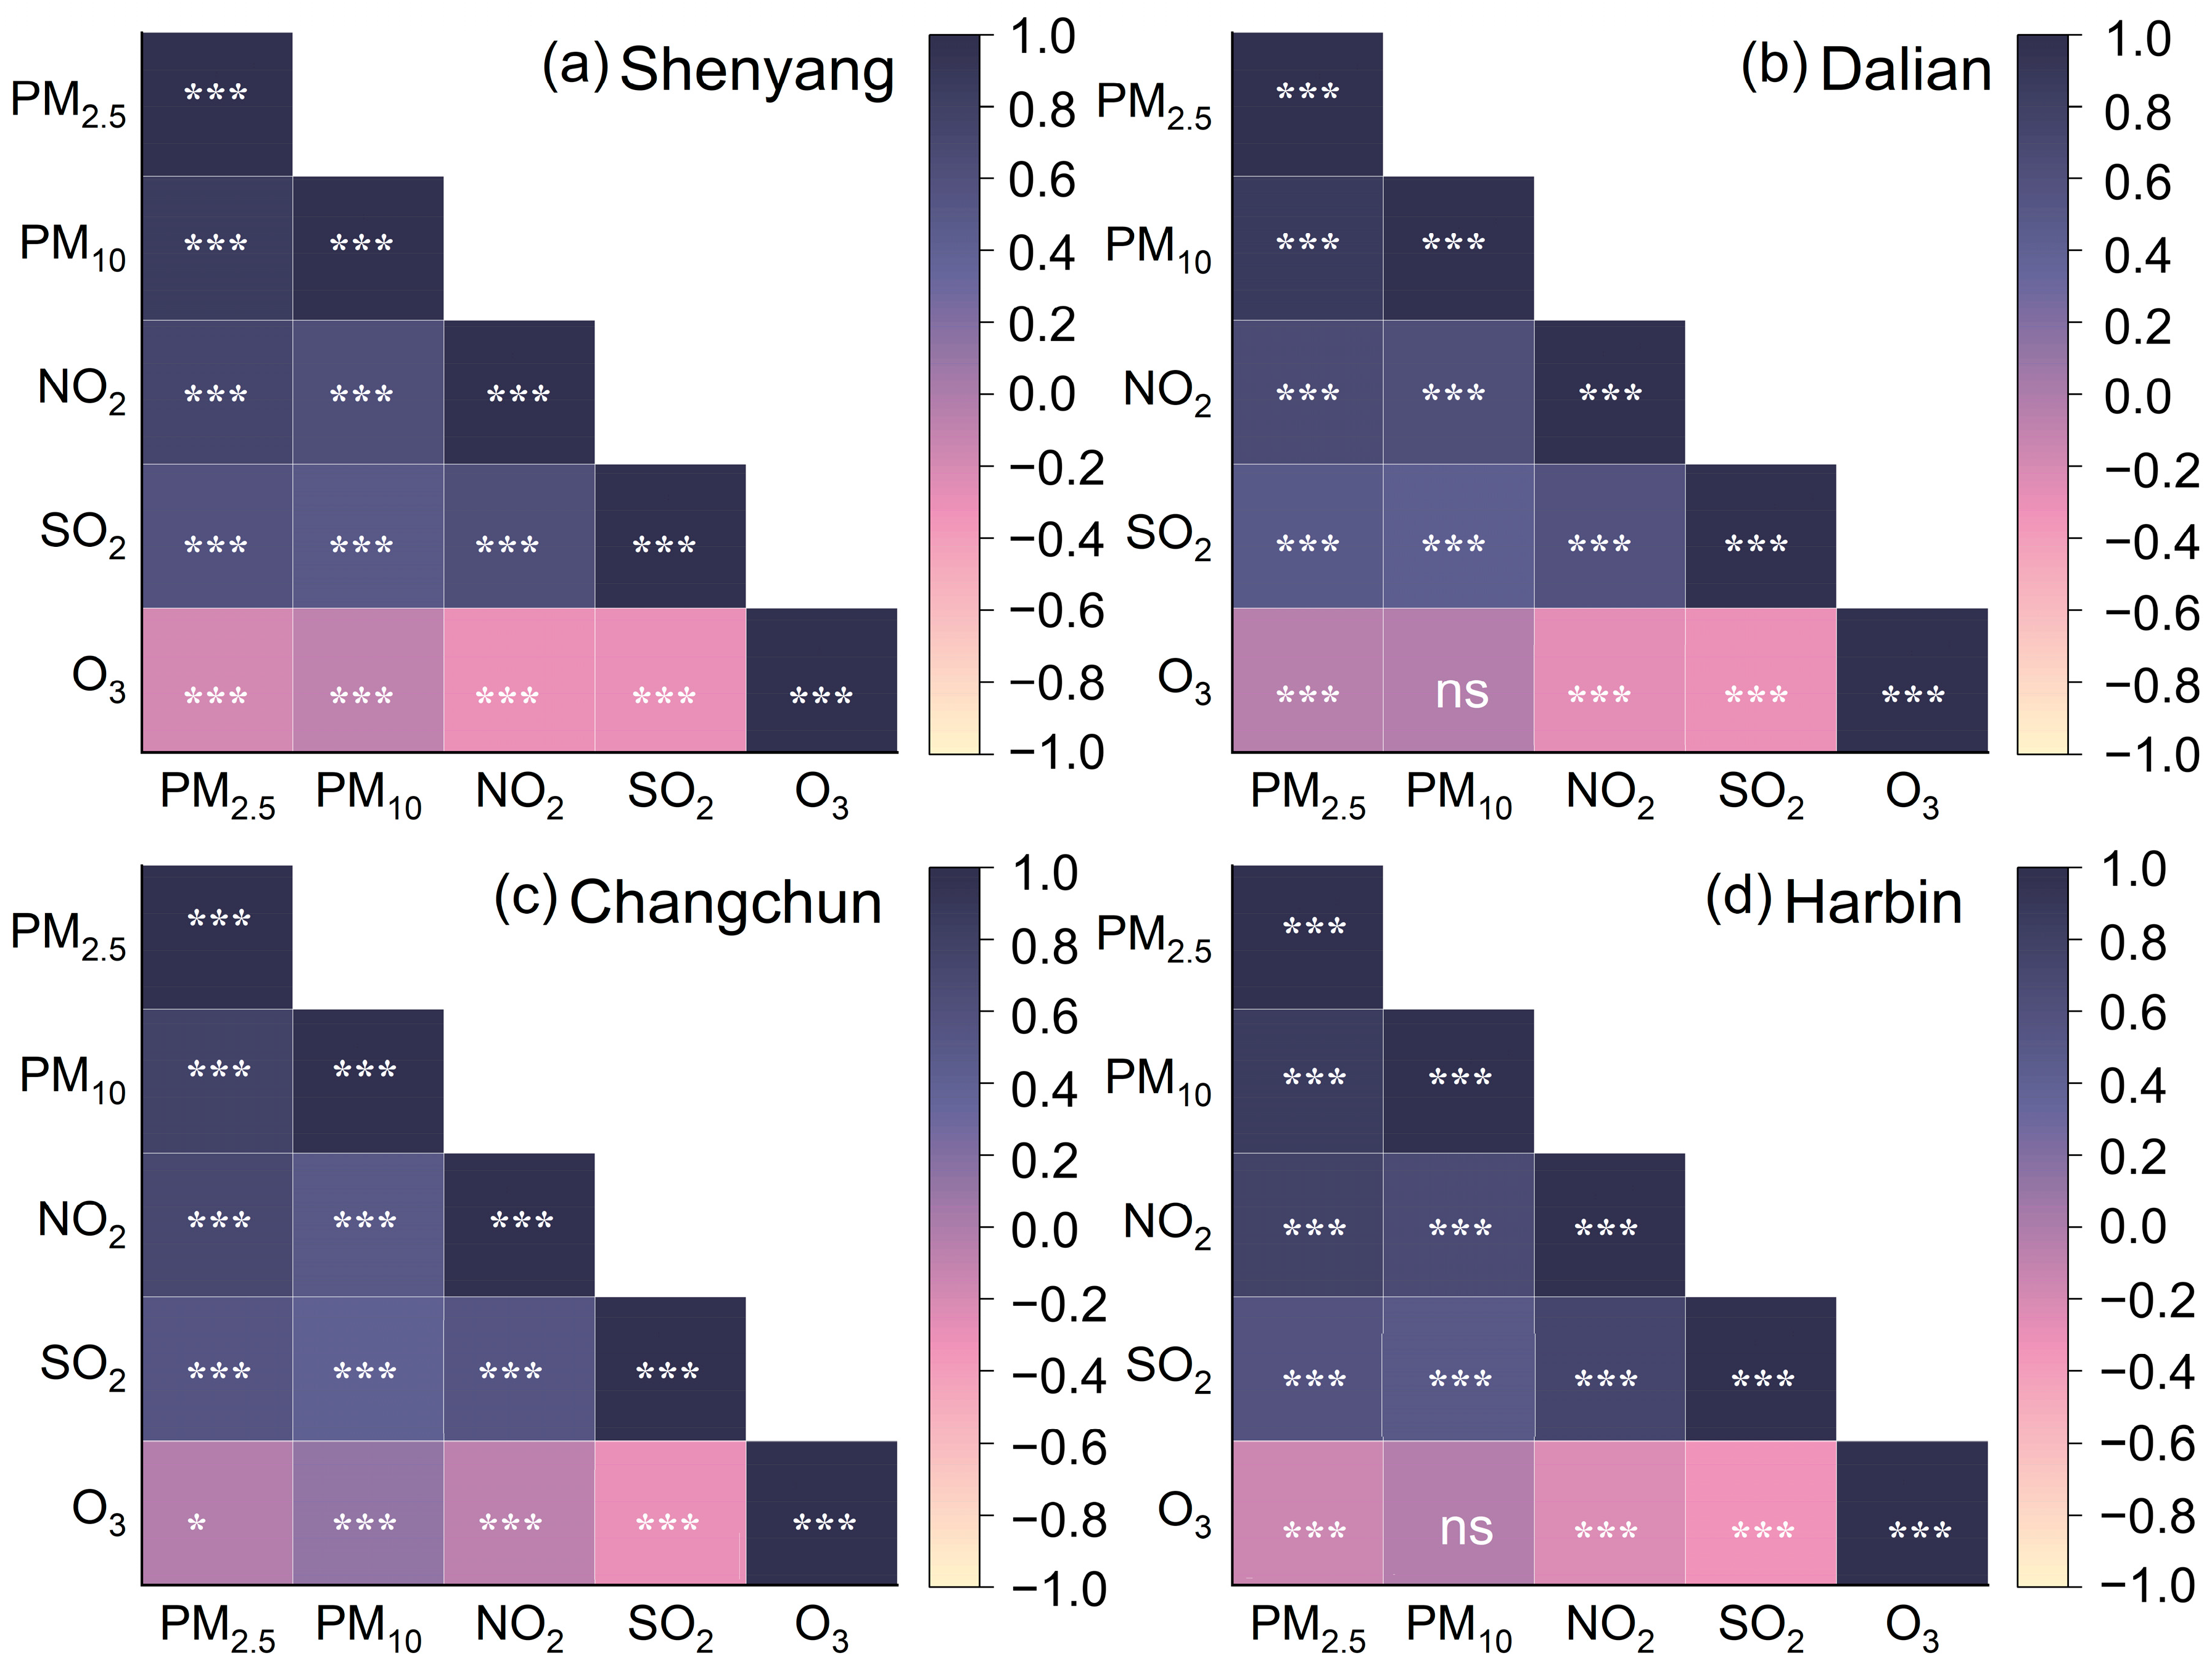
Figure 4 and Figure S8 present the Pearson correlation matrices of trace gases and particulate matter in Northeast Chinese cities, providing insight into the potential emission source characteristics of different pollutants. The results show that daily mean PM2.5 and PM10 concentrations were strongly and positively correlated across all cities (p < 0.001). Both PM2.5 and PM10 also exhibited significant positive correlations with SO2 and NO2 (p < 0.001), indicating consistent co-variation patterns among these pollutants. Such relationships suggest that particulate and gaseous pollutants likely originate from common emission sources or accumulate simultaneously through atmospheric interactions, leading to synchronized fluctuations in their concentrations. Similar patterns have been reported in Wuhan, China [44].
In contrast, O3 generally exhibited weak negative correlations with other pollutants (p < 0.05), except for PM10 in Dalian and Harbin, where correlations were not statistically significant (p > 0.05). This inverse relationship between O3 and the other four pollutants, evident in Figure 4a,c, reflects the opposing chemical and meteorological drivers of O3 formation relative to primary pollutant accumulation [45]. Winter observations in Xuchang similarly revealed negative correlations among PM2.5, SO2, NO2, PM10, and O3. However, the strength and direction of these correlations vary seasonally. Several studies have shown that during summer or under high-temperature conditions, PM2.5 and O3 are often positively correlated [46], as elevated O3 levels and enhanced photochemical activity can facilitate secondary particle formation [47]. The opposite correlations observed in the four northeastern cities may be attributed to distinct summer meteorological conditions—characterized by intense solar radiation, high temperatures, frequent precipitation, and an elevated boundary layer height—that enhance photochemical O3 formation while simultaneously promoting PM2.5 dispersion. Moreover, when PM2.5 concentrations are low, their attenuation of solar radiation is reduced, further increasing photochemical efficiency and accelerating O3 production [47,48]. These findings highlight that pollutant interactions vary regionally, driven by differences in meteorological regimes and atmospheric dynamics.

3.4. Haze Pollution and Compound Pollution

The formation and evolution of haze pollution are strongly influenced by local meteorological conditions [3]. Meteorological factors modulate atmospheric composition and air quality by altering the spatial distribution, lifetime, and photochemical reactivity of pollutants [49]. Fog and haze days were identified according to the criteria described in the methodology. Figure 5 and Table S13 show the interannual variation in fog and haze days in the four cities from 2015 to 2023. Overall, the number of haze days exhibited a gradual year-on-year decline, with the highest counts in Shenyang (95 days) and the lowest in Dalian (41 days). Driven by sea–land breeze circulation, Dalian has a high ventilation coefficient, which facilitates the dilution and dispersion of particulate matter and its precursors, potentially explaining the lower number of haze days in Dalian compared with the three inland cities [50]. Notably, in 2022 and 2023, Harbin recorded the highest number of haze days among the four cities (100 and 97 days, respectively), surpassing Shenyang (81 and 94 days). This pattern closely mirrors the annual mean particulate matter concentrations in Harbin, as discussed above. Previous studies have also reported that particulate matter concentrations are significantly higher on haze days than on non-haze days [3]. In addition, limited solar radiation and low temperatures in the high-latitude regions of Northeast China intensify the accumulation and persistence of air pollutants, thereby increasing the frequency and duration of fog and haze events.
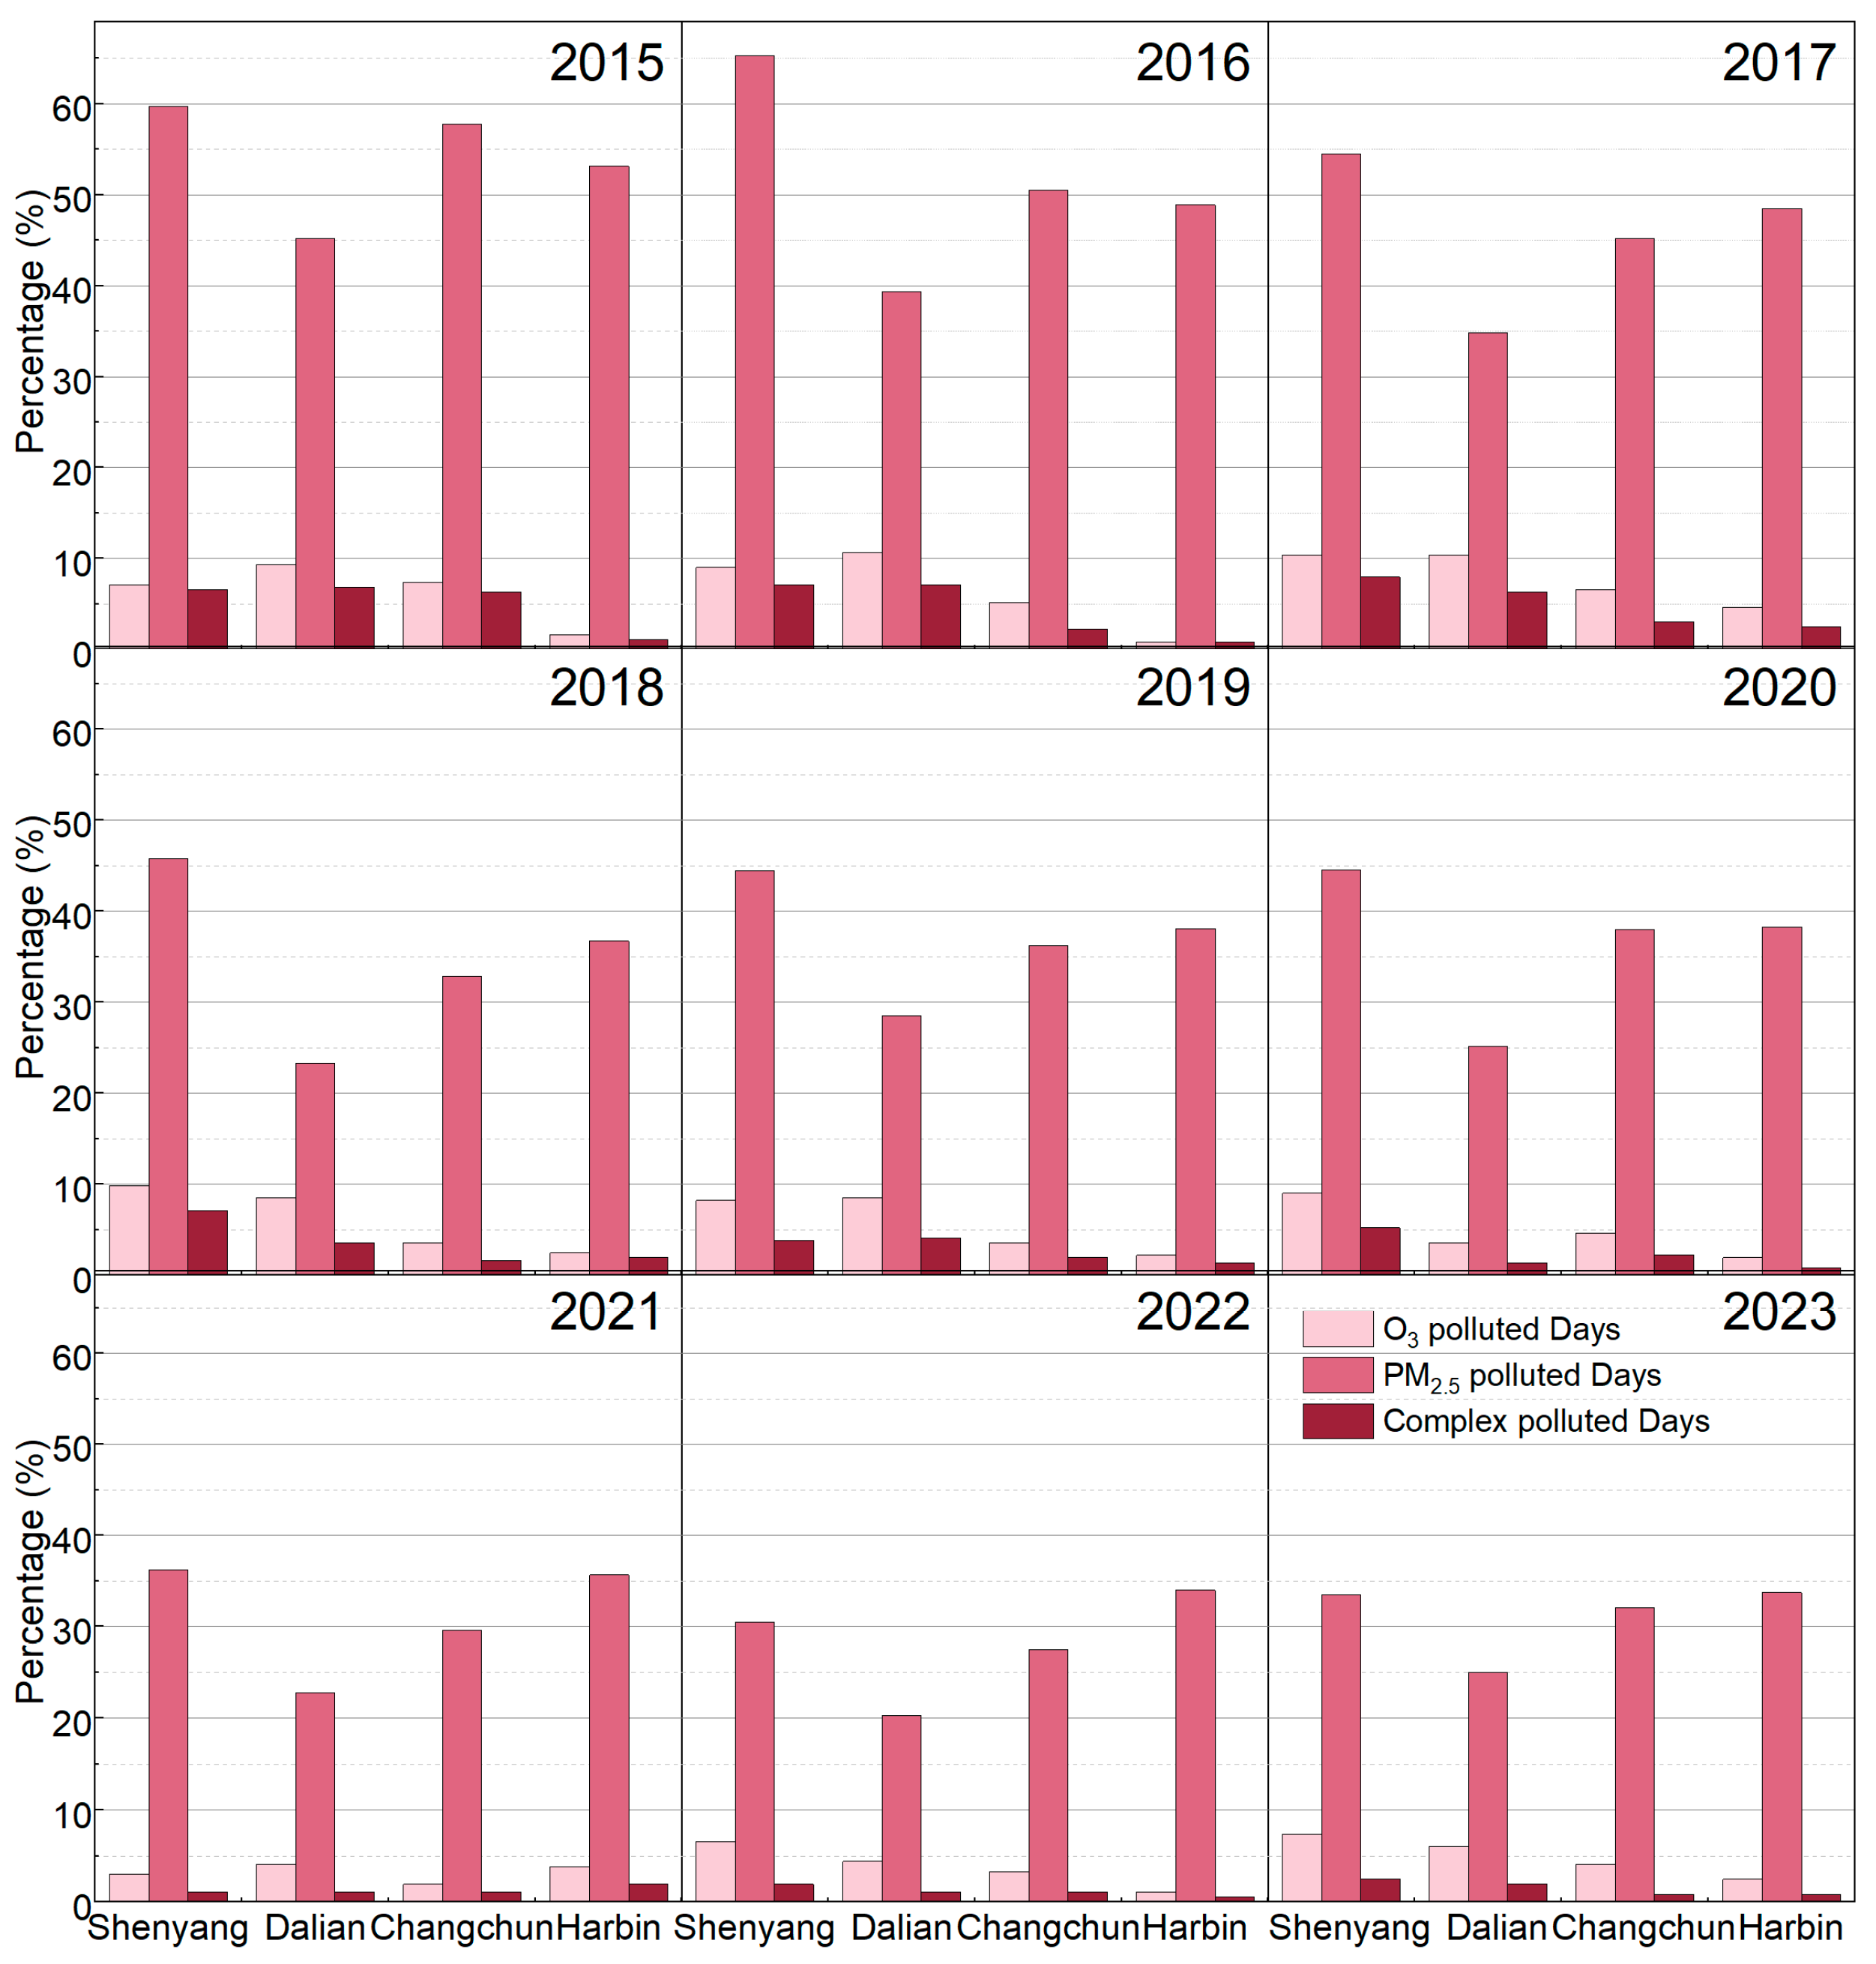
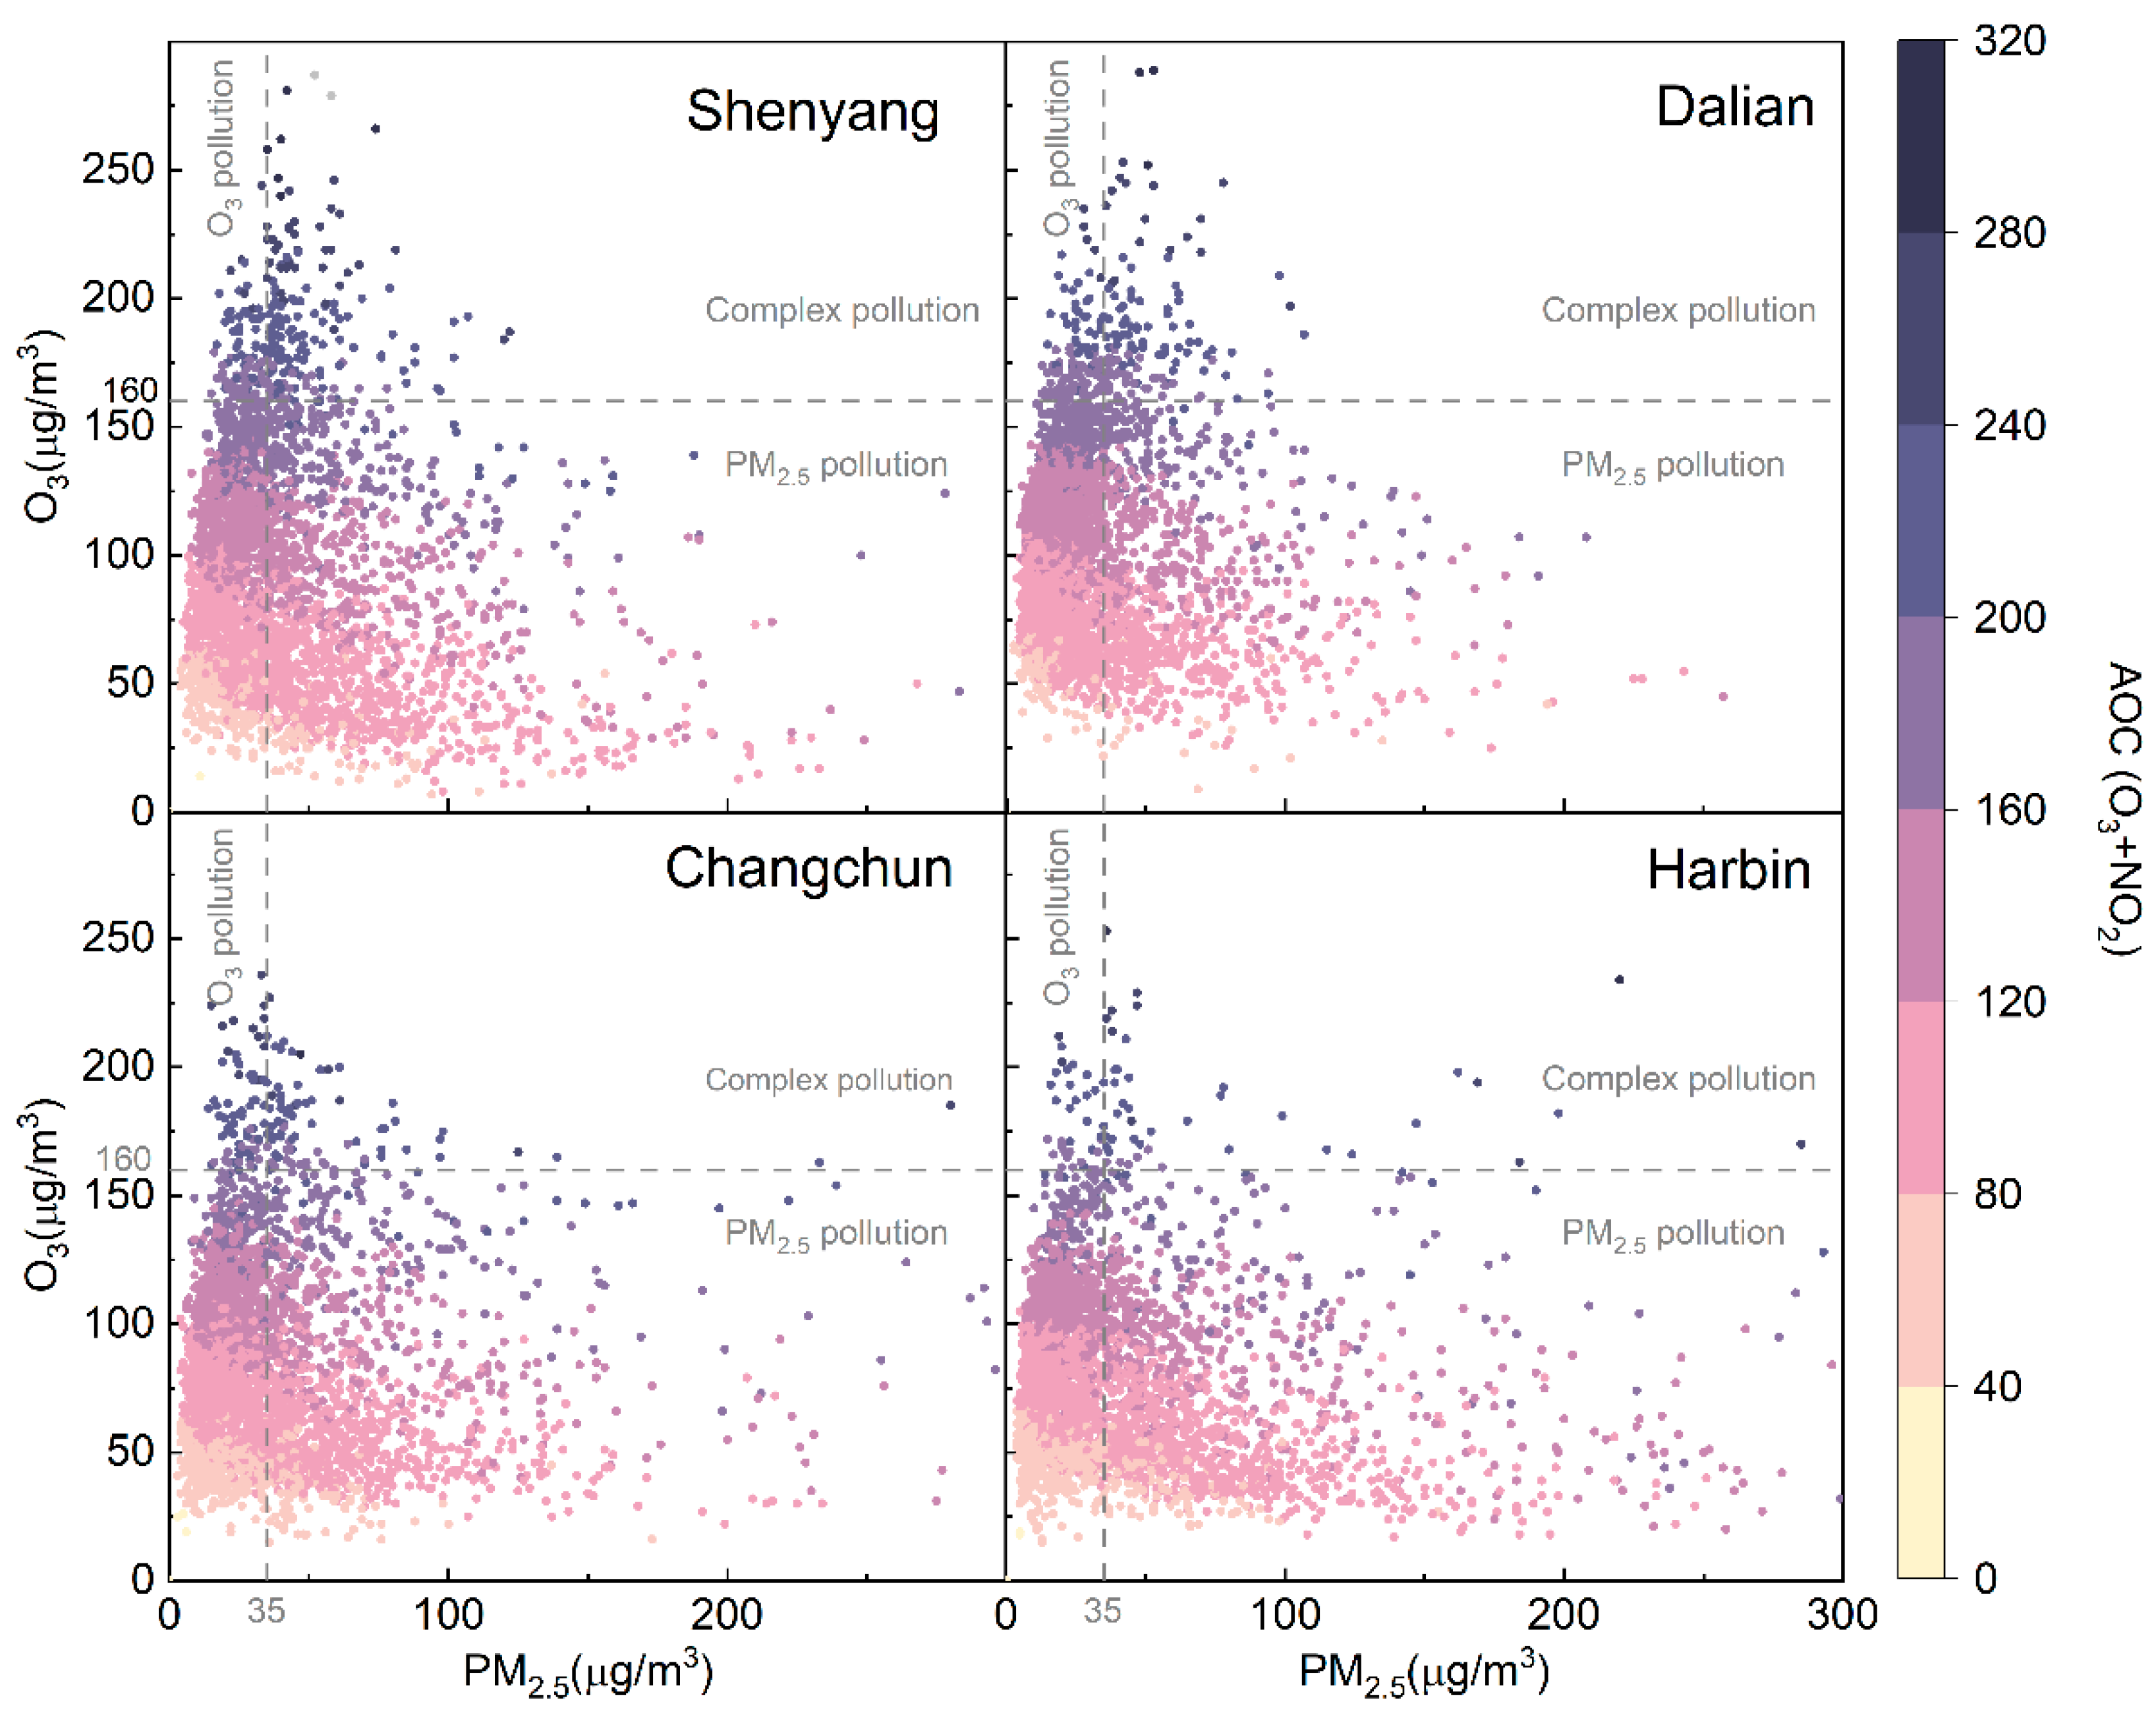
According to the thresholds defined in the methodology, an O3 pollution day was defined as O3 > 160 μg m−3, a PM2.5 pollution day as PM2.5 > 35 μg m−3, and a compound pollution day as a day meeting both criteria simultaneously. Figure 6 shows that the occurrences of these three pollution types in the four cities exhibited fluctuations but overall downward trends from 2015 to 2023. The number of PM2.5 pollution days decreased, with Dalian recording the fewest and Shenyang the most. Since 2017, Harbin’s PM2.5 pollution days have closely mirrored its haze-day trends, surpassing those in Changchun and Shenyang in 2017 and 2022, respectively. This pattern suggests that coal combustion and local climatic factors substantially contribute to secondary inorganic aerosol formation in Harbin.
In contrast, Shenyang and Dalian experienced a higher proportion of O3 and compound pollution days. From the perspective of atmospheric oxidation capacity (OX), Figure 7 illustrates the relationships among daily mean PM2.5, O3, and OX. On compound pollution days, the average OX values in Shenyang and Dalian were significantly higher than those in Changchun and Harbin, indicating stronger photochemical oxidation environments and more aged air masses under conditions of high temperature, intense radiation, and weak winds. In Dalian, where particulate matter concentrations are relatively low, the sea–land breeze cycle combined with clear-sky, high-radiation days enhances atmospheric light transmission and photochemical efficiency. Conversely, in Shenyang, persistent sunny conditions, elevated temperatures, and stagnant winds favor the buildup of high OX levels.
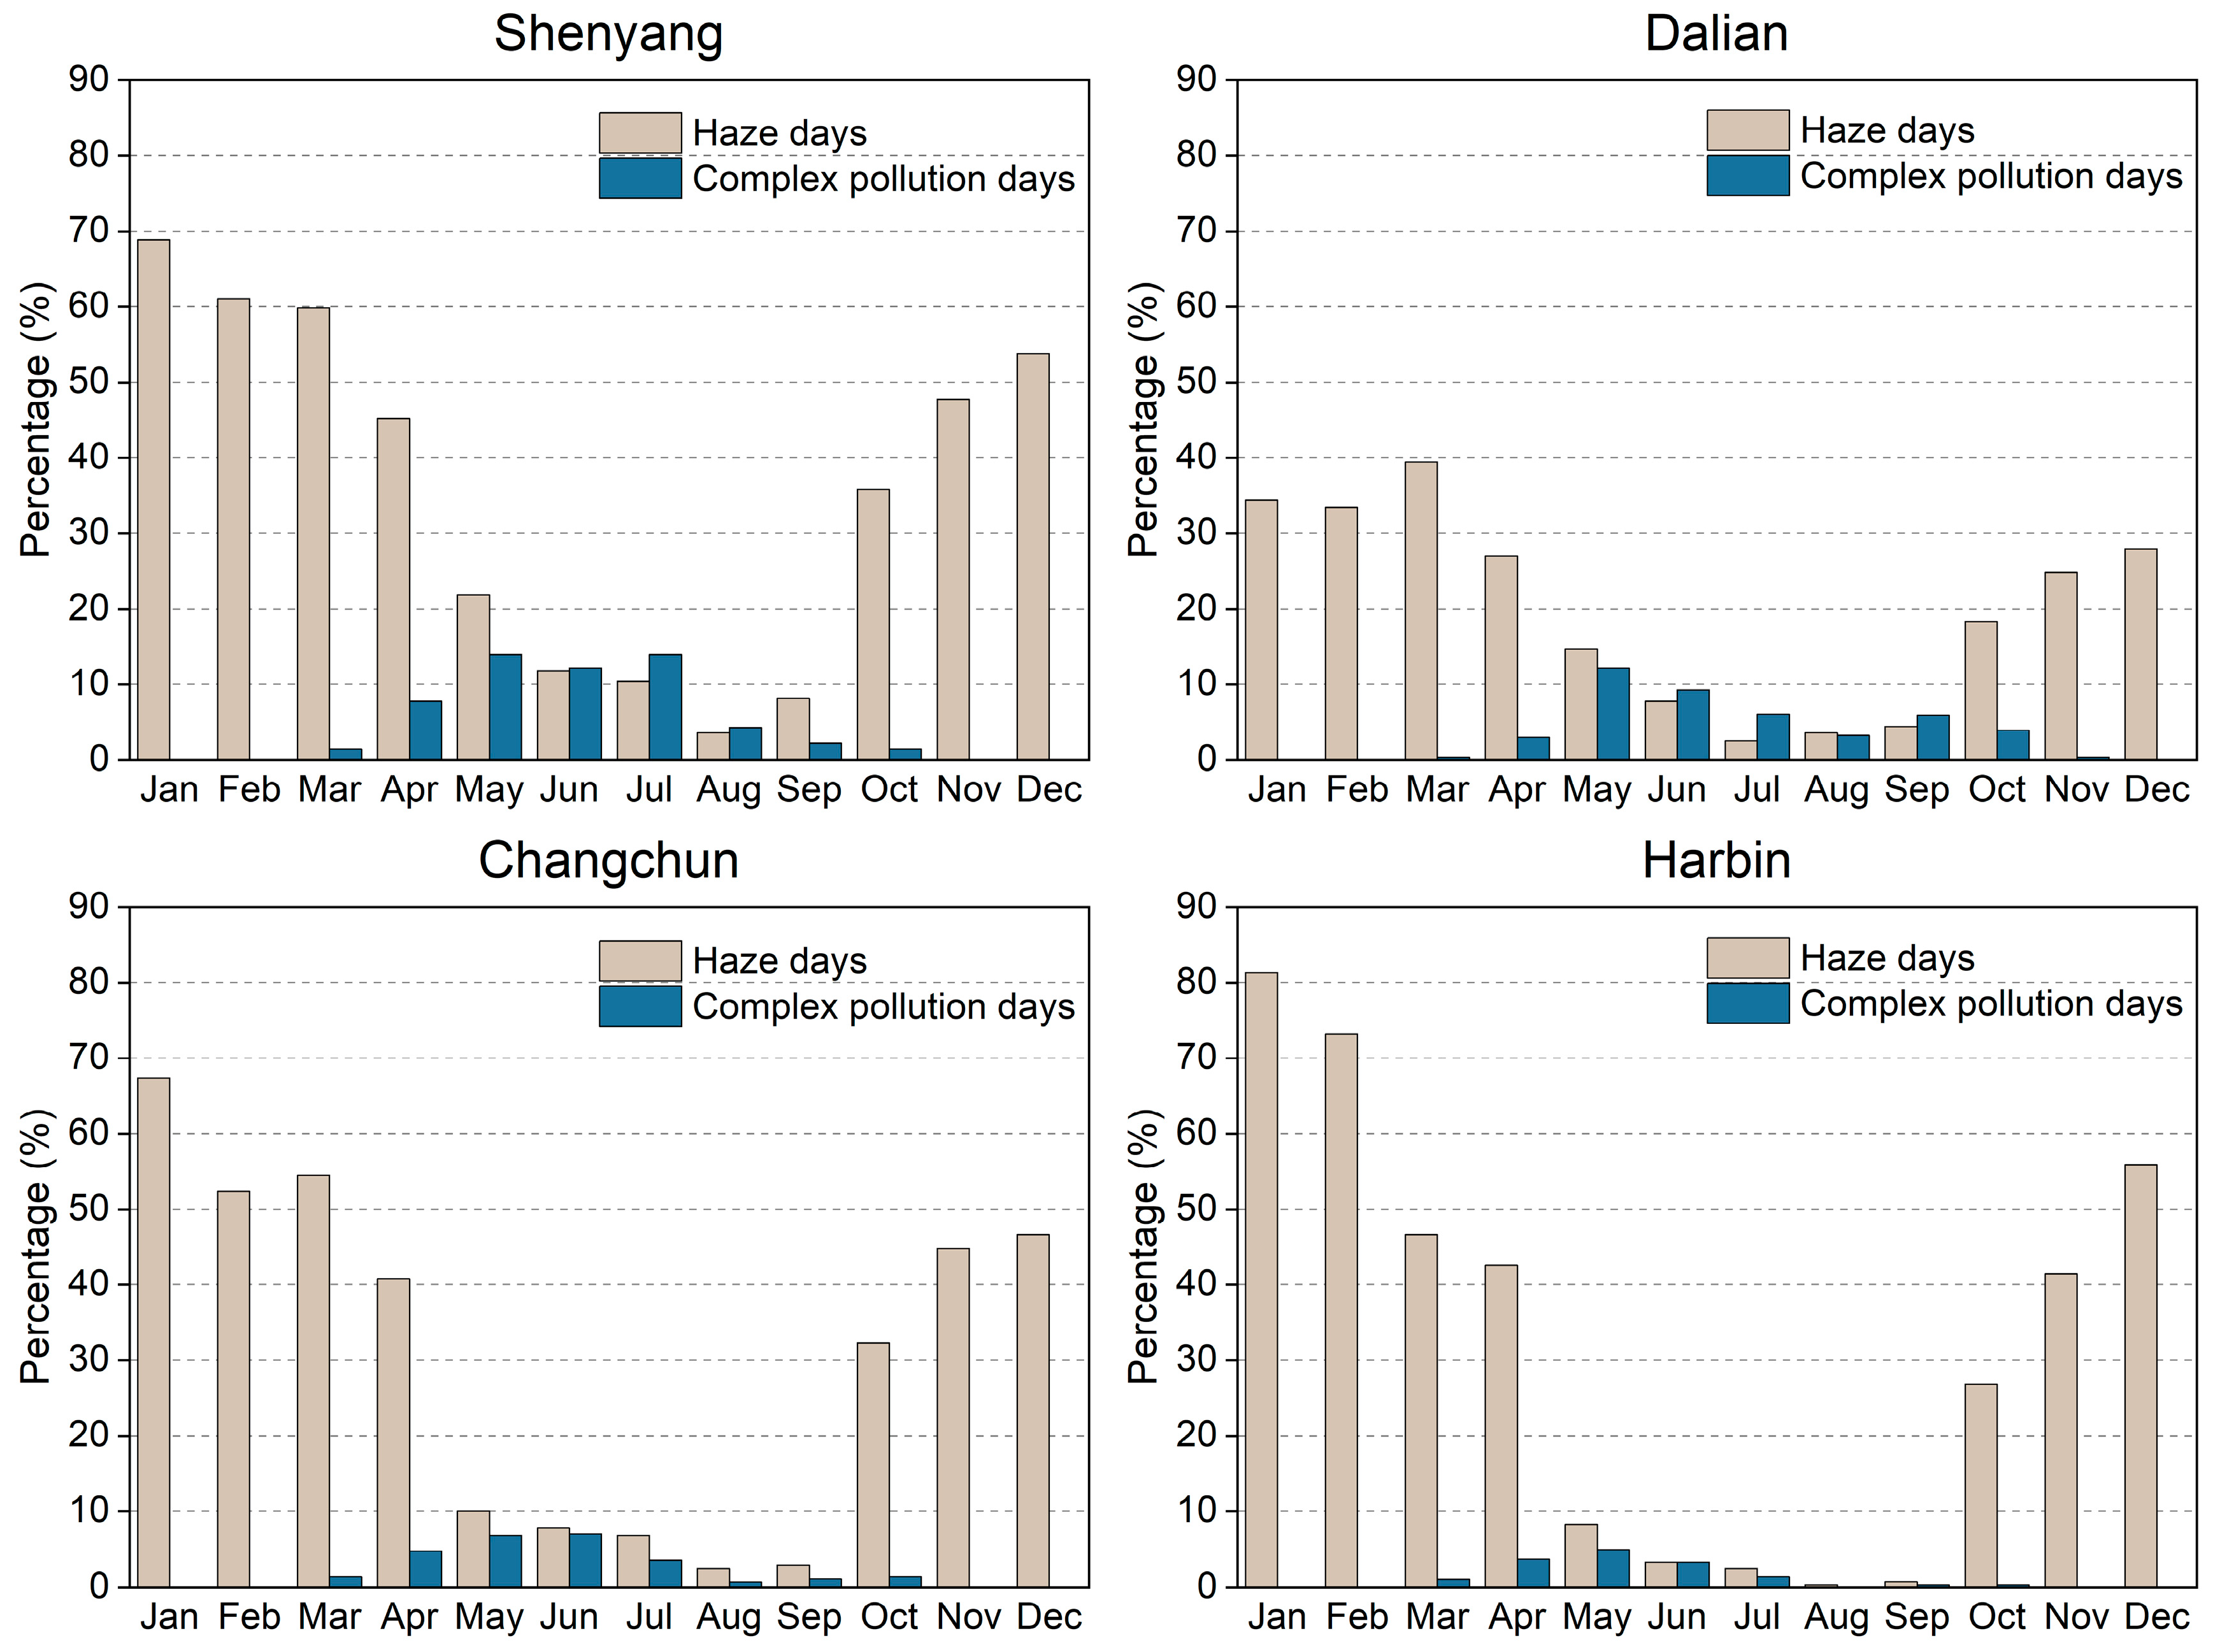
Figure 8 presents the monthly variations in the proportions of haze days and compound pollution days from 2015 to 2023. Overall, haze days were most frequent in winter, whereas compound pollution days dominated in summer. Except for Dalian, haze-day peaks generally occurred in January, while compound pollution peaks appeared in May for Shenyang, Dalian, and Harbin, and in June for Changchun. Notably, although Dalian exhibited fewer haze days than the inland cities, it experienced a higher proportion of compound pollution days between August and October. These findings suggest that winter haze in Northeast China is mainly driven by the accumulation of primary and secondary particles, whereas intense photochemical processes in summer lead to more frequent O3 and compound pollution events.

3.5. Meteorological Impact

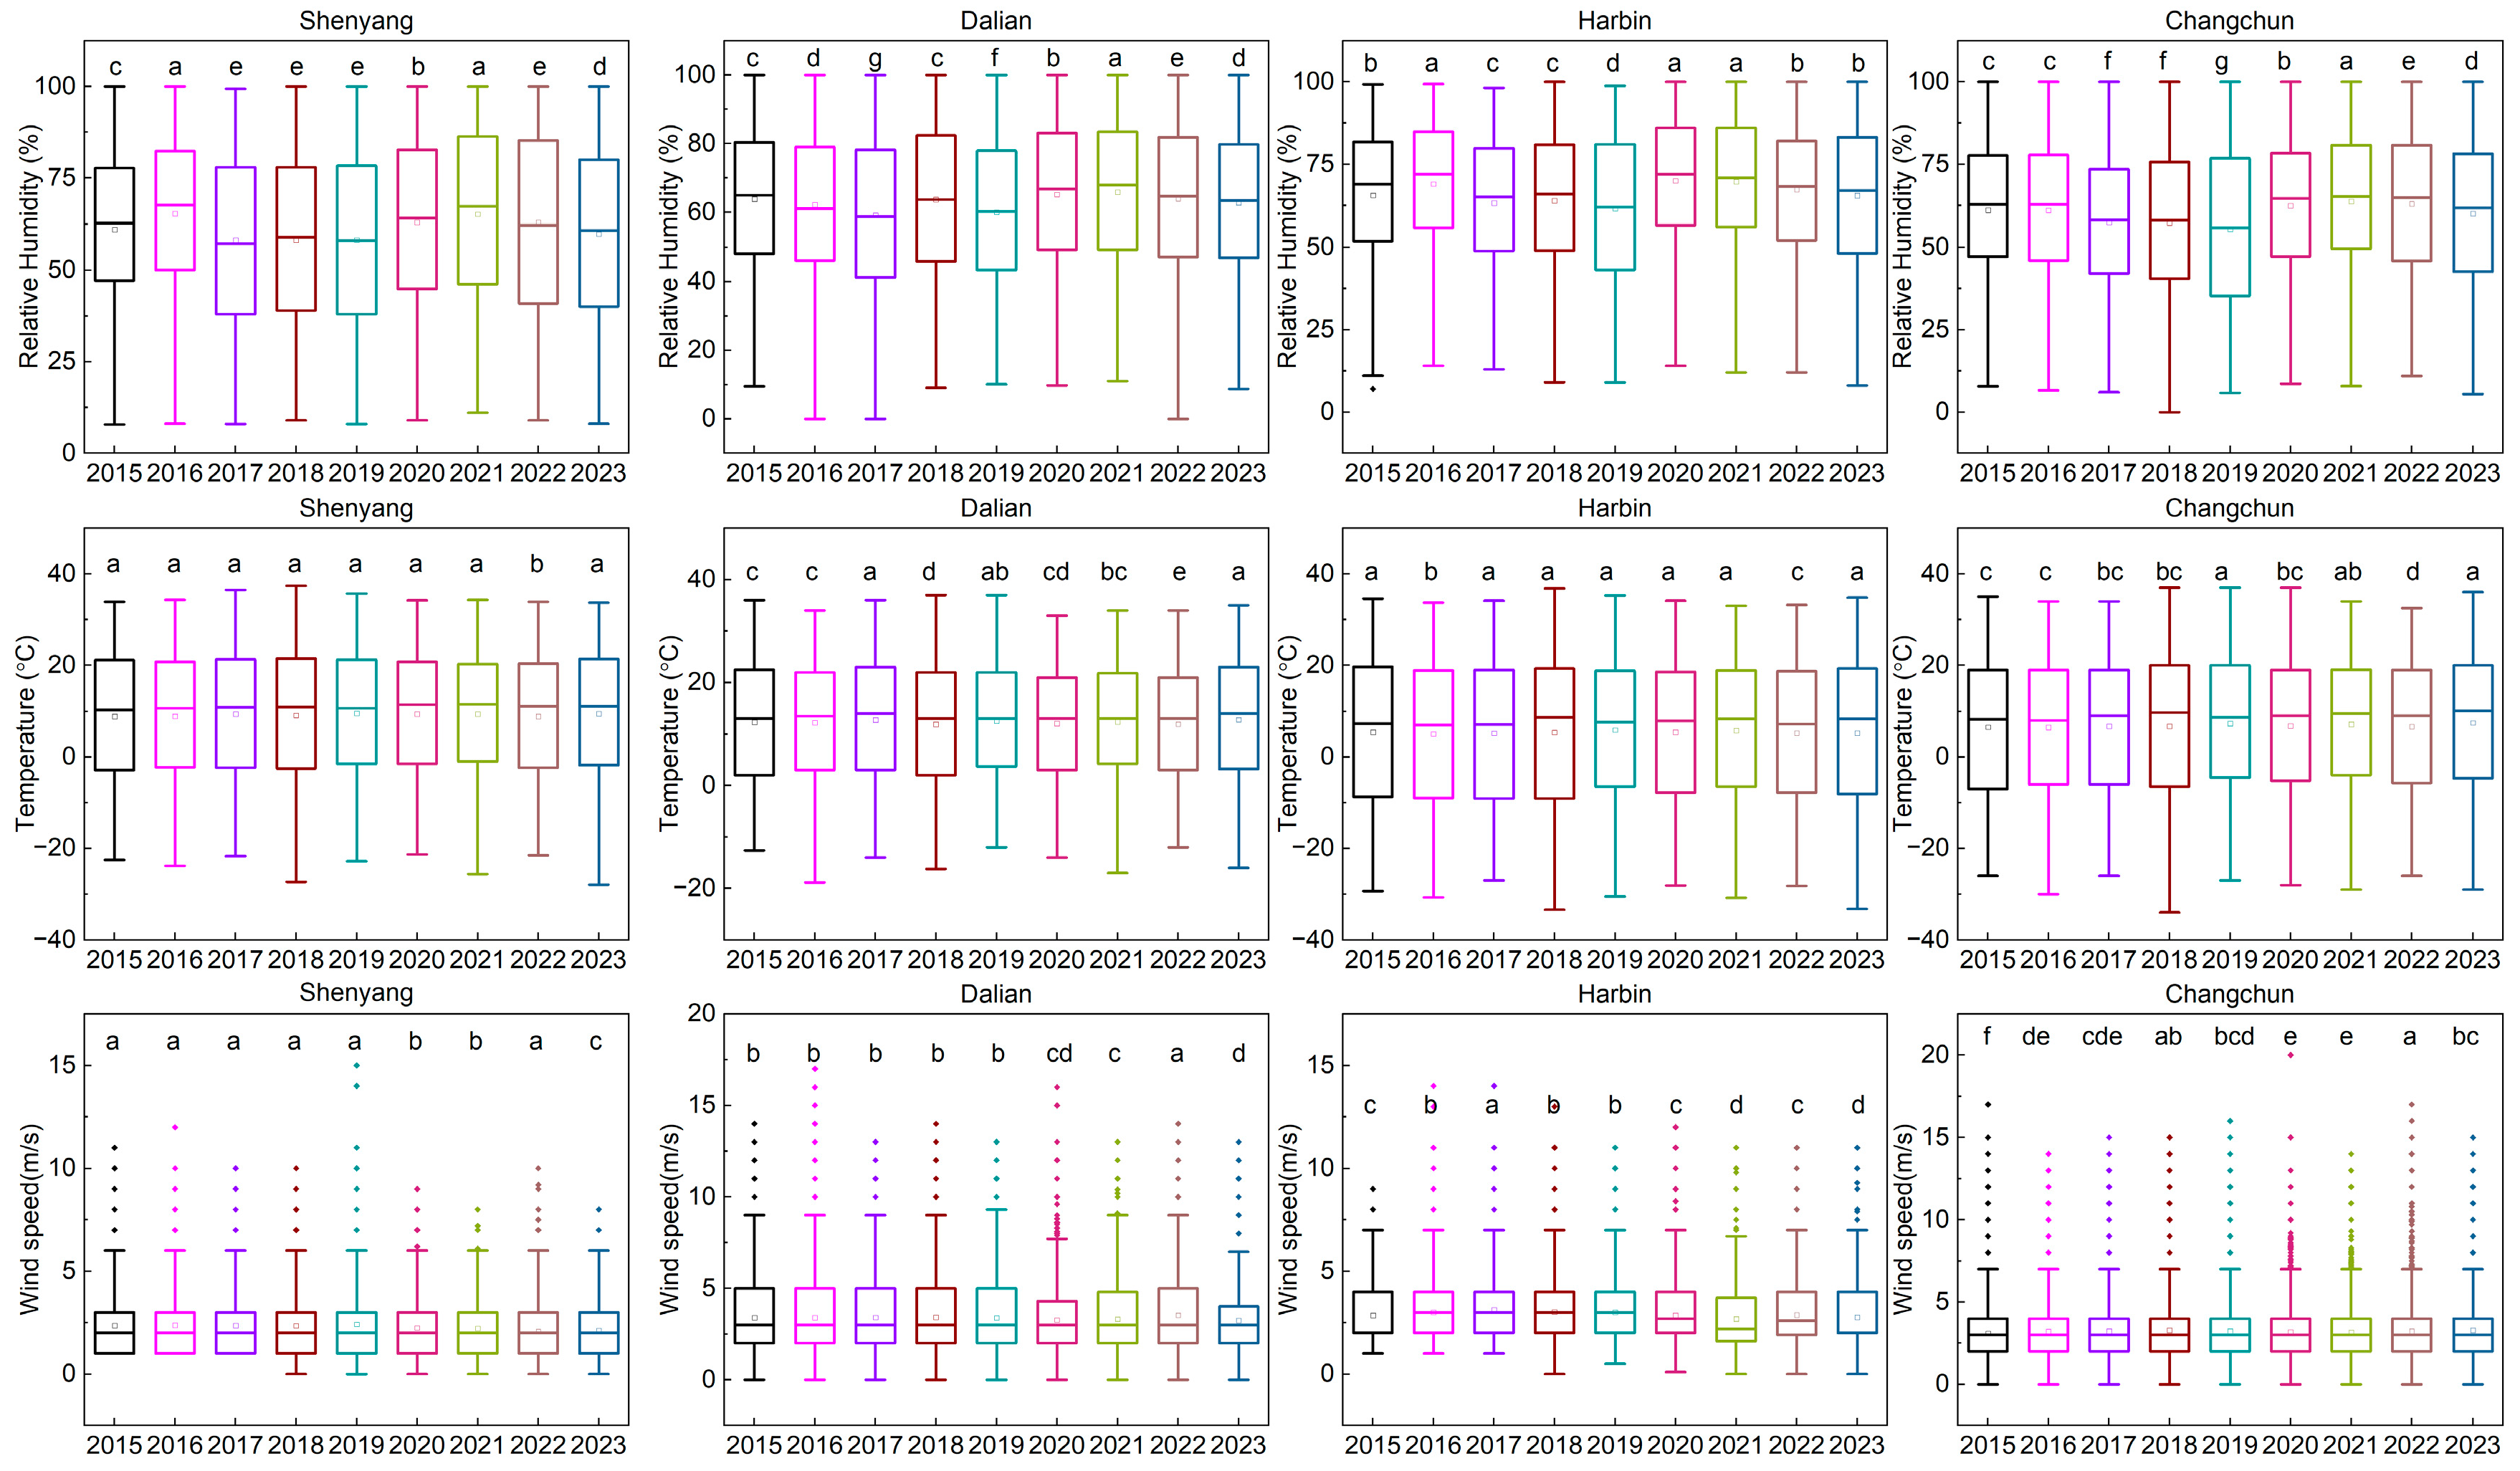
Over the past five decades, numerous studies have demonstrated the strong modulating role of meteorological conditions in shaping the spatiotemporal variability of air pollutants [51]. For instance, analyses in the United States have shown that day-to-day meteorological variability can account for up to ~50% of the observed variation in PM2.5 concentrations [52]. In the present study, we statistically examined interannual variations in temperature, relative humidity, and wind speed from 2015 to 2023 (Figure 9; Table S14). The results indicate that the annual distributions of these meteorological parameters—characterized by their medians and interquartile ranges—differed significantly across years (p < 0.05). Among them, temperature exhibited a weaker association with pollutant variability than relative humidity and wind speed in all four cities. With the exception of Changchun, wind speed showed fewer statistically significant year-to-year differences than relative humidity. In contrast, Changchun displayed more complex fluctuations in both relative humidity and wind speed during the past nine years, implying that meteorological variability may interact with emission reduction measures and thus cannot be excluded as a contributor to observed pollutant changes.
Because haze and compound pollution events are often governed by seasonal and sub-seasonal dynamics, we further examined the seasonal correlations between temperature, relative humidity, wind speed, and five key pollutants (PM2.5, PM10, SO2, NO2, and O3) (Figure 10; Table S15) to identify seasonal sensitivities and intercity differences. The results show that relative humidity was significantly and negatively correlated with all five pollutants in summer (p < 0.05; except in Harbin), indicating that higher summer humidity in Northeast China promotes pollutant removal through wet deposition while suppressing photochemical activity. In winter, by contrast, relative humidity was positively correlated with all pollutants except O3 (p < 0.05), likely because high humidity enhances particle hygroscopic growth and facilitates the formation of secondary inorganic aerosols. Similar seasonal behavior has been reported in previous studies, underscoring the strong seasonal dependence of humidity’s influence on air quality in northeastern China [53].
Temperature exhibited distinct seasonal influences on pollutant concentrations. Except in winter, NO2 showed significant negative correlations with temperature in spring, summer, and autumn (p < 0.05), whereas O3 was positively correlated with temperature across all four seasons (p < 0.05), with stronger associations in spring and autumn. This pattern reflects the fact that rising temperatures enhance boundary-layer development and turbulent mixing, reduce near-surface NOx accumulation, accelerate peroxy radical formation, and shift the NO–NO2–O3 photochemical equilibrium toward ozone production, thereby increasing the formation efficiency of MDA8 O3 [36]. For particulate matter, PM2.5 and PM10 were negatively correlated with temperature in spring and autumn but showed positive correlations in summer and winter (except in Harbin). In addition, SO2 displayed significant negative correlations with temperature in both spring and autumn.
Wind speed also exerted a clear seasonal influence on pollutant concentrations. NO2 showed significant negative correlations with wind speed in summer and autumn (p < 0.05), indicating that stronger winds enhance the dilution and dispersion of NOx emissions from traffic and combustion sources. In contrast, O3 was generally positively correlated with wind speed in spring and winter (p < 0.05), likely because frequent haze episodes during these seasons reduce solar radiation and limit photochemical efficiency under stagnant conditions, thereby suppressing O3 formation. Higher wind speeds, however, can promote regional ozone production by facilitating long-range transport of precursors [54]. PM2.5 and SO2 were typically negatively correlated with wind speed in spring and winter (p < 0.05), suggesting that stronger winds aid pollutant dispersion during these periods. Notably, in Shenyang, correlations between wind speed and the five pollutants in spring and winter were not statistically significant (p > 0.05), implying that air pollution processes in these seasons are shaped by multiple interacting factors, including complex emission structures and local circulation patterns, rather than by wind speed alone

3.6. Potential Source Contribution Function Analysis

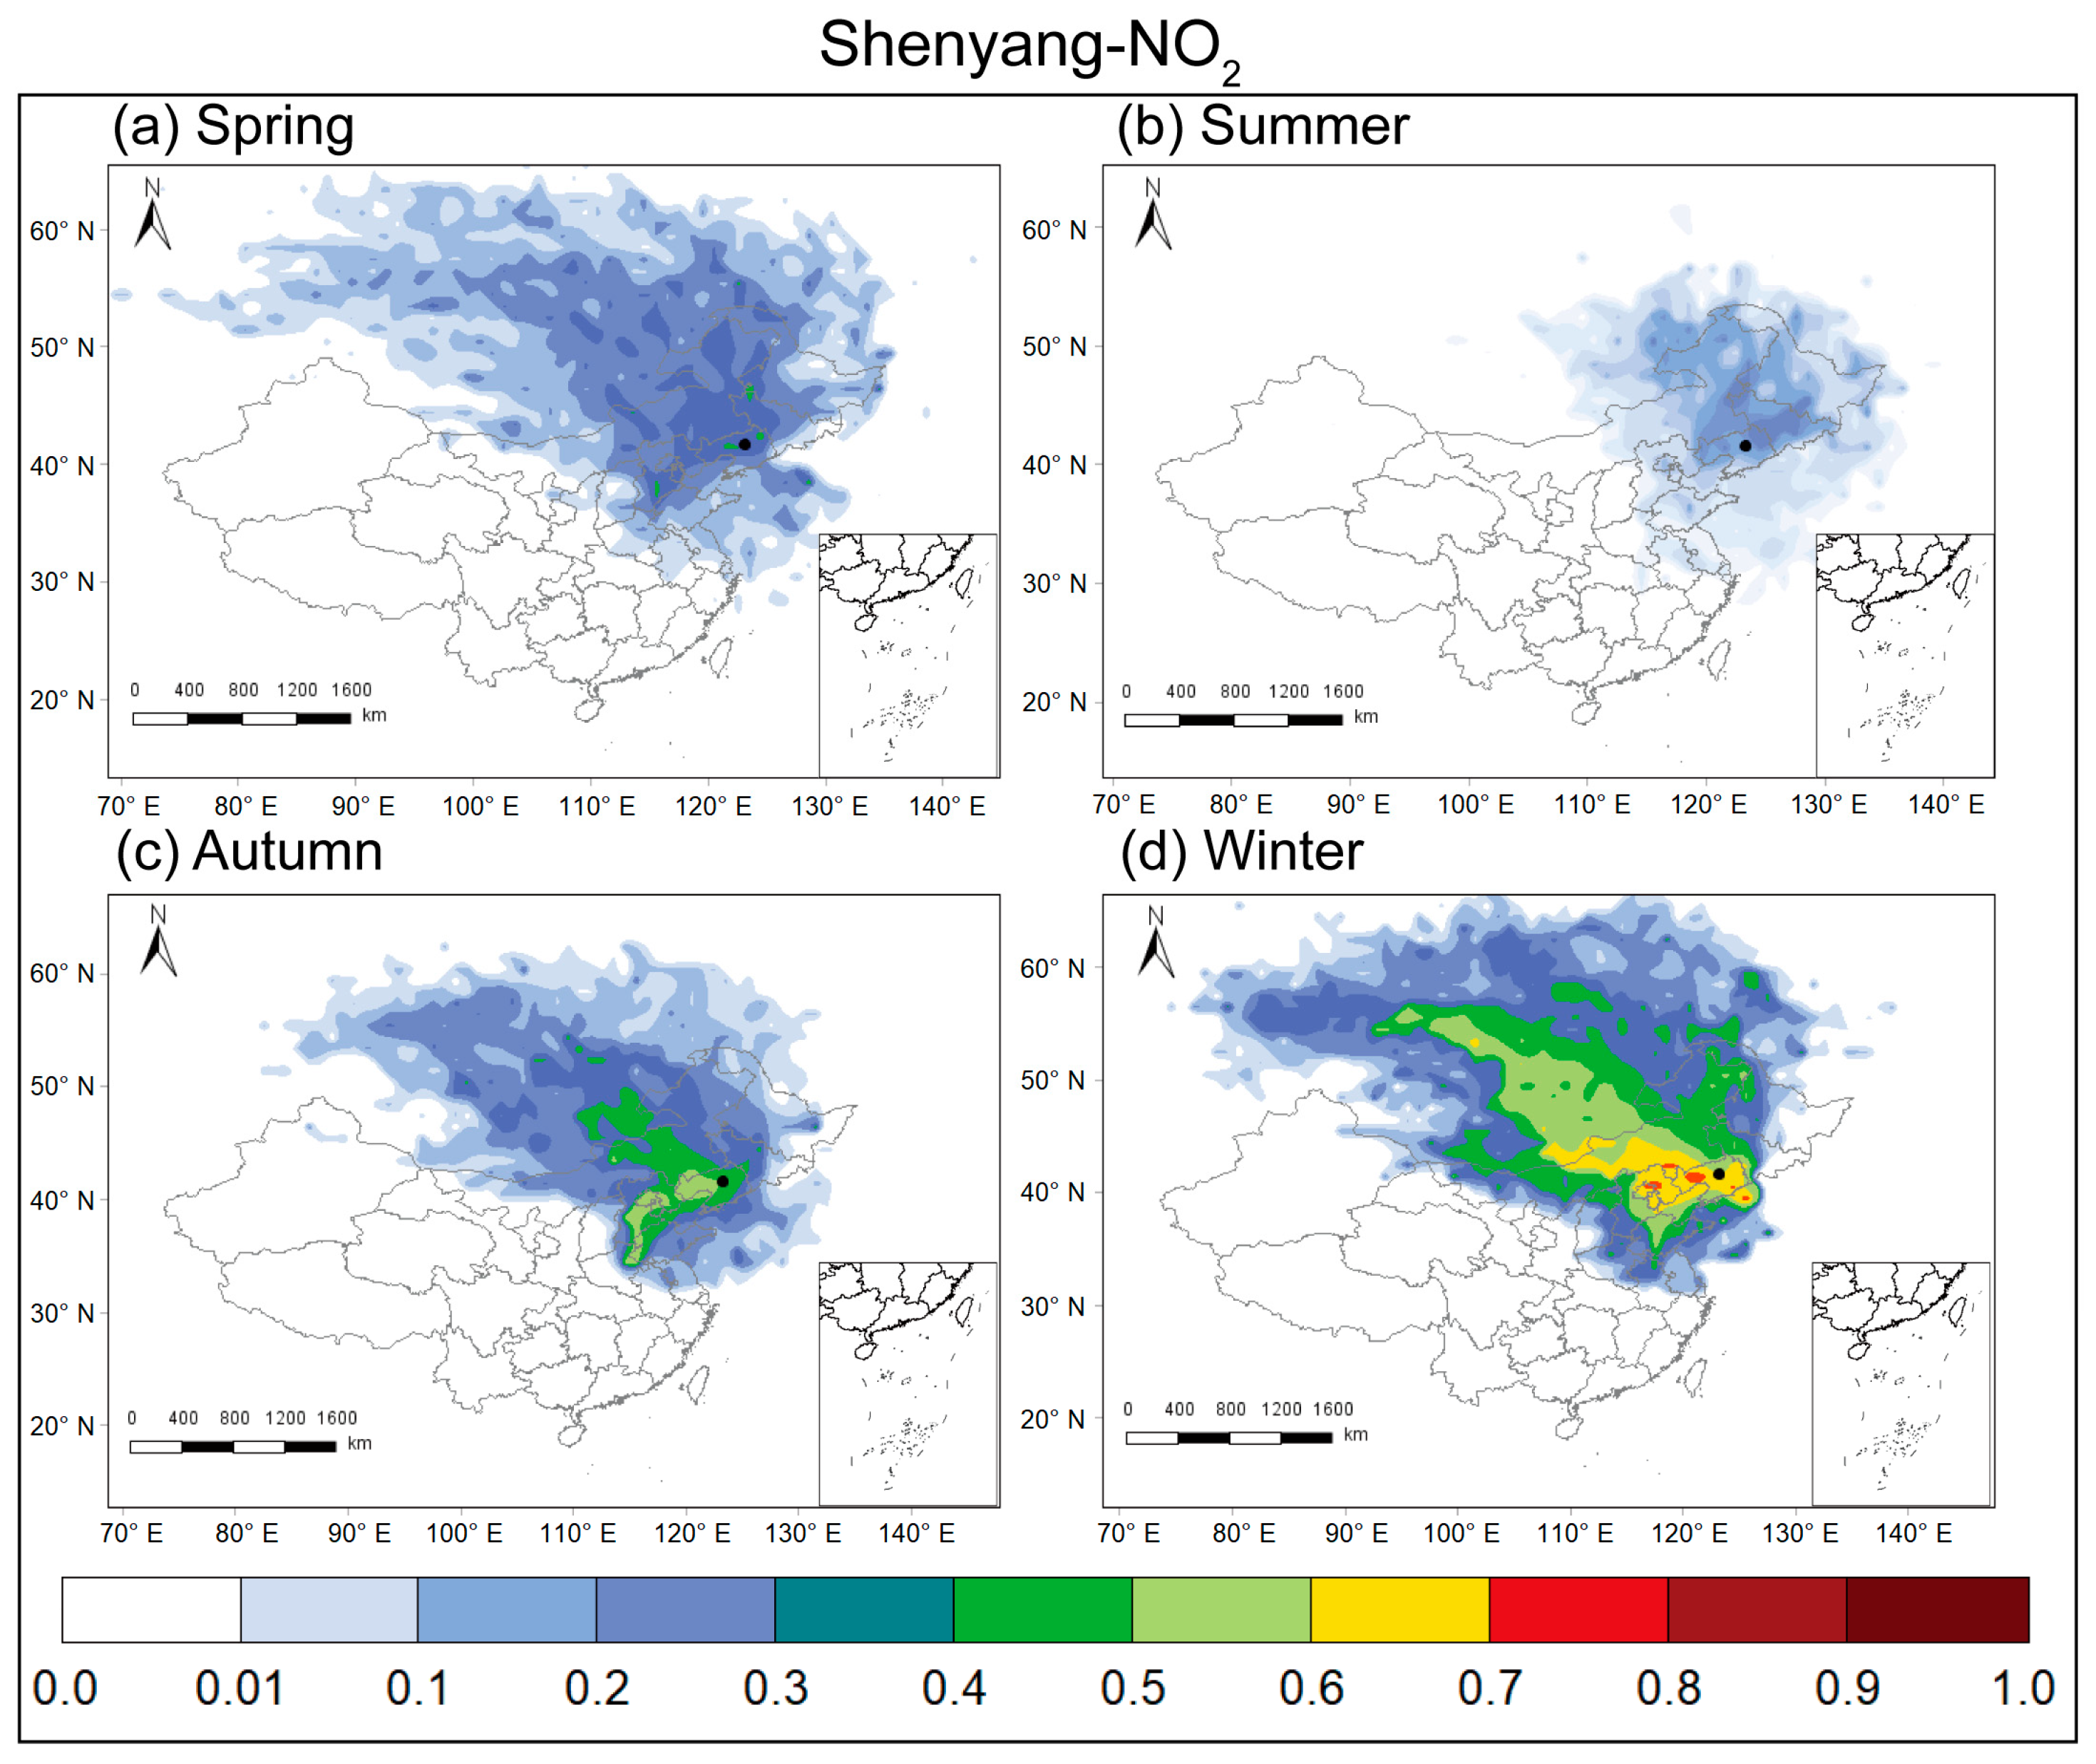
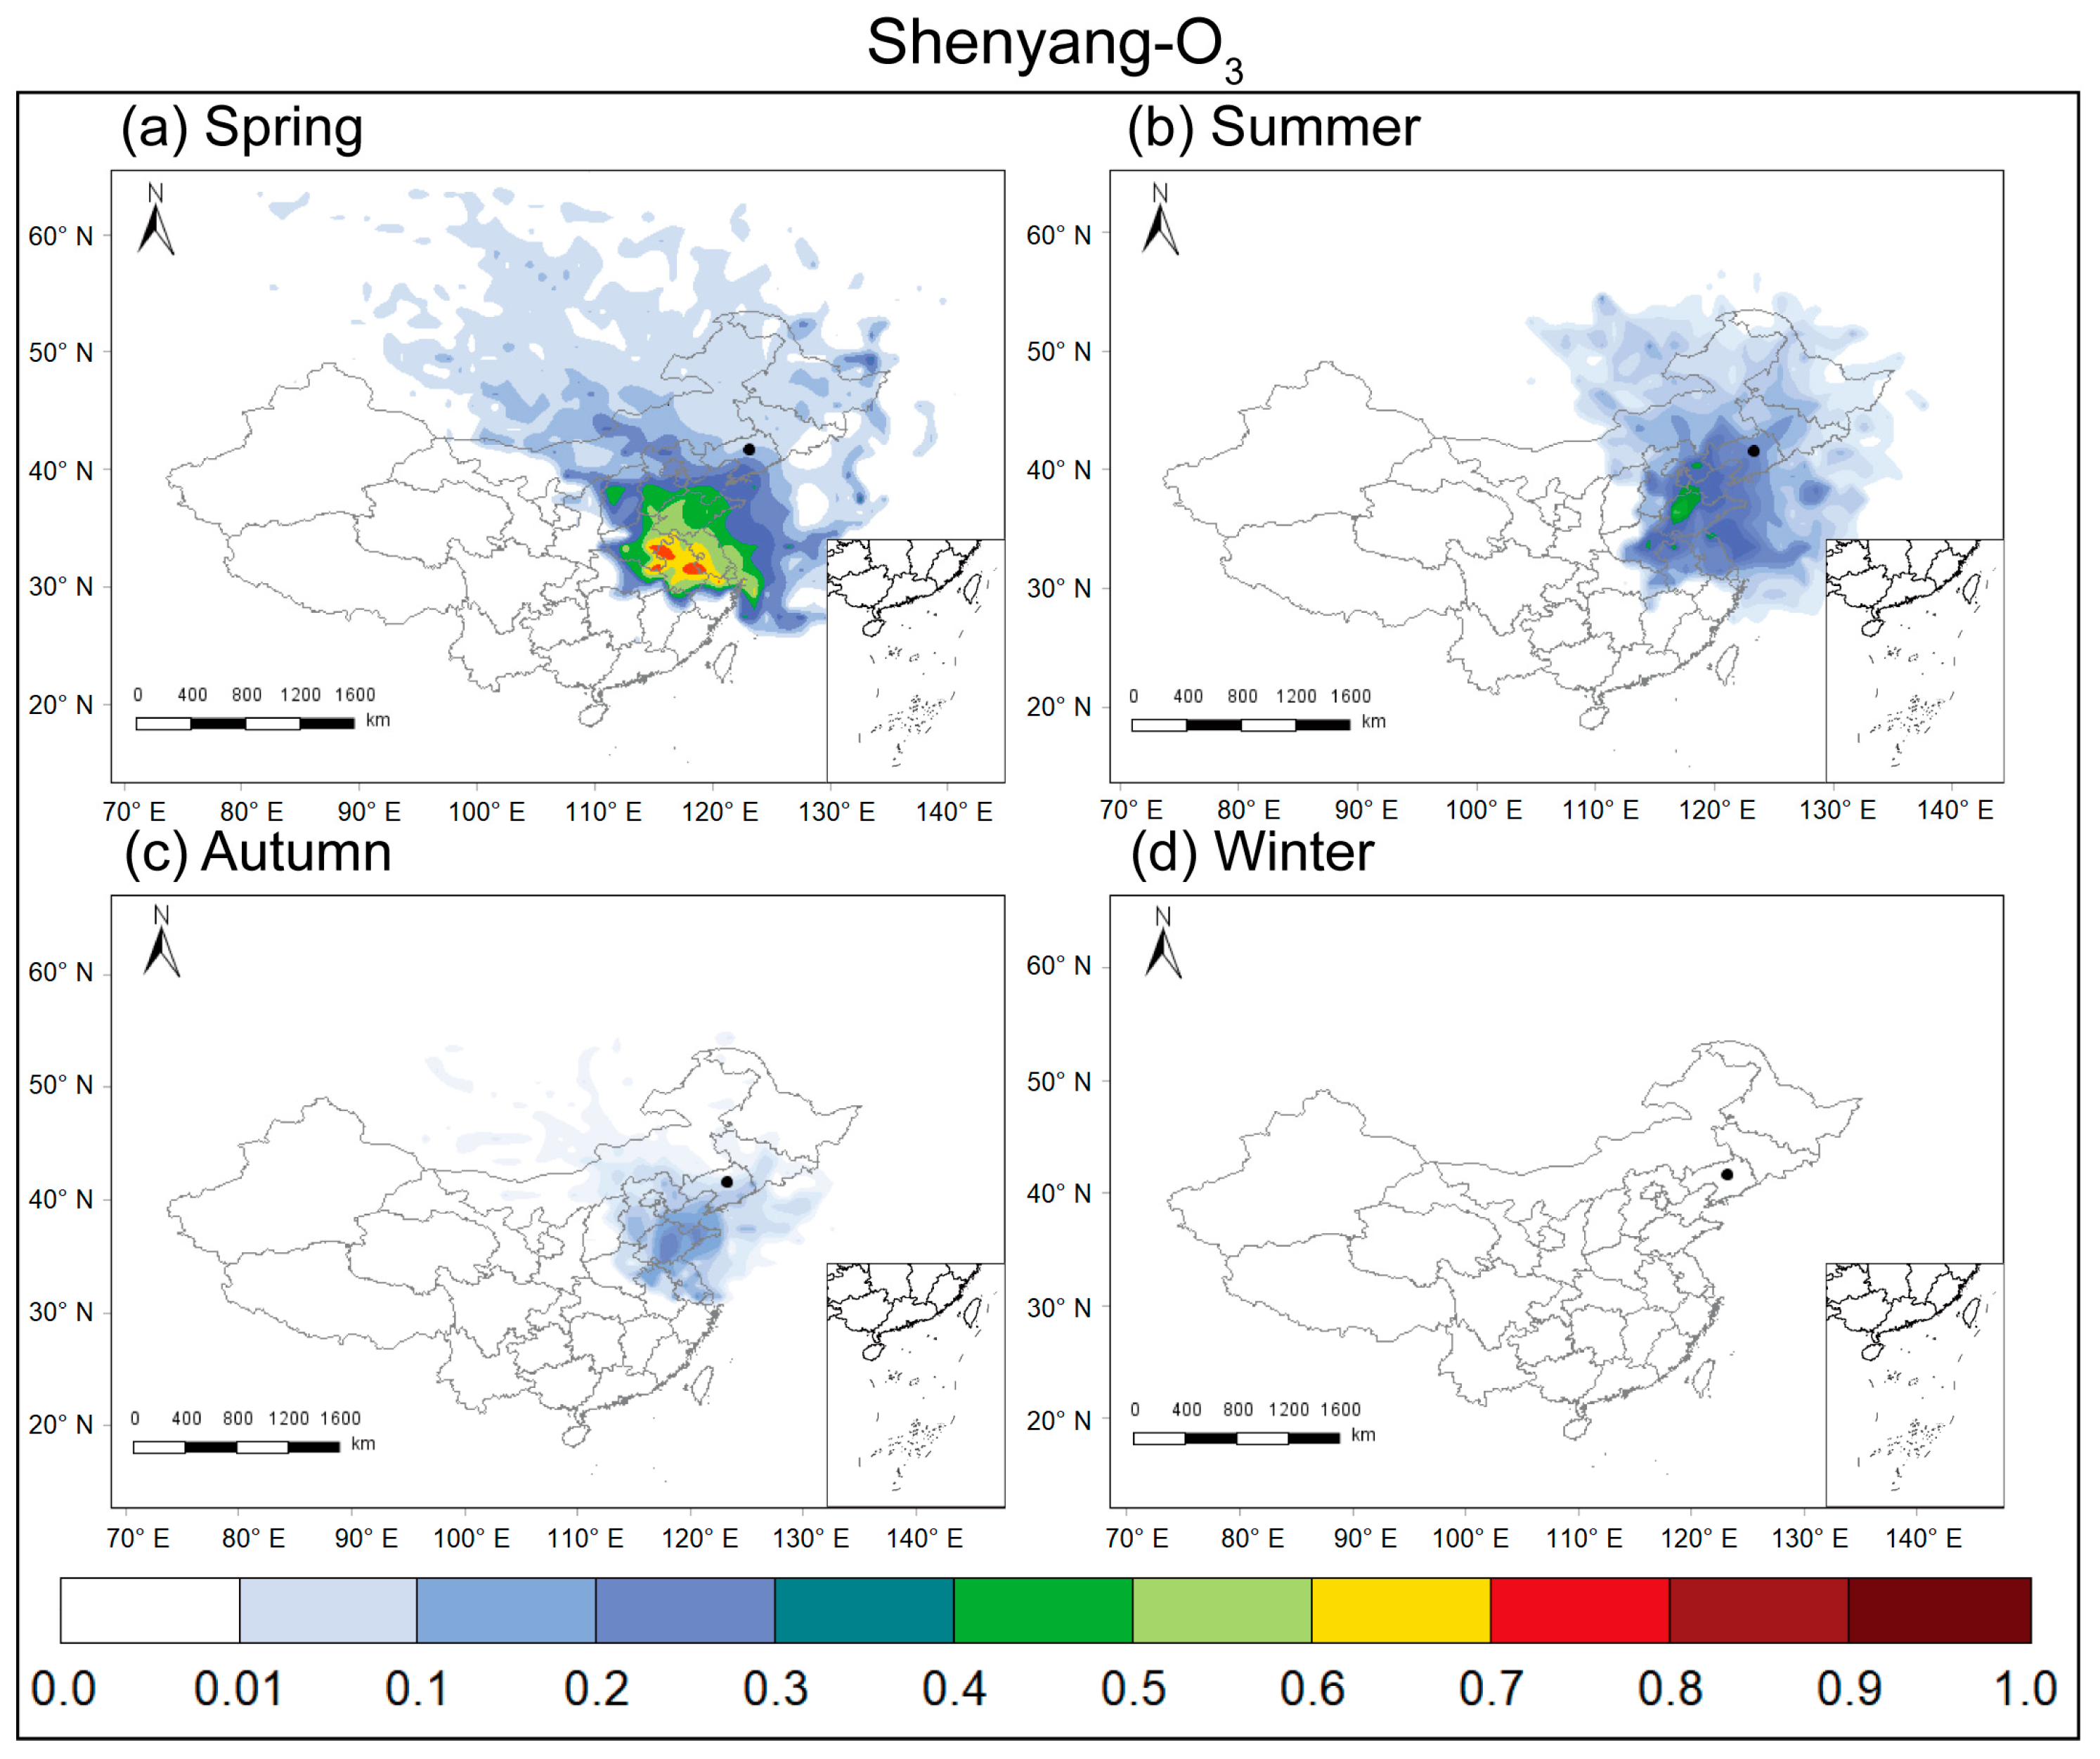
To identify potential source regions contributing to PM2.5, SO2, NO2, PM10, and O3 concentrations in Shenyang, Dalian, Changchun, and Harbin, the Potential Source Contribution Function (PSCF) method was applied. The analysis incorporated seasonal ground-based observations of the five pollutants in each city and 72 h backward air-mass trajectories simulated using the NOAA HYSPLIT model. Based on the weighted PSCF (WPSCF) classification, grid cells with values <0.4 were designated as low-potential source areas, those between 0.4 and 0.5 as medium-potential areas, and those >0.5 as high-potential source areas. The seasonal PSCF distributions for the four cities are shown in Figure 11, Figure 12, Figure 13 and Figure 14 and Figures S9–S25.
To provide broader spatial context for the PSCF analysis, seasonal mean concentrations of the five pollutants from 1497 state-controlled monitoring stations across China (2015–2023) were spatially interpolated using Kriging (Figure 15; Figures S26–S29). All monitoring data were obtained from the China Environmental Monitoring Centre (CEMC) and processed under identical quality-control protocols to those used for the four target cities, ensuring data consistency and reliability. The spatial distribution of the monitoring network (Figure S30) shows dense coverage across eastern and central China, with relatively sparse station density in western regions such as Xinjiang, Qinghai, Inner Mongolia, Hong Kong, Macao, and Tibet.
To minimize interpolation uncertainty, Kriging interpretations were confined to regions with sufficient monitoring coverage. The interpolation was employed exclusively for visualization purposes rather than numerical estimation, facilitating a qualitative comparison between the national-scale pollutant distribution and the potential source regions identified by the PSCF analysis. This integration effectively links local air-mass transport pathways with the broader spatial distribution of seasonal pollution across China.
The WPSCF results reveal that NO2, PM2.5, and PM10 concentrations in all four cities were affected by non-local sources, with the strongest contributions in winter, followed by spring and autumn, and the weakest in summer. For winter NO2, Dalian’s potential source regions were primarily located in Hebei, Henan, Shandong, and southern Inner Mongolia, while Shenyang was influenced by Hebei, Inner Mongolia, and northwestern Liaoning. Changchun’s major sources were concentrated in Liaoning and within Jilin Province, whereas Harbin was affected by Jilin, Inner Mongolia, and Liaoning. Overall, the latitude of potential source regions shifted northward with increasing city latitude.
At the national scale, elevated wintertime NO2 concentrations were mainly distributed across Hebei, Tianjin, Shandong, Henan, and Shanxi, whereas hotspots in Liaoning, Jilin, and Heilongjiang were largely confined to provincial capitals. These spatial patterns suggest that, apart from Dalian, the other three cities were substantially influenced by local emissions in addition to regional transport.
Particulate matter exhibited source distribution patterns broadly consistent with those of NO2. In winter, the potential source regions of PM2.5 and PM10 for Dalian extended southward to Henan, Shandong, Jiangsu, Anhui, Shanxi, and Inner Mongolia, while Shenyang’s sources encompassed Beijing, Tianjin, Jilin, and Heilongjiang. Changchun’s dominant sources were concentrated in Inner Mongolia, Hebei, Liaoning, and Jilin, whereas Harbin showed a broader source range with generally higher WPSCF values. In spring, the potential source regions of PM2.5 and PM10 overlapped substantially among the four cities, covering Hebei, Shandong, Jiangsu, Anhui, Shanxi, Henan, Tianjin, Beijing, and Liaoning—emphasizing the importance of long-range transport from southwestern regions during this season.
In contrast, the seasonal distribution of O3 sources differed markedly from that of particulate matter and other gaseous pollutants, with the strongest influences in spring and the weakest in winter. During spring, high-O3 regions across China were concentrated in Hebei, Shandong, Shanxi, Henan, Jiangsu, Zhejiang, and Shanghai. Consistent with this pattern, potential source areas for O3 in Shenyang and Dalian extended across Shandong, Jiangsu, Henan, Anhui, Hubei, Zhejiang, and Shanghai. Changchun was primarily influenced by Shandong, Jiangsu, Henan, Anhui, and Hebei, while Harbin was less affected. In winter, limited temperature and solar radiation shifted high-O3 regions southward to Guangdong and Hainan, resulting in minimal transport into Northeast China.
In summer, both O3 and particulate matter exhibited substantially weaker non-local influences, except in Dalian, which remained affected by Shandong, Jiangsu, Henan, Anhui, and Hebei. This persistence may reflect the role of sea–land breeze circulation in enhancing pollutant recirculation and long-range transport in coastal areas, whereas inland cities were dominated by local photochemical production and primary emissions. In autumn, the potential source regions of NO2, PM2.5, and PM10 for Shenyang, Dalian, and Changchun remained concentrated in Shandong, Jiangsu, Henan, Anhui, and Hebei, underscoring the continuing role of regional transport in shaping pollution levels during the transition season.
Overall, the contributions of pollutant sources in the four cities exhibited pronounced seasonal variability. The external influences on NO2, PM2.5, and PM10 were strongest in winter, moderate in spring and autumn, and weakest in summer. During winter, the major source regions were concentrated in North and Central China, with the influence zones shifting northward with increasing city latitude. In spring, long-range transport from the southwest dominated, while in summer, external contributions declined markedly—except in Dalian, where persistent inflow was maintained by land–sea breeze circulation. For O3, external impacts peaked in spring but were negligible in winter.
Topographic factors also contribute to the differences between Dalian and the three inland provincial capitals. Previous studies have shown that plains are the geomorphic type most severely affected by PM2.5 pollution [55]. According to the Geomorphologic Atlas of the People’s Republic of China, Northeast China is predominantly composed of plains characterized by low elevation, dense distribution, and broad areal coverage, typically classified as third-order low mountains. Such terrain offers limited topographic barriers to the horizontal and vertical transport of air pollutants, thereby facilitating regional transmission and accumulation [56]. Moreover, the interaction between land–sea circulation and valley-wind systems strongly influences the vertical exchange and spatial distribution of pollutants in coastal cities [57]. In parallel, regional atmospheric circulation and the aerodynamic effects of urban morphology—such as building-induced turbulence and flow obstruction—alter pollutant dispersion and accumulation processes. Consequently, the combined effects of topography and meteorology regulate the occurrence and persistence of air-pollution episodes, leading to pollution behaviors between coastal and inland regions.

4. Conclusions

Using air quality observations from Shenyang, Dalian, Changchun, and Harbin during 2015–2023 and integrating meteorological analyses with the Potential Source Contribution Function (PSCF), this study systematically characterizes the spatiotemporal variability, potential source regions, and meteorological drivers of PM2.5, PM10, SO2, NO2, and O3 across Northeast China. Over the nine-year period, annual mean concentrations of PM2.5, PM10, SO2, and NO2 declined markedly. The largest decreases in PM10, PM2.5, and SO2 were observed in Shenyang—39.9%, 52.1%, and 79.3%, respectively—while Harbin exhibited the greatest reduction in NO2 (41.9%). The substantial declines in pollutant levels also yielded the largest drop in haze days in Shenyang, with a cumulative reduction of 95 days. In contrast, O3 displayed a fluctuating pattern: from 2019 to 2023, trends in Harbin diverged from those in the other three cities; Dalian consistently recorded the highest O3 concentrations (78.33–89.72 µg m−3), underscoring the complexity of ozone formation and the spatial heterogeneity of regional O3 control strategies.
On seasonal timescales, the pollutants exhibited pronounced periodicity: PM2.5, PM10, SO2, and NO2 peaked in January and reached minima in June, whereas O3 showed the opposite seasonality. Compared with Jilin and Heilongjiang, Shenyang and Dalian experienced earlier springtime rebounds in particulate matter, likely reflecting a combined influence of latitudinal gradients, earlier resumption of industrial and agricultural activities, northerly dust transport, and coastal thermal contrasts. Correlation analysis revealed strong positive associations among PM2.5, PM10, SO2, and NO2, while O3 was generally negatively correlated with these pollutants.
Meteorological influences exhibited strong seasonal dependence: elevated summer humidity promoted wet removal of particulates and gases, whereas in winter it enhanced hygroscopic growth; higher temperatures outside of winter suppressed NO2 accumulation but favored O3 formation; and stronger winds in spring and winter effectively dispersed PM2.5 and SO2. The WPSCF results further indicated that wintertime PM2.5, PM10, and NO2 were strongly affected by long-range transport from southwestern regions, including Tianjin, Hebei, Shanxi, Henan, and Shandong, with similar but weaker contributions in spring. Springtime O3 was mainly influenced by air masses originating from the Yangtze River Delta and the North China Plain, whereas winter O3 was largely controlled by local emissions.
To further improve air quality in Northeast China, policy efforts should prioritize sustained coal-to-clean energy transitions, strengthened dust control, and the development of region-specific O3 mitigation strategies tailored to local chemical sensitivities. Targeted management in coastal cities is also essential, where sea–land breeze recirculation and enhanced photochemical activity elevate O3 levels under low-haze conditions. Strengthening cross-regional coordination of emission reductions and improving the monitoring of pollutant transport processes will be vital for achieving synergistic multi-pollutant control and ensuring sustained improvements in regional air quality.

Supplementary Materials

The following supporting information can be downloaded at: https://www.mdpi.com/article/10.3390/atmos16111258/s1, Text S1: Derivation and Rationale of the Weighting Function; Table S1: Coordinates (Latitude and Longitude) and Number of National Control Stations in the Four Cities; Table S2: Annual Mean NO2 Concentrations in the Four Cities; Table S3: Annual Mean O3 Concentrations in the Four Cities; Table S4: Annual Mean PM10 Concentrations in the Four Cities; Table S5: Annual Mean PM2.5 Concentrations in the Four Cities; Table S6: Annual Mean PM2.5/PM10 Ratios in the Four Cities; Table S7: Annual Mean SO2 Concentrations in the Four Cities; Table S8: Monthly Mean PM2.5 Concentrations in the Four Cities Over Nine Years; Table S9: Monthly Mean PM10 Concentrations in the Four Cities Over Nine Years; Table S10: Monthly Mean SO2 Concentrations in the Four Cities Over Nine Years; Table S11: Monthly Mean NO2 Concentrations in the Four Cities Over Nine Years; Table S12: Monthly Mean O3 Concentrations in the Four Cities Over Nine Years; Table S13: Number of Haze Days in Four Cities; Table S14: Annual mean Meteorological Parameters for the Four Cities; Table S15: p-values for the Relationships Between Five Air Pollutants and Environmental Factors Across Different Seasons in the Four Cities; Figure S1: Spatial distribution of national control stations in Changchun; Figure S2: Spatial distribution of national control stations in Dalian; Figure S3: Spatial distribution of national control stations in Harbin; Figure S4: Spatial distribution of national control stations in Shenyang; Figure S5: Correlation between CO and PM2.5; Figure S6: Correlation between PM2.5 and NO2; Figure S7: Correlation between PM2.5 and SO2; Figure S8: Correlation matrix of daily mean criteria pollutants from 2015 to 2023; Figure S9: Map of China with numbers representing corresponding provinces, municipalities, and special administrative regions; Figure S10: WPSCF analysis of SO2 in Dalian for (a) spring, (b) summer, (c) autumn, and (d) winter; Figure S11: WPSCF analysis of SO2 in Harbin for (a) spring, (b) summer, (c) autumn, and (d) winter; Figure S12: WPSCF analysis of SO2 in Shenyang for (a) spring, (b) summer, (c) autumn, and (d) winter; Figure S13: WPSCF analysis of SO2 in Changchun for (a) spring, (b) summer, (c) autumn, and (d) winter; Figure S14: WPSCF analysis of NO2 in Dalian for (a) spring, (b) summer, (c) autumn, and (d) winter; Figure S15: WPSCF analysis of NO2 in Harbin for (a) spring, (b) summer, (c) autumn, and (d) winter; Figure S16: WPSCF analysis of NO2 in Changchun for (a) spring, (b) summer, (c) autumn, and (d) winter; Figure S17: WPSCF analysis of O3 in Dalian for (a) spring, (b) summer, (c) autumn, and (d) winter; Figure S18: WPSCF analysis of O3 in Harbin for (a) spring, (b) summer, (c) autumn, and (d) winter; Figure S19: WPSCF analysis of O3 in Changchun for (a) spring, (b) summer, (c) autumn, and (d) winter; Figure S20: WPSCF analysis of PM2.5 in Dalian for (a) spring, (b) summer, (c) autumn, and (d) winter; Figure S21: WPSCF analysis of PM2.5 in Harbin for (a) spring, (b) summer, (c) autumn, and (d) winter; Figure S22: WPSCF analysis of PM2.5 in Changchun for (a) spring, (b) summer, (c) autumn, and (d) winter; Figure S23: WPSCF analysis of PM10 in Dalian for (a) spring, (b) summer, (c) autumn, and (d) winter; Figure S24: WPSCF analysis of PM10 in Harbin for (a) spring, (b) summer, (c) autumn, and (d) winter; Figure S25: WPSCF analysis of PM10 in Changchun for (a) spring, (b) summer, (c) autumn, and (d) winter; Figure S26: Seasonal variations in nationwide NO2 concentrations during spring, summer, autumn, and winter based on kriging interpolation; Figure S27: Seasonal variations in nationwide PM10 concentrations during spring, summer, autumn, and winter based on kriging interpolation; Figure S28: Seasonal variations in nationwide PM2.5 concentrations during spring, summer, autumn, and winter based on kriging interpolation; Figure S29: Seasonal variations in nationwide SO2 concentrations during spring, summer, autumn, and winter based on kriging interpolation; Figure S30: Spatial Distribution of 1497 National Control Stations Across China.

Author Contributions

Methodology, C.G., C.X. and W.T.; software, C.G.; resources, C.X. and W.T.; data curation, C.G.; writing—original draft preparation, C.G.; writing—review and editing, C.G.; visualization, C.G.; supervision, N.B. and W.L.; project administration, W.L.; funding acquisition, W.L. All authors have read and agreed to the published version of the manuscript.

Funding

This research was funded by the major science and technology special project of the Xinjiang Uygur Autonomous Region (2024A03012), and the President’s Foundation of Hefei Institutes of Physical Science, Chinese Academy of Sciences (BJPY2024B09, YZJJQY202401).

Institutional Review Board Statement

Not applicable.

Informed Consent Statement

Not applicable.

Data Availability Statement

Data is contained within the article or Supplementary Material.

Acknowledgments

We would like to thank the National Oceanic and Atmospheric Administration (NOAA) Air Resources Laboratory (ARL) for providing the open HYSPLIT transport and dispersion model.

Conflicts of Interest

The authors declare no conflicts of interest.

References

  1. Lin, T.; Qian, W.; Wang, H.; Feng, Y. Air Pollution and Workplace Choice: Evidence from China. Int. J. Environ. Res. Public Health 2022, 19, 8732. [Google Scholar] [CrossRef]
  2. Du, M.; Liu, W.; Hao, Y. Spatial Correlation of Air Pollution and Its Causes in Northeast China. Int. J. Environ. Res. Public Health 2021, 18, 10619. [Google Scholar] [CrossRef]
  3. Javed, Z.; Bilal, M.; Qiu, Z.; Li, G.; Sandhu, O.; Mehmood, K.; Wang, Y.; Ali, M.A.; Liu, C.; Wang, Y.; et al. Spatiotemporal characterization of aerosols and trace gases over the Yangtze River Delta region, China: Impact of trans-boundary pollution and meteorology. Environ. Sci. Eur. 2022, 34, 86. [Google Scholar] [CrossRef]
  4. Zheng, X.; Javed, Z.; Liu, C.; Tanvir, A.; Sandhu, O.; Liu, H.; Ji, X.; Xing, C.; Lin, H.; Du, D. MAX-DOAS and in-situ measurements of aerosols and trace gases over Dongying, China: Insight into ozone formation sensitivity based on secondary HCHO. J. Environ. Sci. 2024, 135, 656–668. [Google Scholar] [CrossRef]
  5. Qin, Y.; Li, J.; Gong, K.; Wu, Z.; Chen, M.; Qin, M.; Huang, L.; Hu, J. Double high pollution events in the Yangtze River Delta from 2015 to 2019: Characteristics, trends, and meteorological situations. Sci. Total Environ. 2021, 792, 148349. [Google Scholar] [CrossRef]
  6. Chen, L.; Chen, X.; Li, G. Analysis of Industrialization with Urbanization Interactive Course in Modern Northeast China. Urban Dev. Stud. 2004, 11, 28–31. [Google Scholar]
  7. Wang, T.; Du, H.; Zhao, Z.; Zhang, J.; Zhou, C. Impact of Meteorological Conditions and Human Activities on Air Quality During the COVID-19 Lockdown in Northeast China. Front. Environ. Sci. 2022, 10, 877268. [Google Scholar] [CrossRef]
  8. Mou, Y.; Song, Y.; Xu, Q.; He, Q.; Hu, A. Influence of Urban-Growth Pattern on Air Quality in China: A Study of 338 Cities. Int. J. Environ. Res. Public Health 2018, 15, 1805. [Google Scholar] [CrossRef]
  9. Yang, M.; Wang, W.; Li, Y.; Du, Y.; Tian, F. Revealing the Impact of Socio-Economic Metrics on the Air Quality on Northeast China Using Multivariate Statistical Analysis. Pol. J. Environ. Stud. 2022, 31, 3373–3385. [Google Scholar] [CrossRef]
  10. Shi, T.; Hu, Y.; Liu, M.; Li, C.; Zhang, C.; Liu, C. How Do Economic Growth, Urbanization, and Industrialization Affect Fine Particulate Matter Concentrations? An Assessment in Liaoning Province, China. Int. J. Environ. Res. Public Health 2020, 17, 5441. [Google Scholar] [CrossRef]
  11. Bai, L.; Li, C.; Yu, C.W.; He, Z. Air pollution and health risk assessment in Northeastern China: A case study of Jilin Province. Indoor Built Environ. 2021, 30, 1857–1874. [Google Scholar] [CrossRef]
  12. Wang, Y.; Guo, X. Spatiotemporal variation patterns and aggregation of crop residue burning at county scale in Northeast China. IOP Conf. Ser. Earth Environ. Sci. 2022, 1004, 012003. [Google Scholar] [CrossRef]
  13. Meng, C.; Cheng, T.; Bao, F.; Gu, X.; Wang, J.; Zuo, X.; Shi, S.J.A.; Research, A.Q. The Impact of Meteorological Factors on Fine Particulate Pollution in Northeast China. Aerosol Air Qual. Res. 2020, 20, 1618–1628. [Google Scholar] [CrossRef]
  14. Liu, H.; Chen, Y.; Qi, S.; Zhang, C. Chemical characteristics of precipitation in central Liaoning Province, Northeast China. Sci. Res. Essays 2012, 7, 3251–3261. [Google Scholar] [CrossRef]
  15. Meng, X.; Kc, S. Location choice of Air quality monitors in China. J. Environ. Manag. 2025, 373, 123496. [Google Scholar] [CrossRef]
  16. Wang, P. China’s air pollution policies: Progress and challenges. Curr. Opin. Environ. Sci. Health 2021, 19, 100227. [Google Scholar] [CrossRef]
  17. Gao, C.; Xing, C.; Tan, W.; Lin, H.; Bu, N.; Xue, J.; Liu, F.; Liu, W. Vertical characteristics and potential sources of aerosols over northeast China using ground-based MAX-DOAS. Atmos. Pollut. Res. 2023, 14, 101691. [Google Scholar] [CrossRef]
  18. Ma, Y.; Liu, Q.; Bian, Y.; Feng, L.; Zhao, D.; Wang, S.; Zhao, H.; Gao, K.; Xu, Z. Analysis of transport path and source distribution of winter air pollution in Shenyang. Open Geosci. 2021, 13, 1105–1117. [Google Scholar] [CrossRef]
  19. Zeng, Y.; Hopke, P.K. A study of the sources of acid precipitation in Ontario, Canada. Atmos. Environ. 1989, 23, 1499–1509. [Google Scholar] [CrossRef]
  20. Polissar, A.V.; Hopke, P.K.; Harris, J.M. Source Regions for Atmospheric Aerosol Measured at Barrow, Alaska. Environ. Sci. Technol. 2001, 35, 4214–4226. [Google Scholar] [CrossRef]
  21. Gao, H.; Wang, J.; Li, T.; Fang, C. Analysis of Air Quality Changes and Influencing Factors in Changchun during the COVID-19 Pandemic in 2020. Aerosol Air Qual. Res. 2021, 21, 210055. [Google Scholar] [CrossRef]
  22. Zhao, D.; Chen, H.; Yu, E.; Luo, T. PM2.5/PM10 Ratios in Eight Economic Regions and Their Relationship with Meteorology in China. Adv. Meteorol. 2019, 2019, 5295726. [Google Scholar] [CrossRef]
  23. Yue, D.L.; Hu, M.; Wu, Z.J.; Guo, S.; Wen, M.T.; Nowak, A.; Wehner, B.; Wiedensohler, A.; Takegawa, N.; Kondo, Y.; et al. Variation of particle number size distributions and chemical compositions at the urban and downwind regional sites in the Pearl River Delta during summertime pollution episodes. Atmos. Chem. Phys. 2010, 10, 9431–9439. [Google Scholar] [CrossRef]
  24. Li, X.; Chen, P.; Xie, Y.; Wang, Z.; Hopke, P.K.; Xue, C. Fine particulate matter and gas emissions at different burn phases from household coal-fired heating stoves. Atmos. Environ. 2023, 305, 119803. [Google Scholar] [CrossRef]
  25. Zhao, H.; Yang, G.; Xiu, A.; Zhang, X. A High Resolution Emission Inventory of Domestic Burning in Rural Region of Northeast China Based on Household Consumption. Chin. Geogr. Sci. 2020, 30, 921–933. [Google Scholar] [CrossRef]
  26. Chen, Y.; Shen, H.; Smith, K.R.; Guan, D.; Chen, Y.; Shen, G.; Liu, J.; Cheng, H.; Zeng, E.Y.; Tao, S. Estimating household air pollution exposures and health impacts from space heating in rural China. Environ. Int. 2018, 119, 117–124. [Google Scholar] [CrossRef]
  27. Li, L.; Li, Q.; Huang, L.; Wang, Q.; Zhu, A.; Xu, J.; Liu, Z.; Li, H.; Shi, L.; Li, R.; et al. Air quality changes during the COVID-19 lockdown over the Yangtze River Delta Region: An insight into the impact of human activity pattern changes on air pollution variation. Sci. Total Environ. 2020, 732, 139282. [Google Scholar] [CrossRef]
  28. Le, T.; Wang, Y.; Liu, L.; Yang, J.; Yung, Y.L.; Li, G.; Seinfeld, J.H. Unexpected air pollution with marked emission reductions during the COVID-19 outbreak in China. Science 2020, 369, 702–706. [Google Scholar] [CrossRef]
  29. Huang, X.; Ding, A.; Gao, J.; Zheng, B.; Zhou, D.; Qi, X.; Tang, R.; Wang, J.; Ren, C.; Nie, W.; et al. Enhanced secondary pollution offset reduction of primary emissions during COVID-19 lockdown in China. Natl. Sci. Rev. 2021, 8, nwaa137. [Google Scholar] [CrossRef]
  30. Brimblecombe, P.; Lai, Y. Effect of Fireworks, Chinese New Year and the COVID-19 Lockdown on Air Pollution and Public Attitudes. Aerosol Air Qual. Res. 2020, 20, 2318–2331. [Google Scholar] [CrossRef]
  31. Zhang, L.; Lee, C.S.; Zhang, R.; Chen, L. Spatial and temporal evaluation of long term trend (2005–2014) of OMI retrieved NO2 and SO2 concentrations in Henan Province, China. Atmos. Environ. 2017, 154, 151–166. [Google Scholar] [CrossRef]
  32. Xu, L.; Zou, Z.; Chen, J.; Fu, S. Effects of emission control areas on sulfur-oxides concentrations—Evidence from the coastal ports in China. Mar. Pollut. Bull. 2024, 200, 116039. [Google Scholar] [CrossRef]
  33. Jaeglé, L.; Steinberger, L.; Martin, R.V.; Chance, K. Global partitioning of NOx sources using satellite observations: Relative roles of fossil fuel combustion, biomass burning and soil emissions. Faraday Discuss. 2005, 130, 407–423. [Google Scholar] [CrossRef]
  34. Liu, F.; Zhang, Q.; Zheng, B.; Tong, D.; Yan, L.; Zheng, Y.; He, K. Recent reduction in NOx emissions over China: Synthesis of satellite observations and emission inventories. Environ. Res. Lett. 2016, 11, 114002. [Google Scholar] [CrossRef]
  35. Wang, Y.; Hu, B.; Tang, G.; Ji, D.; Zhang, H.; Bai, J.; Wang, X.; Wang, Y. Characteristics of ozone and its precursors in Northern China: A comparative study of three sites. Atmos. Res. 2013, 132–133, 450–459. [Google Scholar] [CrossRef]
  36. Yang, H.; Peng, Q.; Zhou, J.; Song, G.; Gong, X. The unidirectional causality influence of factors on PM2.5 in Shenyang city of China. Sci. Rep. 2020, 10, 8403. [Google Scholar] [CrossRef]
  37. Minoura, H. Some characteristics of surface ozone concentration observed in an urban atmosphere. Atmos. Res. 1999, 51, 153–169. [Google Scholar] [CrossRef]
  38. Li, M.; Wang, T.; Xie, M.; Zhuang, B.; Li, S.; Han, Y.; Song, Y.; Cheng, N. Improved meteorology and ozone air quality simulations using MODIS land surface parameters in the Yangtze River Delta urban cluster, China. J. Geophys. Res. Atmos. 2017, 122, 3116–3140. [Google Scholar] [CrossRef]
  39. Wang, H.; Lyu, X.; Guo, H.; Wang, Y.; Zou, S.; Ling, Z.; Wang, X.; Jiang, F.; Zeren, Y.; Pan, W.; et al. Ozone pollution around a coastal region of South China Sea: Interaction between marine and continental air. Atmos. Chem. Phys. 2018, 18, 4277–4295. [Google Scholar] [CrossRef]
  40. Liu, X.; Yan, J.; Wang, Z.; Pan, X.; Su, F.; Yan, J.; Niu, J. Factors driving changes in surface ozone in 44 coastal cities in China. Air Qual. Atmos. Health 2024, 17, 341–351. [Google Scholar] [CrossRef]
  41. Ren, S.; Ji, X.; Zhang, X.; Huang, M.; Li, H.; Wang, H. Characteristics and Meteorological Effects of Ozone Pollution in Spring Season at Coastal City, Southeast China. Atmosphere 2022, 13, 2000. [Google Scholar] [CrossRef]
  42. Zhang, Y.-L.; Cao, F. Fine particulate matter (PM2.5) in China at a city level. Sci. Rep. 2015, 5, 14884. [Google Scholar] [CrossRef]
  43. Hama, S.M.L.; Kumar, P.; Harrison, R.M.; Bloss, W.J.; Khare, M.; Mishra, S.; Namdeo, A.; Sokhi, R.; Goodman, P.; Sharma, C. Four-year assessment of ambient particulate matter and trace gases in the Delhi-NCR region of India. Sustain. Cities Soc. 2020, 54, 102003. [Google Scholar] [CrossRef]
  44. Xie, Y.H.; Han, X.W.; Sun, P.; Zhang, X.L. Analysis of Environmental Materials with Correlation between PM2.5 and Other Indexes in AQI of Wuhan. Adv. Mater. Res. 2014, 1003, 269–272. [Google Scholar] [CrossRef]
  45. Wang, Z.H.; Tian, Z.H. Analysis of Correlation Between PM2.5 and Major Pollutants by the Method of Path Analysis. In Proceedings of the 2018 International Symposium on Communication Engineering & Computer Science (CECS 2018), Hohhot, China, 28–29 July 2018; 2018; Volume 7, pp. 44–50. [Google Scholar] [CrossRef]
  46. Zhu, J.; Chen, L.; Liao, H.; Dang, R. Correlations between PM2.5 and Ozone over China and Associated Underlying Reasons. Atmosphere 2019, 10, 352. [Google Scholar] [CrossRef]
  47. Jia, M.; Zhao, T.; Cheng, X.; Gong, S.; Zhang, X.; Tang, L.; Liu, D.; Wu, X.; Wang, L.; Chen, Y. Inverse Relations of PM2.5 and O3 in Air Compound Pollution between Cold and Hot Seasons over an Urban Area of East China. Atmosphere 2017, 8, 59. [Google Scholar] [CrossRef]
  48. Zhou, L.; Sun, L.; Luo, Y.; Xia, X.; Huang, L.; Liao, Z.; Yan, X. Air pollutant concentration trends in China: Correlations between solar radiation, PM2.5, and O3. Air Qual. Atmos. Health 2023, 16, 1721–1735. [Google Scholar] [CrossRef]
  49. Sun, Y.; Zhuang, G.; Tang, A.; Wang, Y.; An, Z. Chemical Characteristics of PM2.5 and PM10 in Haze−Fog Episodes in Beijing. Environ. Sci. Technol. 2006, 40, 3148–3155. [Google Scholar] [CrossRef]
  50. Hao, T.; Chen, S.; Liu, J.; Tang, Y.; Han, S. An observational study on the impact of sea-land breeze and low-level jet on air pollutant transport in the Bohai Bay. Atmos. Pollut. Res. 2024, 15, 102143. [Google Scholar] [CrossRef]
  51. Requia, W.J.; Jhun, I.; Coull, B.A.; Koutrakis, P. Climate impact on ambient PM2.5 elemental concentration in the United States: A trend analysis over the last 30 years. Environ. Int. 2019, 131, 104888. [Google Scholar] [CrossRef]
  52. Tai, A.P.K.; Mickley, L.J.; Jacob, D.J. Correlations between fine particulate matter (PM2.5) and meteorological variables in the United States: Implications for the sensitivity of PM2.5 to climate change. Atmos. Environ. 2010, 44, 3976–3984. [Google Scholar] [CrossRef]
  53. Yang, Q.; Yuan, Q.; Li, T.; Shen, H.; Zhang, L. The Relationships between PM2.5 and Meteorological Factors in China: Seasonal and Regional Variations. Int. J. Environ. Res. Public Health 2017, 14, 1510. [Google Scholar] [CrossRef]
  54. Ge, Q.; Zhang, X.; Cai, K.; Liu, Y. Ozone Pollution in Chinese Cities: Spatiotemporal Variations and Their Relationships with Meteorological and Other Pollution Factors (2016–2020). Atmosphere 2022, 13, 908. [Google Scholar] [CrossRef]
  55. Wen, Y.; Xiao, J.; Yang, J.; Cai, S.; Liang, M.; Zhou, P. Quantitatively Disentangling the Geographical Impacts of Topography on PM2.5 Pollution in China. Remote Sens. 2022, 14, 6309. [Google Scholar] [CrossRef]
  56. Bei, N.; Zhao, L.; Wu, J.; Li, X.; Feng, T.; Li, G. Impacts of sea-land and mountain-valley circulations on the air pollution in Beijing-Tianjin-Hebei (BTH): A case study. Environ. Pollut. 2018, 234, 429–438. [Google Scholar] [CrossRef]
  57. Ding, A.; Wang, T.; Zhao, M.; Wang, T.; Li, Z. Simulation of sea-land breezes and a discussion of their implications on the transport of air pollution during a multi-day ozone episode in the Pearl River Delta of China. Atmos. Environ. 2004, 38, 6737–6750. [Google Scholar] [CrossRef]
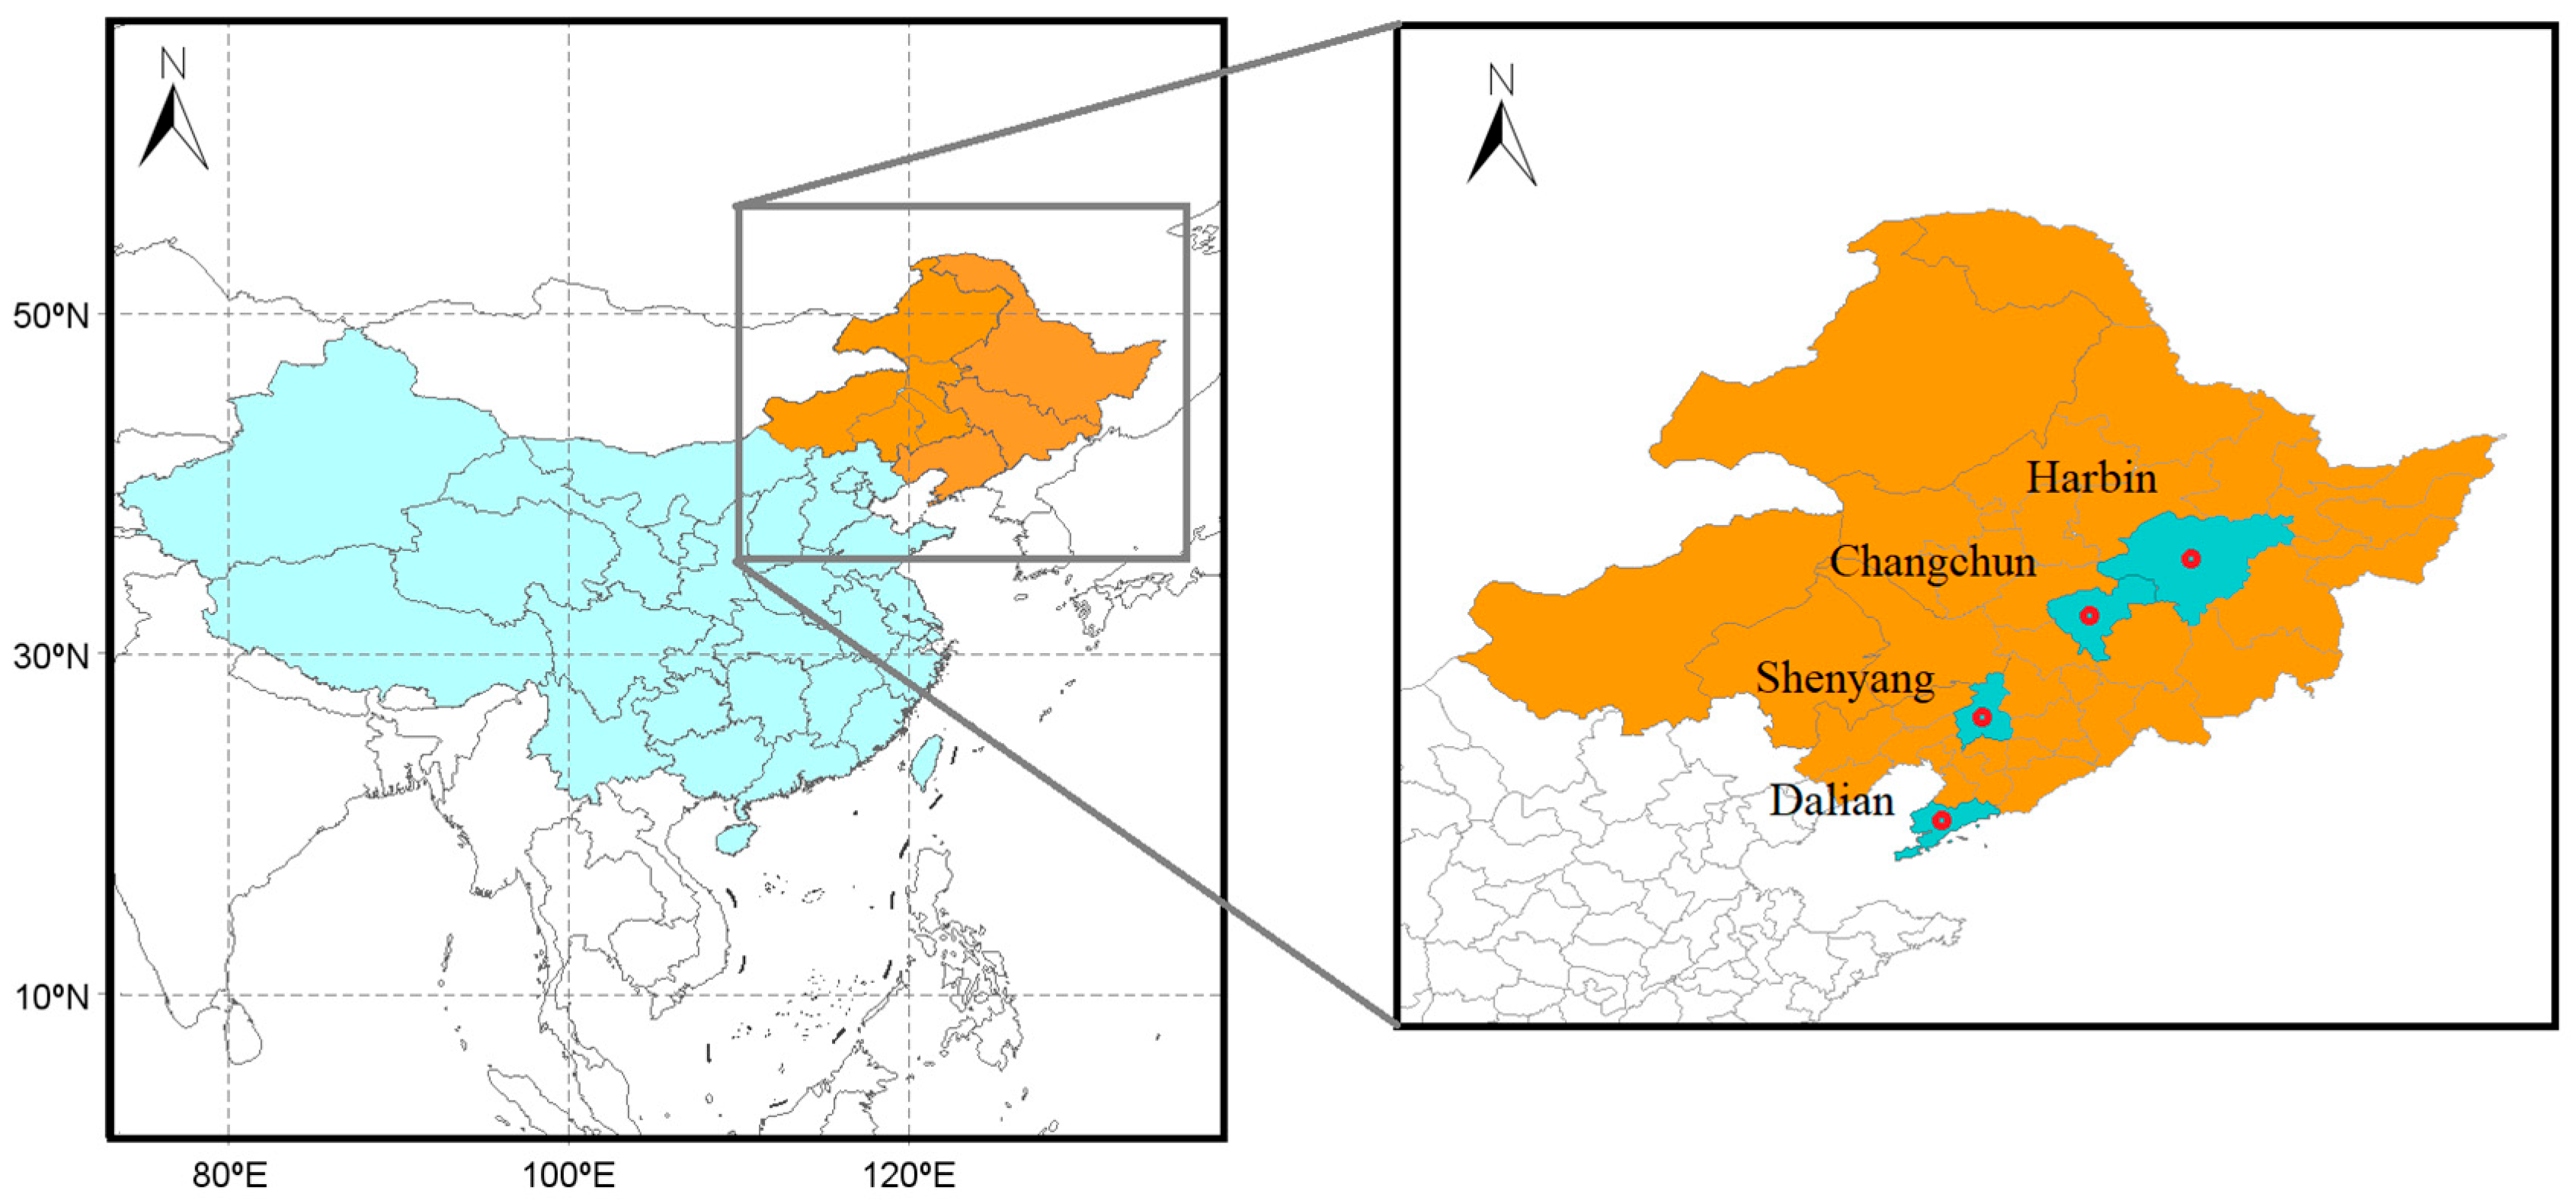
Figure 1. Geographical location and overview of the study area.
Atmosphere 16 01258 g001
Figure 2. The inter-annual variation in (a) PM2.5, (b) PM10, (c) PM2.5/PM10, (d) SO2, (e) NO2, and (f) O3 in Shenyang, Dalian, Changchun and Harbin during 2015–2023.
Atmosphere 16 01258 g002
Figure 3. The monthly variation in (a) PM2.5, (b) PM10, (c) SO2, (d) NO2, and (e) O3 in Shenyang, Dalian, Changchun and Harbin during 2015–2023.
Atmosphere 16 01258 g003
Figure 4. Pearson correlation matrix of daily mean concentrations of criteria pollutants from 2015 to 2023. * p < 0.05, *** p < 0.001, ns, not significant.
Atmosphere 16 01258 g004
Figure 5. The number of haze days over different cities of Northeastern region during 2015–2023.
Atmosphere 16 01258 g005
Figure 6. The percentage of occurrence of O3 polluted days, PM2.5 polluted days and complex polluted days over different cities of Northeastern region from 2015 to 2023.
Atmosphere 16 01258 g006
Figure 7. Scatter plots of daily mean PM2.5 and O3 versus atmospheric oxidative capacity in color. The dashed line is used to depict the secondary standard for O3 and PM2.5 in the National Air Pollutant Emission.
Atmosphere 16 01258 g007
Figure 8. Multiyear (2015–2023) monthly variation in percentage (%) of haze and complex pollution days in the cities of the Northeastern region.
Atmosphere 16 01258 g008
Figure 9. Box plot of different meteorological parameters from 2015 to 2023 over different cities of Northeastern region. Different lowercase letters (a, b, c, etc.) indicate significant differences among cities as determined by a one-way ANOVA (p < 0.05). The point below the relative humidity in Harbin in 2015 is an outlier (7.0%).
Atmosphere 16 01258 g009
Figure 10. Spearman correlation analysis between air pollutants and meteorological factors in four cities across spring, summer, autumn, and winter. * p < 0.05, ** p < 0.01, *** p < 0.001.
Atmosphere 16 01258 g010
Figure 11. WPSCF analysis of PM2.5 in Shenyang for (a) spring, (b) summer, (c) autumn, and (d) winter. The color bar indicates the weights of pollution source regions.
Atmosphere 16 01258 g011
Figure 12. WPSCF analysis of PM10 in Shenyang for (a) spring, (b) summer, (c) autumn, and (d) winter. The color bar indicates the weights of pollution source regions.
Atmosphere 16 01258 g012
Figure 13. WPSCF analysis of NO2 in Shenyang for (a) spring, (b) summer, (c) autumn, and (d) winter. The color bar indicates the weights of pollution source regions.
Atmosphere 16 01258 g013
Figure 14. WPSCF analysis of O3 in Shenyang for (a) spring, (b) summer, (c) autumn, and (d) winter. The color bar indicates the weights of pollution source regions.
Atmosphere 16 01258 g014
Figure 15. Seasonal variations in nationwide O3 concentrations during spring, summer, autumn, and winter based on kriging interpolation.
Atmosphere 16 01258 g015
Disclaimer/Publisher’s Note: The statements, opinions and data contained in all publications are solely those of the individual author(s) and contributor(s) and not of MDPI and/or the editor(s). MDPI and/or the editor(s) disclaim responsibility for any injury to people or property resulting from any ideas, methods, instructions or products referred to in the content.