Article

Comparison of Two Miniaturized, Rectifiable Aerosol Photometers for Personal PM2.5 Monitoring in a Dusty Occupational Environment

1
Department of Public Health, Brigham Young University, Provo, UT 84602, USA
2
Department of Pediatrics, University of Utah, Salt Lake City, UT 84112, USA
3
Rocky Mountain Center for Occupational and Environmental Health, University of Utah, Salt Lake City, UT 84112, USA
4
Department of Nutrition, Dietetics, and Food Science, Brigham Young University, Provo, UT 84602, USA
5
College of Nursing, Brigham Young University, Provo, UT 84602, USA
6
Department of Civil and Construction Engineering, Brigham Young University, Provo, UT 84602, USA
7
RTI International, Research Triangle Park, NC 27713, USA
8
Department of Community Medicine and Public Health, Karnali Academy of Health Sciences, Jumla 21200, Nepal
9
Department of Exercise Sciences, Brigham Young University, Provo, UT 84602, USA
*
Author to whom correspondence should be addressed.
Atmosphere 2025, 16(11), 1233; https://doi.org/10.3390/atmos16111233 (registering DOI)
Submission received: 14 September 2025 / Revised: 20 October 2025 / Accepted: 22 October 2025 / Published: 25 October 2025
(This article belongs to the Section Air Quality and Health)

Abstract

Wearable, rectifiable aerosol photometers (WRAPs), instruments with combined nephelometer and on-board filter-based sampling capabilities, generally show strong correlations with reference instruments across a range of ambient and household PM2.5 concentrations. However, limited data exist on their performance when challenged by mixed aerosol exposures, such as those found in dusty occupational environments. Understanding how these instruments perform across a spectrum of environments is critical, as they are increasingly used in human health studies, including those in which concurrent PM2.5 and coarse dust exposures occur simultaneously. The authors collected co-located, ~24 h. breathing zone gravimetric and nephelometer PM2.5 measures using the MicroPEM v3.2A (RTI International) and the UPAS v2.1 PLUS (Access Sensor Technologies). Samples were collected from adult brick workers (n = 93) in Nepal during work and non-work activities. Median gravimetric/arithmetic mean (AM) PM2.5 concentrations for the MicroPEM and UPAS were 207.06 (interquartile range [IQR]: 216.24) and 737.74 (IQR: 1399.98) µg/m3, respectively (p < 0.0001), with a concordance correlation coefficient (CCC) of 0.26. The median stabilized inverse probability-weighted nephelometer PM2.5 concentrations, after gravimetric correction, for the MicroPEM and UPAS were 169.16 (IQR: 204.98) and 594.08 (IQR: 1001.00) µg/m3, respectively (p-value < 0.0001), with a CCC of 0.31. Digital microscope photos and electron micrographs of filters confirmed large particle breakthrough for both instruments. A possible explanation is that the miniaturized pre-separators were overwhelmed by high dust exposures. This study was unique in that it evaluated personal PM2.5 monitors in a high dust occupational environment using both gravimetric and nephelometer-based measures. Our findings suggest that WRAPs may substantially overestimate personal PM2.5 exposures in environments with concurrently high PM2.5 and coarse dust levels, likely due to large particle breakthrough. This overestimation may obscure associations between exposures and health outcomes. For personal PM2.5 monitoring in dusty environments, the authors recommend traditional pump and cyclone or impaction-based sampling methods in the interim while miniaturized pre-separators for WRAPs are designed and validated for use in high dust environments.

1. Introduction

Elevated acute and chronic exposures to fine particulate air pollution, defined as particles with an aerodynamic diameter ≤ 2.5 µm (PM2.5), are associated with myriad poor health outcomes. These include cardiovascular disorders (ischemic heart disease and stroke), respiratory illnesses (chronic obstructive pulmonary disease [COPD], lower respiratory infections, and lung cancer), diabetes mellitus, and gestational problems including low birth weight, among others [1,2,3,4]. Workers’ exposures to PM2.5, particularly in low- and middle-income countries (LMICs), tend to comprise ambient air pollution, household air pollution (HAP), and occupational aerosol inhalation. In 2019, approximately 4.1 million deaths and 118.2 million disability-adjusted life years (DALYs) globally were attributed to ambient PM2.5 exposures originating from sources such as automobile exhaust, industrial and power generation emissions, and refuse burning [4]. Similarly, recent studies found that HAP exposure, originating from indoor burning of solid fuels (coal, wood, animal dung, etc.), is responsible for approximately 2.3–3.1 million deaths and 91–111 million DALYs annually [5,6]. Among all-risk contributors to the global burden of disease in 2021, particulate matter pollution and occupational particulate matter, gases, and fumes were ranked 1 and 33, respectively [7]. Regarding occupational exposures, much of this burden manifests as lung diseases. For example, the occupational population attributable fractions (PAF) of asthma and COPD associated with workplace inhalation exposures are 16% and 14%, respectively [8].
In general, ambient PM2.5 is measured at a limited number of community-level stationary monitors. These monitors likely do not accurately represent individual exposures which are highly dependent on one’s movement through exposure gradients and varying microenvironments throughout the day [9,10]. In fact, stationery monitors often significantly underestimate workers’ exposures. For example, traffic police officers’, taxi drivers’, and street vendors’ personal air pollution exposures are significantly higher than levels measured by stationary monitors in the same community [11,12,13,14]. Determining the occupational component of one’s total PM2.5 exposure is further complicated when workers live at the worksite or in employer-provided housing, which grays the lines between personal and work environments. Some migrant farmworkers in the U.S. and Canada, for instance, may live in poor-quality, employer-provided housing with associated environmental-health related issues, including poor air quality [15,16]. Salient to the current study, seasonal brick workers in Nepal usually live in employer-provided housing at the worksite; housing that contributes significantly to their overall daily PM2.5 exposures [17,18]. Understanding the magnitude and duration of these separate contributors to workers’ overall inhaled PM2.5 burden is best accomplished through personal breathing zone (PBZ) monitoring.
The most common methods for conducting PBZ monitoring of workers’ aerosol exposures employ either wearable, filter-based sampling equipment followed by gravimetric analysis, or wearable, light-scattering aerosol photometers (nephelometers). Filter-based sampling with gravimetric analysis provides accurate estimates of total mass concentration over the sampling period and allows for laboratory analysis of the sample’s chemical constituents. The primary disadvantage of filter-based sampling is its inability to show temporal variations in exposure, as the measurements depend on the mass of PM2.5 that accumulates on the filter over time [19]. Thus, concentrations calculated using filter-based sampling represent arithmetic mean concentrations over the sampling period. In contrast, aerosol photometers provide time-resolved data showing exposure trends; however, aerosol photometers are not accurate unless they are calibrated with the same particulate matter that is being sampled, or corrected using a co-located gravimetric method [20,21,22]. In recent years, miniaturized, wearable PBZ monitors such as the Ultrasonic Personal Air Sampler (UPAS; Access Sensor Technologies, LLC, Fort Collins, CO, USA) and the Micro-Personal Exposure Monitor (MicroPEM, RTI International, Research Triangle Park, NC, USA) have been developed that measure particulate exposures using filter-based and light-scattering methods simultaneously, which overcomes the necessity of running side-by-side gravimetric samples to rectify aerosol photometers readings [23,24].
There does not appear to be a common name in the literature for these miniaturized, wearable instruments that simultaneously collect filter-based and aerosol photometer measures. The term “next generation” was used in one paper [25], “low-burden” in others [24,26,27], and variations in “wearable”, “portable”, “miniaturized”, “low-cost”, and “personal monitor” are also common [28,29,30,31,32]. Herein, the authors will refer to this category of instruments as wearable, rectifiable aerosol photometers (WRAPs). The authors use the term “rectifiable” to note that on-board filter-based sampling in WRAPs allows for the user to correct the nephelometer readings without running co-located, gravimetric samples.
Our research team has used the MicroPEM to monitor indoor and PBZ PM2.5 exposures in previous studies among brick workers in Nepal [17,33]. Due to the age of our MicroPEMs, the authors purchased the UPAS instruments as a replacement, and the purpose of this study was to compare agreement in gravimetric and nephelometer measurements between the two instruments. WRAPs, including the UPAS and MicroPEM, generally show close agreement with conventional and reference sampling methods across a wide range of aerosol concentrations in both laboratory and field tests [24,25,29,31,34]. The lightweight, quiet, and compact design of WRAPs has made them especially well-suited for exposure studies on indoor air quality and children’s health [26,27,31,32,35]. A major gap in the literature, however, is the lack of studies evaluating how WRAPs perform in more extreme exposure settings, such as occupational environments with concurrent PM2.5 and dust exposures. Although WRAPs perform well under relatively high PM2.5 exposure conditions from ambient and indoor air pollution, concurrent high dust exposures may interfere with miniaturized particle pre-separators used in WRAPs. Brick manufacturing in Nepal’s Kathmandu Valley represents one such occupational setting where workers have relatively high PM2.5 exposures from ambient, indoor, and occupational sources [17,18,33,36,37,38,39], as well as high occupational dust exposures [40,41]. Understanding instrument operation under real-world conditions, particularly where multiple and high exposure sources exist, is necessary for accurate exposure assessments and for understanding relationships between exposure and health outcomes. Our study helps to address this gap by comparing agreement of co-located UPAS and MicroPEM monitors in an occupational environment, brick kilns in the Kathmandu Valley, with concomitant high PM2.5 and dust exposures.

2. Materials and Methods

2.1. Study Design

This study was conducted as a field comparison of the MicroPEM v3.2A and the UPAS v2.1 PLUS. The MicroPEM was designed as a lightweight (<240 g), single channel (PM2.5 or PM10), wearable aerosol monitor that simultaneously collects (1) real-time measurements with an on-board, light-scattering nephelometer using a 780nm laser, and (2) an integrated filter-based (25 mm) gravimetric sample. The MicroPEM pre-separates particles using a 2-stage (4.0 µm first-stage, and 2.5 µm second-stage) impactor inlet assembly [42]. The UPAS was similarly designed as a wearable (250 g) aerosol monitor that provides both real-time and filter-based sampling capabilities. The UPAS uses an ultrasonic piezoelectric pump to draw air through a cyclone pre-separator. Cyclone pre-separators are attached to interchangeable size-selective inlets for PM2.5, the respirable aerosol fraction (4.0 µm cut point), and PM10 [24]. The authors used only the PM2.5 size-selective inlet in this study. Simultaneous ~24-hr PBZ samples were collected while both instruments were worn by brick workers (n = 93) from two brick kilns in Bhaktapur, Nepal, from 18–26 February 2025. Participants were selected by convenience sampling. Inclusion criteria included that workers were 18 years old or older and employed at the brick kiln. Instruments were co-located near the breathing zone of each worker by attaching them to a 100% polyester vest worn by the participants. Participants were instructed to wear the sampling vest at all times during the sampling period, except while sleeping, when they were to place it beside their bed. All participants gave written informed consent via trained interpreters before being enrolled in the study. Ethical review and approval for this study were provided prior to participant enrollment by the Nepal Health Research Council (NHRC) and Brigham Young University’s (BYU) Institutional Review Board (IRB).

2.2. Filter Weighing

Polytetrafluoroethylene (PTFE) filters were pre- and post-weighed at BYU in a temperature and humidity-controlled room. PT25P-PF03 and PT37P-PF03 filters (Measurement Technology Laboratories, Minneapolis, MN, USA) were conditioned for 24 h, housed in SKC filter keepers (SKC, Inc., Eighty Four, PA, USA), which were clipped but not completely shut to prevent dust from landing on the filter. Humidity was controlled with a humidifier and monitored using an Extech SD500 datalogger (Extech Instruments, Nashua, NH, USA). Temperature was regulated by the building’s heating, ventilation, and air conditioning system. Filters were handled with Teflon-tip tweezers, neutralized for static using a Haug U-bar deionizer (Haug North America, Williamsville, NY, USA) and then weighed on a Mettler Toledo model XP2U microbalance (Mettler Toledo, Columbus, OH, USA). Two people were present when weighing filters, and each weight was read aloud and repeated back to ensure it was logged correctly. This process was repeated three times per filter. If, after weighing three times, the weights were not within 10 µg of each other, the filter was again passed through the U-bar deionizer to remove static electricity, and the process was repeated until three consecutive weights were recorded within 10 µg of each other. Pre- and post-weights were calculated as the average of these three values. After being weighed, filters were stored in completely shut filter keepers. Mean temperatures and relative humidities in the weighing room were 21.13 °C (standard deviation [SD] = 1.08 °C) and 27.99% (SD = 9.15%), respectively, during the pre-weighing period and 20.95 °C (SD = 0.67 °C) and 35.49% (SD = 8.57%), respectively, during the post-weighing period.

2.3. MicroPEM Methodology

MicroPEMs were prepared according to RTI International’s standard operating procedures [42]. All components were cleaned and inspected, and mini-impactor assemblies were oiled by RTI International prior to sampling. At BYU, devices were tested with new, pre-weighed 3.0 µm PT25P-PF03 filters to confirm functionality, and any stored data were cleared. Filters were placed in filter cassettes and inserted into the MicroPEMs before sampling. Nephelometer offset, pump flow rate, and instrument date/time were set in the field using Docking Station software v2.0 (RTI International, Research Triangle Park, NC, USA). The nephelometer offset was zeroed using high efficiency particulate air filtered air. Flow rates were calibrated to 0.5 L/min using a TSI model 4140 flow meter (TSI, Shoreview, MN, USA), which had been pre-calibrated by TSI before deployment in Nepal. Each MicroPEM was secured to the sampling vest with zip ties ran through the mesh and around the nozzle to ensure unobstructed air intake. After sampling, participants returned the vest and MicroPEM to study personnel. Data were downloaded, filters were removed, MicroPEMs were post-calibrated and cleaned, and batteries were replaced between participants. KIM Wipes (Kimberly-Clark Global Sales, LLC, Roswell, GA, USA) were used to clean internal components, including optics and impactor assemblies. Filters were stored in SKC filter keepers (SKC, Inc., Eighty Four, PA, USA). MicroPEMs were recalibrated and fitted with new filters before each sampling session.

2.4. UPAS Methodology

Prior to use, the UPAS instruments were fitted with PM2.5, 1.0 L/min size-selective inlets. Study personnel set UPAS sampling parameters using the Access Sensor Technologies UPAS mobile app. The software interface allowed adjustment of settings such as flow rate, duty cycle, sample name and duration, global positioning system (GPS), light emitting diode (LED), and filter parameters. Prior to deployment, each device was fully charged and programmed with the following settings: GPS and LED functions were turned off, power save mode was turned on and filter flow duty cycle was set to 50% (30 s on/30 s off) to preserve battery life. Having power save mode on meant the UPAS nephelometer would record PM2.5 concentrations, temperature, and relative humidity once every 30 s between 04:00 and 21:00 local time each day, but would change to recording PM2.5 concentrations once every 15 min between 21:00 and 04:00 local time each night. Sample duration was set to “indefinite” on each device to maximize data collection. The air flow rate was pre- and post-calibrated with a TSI model 4140 mass flow meter. The UPAS was attached with zip ties to the sampling vest so that it was positioned close to the participants’ breathing zones. After the sampling period, filters were removed and placed in filter keepers. The UPAS devices were then cleaned, charged, loaded with new 37mm PTFE filters, and reset in preparation for the next deployment.

2.5. Statistical Analyses

SAS version 9.4 (SAS Institute, Inc., Cary, NC, USA) was used to complete all data management (Supplemental Materials, p. 2) and analyses. For both the MicroPEM and UPAS nephelometer PM2.5 data, the authors corrected the data using the gravimetric PM2.5 concentrations following the manufacturers’ instructions as explained previously [18,42,43]. The authors calculated the differences in the paired (i.e., worn in the PBZ of the same participant at the same time) MicroPEM and UPAS “gravimetric” (i.e., arithmetic mean [AM], Supplemental Materials, p. 5) and nephelometer PM2.5 concentrations, temperature, and relative humidity. In other words, the authors calculated the differences as the MicroPEM value subtract the UPAS value, so a positive value meant the MicroPEM measurement was higher than the UPAS measurement, whereas a negative value meant the MicroPEM measurement was lower than the UPAS measurement. The authors analyzed both sets of samples, the gravimetric/AM and the nephelometer PM2.5 concentrations, temperature, and relative humidity logged once (or averaged to) every 30 s, for this study.
For the MicroPEM and UPAS gravimetric/AM PM2.5 concentrations, temperature, and relative humidity and their differences, the authors calculated the numbers of missing and non-missing samples, AMs, SDs, minimums, first quartiles, medians, third quartiles, and maximums. For the differences, the authors calculated the AMs, 95% confidence intervals (CI), and p-values via intercept-only linear regression models that used the original values as the outcomes. The distributions of the differences for the PM2.5 concentrations and temperature were not approximately normal, so the authors also calculated the medians, 95% CIs, and p-values via intercept-only quantile regression models that used the original values as the outcomes. The authors also calculated Pearson’s (PCC), Spearman’s (SCC), and the concordance correlation coefficients (CCC) [44] for associations between the MicroPEM and UPAS PM2.5 concentrations, temperature, and relative humidity. The authors made scatterplots and Bland–Altman plots [45,46] to compare the MicroPEM and UPAS PM2.5 concentrations, temperature, and relative humidity. The authors also conducted two sensitivity analyses (Supplemental Materials, p. 7).
For the MicroPEM and UPAS nephelometer PM2.5 concentrations, temperature, and relative humidity and their differences, we calculated the numbers of missing and non-missing values. To account for potential missing data bias, the authors applied stabilized inverse probability weights (IPW; Supplemental Materials, p. 5) [47,48] to calculate the AMs, SDs, minimums, first quartiles, medians, third quartiles, and maximums. For the differences, the authors applied the IPWs to calculate the AMs, 95% CIs, and p-values via intercept-only linear mixed regression models that used the original values as the outcomes, random intercepts for each participant with an unstructured covariance matrix, brick kiln workers as the subjects about which the authors made repeated measurements, a first order autoregressive moving average (ARMA[1,1]) correlation structure for the repeated measurements, and robust variance estimates [49]. The authors included random intercepts with an unstructured covariance matrix for each participant because Wald z-tests of the variance components (i.e., of the random intercepts) were significant at α = 0.05 for each outcome. The authors considered multiple correlation structures for the repeated measurements and used ARMA(1,1) because it had the lowest values of the Akaike Information Criterion [50] for each outcome. The authors applied the IPWs to calculate PCC and the CCC [44] for associations between the MicroPEM and UPAS nephelometer PM2.5 concentrations, temperature, and relative humidity. The authors applied the IPWs to calculate AM (i.e., between participants) MicroPEM and UPAS PM2.5 concentrations, temperature, and relative humidity and then made line graphs of the AMs over time. The authors also conducted one sensitivity analysis (Supplemental Materials, p. 7).

2.6. Filter Imaging

Photographs of representative 25mm and 37mm filters from the MicroPEM and UPAS, respectively, were taken with an Aven Cyclops digital microscope (Aven, Inc., Ann Arbor, MI, USA) at RTI, International. Imaging was at 140x magnification with screen resolution of 1600 × 1200 with side angle medium LED light. Electron micrographs of representative 25 mm and 37 mm filters from the MicroPEM and UPAS, respectively, were taken in the BYU Electron Microscopy Facility using an Apreo C Low-vacuum scanning electron microscope (Thermo Fisher Scientific, Waltham, MA, USA). Filters were mounted on 1 cm aluminum sample mounts using double-sided carbon tape. Samples were treated with a gold (80%) palladium (20%) sputter coat before imaging.

3. Results

Ninety-three brick kiln workers participated in this study by wearing both MicroPEM and UPAS instruments (Table 1). However, the authors excluded eight participants from the main analyses of gravimetric/AM and nephelometer PM2.5 concentrations and their differences because three had MicroPEM filters that were ripped, had a large tear, or were missing, two did not have any MicroPEM nephelometer data, one had a UPAS filter that was missing, and two did not have any UPAS nephelometer data. The authors excluded four participants from the main analyses of temperature and relative humidity and their differences because two did not have any MicroPEM nephelometer data and two did not have any UPAS nephelometer data.
The AM sampling time was 21.43 (SD: 2.28) hours. The median gravimetric/AM PM2.5 concentrations measured by the MicroPEM and UPAS instruments were 207.06 (interquartile range [IQR]: 216.24) and 737.74 (IQR: 1399.98) µg/m3, respectively, and the median difference was −553.35 (IQR: 1077.98) µg/m3 (Table 1). The median temperatures measured by the MicroPEM and UPAS instruments were 24.86 (IQR: 3.86) and 24.00 (IQR: 3.17) °C, respectively, and the median difference was 0.39 (IQR: 3.26) °C. The AM relative humidities measured by the MicroPEM and UPAS instruments were 43.67 (SD: 8.71) and 34.23 (SD: 5.00) %, respectively, and the median difference was 9.69 (SD: 6.87) %.
The median difference in gravimetric/AM PM2.5 concentrations measured by the MicroPEM and UPAS instruments was significantly different from zero (p-value < 0.0001) and the CCC was 0.26 (Table 2). The median difference in temperature measured by the MicroPEM and UPAS instruments was not significantly different from zero (p-value 0.30), but the CCC was 0.34. The AM difference in relative humidity measured by the MicroPEM and UPAS instruments was significantly different from zero (p-value < 0.0001) and the CCC was 0.28.
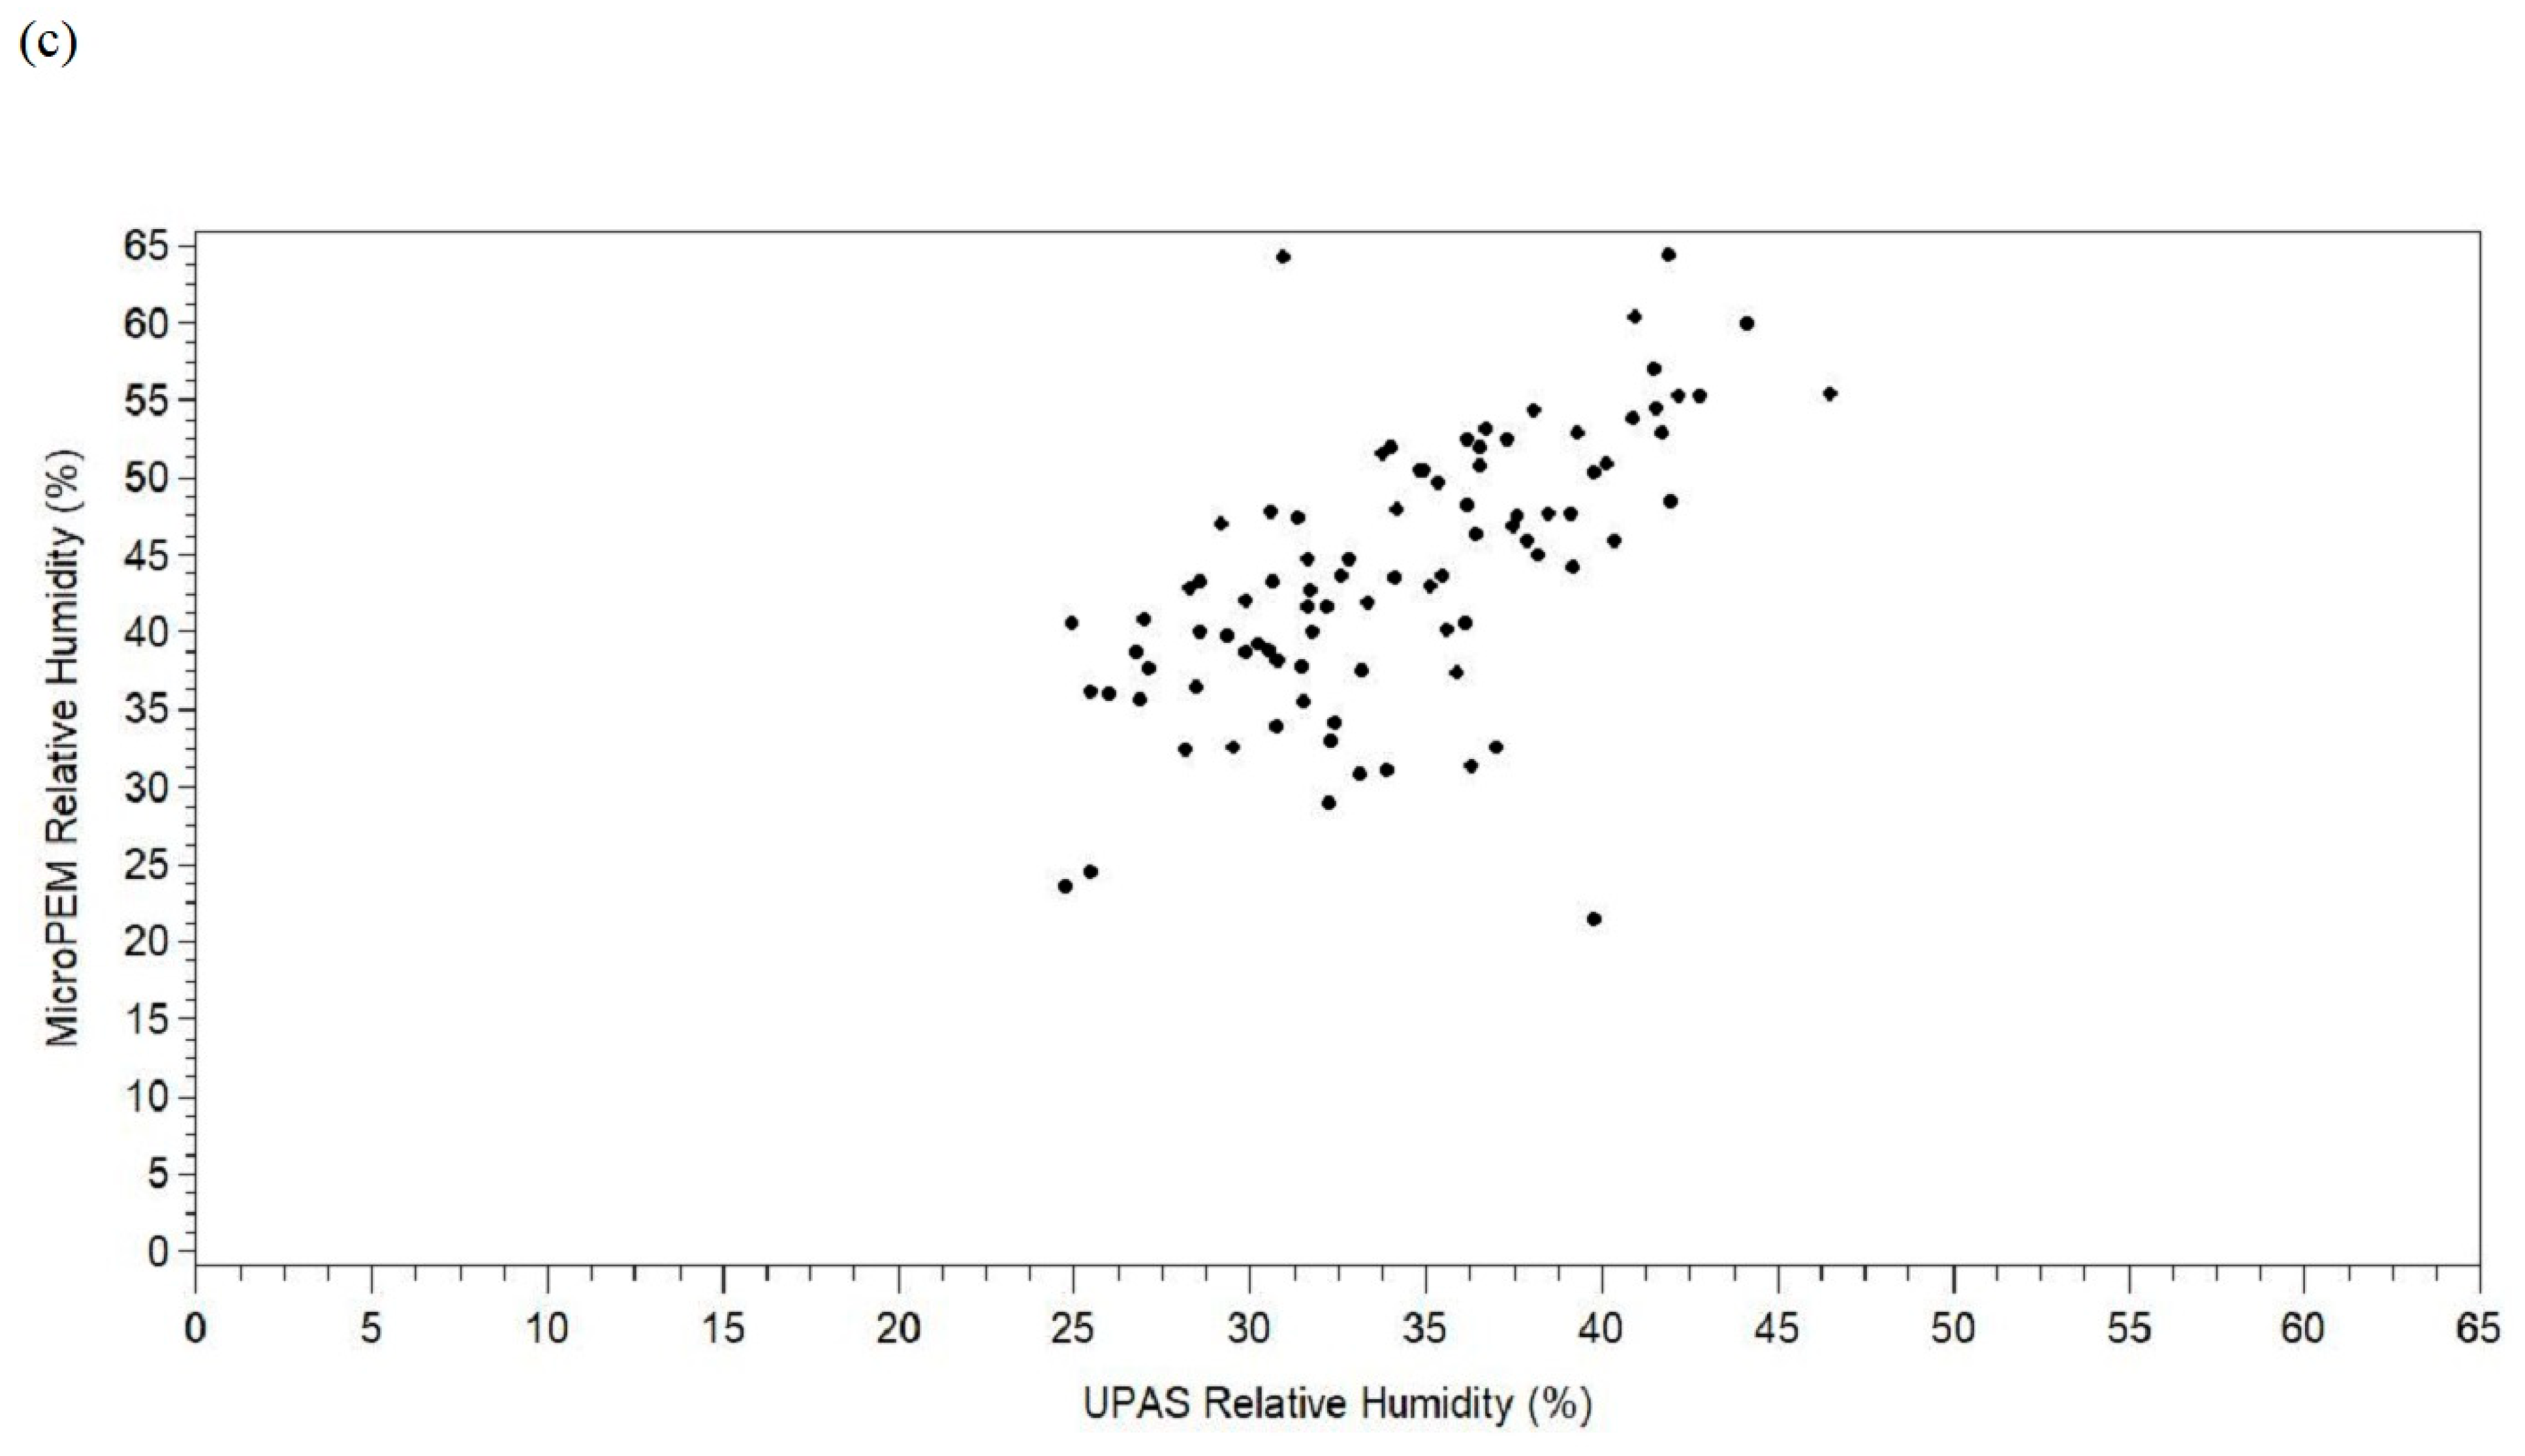
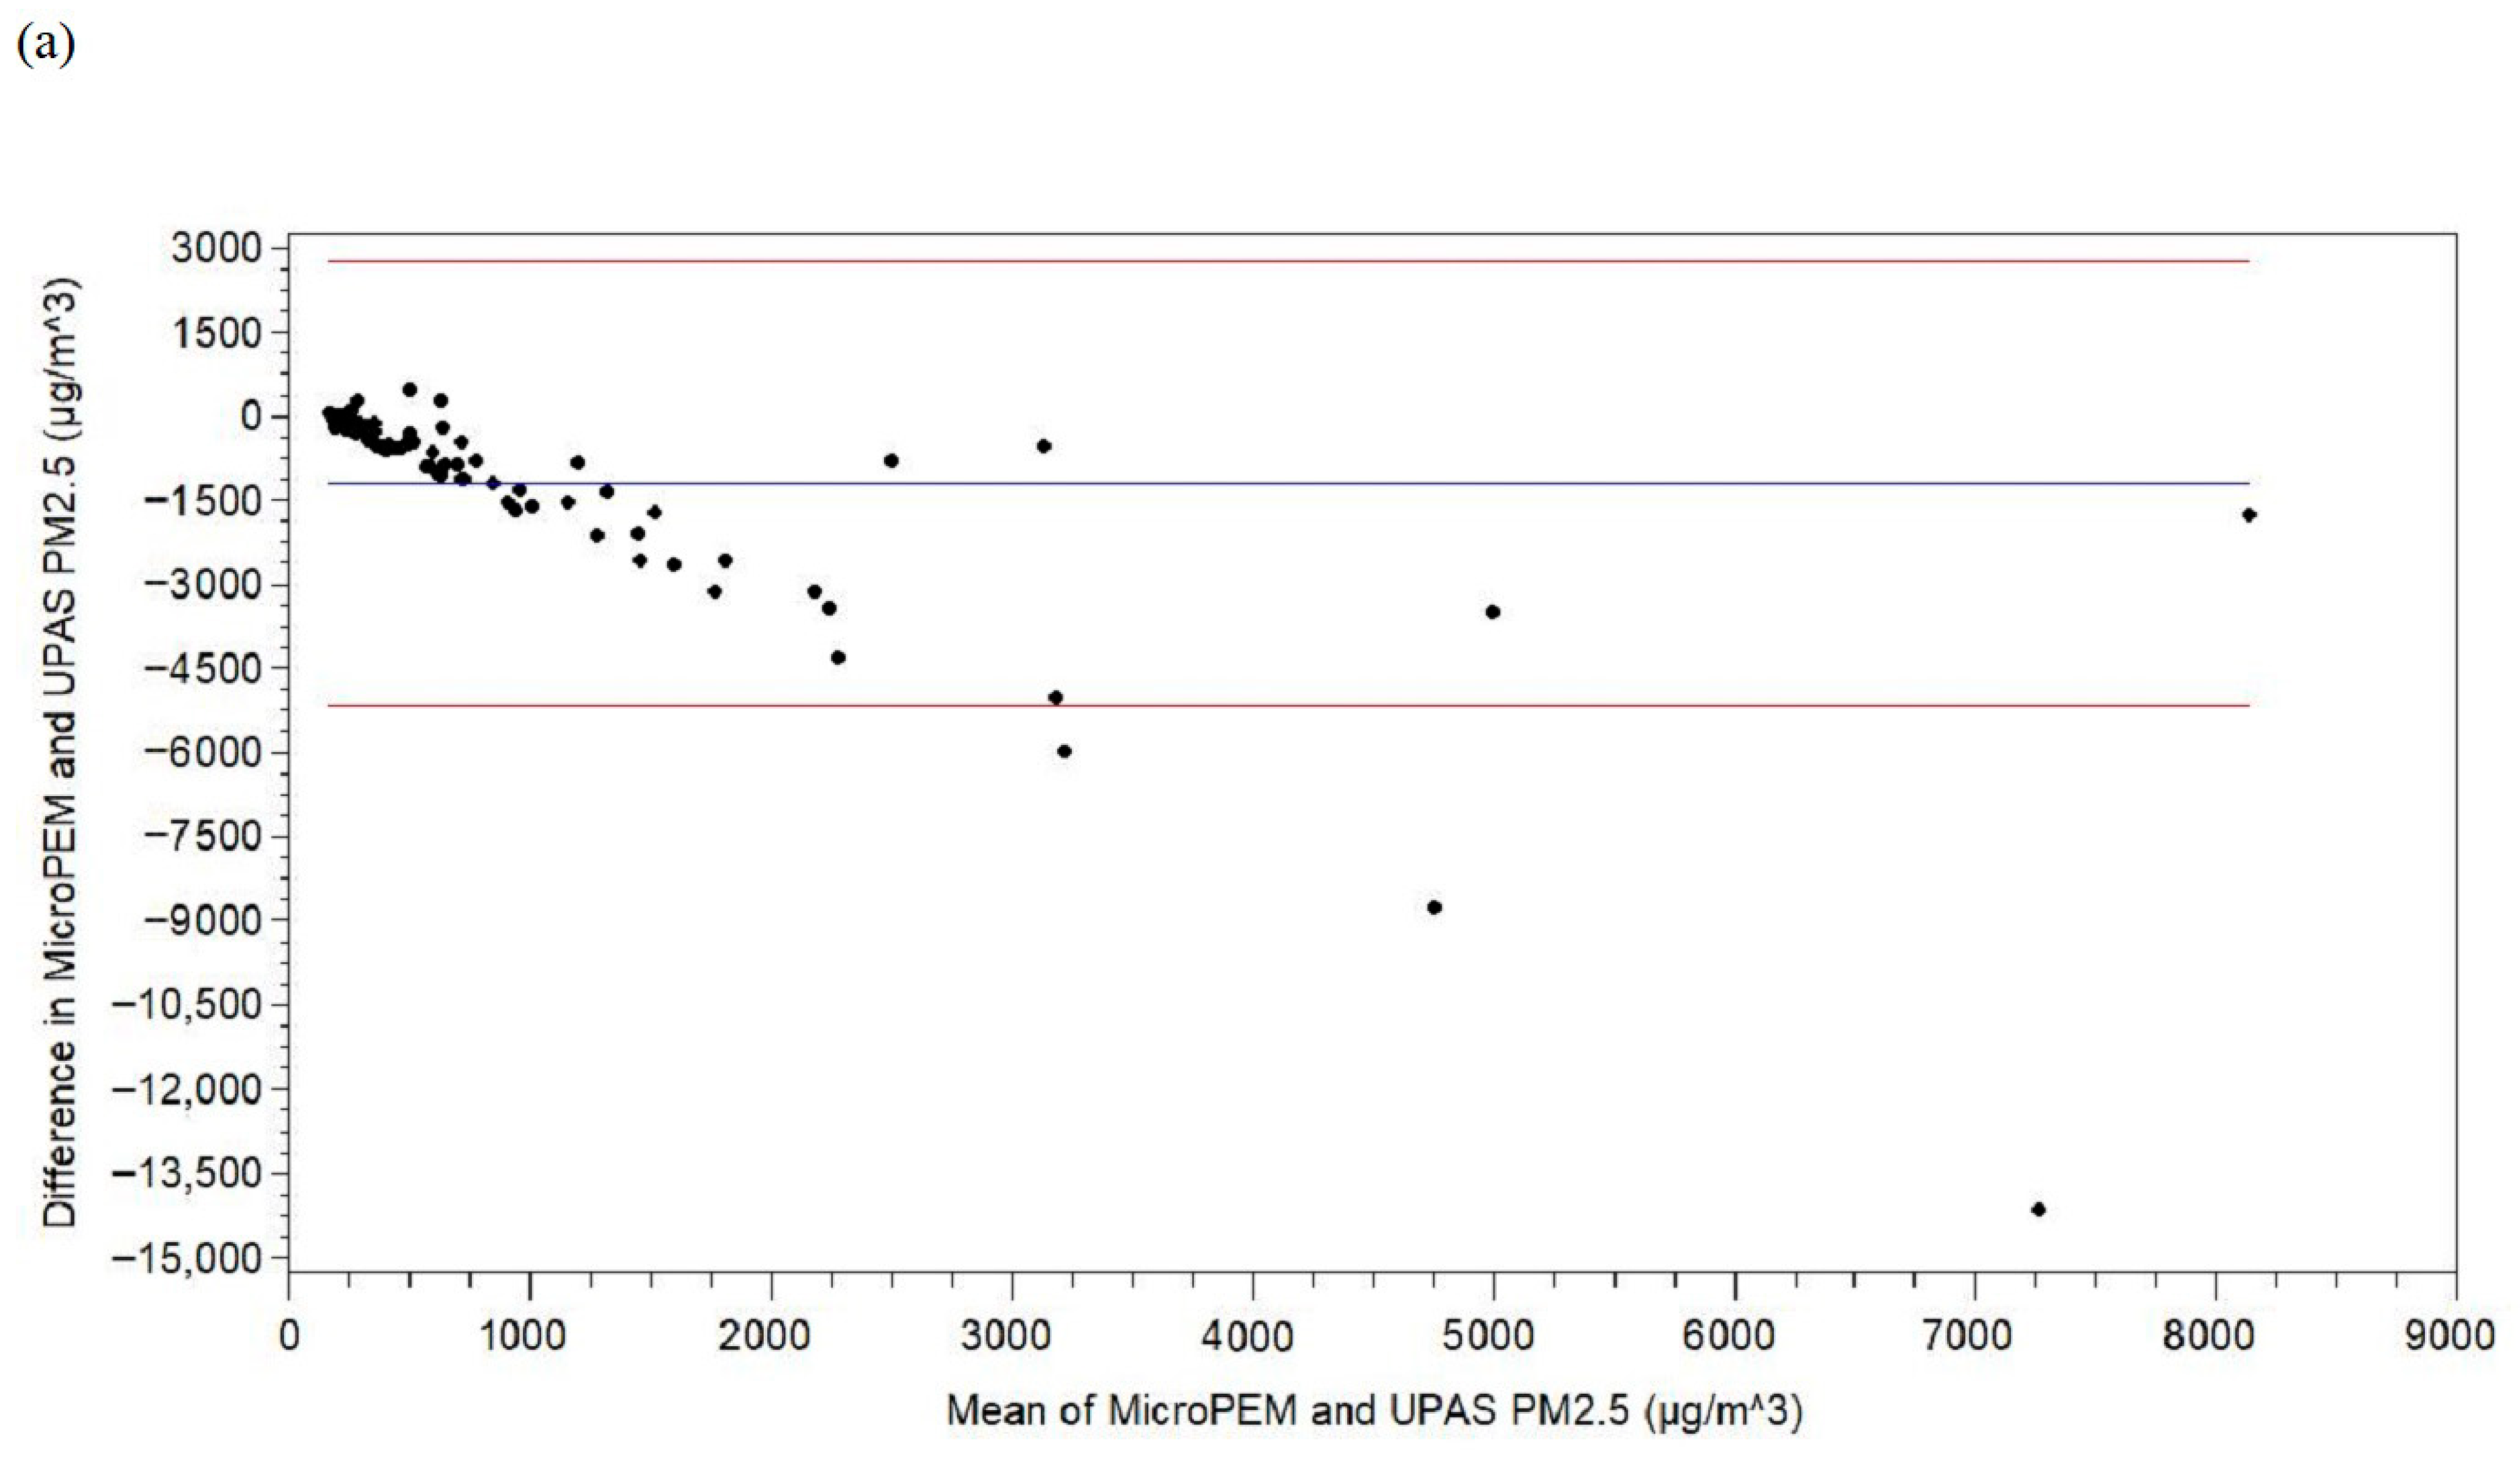
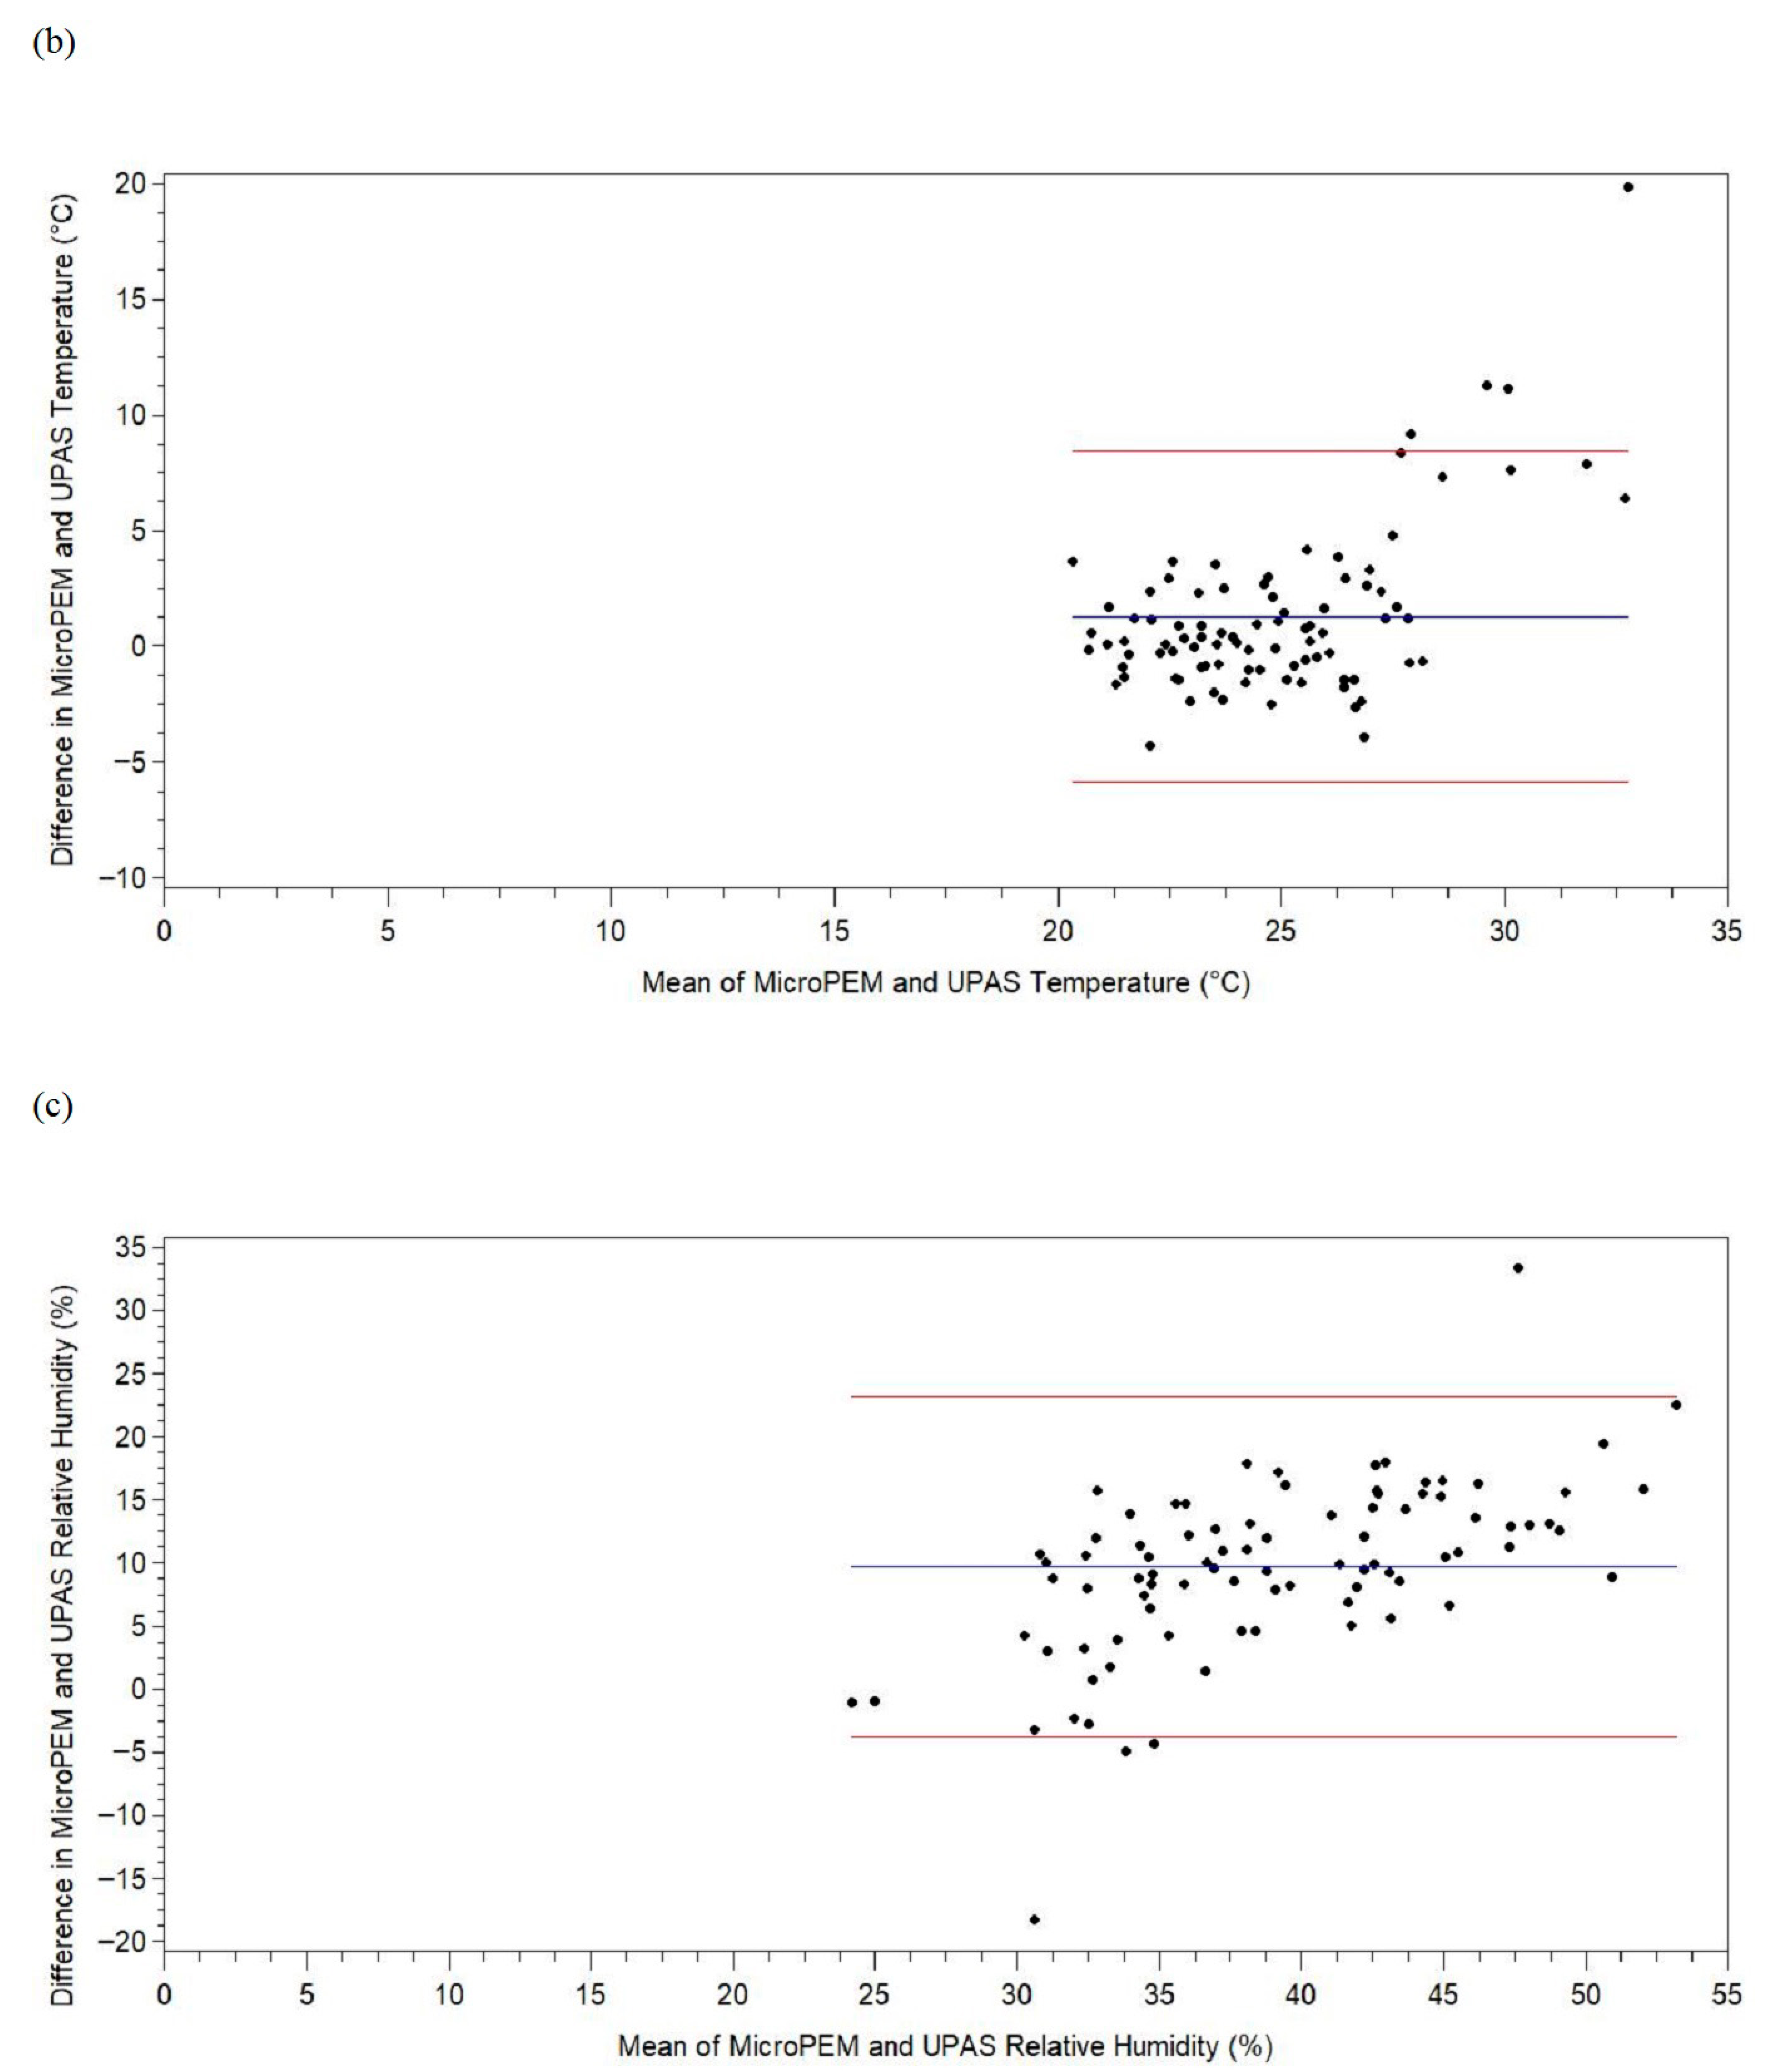
Scatterplots (Figure 1) indicated positive associations between the MicroPEM and UPAS gravimetric/AM PM2.5 concentrations, temperature, and relative humidity. Scatterplots and Bland–Altman plots (Figure 2) also indicated the MicroPEM instruments usually measured lower gravimetric/AM PM2.5 concentrations (panel [a] in Figure 1 and Figure 2), similar temperatures with some exceptions in which the MicroPEM instruments measured higher temperatures (panel [b] in Figure 1 and Figure 2), and higher relative humidities (panel [c] in Figure 1 and Figure 2) compared to the UPAS instruments. However, the percentages of measurements within the 95% limits of agreement in the Bland–Altman plots were approximately equal to the expected 95% for the gravimetric/AM PM2.5 concentrations (96%), temperature (96%), and relative humidity (96%).
The AMs of the IPWs the authors used to account for potential bias from missing data in the corrected MicroPEM and UPAS nephelometer PM2.5 concentrations, temperature, and relative humidity and their differences were 0.95. 0.94, and 0.94, respectively, and there were no extreme IPWs (e.g., no IPWs less than 0.05 or greater than 20; Supplemental Materials, Table S1).
The median stabilized inverse probability-weighted nephelometer PM2.5 concentrations measured by the MicroPEM and UPAS instruments were 169.16 (IQR: 204.98) and 594.08 (IQR: 1001.00) µg/m3, respectively, and the median difference was −390.27 (IQR: 872.57) µg/m3 (Table 3). The median stabilized inverse probability-weighted temperatures measured by the MicroPEM and UPAS instruments were 24.30 (IQR: 7.60) and 23.82 (IQR: 7.77) °C, respectively, and the median difference was 0.32 (IQR: 3.30) °C. The AM stabilized inverse probability-weighted relative humidities measured by the MicroPEM and UPAS instruments were 44.96 (SD: 12.38) and 34.17 (SD: 9.71) %, respectively, and the median difference was 10.79 (SD: 7.05) %.
The AM stabilized inverse probability-weighted difference in nephelometer PM2.5 concentrations measured by the MicroPEM and UPAS instruments was significantly different from zero (p-value < 0.0001) and the CCC was 0.31 (Table 4). The AM stabilized inverse probability-weighted difference in nephelometer temperature measured by the MicroPEM and UPAS instruments was significantly different from zero (p-value < 0.0001) and the CCC was 0.80. The AM stabilized inverse probability-weighted difference in nephelometer relative humidity measured by the MicroPEM and UPAS instruments was significantly different from zero (p-value < 0.0001) and the CCC was 0.54.
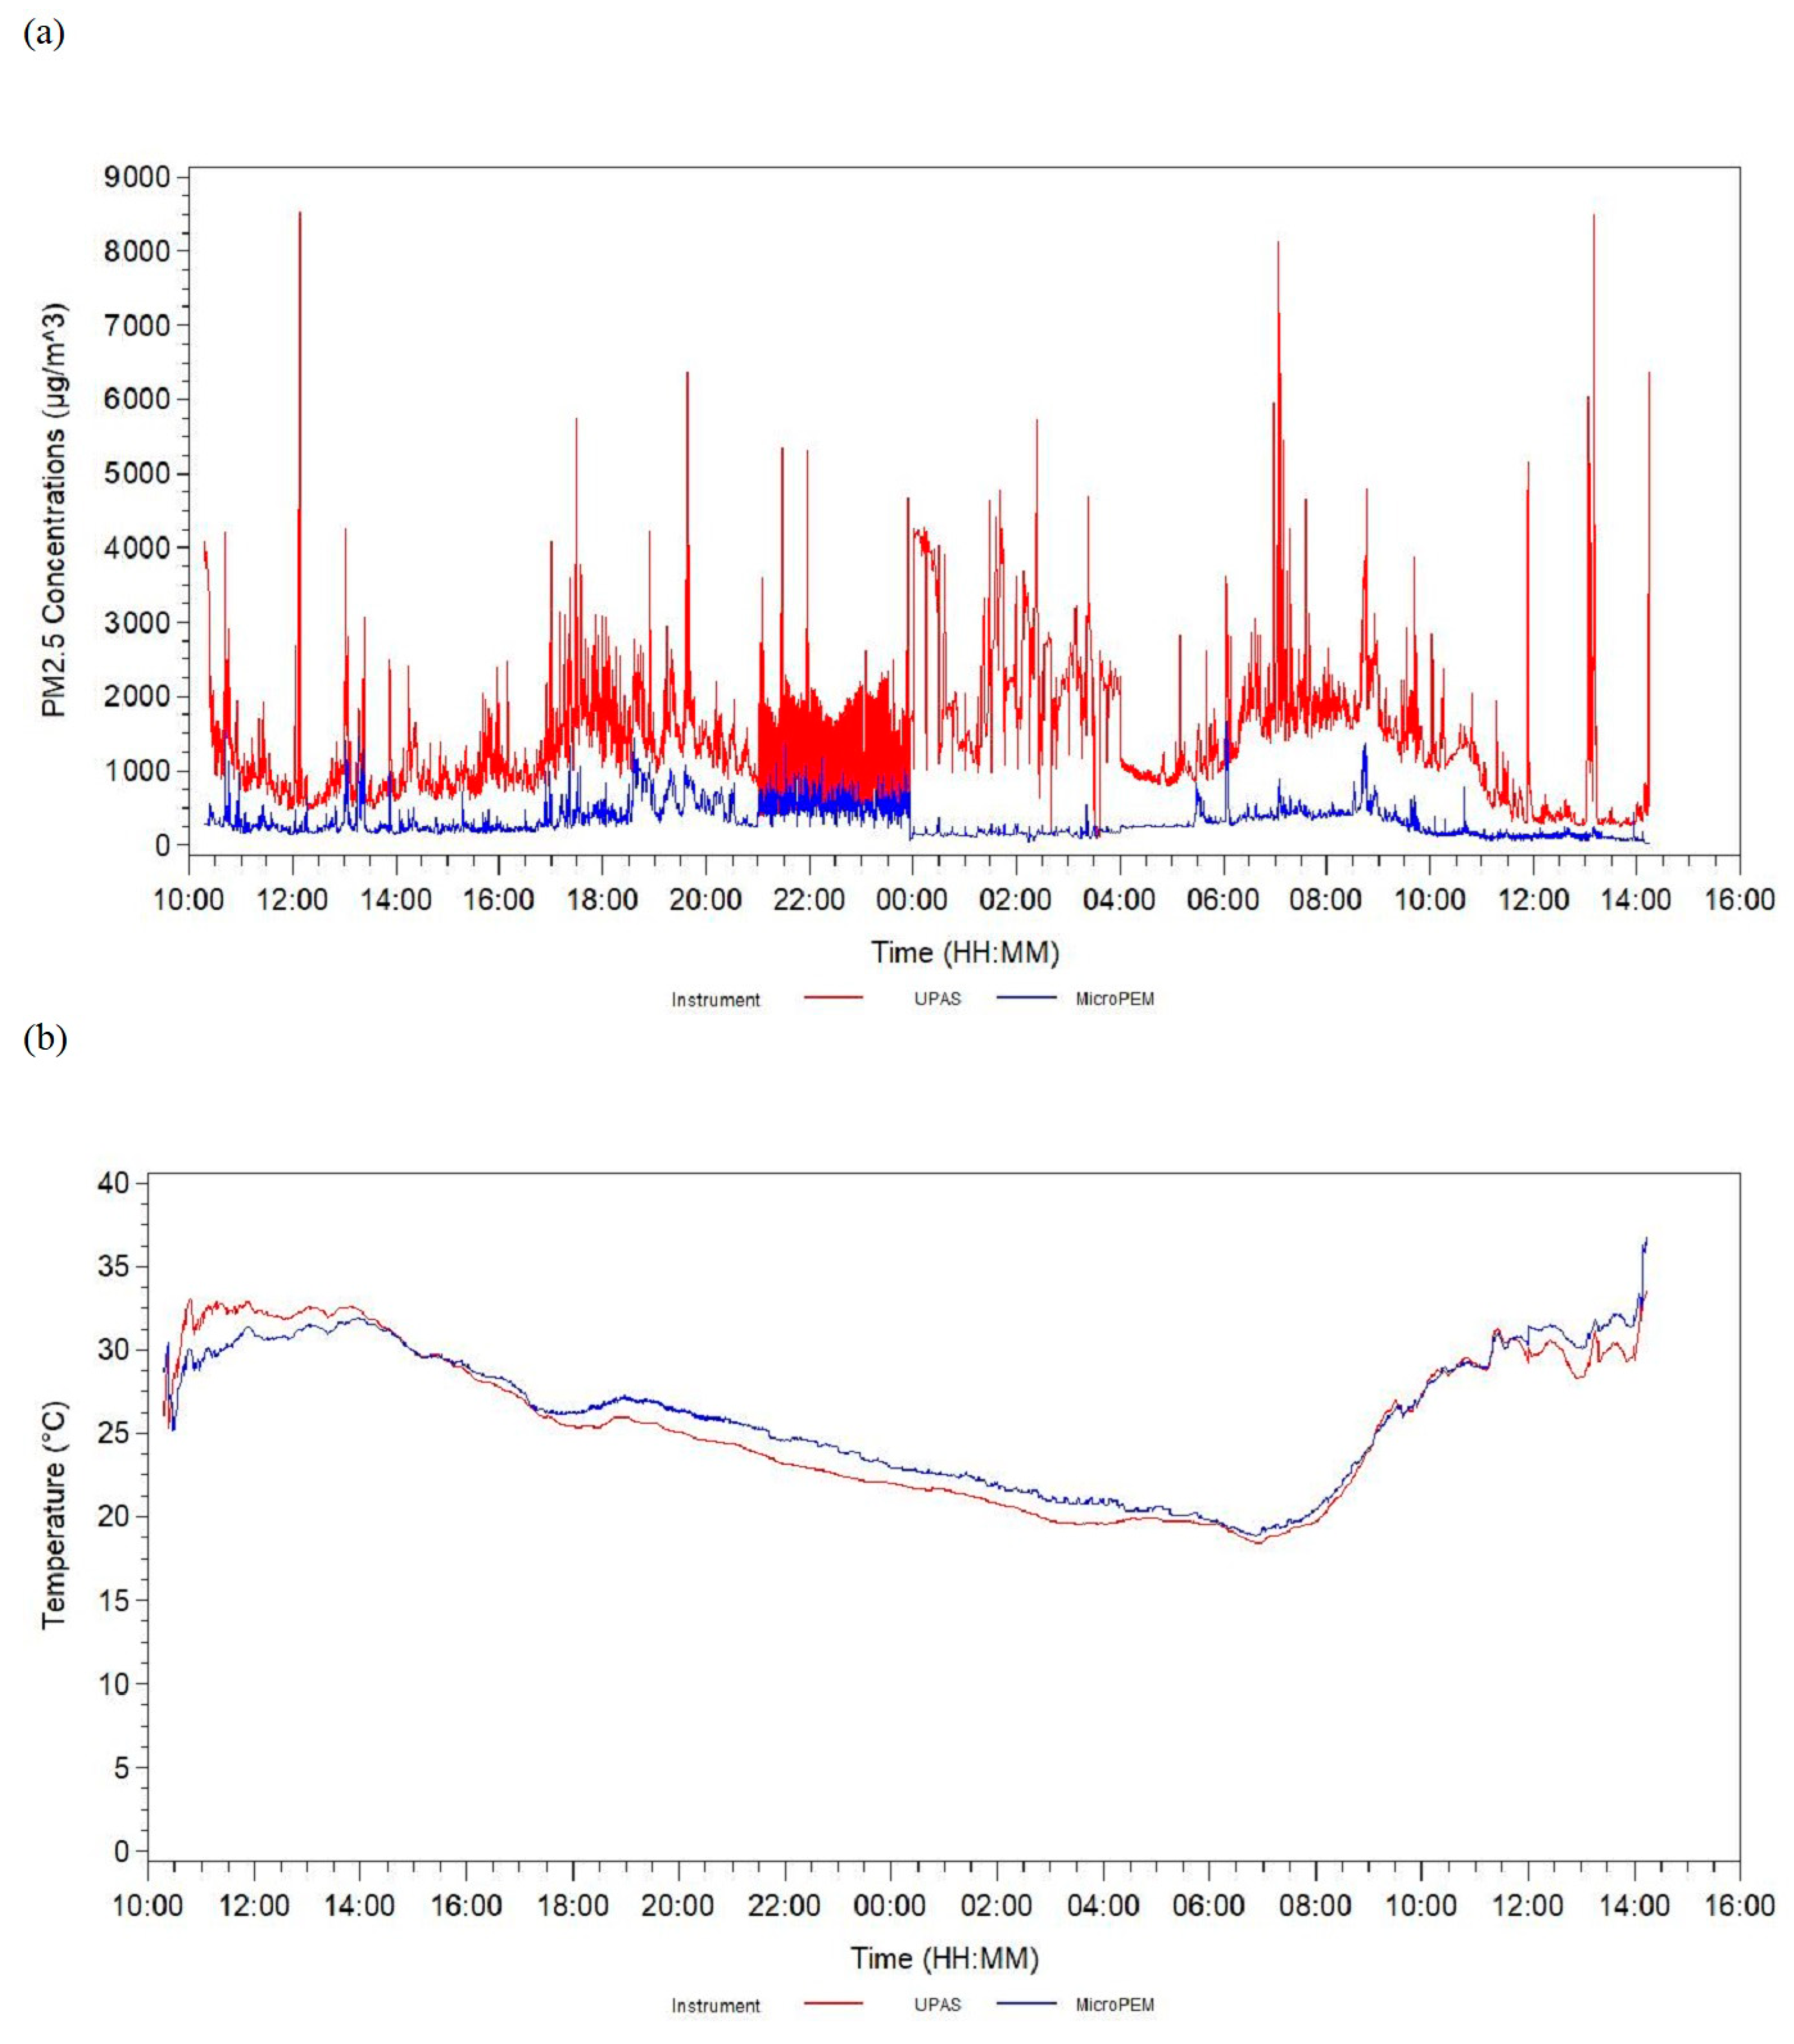
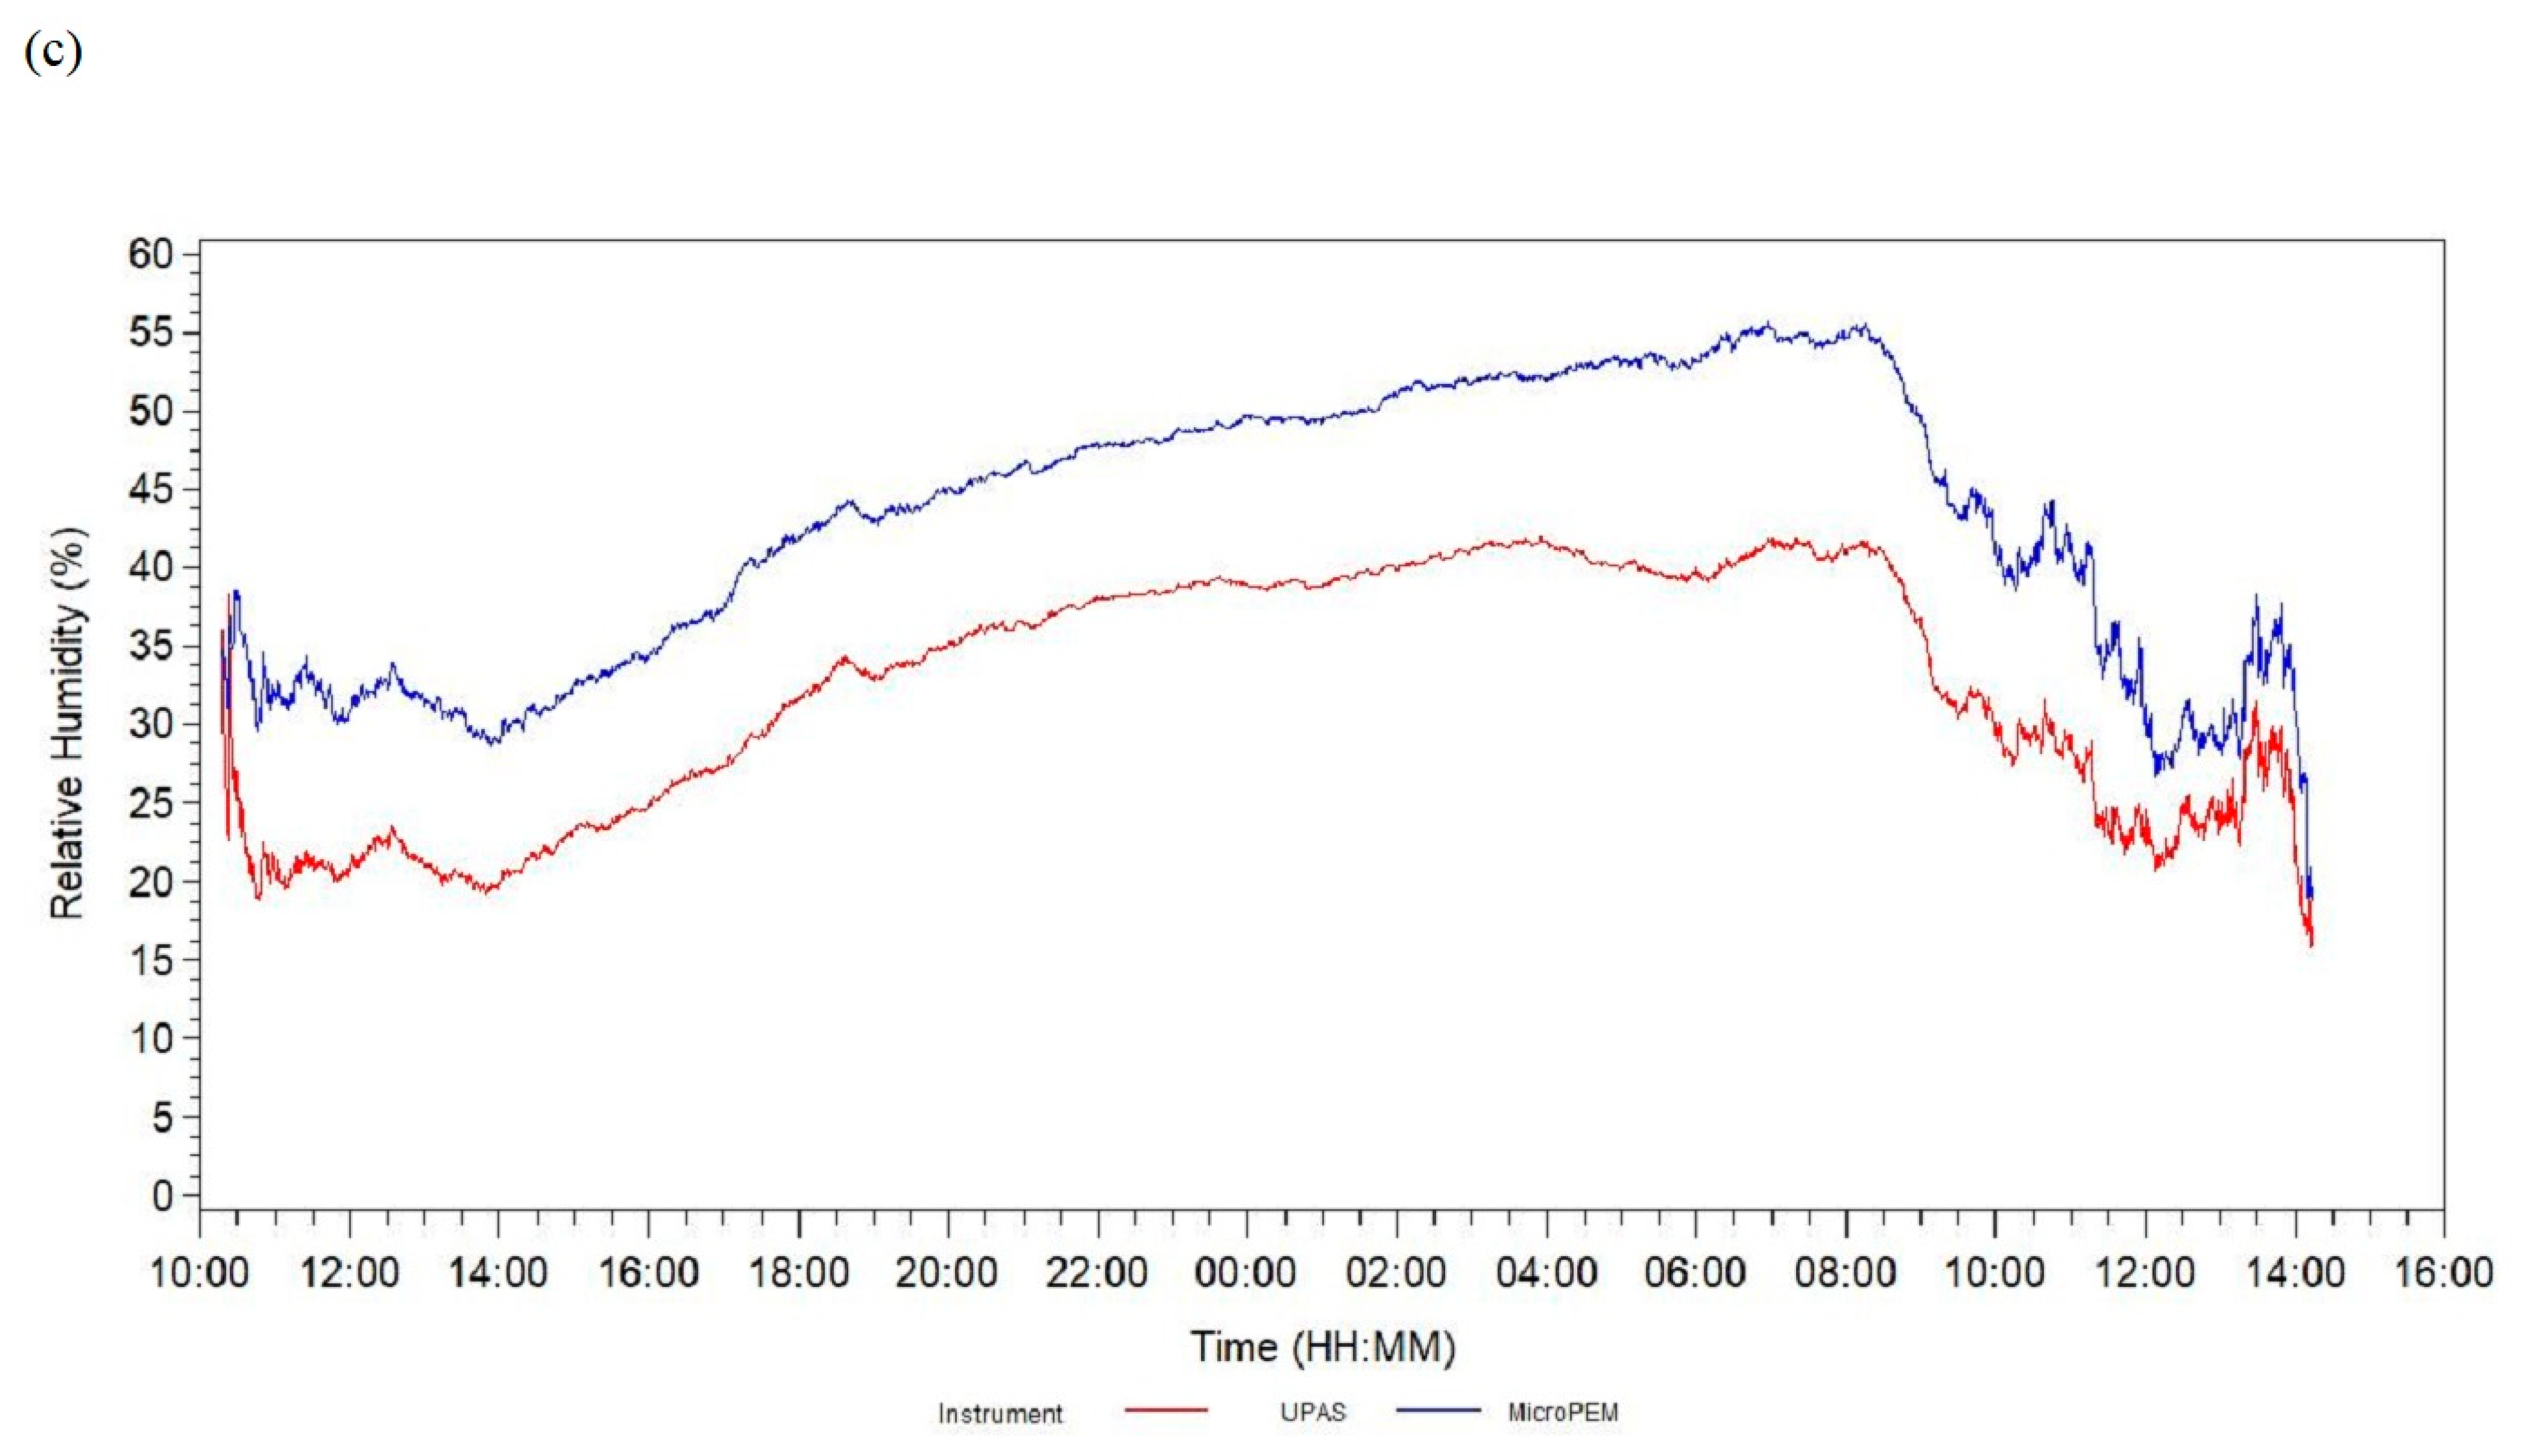
The line graph of the AMs (i.e., between participants) of the stabilized inverse probability-weighted nephelometer MicroPEM and UPAS PM2.5 concentrations over time (panel [a] in Figure 3) indicated several increases in PM2.5 exposures throughout the day and night including at mealtimes. However, the UPAS recorded larger PM2.5 concentrations than the MicroPEM throughout the sampling period and the difference between the UPAS and MicroPEM PM2.5 concentrations increased with increasing PM2.5 concentrations. The line graph of the AMs of the stabilized inverse probability-weighted nephelometer MicroPEM and UPAS temperature over time (panel [b] in Figure 3) indicated increasing temperature throughout the day and decreasing temperature throughout the night. In addition, the temperatures recorded by the MicroPEM and UPAS nephelometers were similar throughout the sampling period and indicated the same diurnal trends. The line graph of the AMs of the stabilized inverse probability-weighted nephelometer MicroPEM and UPAS relative humidity over time (panel [c] in Figure 3) indicated decreasing or stable (at mealtimes) relative humidity throughout the day and increasing relative humidity throughout the night. However, the MicroPEM recorded larger relative humidities than the UPAS throughout the sampling period, the difference between the MicroPEM and UPAS relative humidities was mostly constant throughout the sampling period, and the MicroPEM and UPAS indicated the same diurnal trends.
Results were generally similar in the first sensitivity analyses the authors conducted in which we used the original gravimetric PM2.5 concentrations and sampling times with the main exceptions being a lower PCC (0.31) and CCC (0.16) for gravimetric PM2.5 concentrations and a lower CCC for temperature (0.27).Results were nearly identical in the second sensitivity analyses the authors conducted in which the authors excluded samples from 11 participants for PM2.5 concentrations and three participants for temperature and relative humidity with the main exceptions being a lower PCC (0.40) and CCC (0.23) for stabilized inverse probability-weighted nephelometer PM2.5 concentrations.
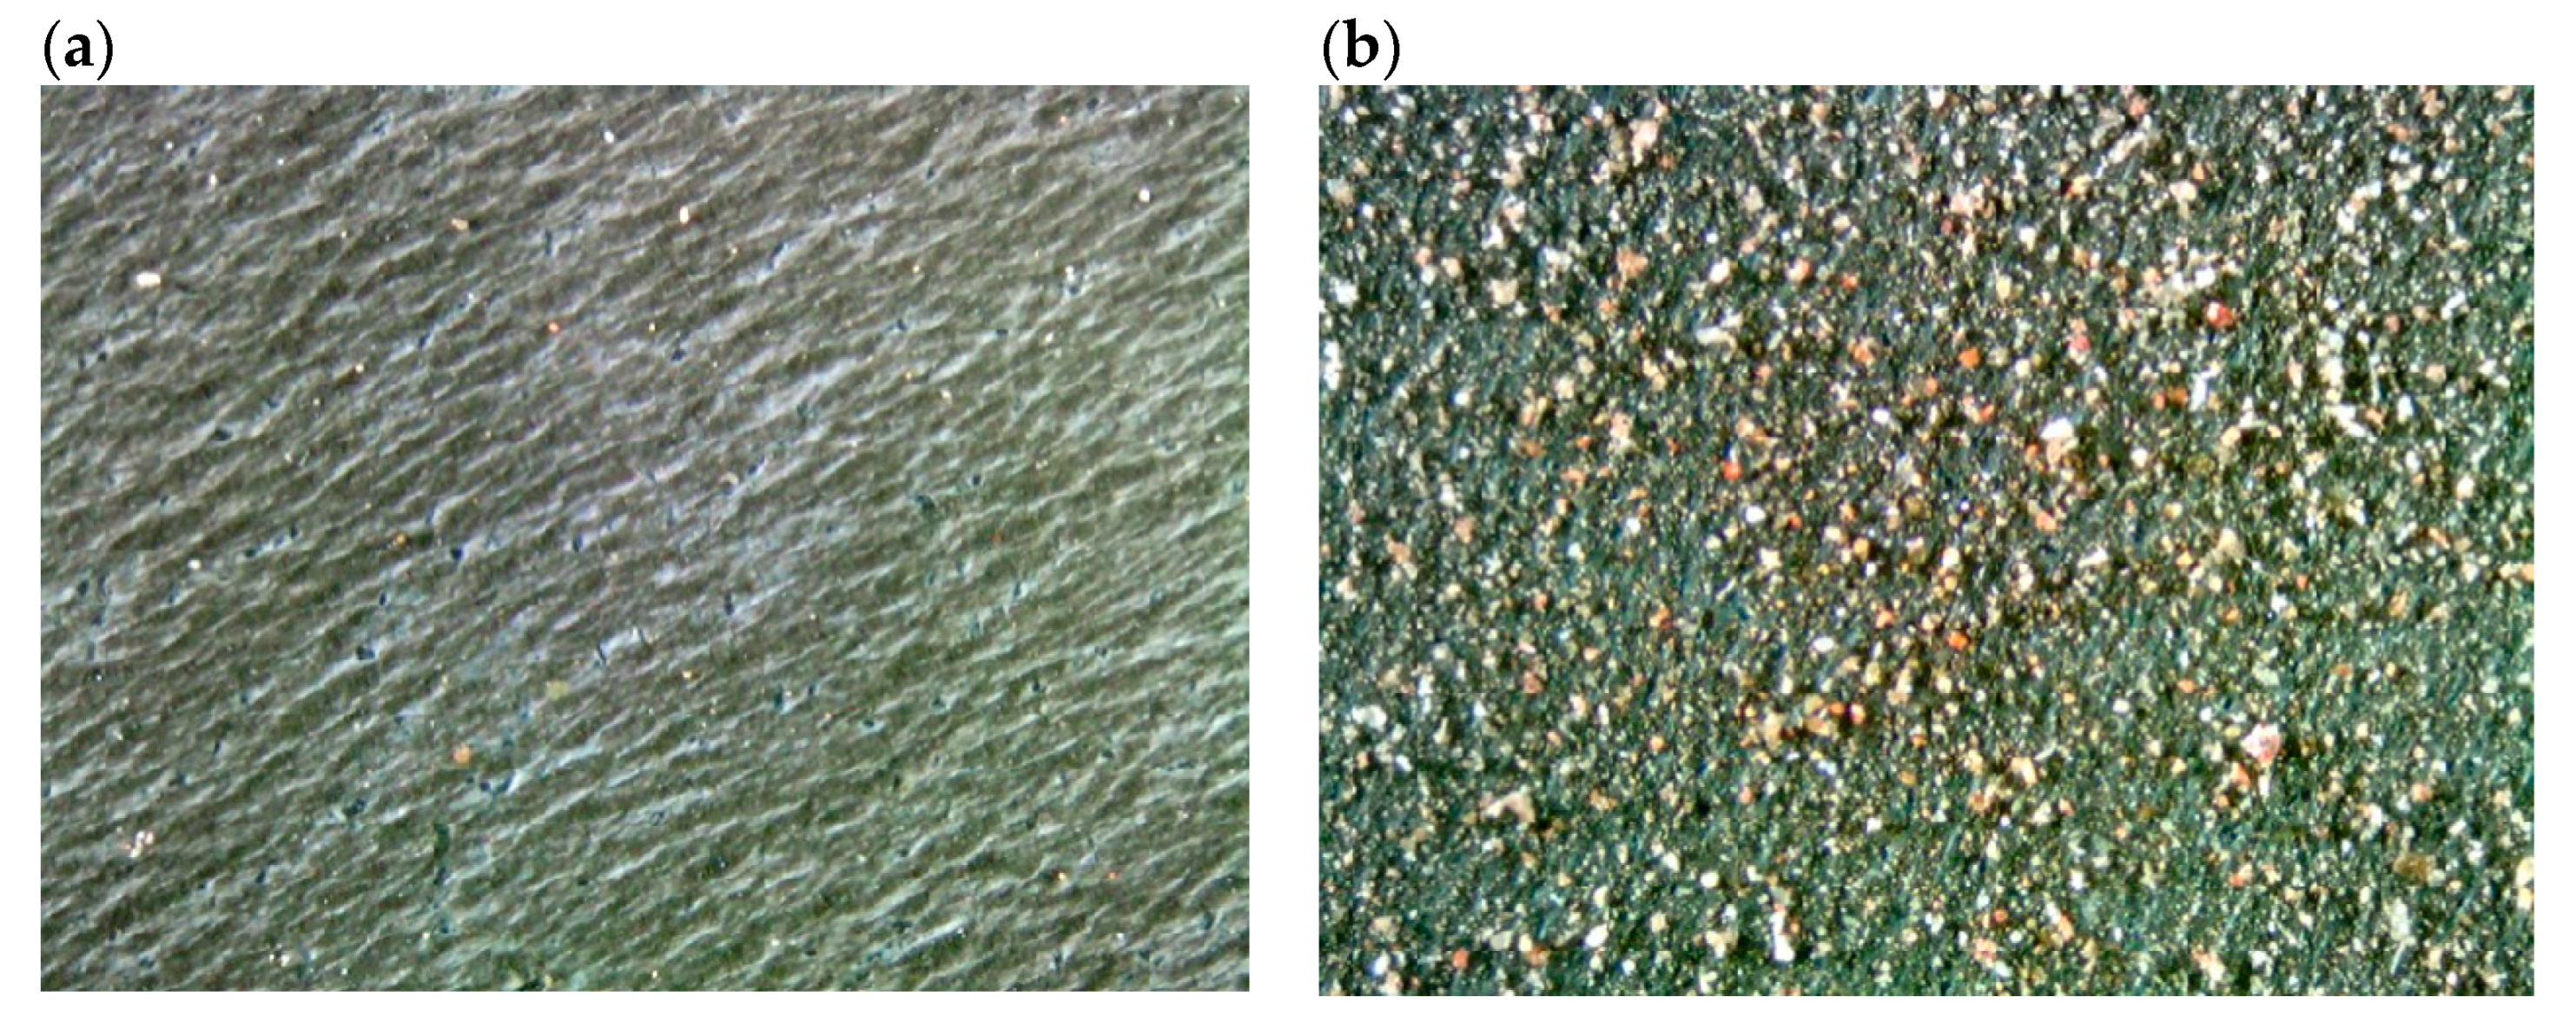
Photographs from the digital microscope show particles on both 25 and 37 mm filters that are larger than would be expected from the MicroPEM and UPAS pre-separators (Figure 4). The large red/orange and lighter colored particles appear to be superimposed over a gray background on the filters. The gray to black color continuum seen in the background on both filters is typical when collecting combustion-related PM2.5 particles, whereas the larger particles are atypical, and indicate breakthrough either from particle bounce or re-entrainment in the instruments’ pre-separators.
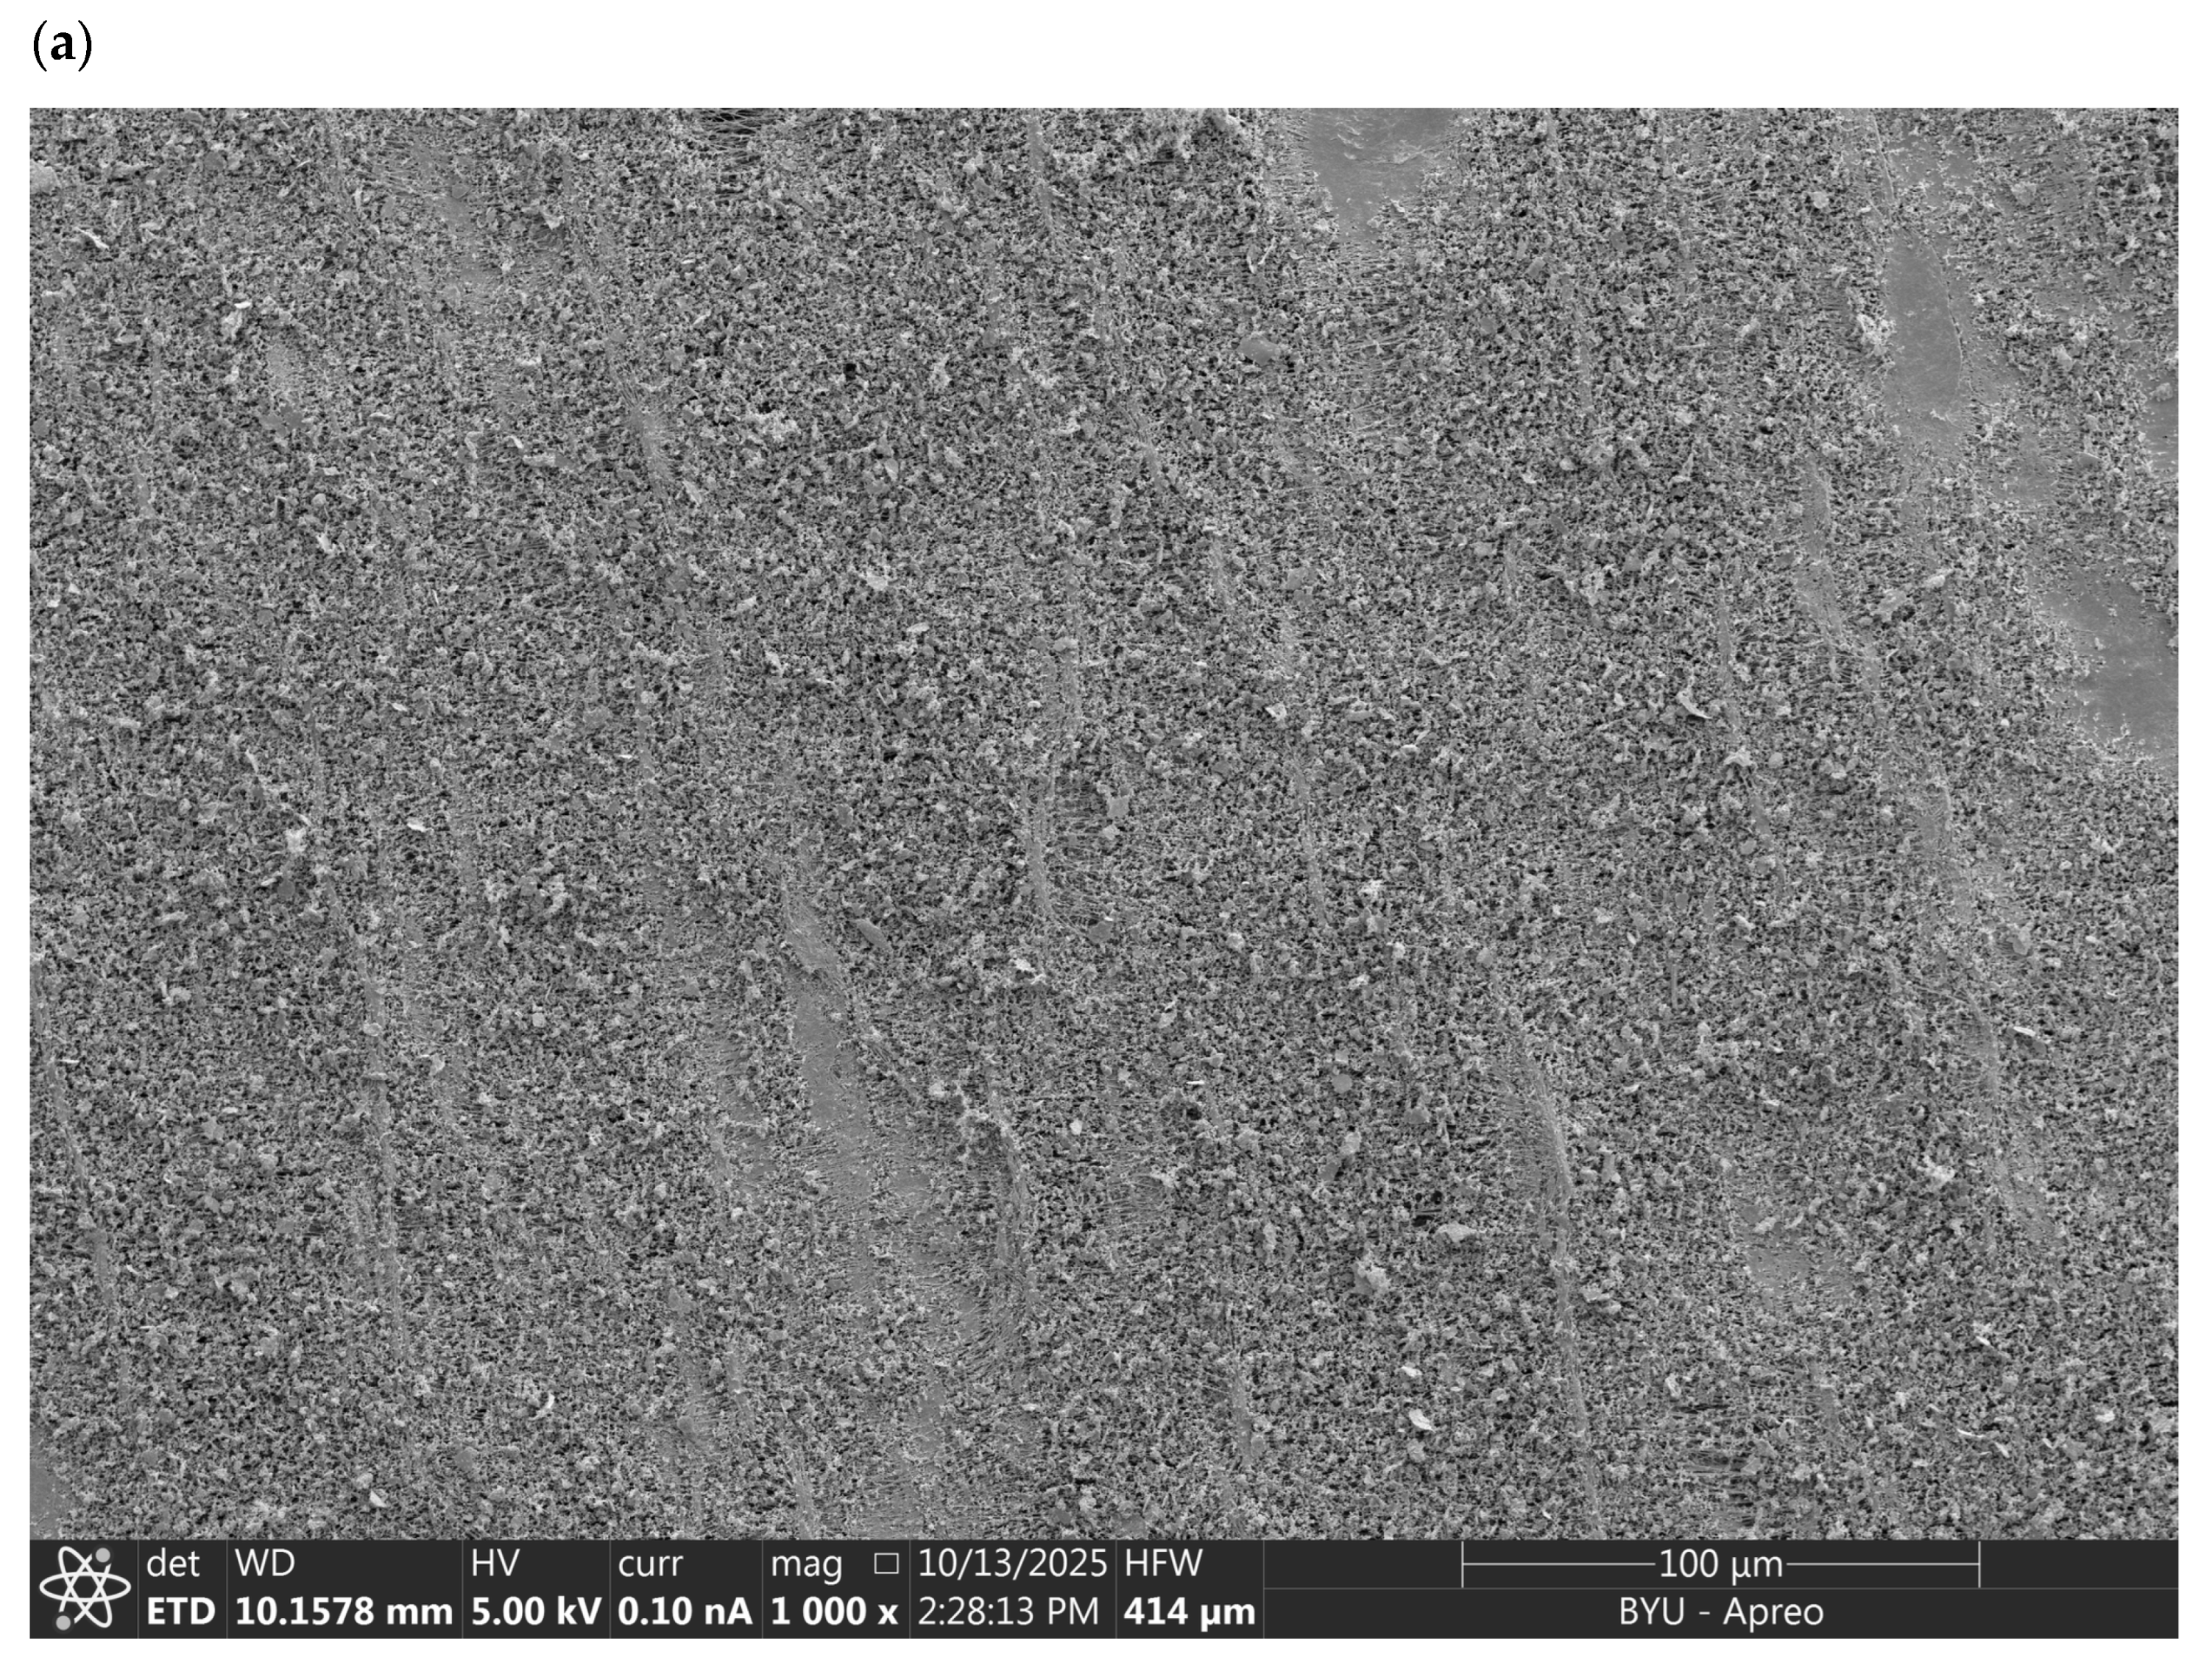
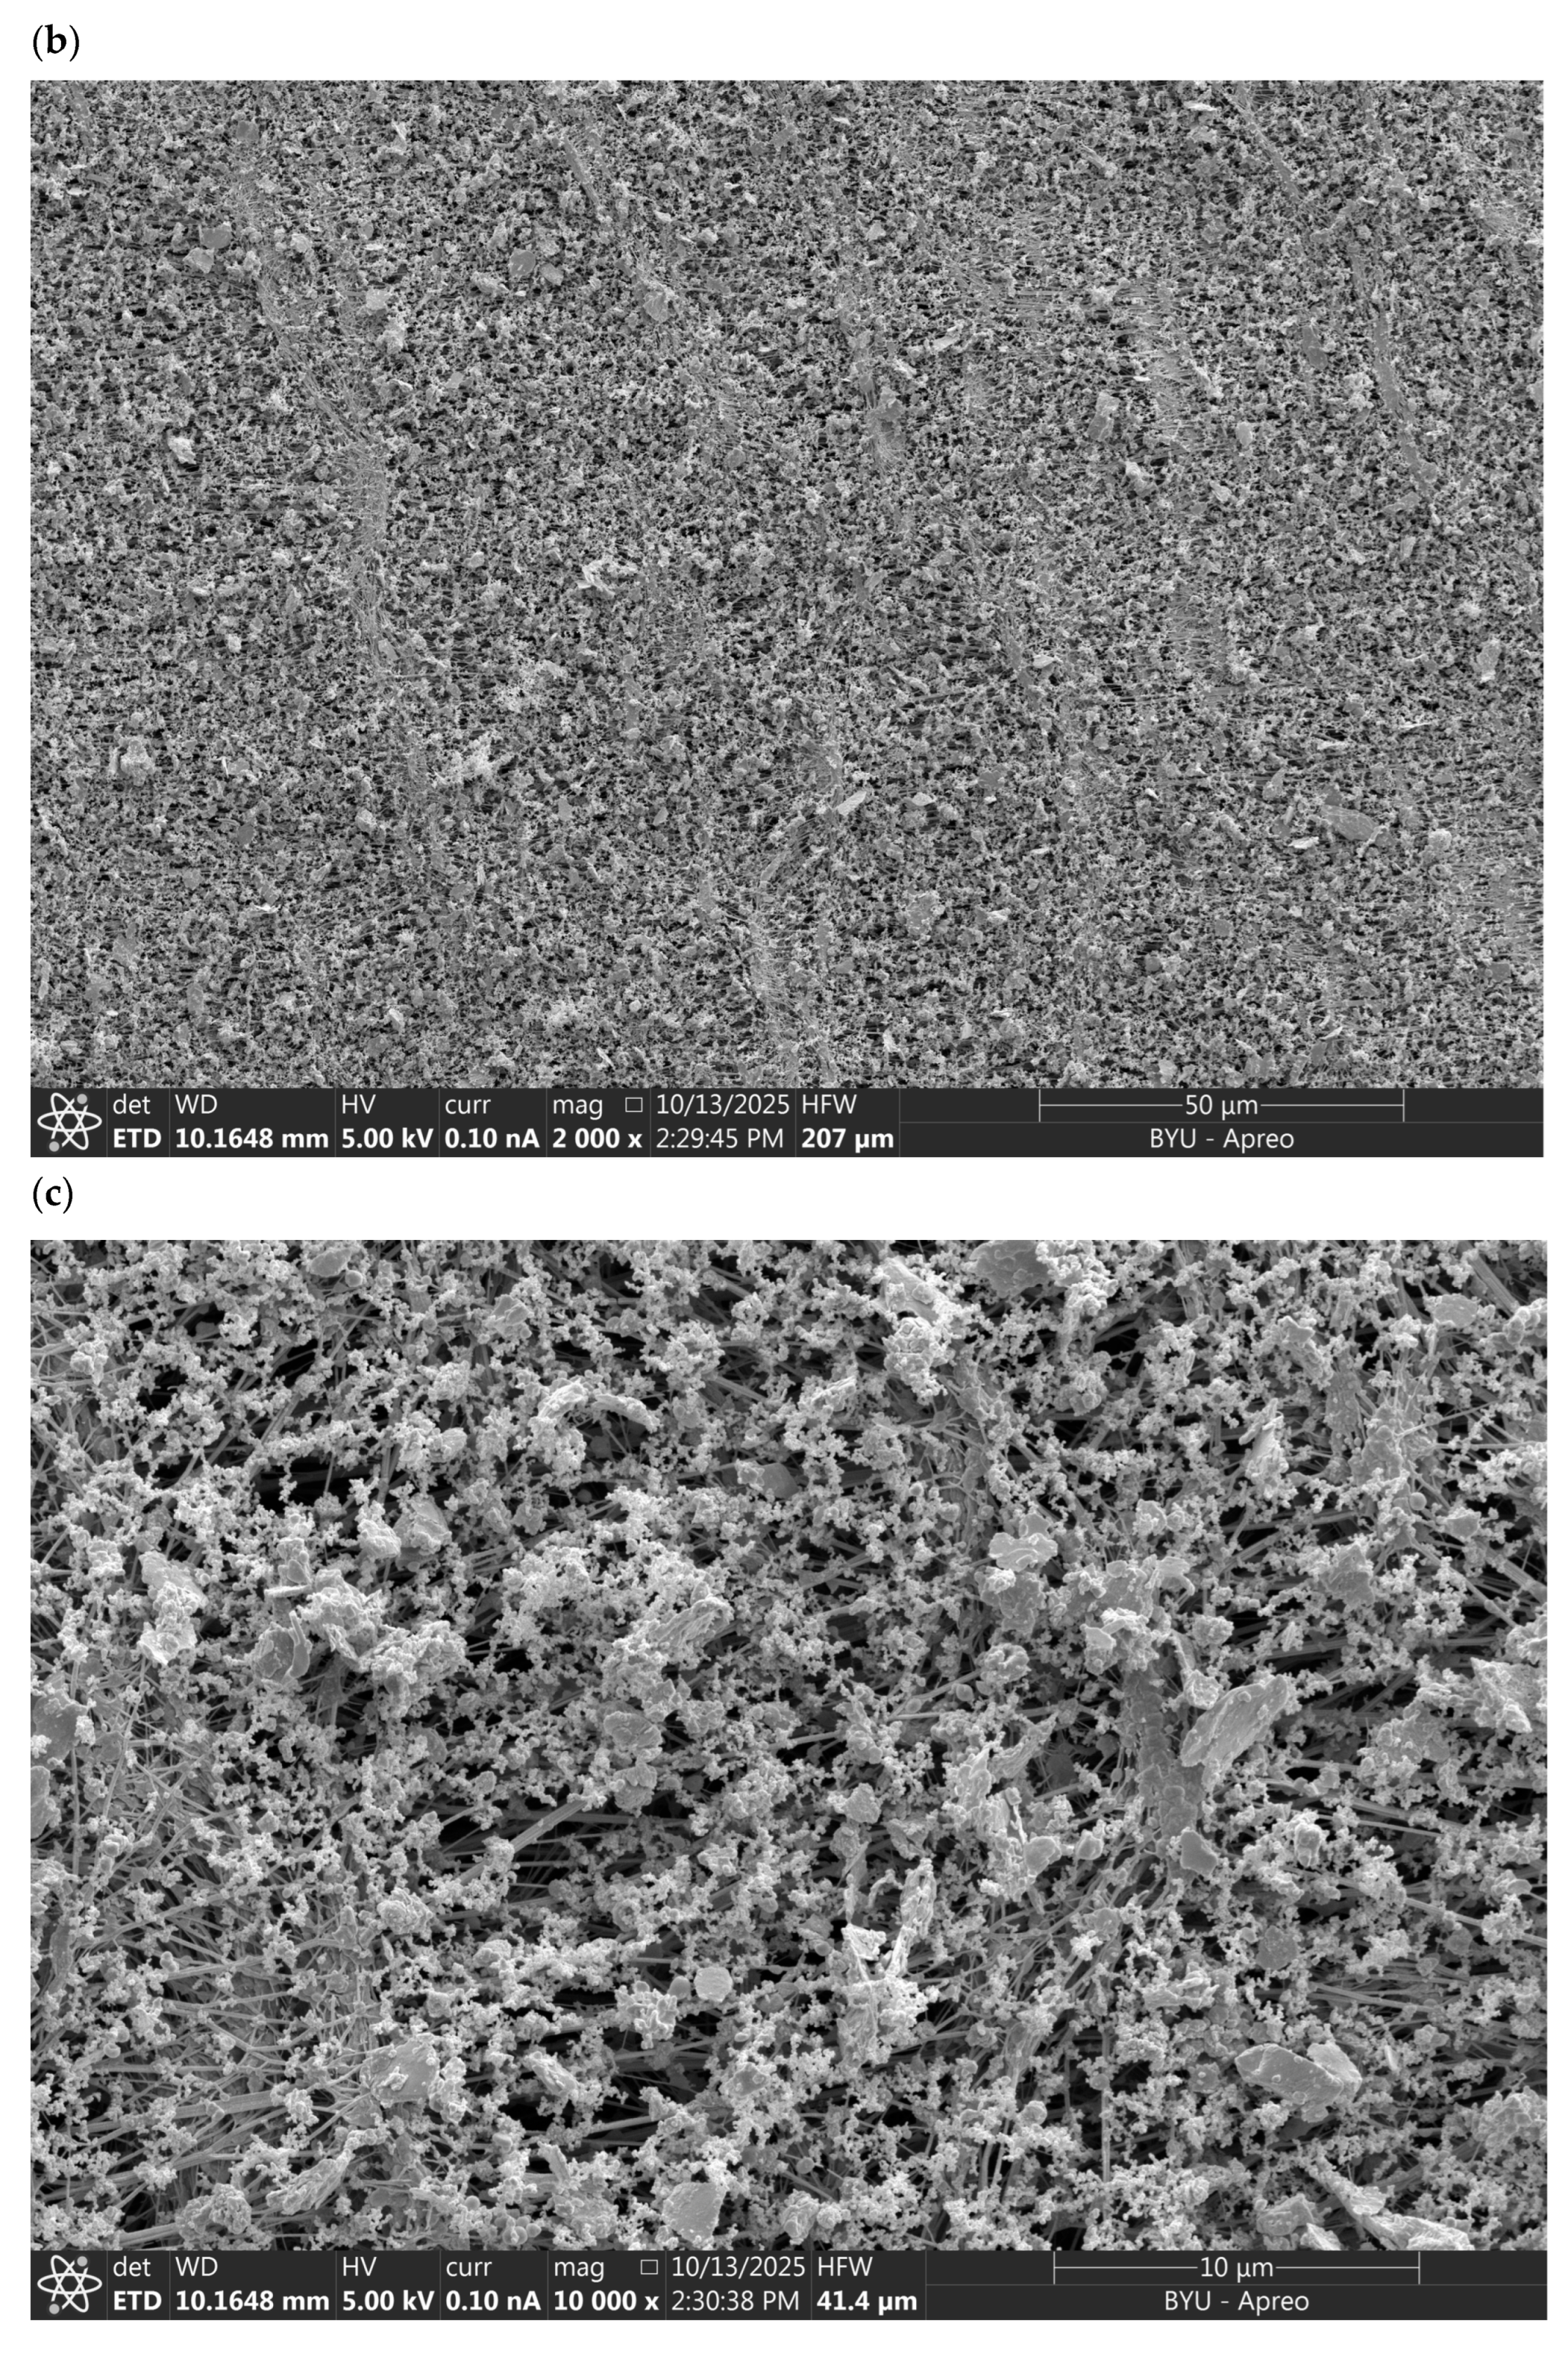
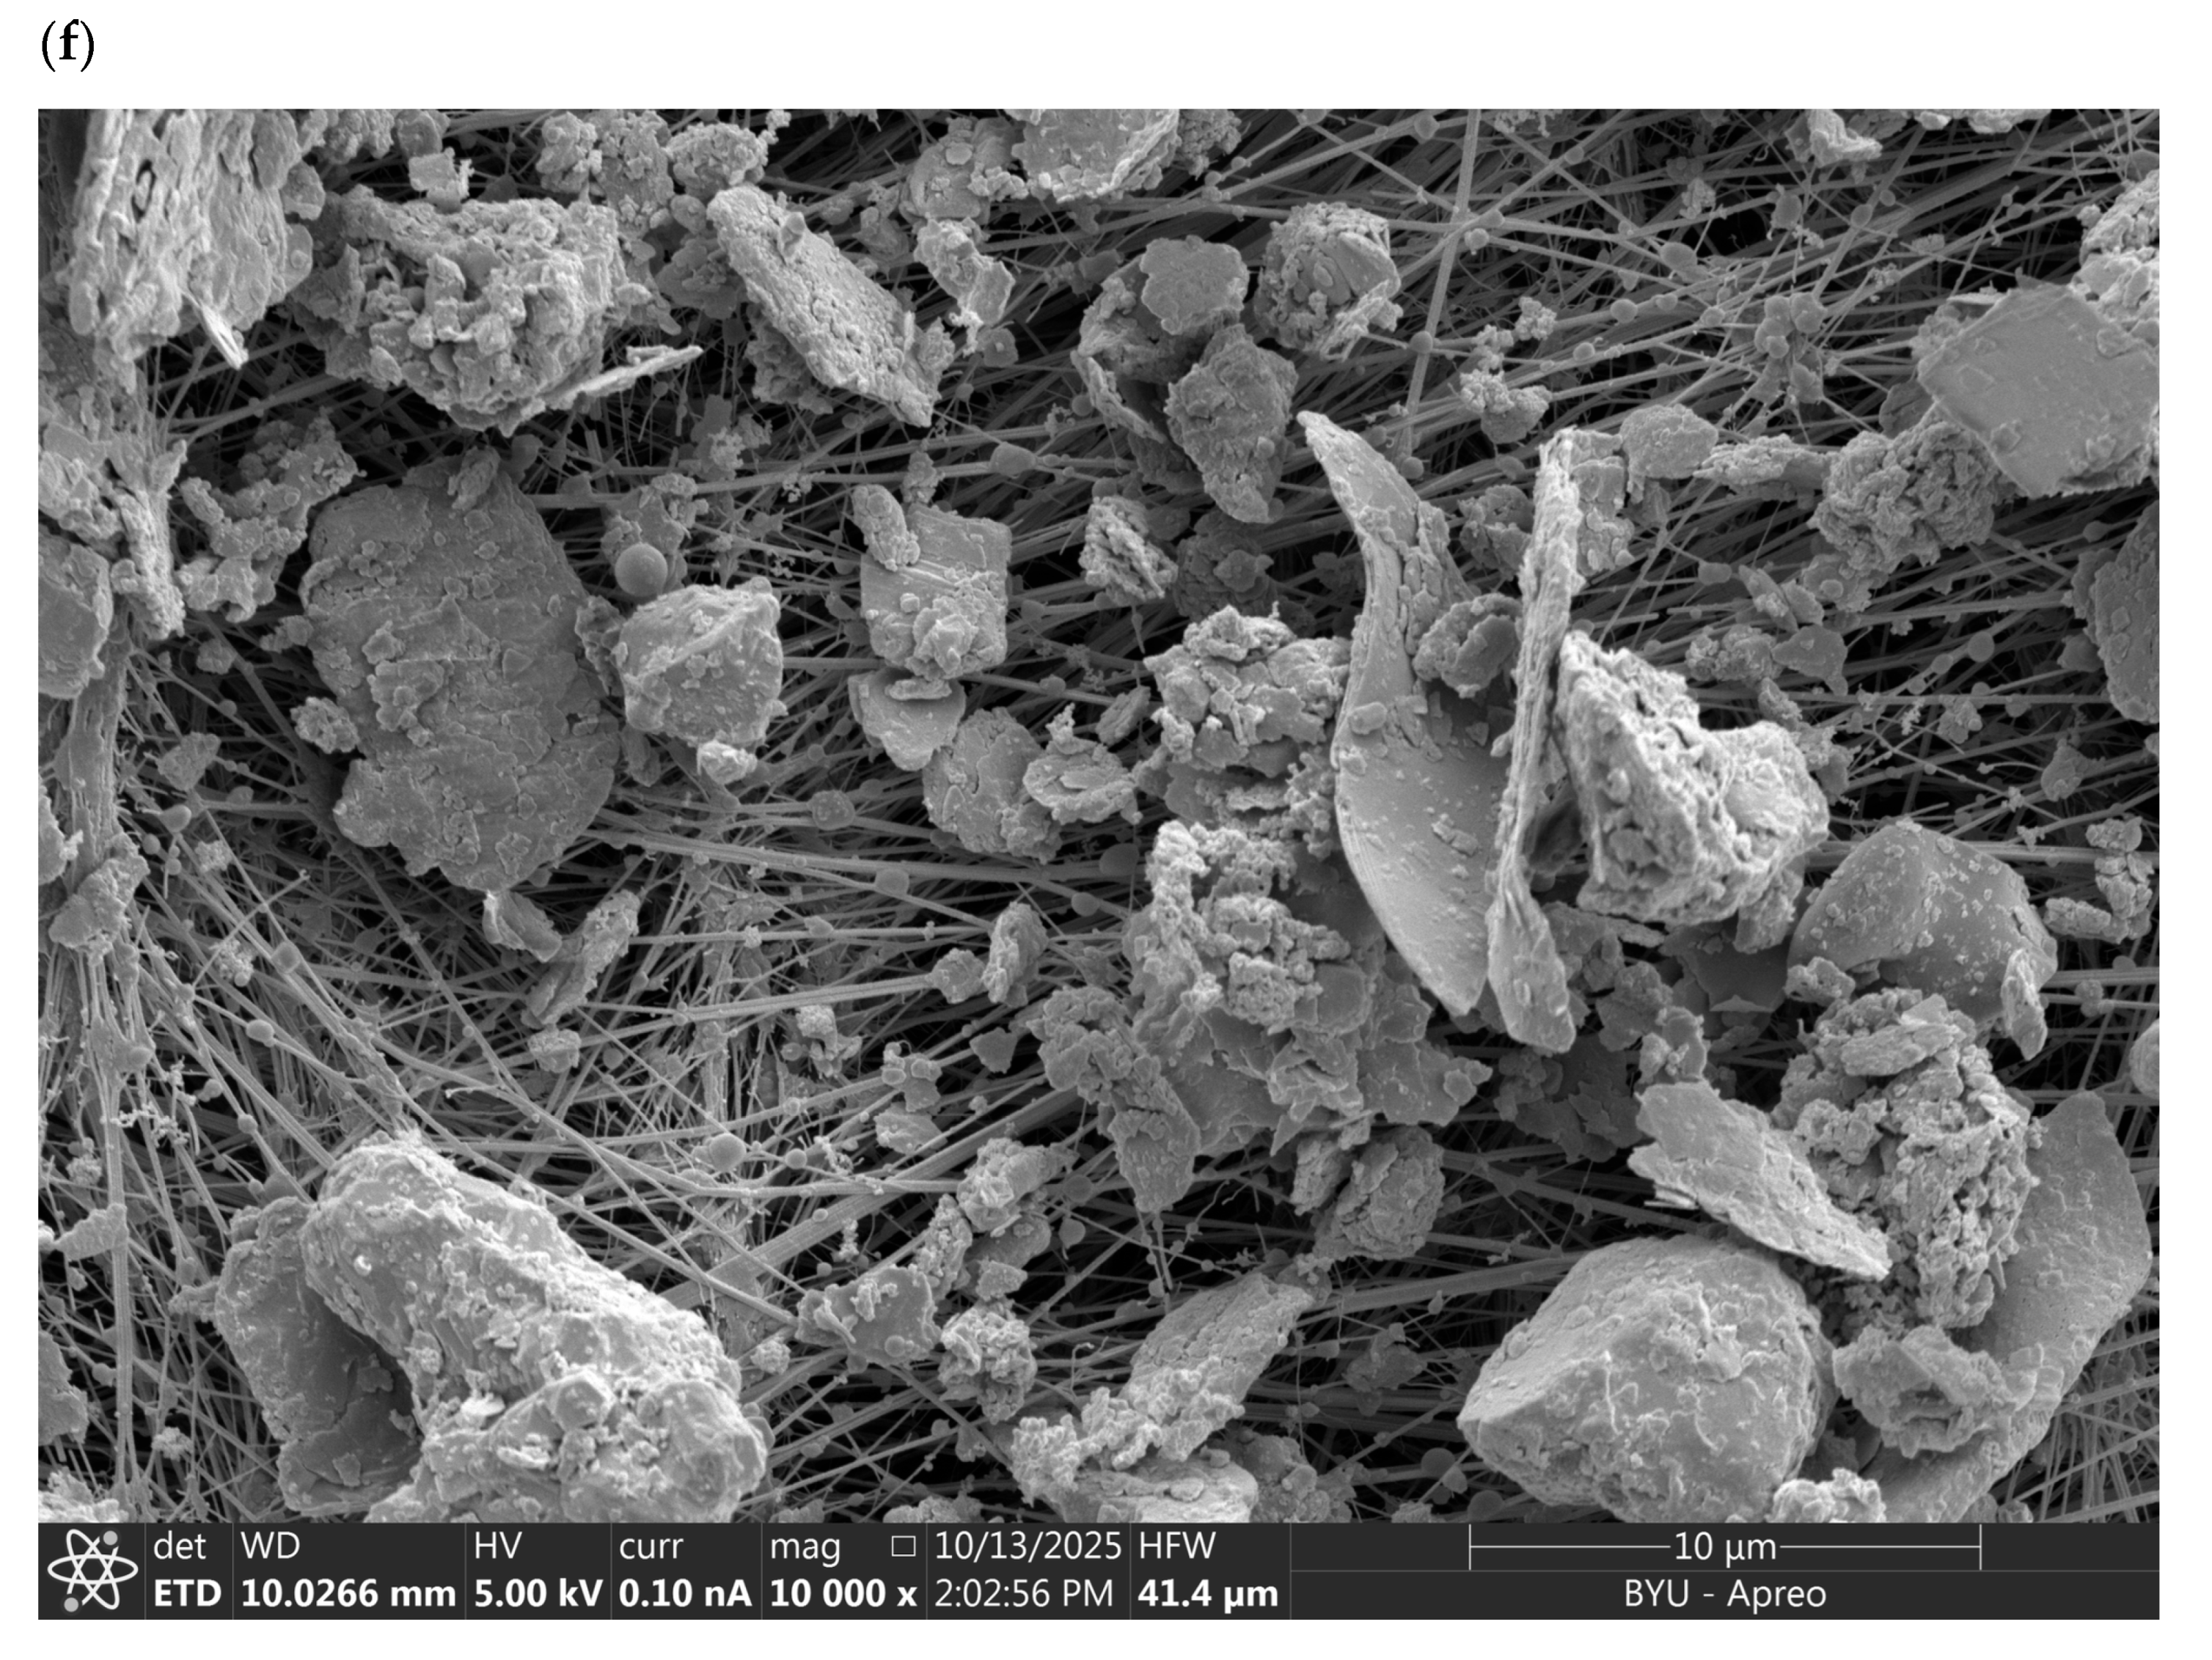
Electron micrographs show particles on both 25 and 37mm filters that are larger than expected from the instrument PM2.5 pre-separators (Figure 5). While both instruments had large particle breakthrough, the magnitude of breakthrough appeared to be more significant on 37 mm filters used in the UPAS instruments. Additional electron micrographs for 25 and 37 mm filters are included as Figures S1 and S2, respectively.

4. Discussion

In this field study the authors found low agreement between the MicroPEM and UPAS for ~24 h PBZ PM2.5 measurements based on gravimetric/AM and corrected nephelometer results. Our findings differ markedly from previous studies, which generally found high agreement for both the MicroPEM and UPAS when compared to reference instruments or other well-established WRAPs. For example, Fisher et al. (2019) found good agreement (r2 = 0.75) between the MicroPEM and MIE pDR-1500 (Thermo Scientific Inc., Waltham, MA, USA) for PBZ urban PM2.5 with an interquartile exposure range of 10.1–69.2 µg/m3 [28]. The MicroPEM also had strong agreement with reference instruments (r2 > 0.80) for measuring stationary urban PM2.5 concentrations ranging from 6 to 461 µg/m3 [29]. For the UPAS, previous validation studies generally found strong agreement with reference methods. In an indoor air quality study with mean PM2.5 concentrations ~100 µg/m3 in homes in two villages in India, the UPAS v1.0 gravimetric results were highly correlated (r = 0.91) with the Harvard Impactor [51] when co-located as stationary monitors [34]. The UPAS gravimetric results were highly correlated (Spearman’s rho = 0.91) with a traditional cyclone, pump, and filter method when used to measure personal exposures among female Honduran cooks who had exposures that averaged 50–60 µg/m3 [31]. Likewise, the UPAS v2.1 PLUS had high agreement with the Personal Modular Impactor (PMI) and pump system (SKC Incorporated, Fullerton, CA, USA) for 24 h stationary indoor air samples (Spearman’s rho = 0.92), although somewhat lower agreement between the instruments for personal samples (Spearman’s rho = 0.80) at relatively low mean PM2.5 concentrations between 10 and 30 µg/m3 among participants in California’s Central Valley [30]. In consideration of previous studies about these two instruments, our findings are an anomaly.
A possible explanation for the low agreement between the MicroPEM and UPAS PM2.5 concentrations measured in this study is the dusty environment, which may have overwhelmed the miniaturized pre-separators thereby causing breakthrough of larger particles. In many locations globally, brick making methods are labor intensive and dusty. For example, Myers et al. (1989), in a study of South African brick workers, reported mean total and respirable dust exposures exceeding 15.0 and 2.0 mg/m3, respectively [52]. In Nepal, studies found respirable dust exposure concentrations ranging from 0.05 to 16.0 mg/m3 depending on the job category [40,41,53], and total dust concentrations ranging from 0.1 to 49.9 mg/m3 [53]. The authors observed that both the UPAS and MicroPEM instruments were often heavily coated with dust after being worn by participants.
Digital microscope and electron micrograph images of both 25 and 37mm filters from the MicroPEM and UPAS, respectively, confirm that particle breakthrough occurred on some samples. The magnitude of particle breakthrough appeared to be greater on the 37mm filters used in the UPAS. However, the authors did not systematically image filters from this study, so additional research is needed to confirm the magnitude of breakthrough for both the MicroPEM and UPAS. Using high-resolution imaging, Chillrud et al. [54] found large particle agglomerates (10–200 µm) on UPAS filters when using the 1 L/min PM2.5 cyclone in a dusty environment in Ghana. In the same study, large particle breakthroughs were also found on filters from the Enhanced Children’s MicroPEM (ECM, RTI International, Research Triangle Park, NC, USA), which was developed as a lighter-weight, more compact version of the MicroPEM. In this study, the authors found that many of the MicroPEM impaction plates were heavily loaded. Heavy loading on the impaction plates may have allowed some larger particles to “bounce” back into the airstream, thus bypassing the impaction plates and subsequently landing on the filter. Overloading of the impaction plates can also block airflow through the impactor nozzle assembly, leading to premature instrument shut off. The authors did have several MicroPEMs that were not running when the participants returned them, suggesting the particle pre-separator assembly is not well suited for high dust environments.
Other factors that may have contributed to particle breakthroughs and low agreement between the MicroPEM and UPAS PM2.5 concentrations are the choice of whether to cycle the instruments and the choice of measurement cycle used. The authors did not cycle the MicroPEM, so it measured PM2.5 concentrations continuously. The authors used a 30 s measurement cycle (i.e., continuous measurement for 30 s, off for 30 s) for the UPAS. Perhaps both of these measurement cycles, continuous and 30 s, were too frequent to prevent large particle breakthrough and low agreement between the MicroPEM and UPAS PM2.5 concentrations. However, using a less frequent measurement cycle could have obscured or missed sudden changes in PM2.5 concentrations during short periods of time [55], which further underscores the difficulty of sampling in dusty environments.
Our findings have important implications for studies where the MicroPEM and UPAS have been used to measure PM2.5 concentrations in dusty environments. For example, a recent study by our team (2023) may have overestimated Nepalese brick workers’ PM2.5 exposures as measured by the MicroPEM [33]. The magnitude of overestimation, in the absence of a reference instrument, is unknown, but it is clear from the digital microscope photographs and electron micrographs included herein that some particle breakthrough occurs with the MicroPEM in dusty environments. Alli et al. (2021) reported that PM2.5 concentrations measured with the UPAS in Accra Ghana were approximately twice as high during the Harmattan season as during other times of the year [56]. During the dry, dusty Harmattan season, high levels of wind-blown dust may have overwhelmed the UPAS pre-separator leading to large particle breakthrough and an overestimation of PM2.5 levels. Particle breakthrough with these instruments may be particularly concerning if associations are being made between exposures and health outcomes, as overestimated exposures will obscure true dose–response relationships.
Traditional pump and cyclone or customized impaction-based methods [57] may be better suited for monitoring occupational PM2.5 exposures in high dust environments; however, these integrated sampling methods do not allow for analysis of exposure trends over time. WRAPs provide a useful research tool for understanding exposure trends, but they appear to be vulnerable to large-particle breakthrough when challenged by high airborne dust concentrations. Our findings suggest that advancements in wearable devices should focus on pre-separation of coarse-fraction and larger particles when using WRAPs to monitor exposures in high-dust environments. A 2-stage impactor is now available for the GEN2 UPAS [58,59]. The retrofit impactor assembly can be placed upstream of the cyclone for pre-separating larger particles in dusty environments. The authors recommend similar design features be considered for other WRAP makes and models, as well as additional research focused on understanding instrument limitations in dusty environments.
The authors also found an almost 10% difference in mean relative humidity measurements between the MicroPEM and UPAS instruments. The MicroPEM was the higher of the two. It is possible that differences in relative humidity measurements between the two instruments were partially due to placement of the instruments on study participants. The UPAS was always placed on the vest over the participants’ sternum, a few inches below the jugular notch. The MicroPEM was always placed in a pocket on the sampling vest on the participants’ right shoulder, approximately clavicle height. Thus, our measurements may be biased due to participants’ exhalation behaviors that may have favored the MicroPEM over the UPAS. Another possibility is that one of the instruments systematically experienced measurement drift, which is common in capacitance-based relative humidity sensors [60,61,62]. While the authors did calibrate air flow rates and nephelometer offsets before each use, the authors did not adjust slope and offset inputs for temperature and relative humidity on the MicroPEMs, and the UPAS instruments were new from the factory. This is important because, at levels greater than the deliquescence relative humidities of particulate constituents, nephelometers may experience enhanced light scattering due to hygroscopic particle enlargement. For common aerosols such as sodium chloride, ammonium sulfate, potassium sulfate, sea salt, and many organic compounds, the deliquescence relative humidities are >75% [63,64,65]. Thus, the authors do not think measurement drift, if indeed it occurred, was a major contributor to the differences we found between the UPAS and MicroPEM nephelometer readings. The AM relative humidity levels measured by the UPAS (<35%) and MicroPEM (<45%) are well below the 75% deliquescence relative humidity of common aerosols. Differences in relative humidity measurements between the two instruments may also have been due to the physical location of the humidity sensors inside the instruments. Factors such as airflow paths and internal temperature gradients can affect sensor measurements.
Our study is unique in that it compared the UPAS and MicroPEM instruments under relatively extreme occupational conditions with simultaneously high PM2.5 and dust exposures. Another unique feature of this study is that the authors compared gravimetric/AM and corrected nephelometer measurements. Most prior studies were limited to gravimetric comparisons. However, a limitation of this study was potential bias from the missing, corrected nephelometer data collected before the latest start time and after the earliest stop time among the MicroPEM and UPAS samples for each participant, the missing UPAS nephelometer PM2.5 concentrations between 21:00 and 04:00 local time each night for each participant, and the missing UPAS nephelometer PM2.5 concentrations each minute for the seven participants for which a 10 s measurement cycle was used. However, the authors used multiple imputation [66,67] and IPW [47,48] to account for this potential missing data bias in analyses. The AMs of the IPWs were not as close to 1.00 as the authors would have liked, but there were no extreme IPWs. The authors also considered other potential unconditional logistic regression models (e.g., with additional or different independent variables or using different versions of the independent variables) to calculate the conditional probabilities of not missing data in the corrected nephelometer data, but could not meaningfully improve the appropriateness of the IPWs.
The authors would have preferred to use geometric means (GM), 95% CI, and p-values calculated using linear and/or linear mixed regression models rather than medians, 95% CI, and p-values calculated using quantile regression models for the analyses of differences in MicroPEM and UPAS PM2.5 concentrations, temperature, and/or relative humidity that were not approximately normally distributed because the parametric methods used to estimate GMs, 95% CI, and p-values are typically more powerful (i.e., more likely to have smaller 95% CI and significant p-values) than the non-parametric methods used to estimate medians, 95% CI, and p-values when the data are approximately normally distributed [68]. However, the GM (and the natural logarithm, which is needed to calculate the GM via linear and/or linear mixed regression models) is not defined for negative values [68] and the differences in MicroPEM and UPAS PM2.5 concentrations, temperature, and relative humidity had many negative values. The CCC is preferred over the PCC and SCC for comparison studies such as ours because the PCC and SCC are measures of linear association rather than agreement [44]. However, the CCC (and PCC upon which the CCC is based) assume the data from the two instruments or measurement methods being compared are approximately normally distributed, slightly skewed, or from particular types of non-normal distributions [44,69]. The MicroPEM and UPAS PM2.5 concentrations and MicroPEM temperature were not approximately normally distributed, so the authors included results for the SCC, which does not assume approximately normal distributions [70], in addition to the PCC and CCC. The authors would have preferred to use the repeated measures CCC [71,72] for analyses of the stabilized inverse probability-weighted nephelometer data because the repeated measures CCC accounts for the correlation within subjects from the repeated measures, but the authors did not have enough computer memory to successfully use a published SAS macro, %rm_ccc [69], to calculate the repeated measures CCC. SAS does not allow use of IPW when calculating the SCC, so the authors did not include results for the SCC for analyses of the stabilized inverse probability-weighted nephelometer data.

5. Conclusions

Miniaturized, wearable PM2.5 monitors such as the MicroPEM and UPAS are valuable research tools for understanding personal air pollution exposures. There is strong support in the literature to suggest that, under commonly encountered indoor and outdoor pollution concentrations, these instruments generally provide reliable and accurate data. However, the authors found low agreement between the two instruments when they were used to monitor personal exposures in a dusty occupational environment. Our findings suggest that both instruments’ pre-separators experience large particle breakthroughs when challenged with high dust exposures. Furthermore, the magnitude of large particle breakthrough appears to be larger with the UPAS than the MicroPEM. Gravimetric and nephelometer mean concentrations were almost four times higher for the UPAS than the MicroPEM. Digital microscope and electron micrograph images support this finding. Compared with the MicroPEM, the UPAS filters had a greater number of visible coarse particles that had passed through the pre-separator, though both samplers showed some degree of large particle breakthrough. This study points to the need for advancements in wearable devices, particularly on pre-separation of larger particles. In the interim, while improvements are made to miniaturized pre-separators, the authors recommend using traditional pump and cyclone methods for measuring aerosol exposures in dusty occupational environments or in non-occupational environments where appreciable windblown dust may be present. This may be particularly important when making associations between exposures and health outcomes. Our study suggests that, when used in dusty environments, WRAPs may significantly overestimate exposures due to large particle breakthrough.

Supplementary Materials

The following supporting information can be downloaded at: https://www.mdpi.com/article/10.3390/atmos16111233/s1, Supplemental Methods; Table S1: Summary statistics for stabilized inverse probability weights used to account for potential missing data bias in an analysis of nephelometer personal breathing zone PM2.5 concentrations, temperature, and relative humidity measured using MicroPEM V3.2A (RTI International, Research Triangle Park, NC, USA) and UPAS v2.1 (Access Sensor Technologies, Fort Collins, CO, USA) instruments worn by brick kiln workers at two kilns in Bhaktapur, Nepal, February 2025. Figure S1: Electron micrographs of 25 mm filters. Panels a–c show a 25 mm filter from a MicroPEM worn by a female green brick molder at 1000x, 2000x, and 10,000x magnifications, respectively. Panels d–f show a 25 mm filter from a MicroPEM worn by male red/green brick carrier at 1000x, 2000x, and 10,000x magnifications, respectively. Figure S2: Electron micrographs of 37 mm filters. Panels a–c show a 37 mm filter from a UPAS worn by a male red/green brick carrier at 1000x, 2000x, and 10,000x magnifications, respectively. Panels d–f show a 37 mm filter from a UPAS worn by a male red/green brick molder at 1000x, 2000x, and 10,000x magnifications, respectively.

Author Contributions

Conceptualization, J.D.J., S.C.C., J.D.L., N.E.P., A.J.S., C.B.F., M.E.T., T.P.B., E.S.G., P.K.J., J.R.G. and J.D.B.; methodology, J.D.J., S.C.C., J.D.L., N.E.P., A.J.S., C.B.F., R.T.C., M.E.T., T.P.B., E.S.G., P.K.J., S.S., J.R.G. and J.D.B.; validation, J.D.J., R.T.C. and J.D.B.; formal analysis, J.D.J. and J.D.B.; investigation, J.D.J., S.C.C., J.D.L., N.E.P., A.J.S., C.B.F., M.E.T., T.P.B., E.S.G., P.K.J., S.S., J.R.G. and J.D.B.; resources, J.D.J., S.C.C., J.D.L., N.E.P., A.J.S., C.B.F., S.S., J.R.G. and J.D.B.; data curation, J.D.J. and J.D.B.; writing—original draft preparation, J.D.J., M.E.T., T.P.B., E.S.G., P.K.J. and J.D.B.; writing—review and editing, J.D.J., S.C.C., J.D.L., N.E.P., A.J.S., C.B.F., R.T.C., M.E.T., T.P.B., E.S.G., P.K.J., S.S., J.R.G. and J.D.B.; visualization, J.D.B.; supervision, J.D.J., S.C.C., J.D.L., N.E.P., A.J.S., C.B.F., S.S., J.R.G. and J.D.B.; project administration, J.D.J., S.S. and J.D.B.; funding acquisition, J.D.J. and J.D.B. All authors have read and agreed to the published version of the manuscript.

Funding

This research was funded by Brigham Young University’s College of Life Sciences through College Undergraduate Research Awards.

Institutional Review Board Statement

The study was conducted in accordance with the Declaration of Helsinki and approved by the Institutional Review Board of Brigham Young University (IRB2024-359) and by the Nepal Health Research Council (Proposal ID 603 2024).

Informed Consent Statement

Written informed consent was obtained from all subjects involved in the study.

Data Availability Statement

The data presented in this study are available upon request from the corresponding author.

Acknowledgments

We express our gratitude for the brick kiln workers and management personnel who generously gave their time and provided access for this study to occur. We also express our appreciation for Jagat Lama and his team with Independent Trekking Guides for their logistical support and friendship. This work could not have taken place without support from Brigham Young University’s Kennedy Center for International Studies. We acknowledge the BYU Electron Microscopy Facility, and Michael Standing specifically, for providing access to the equipment and expertise that allowed this project to be performed. We are also grateful for the expert photographs of our filters provided by Frank Weber of RTI, International.

Conflicts of Interest

Co-author Ryan C. Chartier works for RTI International, the company that manufactured the MicroPEM. The remaining authors declare that the research was conducted in the absence of any commercial or financial relationships that could be construed as a potential conflict of interest.

References

  1. Pope, C.A., III; Dockery, D.W. Health effects of fine particulate air pollution: Lines that connect. J. Air Waste Manag. Assoc. 2006, 56, 709–742. [Google Scholar] [CrossRef]
  2. Pope, C.A., III; Lefler, J.S.; Ezzati, M.; Higbee, J.D.; Marshall, J.D.; Kim, S.-Y.; Bechle, M.; Gilliat, K.S.; Vernon, S.E.; Robinson, A.L. Mortality risk and fine particulate air pollution in a large, representative cohort of US adults. Environ. Health Perspect. 2019, 127, 077007. [Google Scholar] [CrossRef]
  3. Feng, S.; Gao, D.; Liao, F.; Zhou, F.; Wang, X. The health effects of ambient PM2.5 and potential mechanisms. Ecotoxicol. Environ. Saf. 2016, 128, 67–74. [Google Scholar] [CrossRef]
  4. Sang, S.; Chu, C.; Zhang, T.; Chen, H.; Yang, X. The global burden of disease attributable to ambient fine particulate matter in 204 countries and territories, 1990–2019: A systematic analysis of the Global Burden of Disease Study 2019. Ecotoxicol. Environ. Saf. 2022, 238, 113588. [Google Scholar] [CrossRef]
  5. Bennitt, F.B.; Wozniak, S.; Causey, K.; Spearman, S.; Okereke, C.; Garcia, V.; Hashmeh, N.; Ashbaugh, C.; Abdelkader, A.; Abdoun, M. Global, regional, and national burden of household air pollution, 1990–2021: A systematic analysis for the Global Burden of Disease Study 2021. Lancet 2025, 405, 1167–1181. [Google Scholar] [CrossRef] [PubMed]
  6. Bennitt, F.; Wozniak, S.; Causey, K.; Burkart, K.; Brauer, M. Estimating disease burden attributable to household air pollution: New methods within the Global Burden of Disease Study. Lancet Glob. Health 2021, 9, S18. [Google Scholar] [CrossRef]
  7. Brauer, M.; Roth, G.A.; Aravkin, A.Y.; Zheng, P.; Abate, K.H.; Abate, Y.H.; Abbafati, C.; Abbasgholizadeh, R.; Abbasi, M.A.; Abbasian, M. Global burden and strength of evidence for 88 risk factors in 204 countries and 811 subnational locations, 1990–2021: A systematic analysis for the Global Burden of Disease Study 2021. Lancet 2024, 403, 2162–2203. [Google Scholar] [CrossRef] [PubMed]
  8. Blanc, P.D.; Annesi-Maesano, I.; Balmes, J.R.; Cummings, K.J.; Fishwick, D.; Miedinger, D.; Murgia, N.; Naidoo, R.N.; Reynolds, C.J.; Sigsgaard, T. The occupational burden of nonmalignant respiratory diseases. An official American Thoracic Society and European Respiratory Society statement. Am. J. Respir. Crit. Care Med. 2019, 199, 1312–1334. [Google Scholar] [CrossRef]
  9. Dons, E.; Panis, L.I.; Van Poppel, M.; Theunis, J.; Willems, H.; Torfs, R.; Wets, G. Impact of time–activity patterns on personal exposure to black carbon. Atmos. Environ. 2011, 45, 3594–3602. [Google Scholar] [CrossRef]
  10. Steinle, S.; Reis, S.; Sabel, C.E. Quantifying human exposure to air pollution—Moving from static monitoring to spatio-temporally resolved personal exposure assessment. Sci. Total Environ. 2013, 443, 184–193. [Google Scholar] [CrossRef]
  11. Cattaneo, A.; Taronna, M.; Consonni, D.; Angius, S.; Costamagna, P.; Cavallo, D.M. Personal exposure of traffic police officers to particulate matter, carbon monoxide, and benzene in the city of Milan, Italy. J. Occup. Environ. Hyg. 2010, 7, 342–351. [Google Scholar] [CrossRef]
  12. Maître, A.; Soulat, J.-M.; Masclet, P.; Stoklov, M.; Marquès, M.; De Gaudemaris, R. Exposure to carcinogenic air pollutants among policemen working close to traffic in an urban area. Scand. J. Work Environ. Health 2002, 28, 402–410. [Google Scholar] [CrossRef]
  13. Noomnual, S.; Shendell, D.G. Risk of adult street vendor exposure to traffic-related air pollution in Bangkok, Thailand. Hum. Ecol. Risk Assess. Int. J. 2017, 23, 340–349. [Google Scholar] [CrossRef]
  14. Hachem, M.; Saleh, N.; Paunescu, A.-C.; Momas, I.; Bensefa-Colas, L. Exposure to traffic air pollutants in taxicabs and acute adverse respiratory effects: A systematic review. Sci. Total Environ. 2019, 693, 133439. [Google Scholar] [CrossRef] [PubMed]
  15. Keim-Malpass, J.; Spears, C.R.; Quandt, S.A.; Arcury, T.A. Perceptions of housing conditions among migrant farmworkers and their families: Implications for health, safety and social policy. Rural Remote Health 2015, 15, 3076. [Google Scholar] [CrossRef] [PubMed]
  16. Caxaj, C.S.; Weiler, A.M.; Martyniuk, J. Housing conditions and health implications for migrant agricultural workers in Canada: A scoping review. Can. J. Nurs. Res. 2024, 56, 16–28. [Google Scholar] [CrossRef] [PubMed]
  17. Thygerson, S.M.; Beard, J.D.; House, M.J.; Smith, R.L.; Burbidge, H.C.; Andrus, K.N.; Weber, F.X.; Chartier, R.; Johnston, J.D. Air-Quality Assessment of On-Site Brick-Kiln Worker Housing in Bhaktapur, Nepal: Chemical Speciation of Indoor and Outdoor PM2.5 Pollution. Int. J. Environ. Res. Public Health 2019, 16, 4114. [Google Scholar] [CrossRef]
  18. Johnston, J.D.; Hawks, M.E.; Johnston, H.B.; Johnson, L.A.; Beard, J.D. Comparison of Liquefied Petroleum Gas Cookstoves and Wood Cooking Fires on PM2.5 Trends in Brick Workers’ Homes in Nepal. Int. J. Environ. Res. Public Health 2020, 17, 5681. [Google Scholar] [CrossRef]
  19. Watson, J.G.; Tropp, R.J.; Kohl, S.D.; Wang, X.; Chow, J.C. Filter processing and gravimetric analysis for suspended particulate matter samples. Aerosol Sci. Eng. 2017, 1, 93–105. [Google Scholar] [CrossRef]
  20. Vosburgh, D.J.; Cauda, E.; O’Shaughnessy, P.T.; Sheehan, M.J.; Park, J.H.; Anderson, K. Direct-reading instruments for aerosols: A review for occupational health and safety professionals part 1: Instruments and good practices. J. Occup. Environ. Hyg. 2022, 19, 696–705. [Google Scholar] [CrossRef]
  21. Baron, P.A. Aerosol Photometers for respirable dust measurements. NIOSH Man. Anal. Methods 1998, 1, 15. [Google Scholar]
  22. Braun, K.O. Exploring aerosol-specific calibration and performance of three direct-reading photometers. J. Occup. Environ. Hyg. 2025, 22, 443–452. [Google Scholar] [CrossRef] [PubMed]
  23. Anger, W.K.; Elliot, D.L.; Bodner, T.; Olson, R.; Rohlman, D.S.; Truxillo, D.M.; Kuehl, K.S.; Hammer, L.B.; Montgomery, D. Effectiveness of total worker health interventions. J. Occup. Health Psychol. 2015, 20, 226. [Google Scholar] [CrossRef]
  24. Volckens, J.; Quinn, C.; Leith, D.; Mehaffy, J.; Henry, C.S.; Miller-Lionberg, D. Development and evaluation of an ultrasonic personal aerosol sampler. Indoor Air 2017, 27, 409–416. [Google Scholar] [CrossRef]
  25. Burrowes, V.J.; Piedrahita, R.; Pillarisetti, A.; Underhill, L.J.; Fandiño-Del-Rio, M.; Johnson, M.; Kephart, J.L.; Hartinger, S.M.; Steenland, K.; Naeher, L. Comparison of next-generation portable pollution monitors to measure exposure to PM2.5 from household air pollution in Puno, Peru. Indoor Air 2020, 30, 445–458. [Google Scholar] [CrossRef]
  26. Cho, S.-H.; Chartier, R.T.; Mortimer, K.; Dherani, M.; Tafatatha, T. A personal particulate matter exposure monitor to support household air pollution exposure and health studies. In Proceedings of the 2016 IEEE Global Humanitarian Technology Conference (GHTC), Seattle, WA, USA, 13–16 October 2016; pp. 817–818. [Google Scholar]
  27. Vanker, A.; Barnett, W.; Chartier, R.; MacGinty, R.; Zar, H.J. Personal monitoring of fine particulate matter (PM2.5) exposure in mothers and young children in a South African birth cohort study—A pilot study. Atmos. Environ. 2023, 294, 119513. [Google Scholar] [CrossRef]
  28. Fisher, J.A.; Friesen, M.C.; Kim, S.; Locke, S.J.; Kefelegn, Y.; Wong, J.Y.; Albert, P.S.; Jones, R.R. Sources of variability in real-time monitoring data for fine particulate matter: Comparability of three wearable monitors in an urban setting. Environ. Sci. Technol. Lett. 2019, 6, 222–227. [Google Scholar] [CrossRef]
  29. Du, Y.; Wang, Q.; Sun, Q.; Zhang, T.; Li, T.; Yan, B. Assessment of PM2.5 monitoring using MicroPEM: A validation study in a city with elevated PM2.5 levels. Ecotoxicol. Environ. Saf. 2019, 171, 518–522. [Google Scholar] [CrossRef]
  30. Li, X.; Tryner, J.; Young, B.N.; Hernandez Ramirez, L.; Phillips, M.; WeMott, S.; Erlandson, G.; Kuiper, G.; Dean, D.; Martinez, N. Application and validation of a wearable monitor for assessing time-and location-resolved exposures to particulate matter in California’s Central Valley. Aerosol Sci. Technol. 2024, 59, 1272–1288. [Google Scholar] [CrossRef] [PubMed]
  31. Pillarisetti, A.; Carter, E.; Rajkumar, S.; Young, B.N.; Benka-Coker, M.L.; Peel, J.L.; Johnson, M.; Clark, M.L. Measuring personal exposure to fine particulate matter (PM2.5) among rural Honduran women: A field evaluation of the Ultrasonic Personal Aerosol Sampler (UPAS). Environ. Int. 2019, 123, 50–53. [Google Scholar] [CrossRef]
  32. Chartier, R.; Phillips, M.; Mosquin, P.; Elledge, M.; Bronstein, K.; Nandasena, S.; Thornburg, V.; Thornburg, J.; Rodes, C. A comparative study of human exposures to household air pollution from commonly used cookstoves in Sri Lanka. Indoor Air 2017, 27, 147–159. [Google Scholar] [CrossRef]
  33. Johnston, J.D.; Collingwood, S.C.; LeCheminant, J.D.; Peterson, N.E.; Reynolds, P.R.; Arroyo, J.A.; South, A.J.; Farnsworth, C.B.; Chartier, R.T.; Layton, L.N. Personal Exposure to Fine Particulate Air Pollution among Brick Workers in Nepal. Atmosphere 2023, 14, 1783. [Google Scholar] [CrossRef]
  34. Arku, R.E.; Birch, A.; Shupler, M.; Yusuf, S.; Hystad, P.; Brauer, M. Characterizing exposure to household air pollution within the Prospective Urban Rural Epidemiology (PURE) study. Environ. Int. 2018, 114, 307–317. [Google Scholar] [CrossRef] [PubMed]
  35. Thornburg, J.; Raynes-Greenow, C.; Abbott, M.; Cho, S.; Islam, S.; Tasnim, F.; Billah, S.; Alam, N. Pregnant Women’s Exposure to Household Air Pollution during a LPG Cookstove Intervention in Rural Bangladesh: The Value of Real-Time Data. Environ. Epidemiol. 2019, 3, 327–328. [Google Scholar]
  36. Jayarathne, T.; Stockwell, C.E.; Bhave, P.V.; Praveen, P.S.; Rathnayake, C.M.; Islam, M.R.; Panday, A.K.; Adhikari, S.; Maharjan, R.; Goetz, J.D. Nepal Ambient Monitoring and Source Testing Experiment (NAMaSTE): Emissions of particulate matter from wood and dung cooking fires, garbage and crop residue burning, brick kilns, and other sources. Atmos. Chem. Phys. Discuss. 2017, 18, 2259–2286. [Google Scholar] [CrossRef]
  37. Saud, B.; Paudel, G. The threat of ambient air pollution in Kathmandu, Nepal. J. Environ. Public Health 2018, 2018, 1504591. [Google Scholar] [CrossRef]
  38. Shakya, K.M.; Rupakheti, M.; Shahi, A.; Maskey, R.; Pradhan, B.; Panday, A.; Puppala, S.P.; Lawrence, M.; Peltier, R.E. Near-road sampling of PM 2. 5, BC, and fine-particle chemical components in Kathmandu Valley, Nepal. Atmos. Chem. Phys. 2017, 17, 6503–6516. [Google Scholar] [CrossRef]
  39. Islam, M.R.; Li, T.; Mahata, K.; Khanal, N.; Werden, B.; Giordano, M.R.; Praveen Puppala, S.; Dhital, N.B.; Gurung, A.; Saikawa, E. Wintertime Air Quality across the Kathmandu Valley, Nepal: Concentration, Composition, and Sources of Fine and Coarse Particulate Matter. ACS Earth Space Chem. 2022, 6, 2955–2971. [Google Scholar] [CrossRef]
  40. Nicolaou, L.; Rowell, E.; Gaviola, C.; Chandyo, R.K.; Sharma, A.K.; Shrestha, L.P.; Das, S.; Parker, D.L.; Thygerson, S.M.; Jacob, J. Personal exposures to air pollutants and respiratory health among brick kiln workers and household members. Environ. Res. 2025, 279, 121760. [Google Scholar] [CrossRef] [PubMed]
  41. Beard, J.D.; Collingwood, S.C.; LeCheminant, J.D.; Peterson, N.E.; Reynolds, P.R.; Arroyo, J.A.; South, A.J.; Farnsworth, C.B.; Fong, G.; Cisneros, T. Respirable dust and crystalline silica concentrations among workers at a brick kiln in Bhaktapur, Nepal. J. Occup. Environ. Hyg. 2024, 21, 247–258. [Google Scholar] [CrossRef]
  42. Rodes, C. Standard Operating Procedure MicroPEM v 3.2 A [Gates Foundation Version] Aerosol Exposure SOP M-300: Setup, Preparation, Calibration, Deployment. Data Process. Serv. 2013, 1–46. [Google Scholar]
  43. Access Sensor Technologies LLC. Ultrasonic Personal Air Sampler v2.1 and v2.1 PLUS User Guide. Firmware Versions 158 and Earlier. Revision 1.6; Access Sensor Technologies LLC: Fort Collins, CO, USA, 2025; Available online: https://www.dropbox.com/scl/fi/h7gr1875ugdoqtnbp5ly0/AST_UPAS-v2.1-and-UPAS-v2.1-PLUS_UserGuide_FirmwareRev157_20250810.pdf?rlkey=gwpqi4e8aksp6k8tzy1urr6lb&e=1&dl=0 (accessed on 20 October 2025).
  44. Lin, L.I.K. A concordance correlation coefficient to evaluate reproducibility. Biometrics 1989, 45, 255–268. [Google Scholar] [CrossRef]
  45. Altman, D.G.; Bland, J.M. Measurement in medicine: The analysis of method comparison studies. J. R. Stat. Soc. Ser. D Stat. 1983, 32, 307–317. [Google Scholar] [CrossRef]
  46. Bland, J.M.; Altman, D. Statistical methods for assessing agreement between two methods of clinical measurement. Lancet 1986, 327, 307–310. [Google Scholar] [CrossRef]
  47. Cole, S.R.; Hernán, M.A. Constructing inverse probability weights for marginal structural models. Am. J. Epidemiol. 2008, 168, 656–664. [Google Scholar] [CrossRef]
  48. Hernán, M.A.; Hernández-Díaz, S.; Robins, J.M. A structural approach to selection bias. Epidemiology 2004, 15, 615–625. [Google Scholar] [CrossRef] [PubMed]
  49. Hernán, M.Á.; Brumback, B.; Robins, J.M. Marginal structural models to estimate the causal effect of zidovudine on the survival of HIV-positive men. Epidemiology 2000, 11, 561–570. [Google Scholar] [CrossRef]
  50. Akaike, H. A new look at the statistical model identification. IEEE Trans. Autom. Control 1974, 19, 716–723. [Google Scholar] [CrossRef]
  51. Marple, V.A.; Rubow, K.L.; Turner, W.; Spengler, J.D. Low flow rate sharp cut impactors for indoor air sampling: Design and calibration. JAPCA 1987, 37, 1303–1307. [Google Scholar] [CrossRef] [PubMed]
  52. Myers, J.E.; Lewis, P.; Hofmeyr, W. Respiratory health of brickworkers in Cape Town, South Africa: Background, aims and dust exposure determinations. Scand. J. Work Environ. Health 1989, 15, 180–187. [Google Scholar] [CrossRef]
  53. Sanjel, S.; Khanal, S.N.; Thygerson, S.M.; Carter, W.S.; Johnston, J.D.; Joshi, S.K. Respiratory symptoms and illnesses related to the concentration of airborne particulate matter among brick kiln workers in Kathmandu valley, Nepal. Ann. Occup. Environ. Med. 2017, 29, 9. [Google Scholar] [CrossRef]
  54. Steve Chillrud, M.M.; Miller-Lionberg, D.; Sulemana, A.; Tryner, J.; Ross, J.; Seyram, K.; Tsotestsi, K.; Lee, A.; Jack, D.; Assante, K.P. Identification of large-PM breakthrough of PM2.5 inlets during personal filter sampling in Ghana, and testing of various multi-stage pre-cyclone impactor improvements. In Proceedings of the 2024 International Society of Exposure Science, Montreal, QC, Canada, 23 October 2024. [Google Scholar]
  55. Tryner, J. Choosing the Best Particulate Matter Sensor Duty Cycle for Your Measurement Application: Access Sensor Technologies. Available online: https://www.accsensors.com/blog/duty-cycling-pm-sensor (accessed on 13 September 2025).
  56. Alli, A.S.; Clark, S.N.; Hughes, A.; Nimo, J.; Bedford-Moses, J.; Baah, S.; Wang, J.; Vallarino, J.; Agyemang, E.; Barratt, B. Spatial-temporal patterns of ambient fine particulate matter (PM2.5) and black carbon (BC) pollution in Accra. Environ. Res. Lett. 2021, 16, 074013. [Google Scholar] [CrossRef]
  57. Alahmad, B.; Al-Hemoud, A.; Kang, C.-M.; Almarri, F.; Kommula, V.; Wolfson, J.M.; Bernstein, A.S.; Garshick, E.; Schwartz, J.; Koutrakis, P. A two-year assessment of particulate air pollution and sources in Kuwait. Environ. Pollut. 2021, 282, 117016. [Google Scholar] [CrossRef]
  58. Tryner, J. Introducing the Pre-Cyclone Impactor: Access Sensor Technologies, LLC. Available online: https://www.accsensors.com/blog/pre-cyclone-impactor (accessed on 20 August 2025).
  59. Daniel Miller-Lionberg, J.T.; Chillrud, S.; Mujtaba, M. Development and laboratory testing of novel multi-stage pre-cyclone impactor inserts for mitigating large-particle breakthrough during personal sampling with PM2.5 cyclones in challenging environments. In Proceedings of the 2024 International Society of Exposure Science, Montreal, QC, Canada, 23 October 2024. [Google Scholar]
  60. Visscher, G.; Kornet, J. Long-term tests of capacitive humidity sensors. Meas. Sci. Technol. 1994, 5, 1294. [Google Scholar] [CrossRef]
  61. Freitag, H.P. Calibration Procedures and Instrumental Accuracy Estimates of TAO Temperature, Relative Humidity and Radiation Measurements; Pacific Marine Environmental Laboratory: Seattle, WA, USA, 1994. [Google Scholar]
  62. Johnston, J.D.; Magnusson, B.M.; Eggett, D.; Mumford, K.; Collingwood, S.C.; Bernhardt, S.A. Sensor drift and predicted calibration intervals of handheld temperature and relative humidity meters under residential field-use conditions. J. Environ. Health 2014, 77, 22–29. [Google Scholar]
  63. Brooks, S.D.; Wise, M.E.; Cushing, M.; Tolbert, M.A. Deliquescence behavior of organic/ammonium sulfate aerosol. Geophys. Res. Lett. 2002, 29, 1917. [Google Scholar] [CrossRef]
  64. Freney, E.J.; Martin, S.T.; Buseck, P.R. Deliquescence and efflorescence of potassium salts relevant to biomass-burning aerosol particles. Aerosol Sci. Technol. 2009, 43, 799–807. [Google Scholar] [CrossRef]
  65. Biskos, G.; Malinowski, A.; Russell, L.; Buseck, P.; Martin, S. Nanosize effect on the deliquescence and the efflorescence of sodium chloride particles. Aerosol Sci. Technol. 2006, 40, 97–106. [Google Scholar] [CrossRef]
  66. Perkins, N.J.; Cole, S.R.; Harel, O.; Tchetgen Tchetgen, E.J.; Sun, B.; Mitchell, E.M.; Schisterman, E.F. Principled approaches to missing data in epidemiologic studies. Am. J. Epidemiol. 2018, 187, 568–575. [Google Scholar] [CrossRef]
  67. Harel, O.; Mitchell, E.M.; Perkins, N.J.; Cole, S.R.; Tchetgen Tchetgen, E.J.; Sun, B.; Schisterman, E.F. Multiple imputation for incomplete data in epidemiologic studies. Am. J. Epidemiol. 2018, 187, 576–584. [Google Scholar] [CrossRef]
  68. Mohr, D.L.; Wilson, W.J.; Freund, R.J. Statistical Methods, 4th ed.; Elsevier Inc.: Amsterdam, The Netherlands, 2022. [Google Scholar]
  69. Carrasco, J.L.; Phillips, B.R.; Puig-Martinez, J.; King, T.S.; Chinchilli, V.M. Estimation of the concordance correlation coefficient for repeated measures using SAS and R. Comput. Methods Programs Biomed. 2013, 109, 293–304. [Google Scholar] [CrossRef] [PubMed]
  70. Dawson, B.; Trapp, R.G. Basic and Clinical Biostatistics, 4th ed.; Lang Medical Books/McGraw-Hill: Columbus, OH, USA, 2004. [Google Scholar]
  71. King, T.S.; Chinchilli, V.M.; Carrasco, J.L. A repeated measures concordance correlation coefficient. Stat. Med. 2007, 26, 3095–3113. [Google Scholar] [CrossRef] [PubMed]
  72. Carrasco, J.L.; King, T.S.; Chinchilli, V.M. The concordance correlation coefficient for repeated measures estimated by variance components. J. Biopharm. Stat. 2009, 19, 90–105. [Google Scholar] [CrossRef] [PubMed]
Figure 1. Scatterplots of gravimetric/AM (within participants) a personal breathing zone (a) PM2.5 concentrations, (b) temperature, and (c) relative humidity measured using MicroPEM V3.2A (RTI International, Research Triangle Park, NC, USA) and UPAS v2.1 (Access Sensor Technologies, Fort Collins, CO, USA) instruments worn by brick kiln workers at two kilns in Bhaktapur, Nepal, February 2025. Abbreviations: AM, arithmetic mean; MicroPEM, Micro-Personal Exposure Monitor; PM2.5, particulate matter with an aerodynamic diameter < 2.5 µm; UPAS, Ultrasonic Personal Aerosol Sampler. a Equivalent to the PM2.5 concentrations calculated using gravimetric (i.e., filter-based) methods.
Atmosphere 16 01233 g001aAtmosphere 16 01233 g001b
Figure 2. Bland–Altman plots [45,46] of gravimetric/AM (within participants) a personal breathing zone (a) PM2.5 concentrations, (b) temperature, and (c) relative humidity measured using MicroPEM V3.2A (RTI International, Research Triangle Park, NC, USA) and UPAS v2.1 (Access Sensor Technologies, Fort Collins, CO, USA) instruments worn by brick kiln workers at two kilns in Bhaktapur, Nepal, February 2025. The blue line shows the AM PM2.5, temperature, or relative humidity differences b, whereas the red lines show the 95% limits of agreement. Abbreviations: AM, arithmetic mean; MicroPEM, Micro-Personal Exposure Monitor; PM2.5, particulate matter with an aerodynamic diameter < 2.5 µm; UPAS, Ultrasonic Personal Aerosol Sampler. a Equivalent to the PM2.5 concentrations calculated using gravimetric (i.e., filter-based) methods. b MicroPEM value subtract UPAS value (i.e., a positive value means the MicroPEM measurement was higher than the UPAS measurement, whereas a negative value means the MicroPEM measurement was lower than the UPAS measurement).
Atmosphere 16 01233 g002aAtmosphere 16 01233 g002b
Figure 3. Line graphs of the AMs (between participants) of the stabilized inverse-probability-weighted a, b, c nephelometer personal breathing zone (a) PM2.5 concentrations, (b) temperature, and (c) relative humidity over time measured using MicroPEM V3.2A (RTI International, Research Triangle Park, NC, USA) and UPAS v2.1 (Access Sensor Technologies, Fort Collins, CO, USA) instruments worn by brick kiln workers at two kilns in Bhaktapur, Nepal, February 2025. The blue line shows the AM values from the MicroPEM instruments, whereas the red line shows the AM values from the UPAS instruments. Abbreviations: AM, arithmetic mean; MicroPEM, Micro-Personal Exposure Monitor; PM2.5, particulate matter with an aerodynamic diameter < 2.5 µm; UPAS, Ultrasonic Personal Aerosol Sampler. a Stabilized inverse probability weights for not missing data in PM2.5 difference were calculated via an intercept-only unconditional logistic regression model and a multivariable unconditional logistic regression model conditional on UPAS temperature (linear term) and UPAS relative humidity (linear term). b Stabilized inverse probability weights for not missing data in temperature difference were calculated via an intercept-only unconditional logistic regression model and a simple unconditional logistic regression model conditional on UPAS relative humidity (linear term). c Stabilized inverse probability weights for not missing data in relative humidity difference were calculated via an intercept-only unconditional logistic regression model and a simple unconditional logistic regression model conditional on UPAS temperature (centered [at the mean: 24.25 °C], linear and quadratic terms).
Atmosphere 16 01233 g003aAtmosphere 16 01233 g003b
Figure 4. Digital microscope images showing large particle breakthrough of (a) 25 mm filter from a MicroPEM worn by male green brick molder and (b) 37 mm filter from UPAS worn by red and green brick carrier. Photographs by Frank X. Weber, RTI, International.
Atmosphere 16 01233 g004
Figure 5. Electron micrographs of 25 and 37mm filters. Panels (ac) show particles on a 25 mm filter from a MicroPEM worn by a male red/green brick carrier at 1000x 2000x, and 10,000x magnifications, respectively. Panels (df) show particles on a 37 mm filter from UPAS worn by a male red/green brick carrier at 1000x, 2000x, and 10,000x magnifications, respectively. Electron micrographs by Michael Standing, Brigham Young University Electron Microscope Facility.
Atmosphere 16 01233 g005aAtmosphere 16 01233 g005bAtmosphere 16 01233 g005cAtmosphere 16 01233 g005d
Table 1. Summary statistics for gravimetric/AM (within participants) a personal breathing zone PM2.5 concentrations, temperature, and relative humidity measured using MicroPEM V3.2A (RTI International, Research Triangle Park, NC, USA) and UPAS v2.1 (Access Sensor Technologies, Fort Collins, CO, USA) instruments worn by brick kiln workers at two kilns in Bhaktapur, Nepal, February 2025.
VariableMissing, nNot Missing, nAMSDMinQ1MedianQ3Max
MicroPEM PM2.5, µg/m3588429.48885.8589.29145.66207.06361.907258.41
UPAS PM2.5, µg/m33901636.882251.73130.21420.66737.741820.6414,324.03
PM2.5 difference b, µg/m3885−1199.142026.12−14,121.76−1305.74−553.35227.76472.94
MicroPEM temperature, °C29125.513.9719.9422.9124.8626.7742.68
UPAS temperature, °C29124.142.2318.4922.4624.0025.6329.51
Temperature difference b, °C4891.283.63−4.27−0.870.392.3919.86
MicroPEM relative humidity, %29143.678.7121.4837.8443.2950.4864.43
UPAS relative humidity, %29134.235.0024.7130.6233.9937.8846.46
Relative humidity difference b, %4899.696.87−18.296.8710.0713.8933.40
Abbreviations: AM, arithmetic mean; Q1, first quartile; Max, maximum; MicroPEM, Micro-Personal Exposure Monitor; Min, minimum; PM2.5, particulate matter with an aerodynamic diameter < 2.5 µm; SD, standard deviation; Q3, third quartile; UPAS, Ultrasonic Personal Aerosol Sampler. a Equivalent to the PM2.5 concentrations calculated using gravimetric (i.e., filter-based) methods. b MicroPEM value subtract UPAS value (i.e., a positive value means the MicroPEM measurement was higher than the UPAS measurement, whereas a negative value means the MicroPEM measurement was lower than the UPAS measurement).
Table 2. Differences in gravimetric/AM (within participants) a personal breathing zone PM2.5 concentrations, temperature, and relative humidity measured using MicroPEM V3.2A (RTI International, Research Triangle Park, NC, USA) and UPAS v2.1 (Access Sensor Technologies, Fort Collins, CO, USA) instruments worn by brick kiln workers at two kilns in Bhaktapur, Nepal, February 2025.
VariableAM b95% CI bp-Value bMedian c95% CI cp-Value cPCCSCCCCC
PM2.5 difference d, µg/m3−1199.14−1636.16, −762.11<0.0001−553.35−764.76, −341.94<0.00010.460.340.26
Temperature difference d, °C1.280.52, 2.050.0010.39−0.35, 1.130.300.440.620.34
Relative humidity difference d, %9.698.24, 11.14<0.000110.078.60, 11.53<0.00010.620.660.28
Abbreviations: AM, arithmetic mean; CCC, concordance correlation coefficient; CI, confidence interval; MicroPEM, Micro-Personal Exposure Monitor; PM2.5, particulate matter with an aerodynamic diameter < 2.5 µm; PCC, Pearson’s correlation coefficient; SCC, Spearman’s correlation coefficient; UPAS, Ultrasonic Personal Aerosol Sampler. a Equivalent to the PM2.5 concentrations calculated using gravimetric (i.e., filter-based) methods. b Estimated via an intercept-only linear regression model that used the original values as the outcome. c Estimated via an intercept-only quantile regression model that used the original values as the outcome; the sparsity method was used to calculate the 95% CI. d MicroPEM value subtract UPAS value (i.e., a positive value means the MicroPEM measurement was higher than the UPAS measurement, whereas a negative value means the MicroPEM measurement was lower than the UPAS measurement).
Table 3. Summary statistics for stabilized inverse probability-weighted a, b, c nephelometer personal breathing zone PM2.5 concentrations, temperature, and relative humidity measured using MicroPEM V3.2A (RTI International, Research Triangle Park, NC, USA) and UPAS v2.1 (Access Sensor Technologies, Fort Collins, CO, USA) instruments worn by brick kiln workers at two kilns in Bhaktapur, Nepal, February 2025.
VariableMissing, nNot Missing, nAMSDMinQ1MedianQ3Max
MicroPEM PM2.5 a, µg/m331,498207,763382.141706.200.0093.74169.19298.7276,672.26
UPAS PM2.5 a, µg/m391,836147,4251428.104734.230.00275.00594.081276.00418,945.51
PM2.5 difference a, d, µg/m3113,395125,866−1045.964147.93−414,927.81−978.91−390.27−106.3337,731.66
MicroPEM temperature b, °C213,22926,03225.035.5112.3021.0024.3028.6066.60
UPAS temperature b, °C224,40814,85324.385.269.4520.3323.8228.1043.95
Temperature difference b, d, °C199,61639,6450.653.37−11.13−1.220.322.0830.81
MicroPEM relative humidity c, %213,26625,99544.9612.388.3735.5344.7053.6399.77
UPAS relative humidity c, %224,40814,85334.179.717.8226.7034.3041.5572.18
Relative humidity difference c, d, %199,63239,62910.797.05−22.056.9910.4414.8563.18
Abbreviations: AM, arithmetic mean; Q1, first quartile; Max, maximum; MicroPEM, Micro-Personal Exposure Monitor; Min, minimum; PM2.5, particulate matter with an aerodynamic diameter < 2.5 µm; SD, standard deviation; Q3, third quartile; UPAS, Ultrasonic Personal Aerosol Sampler. a Stabilized inverse probability weights for not missing data in PM2.5 difference were calculated via an intercept-only unconditional logistic regression model and a multivariable unconditional logistic regression model conditional on UPAS temperature (linear term) and UPAS relative humidity (linear term). b Stabilized inverse probability weights for not missing data in temperature difference were calculated via an intercept-only unconditional logistic regression model and a simple unconditional logistic regression model conditional on UPAS relative humidity (linear term). c Stabilized inverse probability weights for not missing data in relative humidity difference were calculated via an intercept-only unconditional logistic regression model and a simple unconditional logistic regression model conditional on UPAS temperature (centered [at the mean: 24.25 °C], linear and quadratic terms). d MicroPEM value subtract UPAS value (i.e., a positive value means the MicroPEM measurement was higher than the UPAS measurement, whereas a negative value means the MicroPEM measurement was lower than the UPAS measurement).
Table 4. Differences in stabilized inverse probability-weighted a, b, c nephelometer personal breathing zone PM2.5 concentrations, temperature, and relative humidity measured using MicroPEM V3.2A (RTI International, Research Triangle Park, NC, USA) and UPAS v2.1 (Access Sensor Technologies, Fort Collins, CO, USA) instruments worn by brick kiln workers at two kilns in Bhaktapur, Nepal, February 2025.
VariableAM d95% CI dp-Value dPCCCCC
PM2.5 difference a, e, µg/m3−1205.60−1633.78, −777.42<0.00010.500.31
Temperature difference b, e, °C3.522.72, 4.33<0.00010.810.80
Relative humidity difference c, e, %9.898.58, 11.20<0.00010.820.54
Abbreviations: AM, arithmetic mean; CCC, concordance correlation coefficient; CI, confidence interval; ARMA(1,1), first order autoregressive moving average; MicroPEM, Micro-Personal Exposure Monitor; PM2.5, particulate matter with an aerodynamic diameter < 2.5 µm; PCC, Pearson’s correlation coefficient; UPAS, Ultrasonic Personal Aerosol Sampler. a Stabilized inverse probability weights for not missing data in PM2.5 difference were calculated via an intercept-only unconditional logistic regression model and a multivariable unconditional logistic regression model conditional on UPAS temperature (linear term) and UPAS relative humidity (linear term). b Stabilized inverse probability weights for not missing data in temperature difference were calculated via an intercept-only unconditional logistic regression model and a simple unconditional logistic regression model conditional on UPAS relative humidity (linear term). c Stabilized inverse probability weights for not missing data in relative humidity difference were calculated via an intercept-only unconditional logistic regression model and a simple unconditional logistic regression model conditional on UPAS temperature (centered [at the mean: 24.25 °C], linear and quadratic terms). d Estimated via a stabilized inverse probability-weighted a, b, c, intercept-only linear mixed regression model that used the original values as the outcome, random intercepts for each participant with an unstructured covariance matrix, brick kiln workers as the subjects about which we made repeated measurements, a ARMA(1,1) correlation structure for the repeated measurements, and robust variance estimates. e MicroPEM value subtract UPAS value (i.e., a positive value means the MicroPEM measurement was higher than the UPAS measurement, whereas a negative value means the MicroPEM measurement was lower than the UPAS measurement).
Disclaimer/Publisher’s Note: The statements, opinions and data contained in all publications are solely those of the individual author(s) and contributor(s) and not of MDPI and/or the editor(s). MDPI and/or the editor(s) disclaim responsibility for any injury to people or property resulting from any ideas, methods, instructions or products referred to in the content.