Article

Investigation and Analysis of Indoor Radon Concentrations in Typical Residential Areas in Central China

1
Qiaokou District Center for Disease Control and Prevention, 6 Gongnong Road, Wuhan 430035, China
2
National Institute for Radiological Protection, Chinese Center for Disease Control and Prevention, Beijing 100088, China
3
Hubei Provincial Center for Disease Control and Prevention, 6 Zhuodaoquan North Road, Wuhan 430079, China
*
Author to whom correspondence should be addressed.
Atmosphere 2025, 16(10), 1169; https://doi.org/10.3390/atmos16101169
Submission received: 11 March 2025 / Revised: 2 April 2025 / Accepted: 10 April 2025 / Published: 9 October 2025
(This article belongs to the Special Issue Environmental Radon Measurement and Radiation Exposure Assessment)

Abstract

In recent years, China has experienced a notable increase in indoor radon concentrations. However, our understanding of residential radon exposure in Central China remains limited and primarily depends on the data collected from residential buildings in Wuhan before 2003. Given this context, the current radon exposure levels in Central China must be assessed immediately, and the factors influencing them be investigated. To address this gap, our study focused on five representative areas in Central China. We monitored indoor radon concentrations in residential areas using random cluster sampling while considering various building structures. The radon levels were measured through the alpha track method, and RSKS standard detectors were deployed in two separate batches to participating households. A total of 1300 detectors were distributed across 579 households, with a recovery rate of 97.15% (1263 detectors were retrieved). The annual average indoor radon concentration in Central China ranged widely from 6.25 Bq/m3 to 310.44 Bq/m3, with an arithmetic mean of 50.20 Bq/m3, which resulted in an average annual effective dose of 2.08 mSv. Referring to World Health Organization standards, the radon concentration in approximately 8.24% of the monitored rooms exceeded the recommended action level. Our analysis indicated that radon concentration is primarily influenced by factors, such as the time of measurement, geographical location, building structure, floor materials, household fuel, and ventilation practices. Multiple regression analysis revealed that these factors collectively account for 10.80% of the variation in radon concentration. Notably, geographical location, building structure, and ventilation mode emerged as important factors. Based on these findings, our study suggests several practical measures to effectively reduce indoor radon levels, including improving ventilation, switching to cleaner fuels, and using environmentally friendly building and decoration materials.

1. Introduction

Radon holds immense importance in relation to human health. This element is prevalent in our daily living environments and serves as the primary source of natural radiation exposure. As stated in the 2006 Report by the United Nations Scientific Committee on the Effects of Atomic Radiation (UNSCEAR), approximately 52% of the total natural radiation dose received by individuals in normal background areas is attributed to the inhalation of radon and its decay products, a finding that has garnered widespread attention [1,2]. The human body comprises a highly intricate system, which encompasses numerous organs with diverse chemical properties, functions, and varying degrees of radiation sensitivity. Consequently, the reliable assessment of radon exposure risks and the formulation of effective radon prevention measures are paramount [3,4].
In 1987, the World Health Organization (WHO) classified radon as one of the 19 environmental carcinogens; this classification is echoed by the International Agency for Research on Cancer, which also classified radon and its decay products as group one carcinogens [5,6]. Statistics from the United States Environmental Protection Agency reveal radon as the second most important contributor to lung cancer after smoking, and it poses the greatest risk to nonsmokers. Annually, radon causes up to 20,000 lung cancer deaths, which surpasses the harm posed by passive smoking [7]. Global figures indicate that approximately 10% of human lung cancer cases stem from radon and its progeny, with percentages varying in countries, including the following: 6–12% in the UK, 7% in Germany, 10–14% in the United States, and an estimated 15% in China [8]. The latest meta-analysis demonstrated that for every 100 Bq/m3 rise in indoor radon concentration, the relative risk for lung cancer goes up by 11%, which correlates strongly with small-cell lung cancer [9]. The International Commission on Radiological Protection (ICRP) underscored the public health threat of indoor radon in its 2014 special report, “Radiation Protection against Radon Exposure (ICRP126)”. Radon primarily infiltrates indoors through soil surrounding the foundation and emits alpha particles alongside short-lived decay products. These alpha particles can acquire a charge and adhere to aerosols, dust, and various other particles suspended in the air. Consequently, radon daughter nuclei have the potential to accumulate on cells lining the airway walls, where alpha particles can inflict damage on DNA, which ultimately leads to the development of lung cancer. Radon’s health impacts extend beyond lung cancer, including risks of leukemia, infertility, fetal malformations, and genetic damage, which prompted the WHO to prioritize it in global disease burden assessments [10].
The primary sources of indoor radon include foundation soil, building materials, outdoor air, fuel, and domestic water. Radon concentration is influenced by various housing factors (building materials, floors, and service life), environmental conditions (temperature, humidity, and air pressure), time factors (season, day, and night), and ventilation capacity [11,12]. Typically, outdoor radon concentration remains low due to diffusion and dilution. However, in poorly ventilated rooms, its concentration can surge to tens or hundreds of times higher than the outdoor level [13,14]. According to a South Korean study [15], the key factors that influence indoor radon concentration, in the order of significance, comprise geographical location, construction year, and season.
Since 2003, the real estate industry has experienced rapid growth, which has led to the development of numerous residential areas. Despite this progress, research data regarding indoor radon exposure levels in Central China remain outdated, with the latest findings dating back to 2003 and being confined to Wuhan [16]. Consequently, comprehensive research must be conducted on indoor radon exposure and its health impacts on residents across Central China. This study specifically addressed the issue of indoor radon pollution in the region. Its primary goals were to conduct indoor radon pollution monitoring, assess radiation doses, and gather data on indoor radon levels, sources, and excess rates in residential buildings. Furthermore, this work explored the influence of geography, architecture, and living habits on indoor radon concentrations and ultimately proposed radon reduction methods and mitigation measures tailored to the unique characteristics of houses in Central China.

2. Materials and Methods

2.1. Radon Measurement

2.1.1. Measuring Instruments and Materials

The track etching method is extensively utilized for long-term monitoring of indoor radon concentration across various settings. Its capability to precisely represent the cumulative radon concentration allows for an accurate assessment of radon’s potential harm to human health, especially during public dose evaluations [17]. As one of the standard methods for radon concentration measurement, the American radon measurement standard recommends the adoption of the track etching method [18]. Consequently, this study assessed indoor radon concentrations using the Radosys solid-state track etching automatic measurement system. The Radosys system comprises three main components: the RSV10 fully automatic track analysis unit, the RadoBath etching unit, and RSKS-type detectors (CR-39 plates made of polyallyl diglycol carbonate with an area of 100 mm2).
The materials used included sodium hydroxide and acetic acid, which were both sourced from Sinopharm Chemical Reagent Co., Ltd. (Shanghai, China).

2.1.2. Detector Reading

The exposed detector, which was sealed again in its original air-tight bag, was promptly returned to the laboratory for testing. Initially, the RSKS-type detector was carefully removed from its housing using tweezers and securely mounted onto the Radosys slide accessory. The slide, which can host a maximum of 12 CR-39 detectors, was inserted into an etching unit (RadoBath) for the etching process; initially, 4 L 6.25 mol/L NaOH solution was poured into the etching unit, and the etching process was allowed to proceed for 4.50 h at 90 °C. Then, the NaOH solution was disposed, and 4 L 0.18 mol/L acetic acid solution was poured in to neutralize the etching process for 20 min. Following the neutralization, the neutralized fluid was drained, and the RadoBath was filled with 4 L distilled water to start the 20 min final washing stage. Finally, the plastic slide was extracted from the RadoBath for rinsing and drying. Ultimately, the Radosys solid-track automatic measurement system was used for data reading, with nine fields of view selected on each CR-39 plate, and the effective detection area being 51.71 mm2. The average radon concentration over the exposure time was obtained.

2.2. Investigation Plan

2.2.1. Monitoring Location

Based on geographical location and geological factors, such as mountainous regions, plains, hot springs, and mining areas, five representative regions in Central China were selected: City A, Wuhan (a megacity with a population exceeding 10 million); City B, Enshi (an ecotourism city inhabited by ethnic minorities); City C, Shiyan (an industry-dominated mountainous city); City D, Xianning (a regional central city rich in hot springs); and City E, Daye (a county-level city based on mineral resources).

2.2.2. Monitoring Time and Sampling Methodology

The duration of radon concentration monitoring in each household must not be shorter than six months. Specifically, monitoring lasted from April to October 2019, and it was divided into 2 three-month cycles—one from April to July and another from July to October, with a total of two cycles of uninterrupted monitoring.
Considering the age and floor of the building, random cluster sampling monitoring was conducted to measure the indoor radon concentration based on the building’s structure. From each city, fifteen residential areas were selected, and they comprised 75 households in five areas with reinforced concrete structures, 25 households in five areas with brick concrete structures, and 25 households in five areas constructed with either civil structures or brick wood structures. In addition, parallel samples exceeding 10% of the total number of households were obtained.

2.2.3. Detector Placement and Questionnaire Survey

The trained investigator placed the RSKS standard detector in the bedroom or living room in the home of the family under observation. Either at the commencement or conclusion of each monitoring cycle, the investigator deployed or retrieved the detector from the door. The investigator interviewed the residents and filled in the indoor radon level investigation record form for typical areas. The questionnaire encompassed various details, such as household information, living habits, building-related details, medical records of household members, and layout information.

2.3. Estimation of Public Effective Dose

The formula specified in the requirements for control of indoor radon and its progeny (GB/T 16146-2015) [19] was used to calculate the annual average effective dose of inhaled radon and its daughters. The formula reads as follows: E R n = c ¯ R n , a × D C F R n + F · D C F R n D × t = i = 1 n c ¯ R n , i ÷ i = 1 n f i × D C F R n + F · D C F R n D × t . In this formula, E R n represents the annual average effective dose m S v , c ¯ R n , a denotes the annual average radon concentration B q · m 3 , D C F R n indicates the dose conversion factor for radon (temporarily recommended as 0.17 × 10 6 [ ( m S v / B q · h · m 3 ] based on the UNSCEAR 2000 report), D C F R n D signifies the dose conversion factor for radon progeny (temporarily recommended as 9 × 10 6 [ ( m S v / B q · h · m 3 ] according to the UNSCEAR 2000 report), F stands for the equilibrium factor with a typical indoor value of 0.50 in China, t represents the annual residence time, which was assumed to be 7000 h, c ¯ R n , i represents the average radon concentration for the i-th quarter B q · m 3 , and f i refers to the seasonal correction factor, with f 1 = 0.97 and f 2 = 0.86 based on GB/T 16146-2015, Appendix C.

2.4. Statistical Analysis

Excel employment data were utilized, and data analysis and processing were conducted using SPSS 21 software. To delineate the indoor radon concentration levels in Central China, we employed the geometric mean and geometric standard deviation. A Chi-square test was applied to assess the distribution of indoor radon concentration in various geographical locations. The radon concentration values were subjected to logarithmic transformation and subsequently analyzed through variance and multiple linear regression analyses. Factors influencing radon concentration variation were examined through variance, Spearman correlation, and multiple linear regression analyses. For multiple comparisons among the means of various samples, the least significant difference (LSD)-t test was utilized. The significance level for statistical analysis was set at p < 0.05.

3. Results

3.1. Detector Configuration

A total of 1300 detectors were strategically placed in 579 households across 70 residential areas in five cities. The detectors included 135 parallel samples, which were ideally placed in the same or similar locations within the surveyed room to ensure consistent or comparable placement conditions. This placement allowed for mutual verification and ensured the consistency and reliability of data. Out of these detectors, 1263 were successfully recovered, with a recovery rate of 97.15%. Table 1 provides a detailed breakdown of the detector layout. To ensure reliability, if the relative deviation of parallel sample measurement results fell within the 20% range, we considered the average of these results the final household measurement.

3.2. Indoor Radon Levels in Central China

The survey results indicate that the average annual indoor radon concentration in Central China ranges between 6.25 and 310.44 Bq/m3, which reflects a lognormal distribution in Figure 1. Specifically, the calculated arithmetic mean and standard deviation were 50.20 and 31.61 Bq/m3, respectively. The geometric mean and standard deviation stood at 42.45 and 1.79 Bq/m3, respectively. In addition, the median (with 25% and 75% quantiles) was 42.23 (29.03, 61.58) Bq/m3.
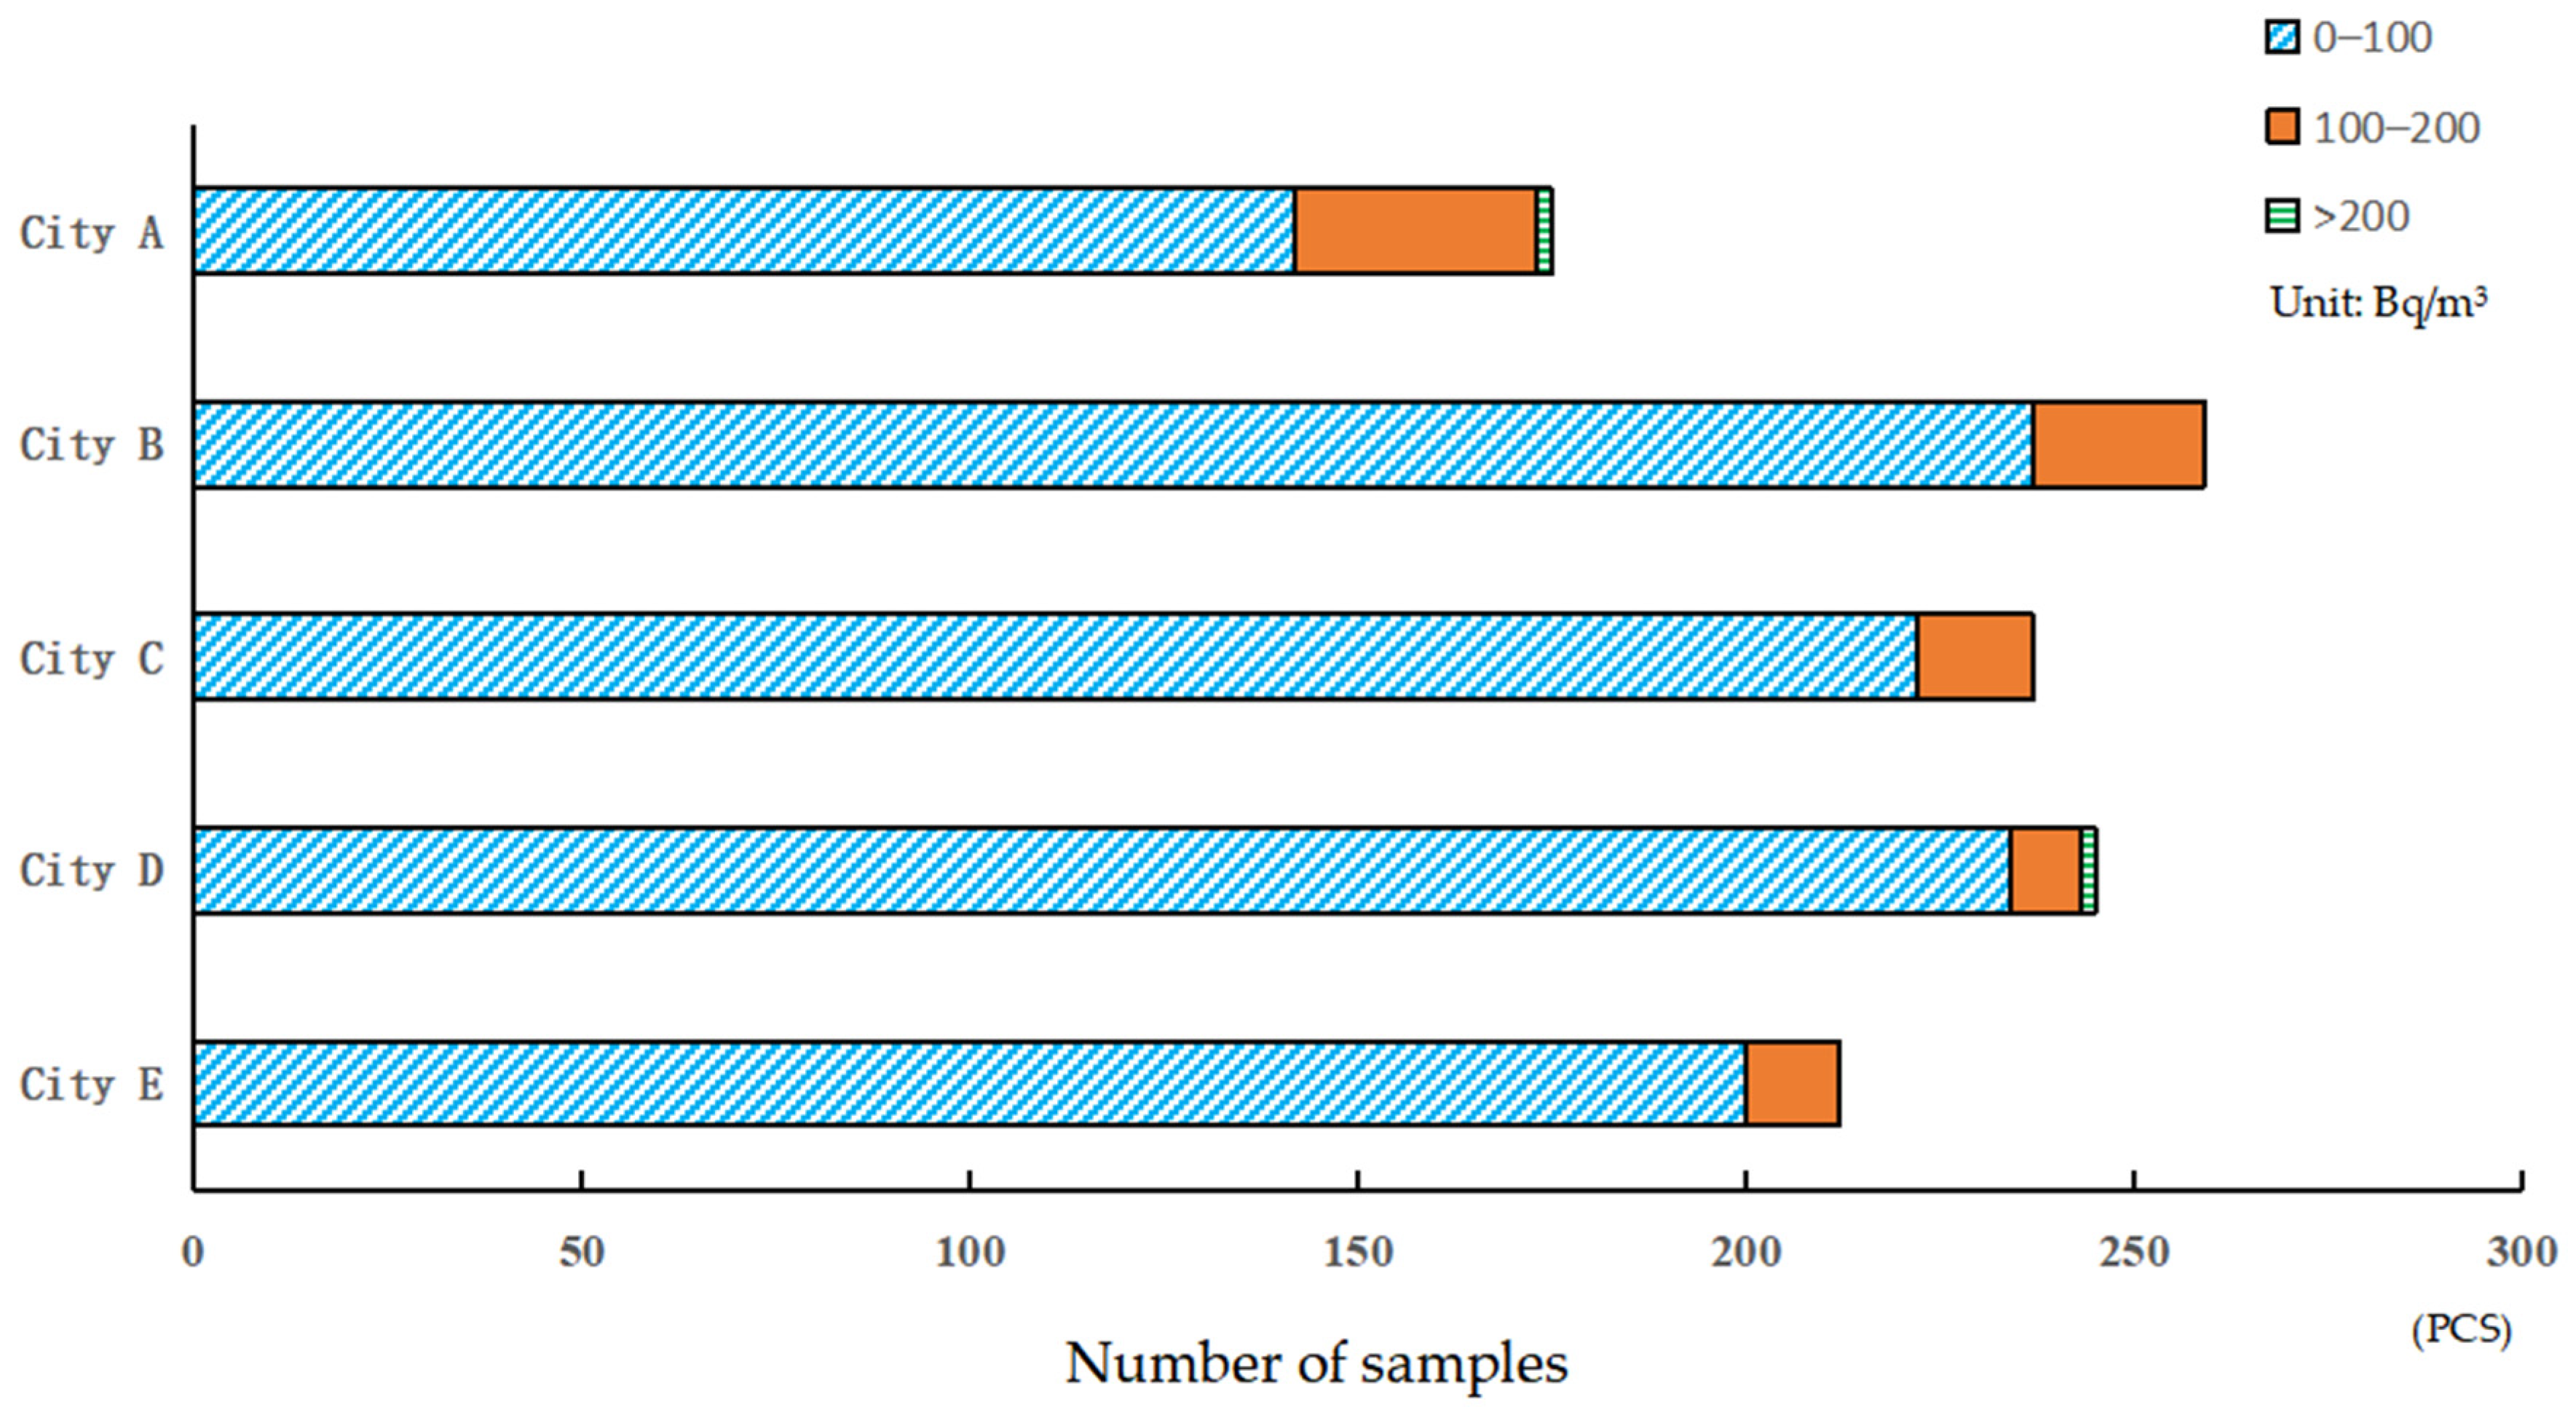
Among all surveyed rooms, 91.76% exhibited radon concentrations below 100 Bq/m3, and 7.89% radon concentrations fell between 100 and 200 Bq/m3. Notably, the radon concentrations exceeded 200 Bq/m3 in four rooms, accounting for 0.35%. Table 2 shows the indoor radon concentration levels in Central China at various deployment times.
Variance analysis revealed notable disparities in indoor radon concentration levels based on deployment times. Residential buildings occupied from July to October in a year demonstrated significantly lower radon concentration levels compared with those occupied from April to July (F = 14.38, p = 0.00).

Residential Radon Levels Across Various Geographical Locations in Central China

Table 3 illustrates the indoor radon concentration levels recorded in the five cities investigated. Variance analysis revealed notable disparities in the indoor radon levels across various geographical locations (F = 16.17, p = 0.00). According to the LSD-t test outcomes, City A’s indoor radon concentration is comparable to that of City D and City E but diverged from those of Cities B and C. The residents in City B experienced significantly higher indoor radon levels compared with other urban centers, whereas City C exhibited the reverse trend. Figure 2 shows a visual representation of indoor radon distribution across distinct geographical settings. The Chi-square test further confirmed a statistically significant variance in indoor radon distribution among residents in various locations (χ2 = 19.36, p = 0.01). For rooms where radon concentration surpasses 100 Bq/m3, City A held the highest percentage (18.90%), whereas City D registered the lowest at 4.49%.

3.3. Correlation Analysis and Multiple Linear Regression Analysis

3.3.1. Correlation Analysis

For non-normally distributed observation variables, the Spearman correlation was selected for analysis. Figure 3 illustrates the Spearman correlation coefficient, which indicates a statistical significance between radon concentration and various study factors. Radon concentration was associated with 15 research factors, with the strongest correlation being observed with the use of air conditioning (r = 0.20, p = 0.00), followed by decoration (interior renovation and furnishings, including wall paint, flooring materials, furniture, and other factors that may influence indoor radon concentration) (r = 0.17, p = 0.00), building structure (r = 0.17, p = 0.00), household fuel (r = 0.16, p = 0.00), floor (r = 0.15, p = 0.00), building age (r = 0.15, p = 0.00), decoration time (r = 0.15, p = 0.00), ground materials (r = 0.15, p = 0.00), domestic water (r = 0.13, p = 0.00), and geographical location (r = 0.09, p = 0.00). Negative correlations were found with daily ventilation time from April to July (r = −0.08, p = 0.01) and daily ventilation time from July to October (r = −0.06, p = 0.04). Other factors, including the daily use time of air conditioners (r = 0.08, p = 0.02), main ventilation mode (r = 0.08, p = 0.01), and bedroom door and window sizes (r = −0.06, p = 0.04), displayed positive, but weaker correlations. Notably, radon concentration showed no significant correlation with four study factors: layout room (r = 0.12, p = 0.69), bedroom area (r = −0.06, p = 0.05), living room area (r = −0.01, p = 0.66), and layout time (r = 0.06, p = 0.05).

3.3.2. Multiple Linear Regression Analysis

Given that radon concentration, which is the dependent variable, is continuous, we opted for multivariate linear regression to investigate the factors influencing indoor radon levels among residents in Central China. However, as radon concentration followed a skewed distribution, which violates the assumption of normality required for multiple linear regression, we applied a natural logarithm transformation to the radon concentration data. Variance and correlation analyses revealed that radon concentration is affected by numerous factors. These identified factors were subsequently incorporated as independent variables in multiple linear regression analysis. To facilitate this inclusion, we redefined the original multicategorical variables as dummy variables and grouped them based on their respective factors. We ensured that these dummy variables entered and exited the regression model simultaneously through the forced entry method. Dummy variables representing other factors were grouped separately. Moreover, all other independent variables were grouped together, and the backward elimination method was selected for their inclusion in the model. The inclusion and exclusion criteria for the variables were set at p ≤ 0.05 and p ≥ 0.10, respectively.
Based on the results obtained from variance and correlation analyses, the room factor was discounted, and the other pertinent factors were incorporated into the multiple linear regression study. Multiple linear regression analysis led to the elimination of 5 out of 11 independent variables, and 6 significant factors were ultimately retained in the regression equation. For detailed information, refer to Table 4 and Table 5. The model had an R2 value of 0.11, and 10.80% of the variation in indoor radon concentration in Central China can be attributed to factors, such as layout time, geographical location, building structure, ground materials, household fuel, and primary ventilation mode. Upon examination of the standard regression coefficient, geographical location, building structure, layout time, and primary ventilation mode exerted a more significant influence on radon concentration. Despite the model’s significance (F = 10.32, p = 0.00), it only accounted for a relatively small portion of the overall variation. Further statistical test revealed the statistical significance of layout time, geographical location, building structure, and primary ventilation mode (p < 0.05).
Furthermore, collinearity diagnosis was conducted to ascertain whether relationships exist between multiple variables. In this model, the VIF values for the differential expansion factor, all of which were below 5, ranged from 1.00 to 3.00. The tolerance levels were between 0.33 and 0.99, exceeding 0.10, which indicates an absence of collinearity issues. The Durbin–Watson (DW) test was employed to determine whether autocorrelation exists in the residual term of the regression analysis. The DW value of 1.99, which is close to 2, signifies the inevident autocorrelation of the independent variables, which highlights the solid construction of the model. Consequently, the following linear regression equation was formulated: Y = 3.83 − 0.13X1 + 0.08X2-2 − 0.29X2-3 − 0.11X2-4 − 0.09X2-5 + 0.05X3-2 + 0.21X3-3 − 0.03X4-2 + 0.02X4-3 + 0.05X4-4 − 0.06X5-2 + 0.07X5-3 + 0.23X6.

3.4. Estimation of Public Effective Dose

Using the formula provided in Section 2.3, the estimated annual average effective dose of inhaled radon and its decay products for residents of Central China was calculated, as follows: E R n = c ¯ R n , a × D C F R n + F · D C F R n D × t = i = 1 n c ¯ R n , i ÷ i = 1 n f i × D C F R n + F · D C F R n D × t = ( 53.61 + 46.59 ) ÷ ( 0.97 + 0.86 ) × 0.17 × 10 6 + 0.50 · 9 × 10 6 × 7000 = 2.08   m S v .
Likewise, the average annual effective doses for the deployment periods from April to July and July to October in a year were 2.10 and 2.06 m S v , respectively. Furthermore, the average annual effective doses in different regions, such as Cities A, B, C, D, and E, were 2.35, 2.44, 1.69, 1.95, and 2.03 m S v , respectively.

4. Discussion

Different countries and organizations maintain varying standards for indoor radon concentration. However, a noticeable trend was observed toward stricter regulations. The US Environmental Protection Agency suggests an action level of 148 Bq/m3, and the WHO recommends a more stringent limit of 100 Bq/m3 [6,20]. In accordance with the rigorous WHO criteria, 8.24% of the surveyed rooms exceeded the radon concentration threshold.
Requirements for control of indoor radon and its progeny (GB/T 16146-2015) [19] outline the latest national benchmarks for indoor radon in China. They specify an annual average radon concentration action level of 300 Bq/m3 for existing buildings and a target level of 100 Bq/m3 for new constructions. Notably, “existing buildings” refer to those constructed before 2016 (2016 excluded), whereas “new buildings” denote constructions completed after 2016 (2016 included). Our survey revealed that among the 507 households in older buildings (pre-January 1st, 2016), none exceeded the national limit. However, among the 72 households surveyed in newer buildings (post-January 1, 2016), 6.94% were above the national limit. The average annual effective dose of radon and its decay products among residents in Central China from both types of buildings remain below the national standard limit.
The results of multiple linear regression analysis conducted in this study revealed that several factors, including distribution time, geographical location, building structure, ground materials, household fuel, and primary ventilation methods, collectively account for 10.80% of the variation in indoor radon concentration in Central China. Examination of the standard regression coefficient revealed that the most important factors influencing radon concentration are geographical location, building structure, layout time, and primary ventilation mode.
After rigorous testing and comparison of various models, this representative model emerged as the most suitable. In comparison with other models, it boasts a higher coefficient of determination, residuals that closely approximate a normal distribution, negligible autocorrelation among independent variables, and an absence of collinearity issues. The multitude of influencing factors make the modeling of indoor radon concentration notoriously challenging. Consequently, a few satisfactory predictive empirical models have been documented. Traditional multiple linear regression analysis has been the prevalent modeling approach. However, this method has limitations, particularly its reliance on numerous input parameters and the assumption of linearity.
Previous research employing multiple linear regression to investigate the effect of architectural factors on indoor radon concentration variations in 983 Spanish households revealed that residential age, the number of floors, floor distance, and internal building materials accounted for 10% of radon variation [21]. Similarly, a study of 963 Greek residences identified wall materials, floor levels, and wall contact as significant factors influencing radon fluctuations, and they explained 2.90% of the variation [22]. By contrast, nonlinear regression models for radon concentration are less common in the literature. Kropat et al. utilized kernel regression and determined that 28% of the variation in indoor radon concentration can be attributed to factors, such as building and foundation types, tectonic year, detector type, geographical coordinates, altitude, temperature, and lithology [23]. Atik et al. presented a more accurate multiple nonlinear model (R2 = 58%) that considers the spatial–temporal variation in indoor radon across five buildings in Boli, Turkey [24].
Given the constraints of time, resources, and personnel, we selected five typical regions in Central China for this survey, although they may not be fully comprehensive. For a more accurate evaluation of the annual effective dose, full-year monitoring is the ideal approach. For periods that were not directly monitored, we applied seasonal correction factors to adjust the radon concentration to estimate the annual average. Our future plans included conducting a province-wide survey spanning a full year. In addition to focusing on residential radon concentrations, we intended to investigate the health impacts on households with elevated radon exposure. Furthermore, we recognized the potential harm of radon in office environments and planned to initially explore radon concentrations in such settings.

5. Conclusions

The survey revealed that the average annual indoor radon concentration for residents in Central China ranges from 6.25 Bq/m3 to 310.44 Bq/m3. The geometric mean and geometric standard deviation were 42.45 and 1.79 Bq/m3, respectively, and the average annual effective dose was 2.08 mSv. In compliance with the strict standards set by the WHO, 8.24% of the surveyed rooms exceeded the action level for radon concentration. Factors contributing to variations in indoor radon concentration in Central China included layout time, geographical location, building structure, ground materials, household fuels, and primary ventilation methods, which accounted for 10.80% of the total variation. Effective measures to reduce indoor radon concentration comprise improving indoor ventilation, opting for clean fuels, and using environmentally friendly decoration materials.

Author Contributions

Conceptualization, W.Z. and J.D.; methodology, W.Z.; software, C.L.; validation, G.S., F.W. and J.Y.; formal analysis, C.L.; investigation, C.L.; resources, W.Z.; data curation, J.D.; writing—original draft preparation, C.L.; writing—review and editing, W.Z.; visualization, Q.X.; supervision, S.L.; project administration, W.Z.; funding acquisition, W.Z. All authors have read and agreed to the published version of the manuscript.

Funding

This research was funded by the Hubei Natural Science Foundation Project (grant number 2023AFB1093) and the Hubei Provincial Health Commission General Program (grant number WJ2023M103).

Institutional Review Board Statement

Not applicable.

Informed Consent Statement

Not applicable.

Data Availability Statement

Data are available on request. Data for the said manuscript are declared to be provided on request after the publication.

Acknowledgments

The authors would like to express their gratitude to all members who participated in this research, especially Wenshan Zhou from the Hubei Provincial Center for Disease Control and Prevention, for their invaluable assistance with the manuscript.

Conflicts of Interest

The authors declare no conflicts of interest.

References

  1. Charles, M. Effects of Ionizing Radiation: United Nations Scientific Committee on the Effects of Atomic Radiation: UNSCEAR 2006 Report, Volume 1—Report to the General Assembly, with Scientific Annexes A and B; United Nations Office at Vienna: Vienna, Austria, 2010.
  2. Little, M.; Wakeford, R. Annex A: Epidemiological Studies of Radiation and Cancer; United Nations: New York, NY, USA, 2008.
  3. Kang, J.-K.; Seo, S.; Jin, Y.W. Health effects of radon exposure. Yonsei Med. J. 2019, 60, 597–603. [Google Scholar] [CrossRef] [PubMed]
  4. Shahbazi-Gahrouei, D.; Gholami, M.; Setayandeh, S. A review on natural background radiation. Adv. Biomed. Res. 2013, 2, 65. [Google Scholar] [CrossRef] [PubMed]
  5. International Agency for Research on Cancer. Man-Made Mineral Fibres and Radon; IARC Monographs on the Evaluat: Lyon, France, 1988; Volume 43. [Google Scholar]
  6. World Health Organization. WHO Handbook on Indoor Radon: A Public Health Perspective; World Health Organization: Geneva, Switzerland, 2009.
  7. Pawel, D.; Puskin, J. The US Environmental Protection Agency’s assessment of risks from indoor radon. Health Phys. 2004, 87, 68–74. [Google Scholar] [CrossRef] [PubMed]
  8. Zielinski, J.M.; Carr, Z.; Krewski, D.; Repacholi, M. World health organization’s international radon project. J. Toxicol. Environ. Health Part A 2006, 69, 759–769. [Google Scholar] [CrossRef] [PubMed]
  9. Li, C.; Wang, C.; Yu, J.; Fan, Y.; Liu, D.; Zhou, W.; Shi, T. Residential radon and histological types of lung cancer: A meta-analysis of case–control studies. Int. J. Environ. Res. Public Health 2020, 17, 1457. [Google Scholar] [CrossRef] [PubMed]
  10. López-Abente, G.; Núñez, O.; Fernández-Navarro, P.; Barros-Dios, J.M.; Martín-Méndez, I.; Bel-Lan, A.; Locutura, J.; Quindós, L.; Sainz, C.; Ruano-Ravina, A. Residential radon and cancer mortality in Galicia, Spain. Sci. Total Environ. 2018, 610, 1125–1132. [Google Scholar] [CrossRef] [PubMed]
  11. Bruno, R.C. Sources of indoor radon in houses: A review. J. Air Pollut. Control Assoc. 1983, 33, 105–109. [Google Scholar] [CrossRef]
  12. Sakoda, A.; Ishimori, Y.; Hasan, M.M.; Jin, Q.; Iimoto, T. Seasonal Variations in Radon and Thoron Exhalation Rates from Solid Concrete Interior Walls Observed Using In Situ Measurements. Atmosphere 2024, 15, 701. [Google Scholar] [CrossRef]
  13. Ivanova, K.; Stojanovska, Z.; Kunovska, B.; Chobanova, N.; Badulin, V.; Benderev, A. Analysis of the spatial variation of indoor radon concentrations (national survey in Bulgaria). Environ. Sci. Pollut. Res. 2019, 26, 6971–6979. [Google Scholar] [CrossRef] [PubMed]
  14. Gulan, L. Analysis of Long-Term Monitoring of Radon Levels in a Low-Ventilated, Semi-Underground Laboratory—Dose Estimation and Exploration of Potential Earthquake Precursors. Atmosphere 2024, 15, 1534. [Google Scholar] [CrossRef]
  15. Park, T.H.; Kang, D.R.; Park, S.H.; Yoon, D.K.; Lee, C.M. Indoor radon concentration in Korea residential environments. Environ. Sci. Pollut. Res. 2018, 25, 12678–12685. [Google Scholar] [CrossRef] [PubMed]
  16. Zuhong, H.; Xiangjun, Y.; Jun, Q. Investigation and Control of Indoor Radioactivity Levels in Wuhan City. J. Public Health Prev. Med. 2005, 16, 2. [Google Scholar]
  17. Janik, M.; Hasan, M.M.; Bossew, P.; Kavasi, N. Effects of storage time and pre-etching treatment of CR-39 detectors on their response to alpha radiation exposure. Int. J. Environ. Res. Public Health 2021, 18, 8346. [Google Scholar] [CrossRef] [PubMed]
  18. George, A. The history, development and the present status of the radon measurement programme in the United States of America. Radiat. Prot. Dosim. 2015, 167, 8–14. [Google Scholar] [CrossRef] [PubMed]
  19. GB/T 16146-2015; Requirements for Control of Indoor Radon and Its Progeny. General Administration of Quality Supervision, Standardization Administration of the People’s Republic of China: Beijing, China, 2016.
  20. US Environmental Protection Agency, Indoor Environments Division. A Citizen’s Guide to Radon: The Guide to Protecting Yourself and Your Family from Radon; US Environmental Protection Agency, Indoor Environments Division: Washington, DC, USA, 2002.
  21. Barros-Dios, J.; Ruano-Ravina, A.; Gastelu-Iturri, J.; Figueiras, A. Factors underlying residential radon concentration: Results from Galicia, Spain. Environ. Res. 2007, 103, 185–190. [Google Scholar] [CrossRef] [PubMed]
  22. Nikolopoulos, D.; Kottou, S.; Louizi, A.; Petraki, E.; Vogiannis, E.; Yannakopoulos, P. Factors affecting indoor radon concentrations of Greek dwellings through multivariate statistics-first approach. J. Phys. Chem. Biophys. 2014, 4, 145. [Google Scholar] [CrossRef]
  23. Kropat, G.; Bochud, F.; Jaboyedoff, M.; Laedermann, J.-P.; Murith, C.; Palacios, M.; Baechler, S. Predictive analysis and mapping of indoor radon concentrations in a complex environment using kernel estimation: An application to Switzerland. Sci. Total Environ. 2015, 505, 137–148. [Google Scholar] [CrossRef] [PubMed]
  24. Atik, S.; Yetis, H.; Denizli, H.; Evrendilek, F. Monitoring spatiotemporal dynamics of indoor radon concentration in the built environment of a university campus. Fresenius Env. Bull 2016, 25, 823–829. [Google Scholar]
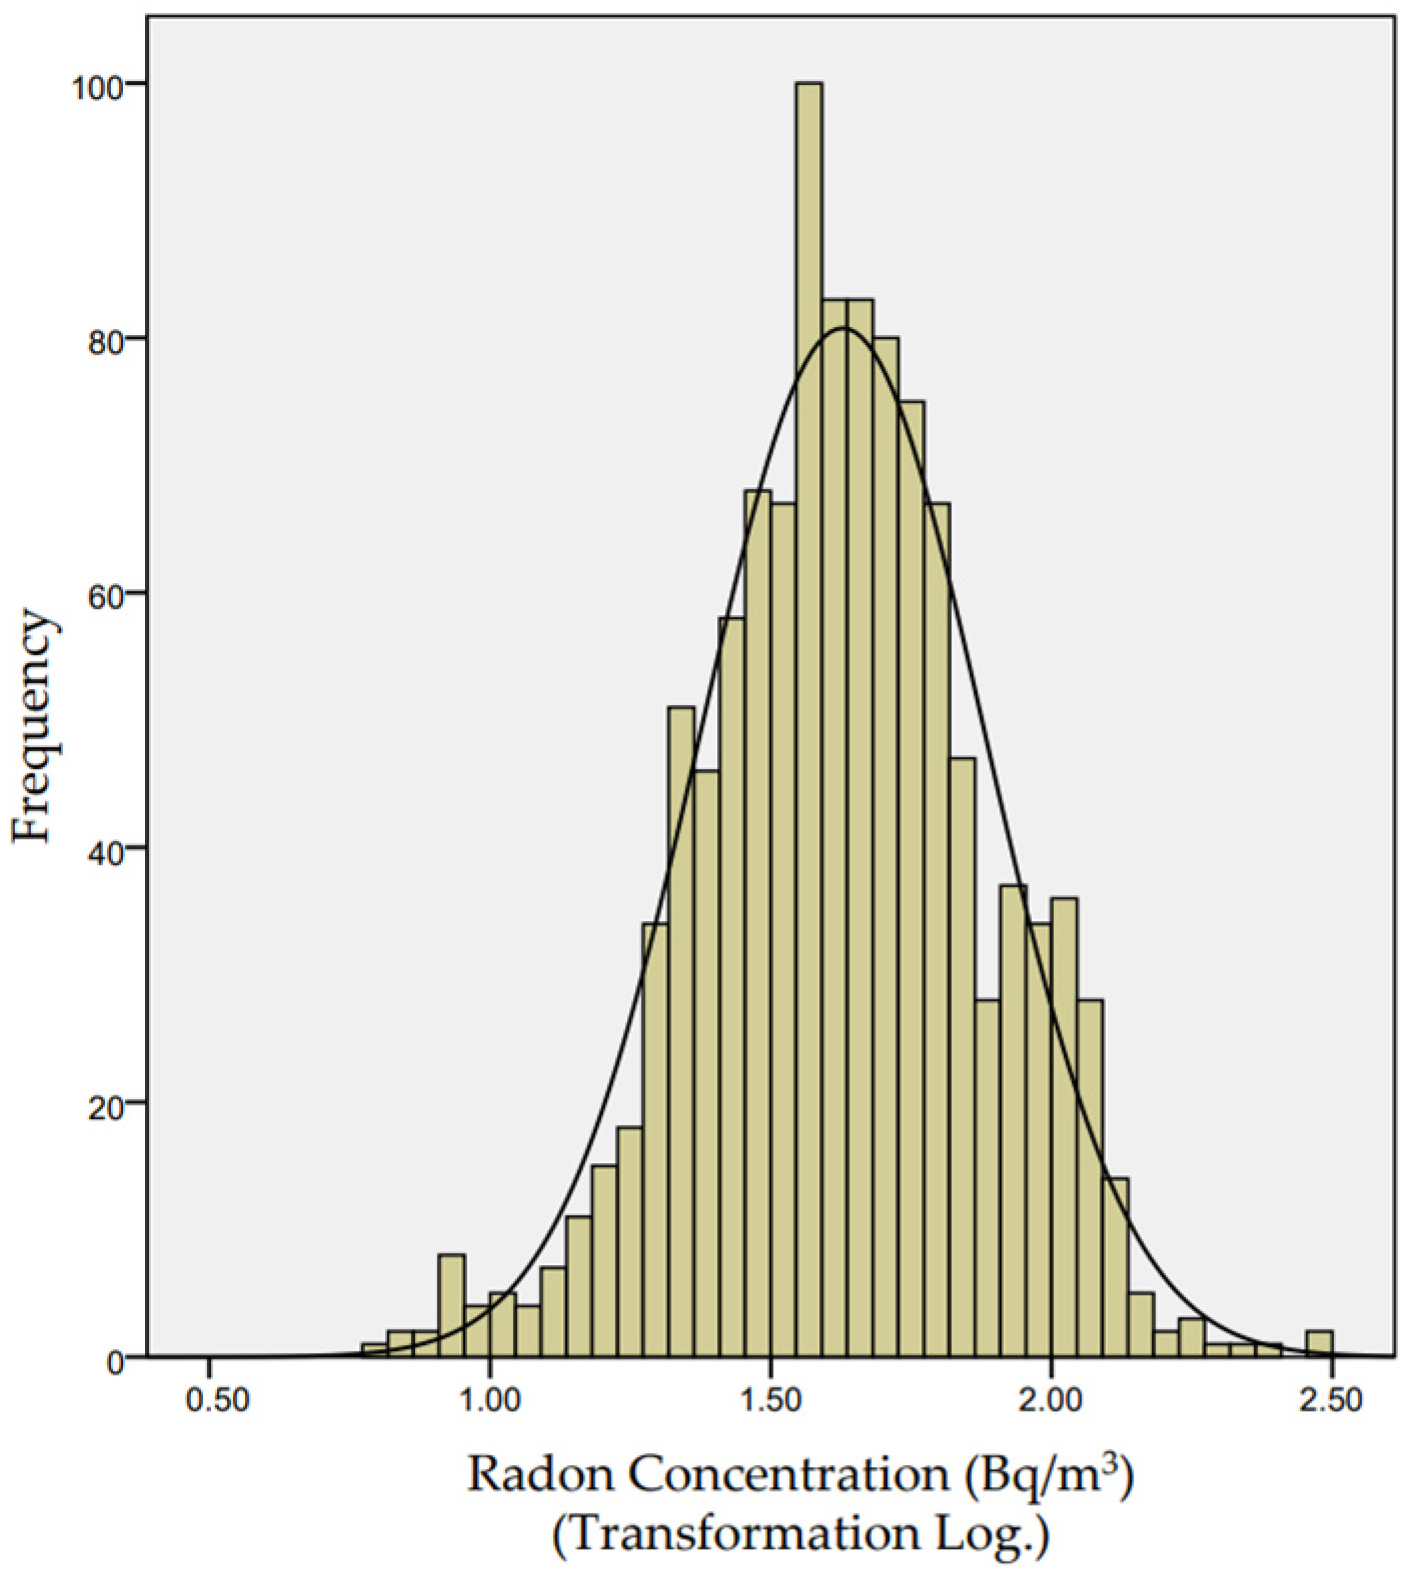
Figure 1. Frequency distribution of annual residential radon concentration in Central China.
Atmosphere 16 01169 g001
Figure 2. Distribution of residential radon levels across various geographical locations.
Atmosphere 16 01169 g002
Figure 3. Spearman correlation coefficient indicating statistical significance between radon concentration and diverse research factors.
Atmosphere 16 01169 g003
Table 1. Detector layout table.
BatchLaying TimeNumber of Detectors (Parallel Samples)
First batchApril 2019–July 2019651 (65)
Second batchJuly 2019–October 2019649 (70)
TotalApril 2019–October 20191300 (135)
Table 2. Residential radon levels in Central China during various exposure durations (Bq/m3).
Laying TimeMinMaxGMGSDM (P25, P75)
2019.04–2019.078.12310.4445.241.7741.06 (30.20, 66.71)
2019.07–2019.106.25289.6439.691.8043.09 (27.62, 59.75)
Total6.25310.4442.451.7942.23 (29.03, 61.58)
Min: minimum; Max: maximum; GM: geometric mean; GSD: geometric standard deviation; M: median; P25: the 25th percentile; P75: the 75th percentile.
Table 3. Residential radon levels across various geographical locations in Central China (Bq/m3).
Geographical PositionN(PCs.)MinMaxGM *GSDM (P25, P75)
City A17515.22310.4444.30 a1.9738.58 (25.25, 76.36)
City B2596.58192.5651.47 b1.7653.97 (44.08, 70.61)
City C2376.25144.6034.30 c1.7931.51 (23.61, 47.20)
City D24510.37289.6441.36 a1.6239.10 (30.44, 55.55)
City E2128.12179.3242.35 a1.7341.91 (31.25, 59.99)
N: the number of detectors remaining after the elimination of parallel samples; Min: minimum; Max: maximum; GM: geometric mean; GSD: geometric standard deviation; M: median; P25: the 25th percentile; P75: the 75th percentile; *: The LSD-t test revealed a statistically significant difference (p < 0.05) in the radon concentrations between the two groups denoted by different letters in the same column.
Table 4. Multivariate linear regression analysis of variable assignment.
Variable NameVariable CodeDummy VariableAssignment
-Y Ln (radon concentration)
Laying timeX1 From April to July = 0, From July to October = 1
Geographical locationX2X2-1 City ACity A = 1, non-City A = 0
X2-2 City BCity B = 1, non-City B = 0
X2-3 City CCity C = 1, non-City C = 0
X2-4 City DCity D = 1, non-City D = 0
X2-5 City ECity E = 1, non-City E = 0
Building structureX3X3-1 reinforced concrete structureReinforced concrete structure = 1, nonreinforced concrete structure = 0
X3-2 brick-and-concrete structureBrick-and-concrete structure = 1, non-brick-and-concrete structure = 0
X3-3 brick, wood, or civil structureBrick, wood, or civil structure = 1, non-brick, wood, or civil structure = 0
Ground materialsX4X4-1 solid wood flooringSolid wood flooring = 1, non-solid wood flooring = 0
X4-2 composite floorComposite floor = 1, non-composite floor = 0
X4-3 ceramic tileCeramic tile=1, non-ceramic tile = 0
X4-4 marble or cementMarble or cement = 1, non-marble or cement = 0
Household fuelX5X5-1 natural gasNatural gas = 1, non-natural gas = 0
X5-2 liquefied petroleum gasLiquefied petroleum gas = 1, non-liquefied petroleum gas = 0
X5-3 coal or firewoodCoal or firewood = 1, non-coal or firewood = 0
Main ventilation modeX6 Natural ventilation = 1, alternative ventilation methods = 0
Table 5. Comprehensive multiple linear regression analysis of residential radon concentration in Central China.
VariableNon-Standardized CoefficientStandard Regression Coefficientt Valuep Value95% Confidence Interval of the Regression Coefficient
Regression CoefficientStandard ErrorLower LimitUpper Limit
Constant3.83 0.06 66.950.003.72 3.94
Laying time−0.13 0.03 −0.11 −3.85 0.00 −0.19 −0.06
City B (VS City A)0.080.060.061.410.16−0.030.20
City C (VS City A)−0.290.06−0.20−5.200.00−0.40−0.18
City D (VS City A)−0.110.06−0.08−1.900.06−0.230.00
City E (VS City A)−0.090.06−0.06−1.540.12−0.210.03
Brick-and-concrete structure (VS Reinforced concrete structure)0.05 0.04 0.04 1.17 0.24−0.03 0.14
Brick, wood, or civil structure (VS Reinforced concrete structure)0.210.080.132.740.010.060.35
Composite floor (VS solid wood flooring)−0.030.05−0.02−0.600.55−0.120.06
Ceramic tile (VS solid wood flooring)0.020.050.010.380.70−0.080.13
Marble or cement (VS solid wood flooring)0.050.060.040.800.42−0.070.17
Liquefied petroleum gas (VS natural gas)−0.060.07−0.03−0.880.38−0.190.07
Coal or firewood (VS natural gas)0.070.090.040.850.40−0.100.24
Main ventilation mode0.23 0.09 0.072.49 0.01 0.05 0.40
Disclaimer/Publisher’s Note: The statements, opinions and data contained in all publications are solely those of the individual author(s) and contributor(s) and not of MDPI and/or the editor(s). MDPI and/or the editor(s) disclaim responsibility for any injury to people or property resulting from any ideas, methods, instructions or products referred to in the content.