Article

On the Quasi-Steady Vorticity Balance in the Mature Stage of Hurricane Irma (2017)

by
Jasper de Jong
*,
Aarnout J. van Delden
and
Michiel L. J. Baatsen
Institute for Marine and Atmospheric Research Utrecht, Princetonplein 5, 3584 CC Utrecht, The Netherlands
*
Author to whom correspondence should be addressed.
Atmosphere 2025, 16(10), 1146; https://doi.org/10.3390/atmos16101146
Submission received: 26 August 2025 / Revised: 25 September 2025 / Accepted: 26 September 2025 / Published: 29 September 2025
(This article belongs to the Section Meteorology)

Abstract

Vorticity budgets in traditional height or pressure coordinates are commonly examined to help explain how tropical cyclones evolve over time. One disadvantage of using these coordinates is that the vorticity flux due to diabatic heating cannot be easily assessed. Isentropic coordinates naturally lend themselves to determine the effect of diabatic heating—the vorticity budget simplifies, and a clear-cut distinction can be made between adiabatic (advective) and diabatic vorticity fluxes. Above the boundary layer, advective vorticity fluxes alone would lead to a quick spin-down of the mature tropical cyclone. Do diabatic processes prevent this from happening? If so, how? This paper investigates the vorticity budget of Hurricane Irma (2017) in its mature quasi-steady phase. We analyse a simulation of Irma with an operational high-resolution weather forecasting model. During Irma’s remarkably long period (37 h) of steady peak intensity, the radially outward advective isentropic vorticity flux in the eyewall above the boundary layer is balanced by a radially inward diabatic isentropic vorticity flux. Frictional effects and asymmetrical flow properties are of little importance to the maintenance of cyclone intensity in its mature phase, provided enough latent heat is released in the eyewall to maintain an inward vorticity flux that balances the advective flux.

1. Introduction

The intensity of a cyclone is measured in terms of the vertical component of the curl of the velocity vector, or vorticity. This paper investigates the mechanisms that maintain the high vorticity in the core of the exceptionally intense and long-lived Hurricane Irma (2017). In early September 2017, Hurricane Irma approached the Northern Leeward Islands (Figure 1a). After a three-day period of having 50 m s−1 maximum 1 min sustained winds, Irma intensified to its peak intensity of 80 m s−1 1 min sustained winds in less than two days [1]. Irma’s peak intensity lasted about 37 h (Figure 1b). Irma was the first tropical cyclone, globally, to persist for so long at this intensity. It generated the most accumulated cyclone energy during a period of 24 h ever recorded in the Atlantic basin. Irma was a category 5 hurricane on the Saffir–Simpson scale for 72 consecutive hours, the longest for an Atlantic hurricane in the satellite era. Irma made seven landfalls, four of which as a category 5 hurricane, making Irma one of the costliest hurricanes ever in the Atlantic basin.
Recently, Torgerson et al. [4] investigated the mechanisms that caused the rapid intensification of Irma. The present study evaluates the vorticity balance of Hurricane Irma during its quasi-steady peak intensity stage. During the time of its peak intensity, lasting about 37 h, Irma’s vorticity field was manifest roughly as a steady ring of very high vorticity, coinciding approximately with the radius of maximum wind velocity (Figure 2). What mechanisms maintained this vorticity distribution in an approximate steady state for so many hours? This is not a trivial question. The radial component of the wind in the region of peak vorticity in Irma was divergent over the full depth of the hurricane, except in the relatively thin inflow boundary layer near the earth’s surface (Figure 2a). The consequent outward advective vorticity flux above this thin boundary layer should then lead to a rapid reduction of hurricane intensity. What inward vorticity fluxes compensated for the outward advective vorticity flux? This paper identifies this vorticity flux in an isentropic coordinate reference frame.
Much previous work exists that evaluates the vorticity budget of hurricanes. However, all studies are based on the vorticity equation, mostly not in the flux form, in either height or pressure coordinates (e.g., [5,6,7,8,9,10]). The vorticity equation in the traditional physical height coordinate system (e.g., Equation (3) in [6]) is relatively complicated, because it contains a solenoidal term, also referred to as the “baroclinic generation term”. This term cannot be neglected in the eyewall of a tropical cyclone, which is precisely the region of interest, because vorticity peaks in the eyewall (Figure 2). Furthermore, the solenoidal term does not appear as a vorticity flux in the vorticity equation. Remarkably, the solenoidal term is absent in the vorticity equation in both isobaric coordinates and isentropic coordinates. Moreover, both isobaric surfaces and isentropic surfaces are impermeable to vorticity fluxes (Equations (2.4) and (6.1) in [11]). Therefore, the vorticity flux has no vertical component in these coordinate systems. The choice, here, in favour of isentropic coordinates over isobaric coordinates is motivated by the possibility of making a distinction between the contributions of adiabatic and diabatic processes to the vorticity budget in isentropic coordinates, which is very relevant for the understanding of tropical cyclone dynamics. A drawback of both the isobaric and the isentropic coordinate systems is that we must accept the hydrostatic approximation, but we are no exception in this. A possible drawback of evaluating the vorticity budget in isentropic coordinates is the need to determine the diabatic heating, θ ˙ (defined in Equation (4)), which is not standard output of an operational weather forecasting model. To the best of our knowledge, there has been no research of the vorticity budget of hurricanes in isentropic coordinates.
The remainder of this article is structured in the following order. In Section 2, theoretical details on the vorticity budget are provided. Section 3 describes the model and simulation of Irma and gives an overview of the important model output analysis methods, including an explanation of the method to determine d θ / d t . Section 4 validates the model simulation of Irma with observations. Section 5 analyses the simulated steady state vorticity budget of the mature phase of Irma. Finally, Section 6 discusses the results and summarises the important conclusions of this research.

2. Vorticity Budget in Isentropic Coordinates

According to Haynes and McIntyre [11,12], the local time rate of change of absolute vorticity, η , in isentropic coordinates is determined by the divergence of the vorticity flux vector, J , as follows (Equation (2.4) in [11]):
η t = · J .
The divergence vector, , in Cartesian (x, y, θ )-space is defined as
x , y , θ .
Potential temperature is defined as
θ T p ref p κ ,
where T is temperature, p is pressure, p ref is a reference pressure (1000 hPa), and κ R / c p , with R the specific gas constant for dry air and c p the specific heat of air at constant pressure. The diabatic heating is defined as
θ ˙ d θ d t .
The vorticity flux vector, J , is given by
J = u η + θ ˙ v θ , v η θ ˙ u θ , 0 ,
where u and v are the x (eastward) and y (northward) component of the velocity, respectively. The most remarkable aspect of Equation (5) is that the vorticity flux has no cross-isentropic (vertical) component. This is the case even in the presence of diabatic heating, or diabatic cooling, and frictional forces of any kind.
Equation (1) is applied to a cyclone. Accelerations due to cyclone track curvature are neglected. Cylindrical coordinates are adopted with the origin coinciding with the cyclone centre. Assuming that the cyclone is axisymmetric, absolute vorticity is expressed as
η = f + ζ = f + 1 r r v t r θ ,
where r is the radial distance to the time-dependent geographical position of the cyclone centre, defined more precisely in Section 3.3. Furthermore, f is the planetary vorticity, ζ is the relative vorticity, and v t is the storm-relative tangential wind velocity, positive if the motion is anticlockwise, or cyclonic in the Northern Hemisphere.
The radial component of the vorticity flux vector is given by
J r = v r η θ ˙ v t θ + J res J a + J h + J res ,
which is a slight modification of Equation (9) in Delden [13]. The first two terms on the r.h.s. of Equation (7) are, respectively, the advective and diabatic parts of the radial isentropic vorticity flux. v r is the storm-relative radial wind velocity and J res is the residual radial vorticity flux needed to close the vorticity budget. We assume that the residual flux is mostly determined by turbulent momentum transfer, although also any other body force and inaccuracies in determining the advective and diabatic vorticity fluxes are reflected in the residual vorticity flux. Because the divergence of the azimuthal component of the vorticity flux is zero in an axisymmetric cyclone, the time rate of change of the vorticity is determined only by the divergence of the radial component of the vorticity flux, i.e.,
η t = 1 r r J r r θ .

3. Materials and Methods

3.1. Model and Simulation

The data used in this study has been produced by the non-hydrostatic HIRLAM ALADIN Research on Mesoscale Operational NWP in Euromed (HARMONIE) model, cycle 38h1.2, a numerical weather prediction (NWP) operated by the Royal Netherlands Meteorological Institute. It has a horizontal grid resolution of 3.2 km and a total of 65 vertical levels with a model top at 10 hPa. The forecast was initialised and forced at the boundaries of the domain with data from the European Centre for Medium-Range Weather Forecasts (ECMWF) Integrated Forecast System (IFS) cycle 43r3 operational archive data, including all observations operationally available until the start of the simulation. Sea surface temperature is kept fixed and is shown in Figure S1. The simulation period starts at 5 September 2017, 12Z and lasts 36 h (Figure 1b), with output stored at hourly frequency. The horizontal model domain, indicated in Figure 1a, consists of 989 × 629 grid points. HARMONIE is equipped with the HARATU turbulence scheme [14]. This scheme uses a vertically integrated length scale definition that takes into account moist stability, a factor that is vital in hurricane intensification [15]. Recent improvements to this scheme have been reported by Bengtsson et al. [16] and de Rooy et al. [17]. HARMONIE makes use of the ICE3 bulk microphysics scheme [18], discerning three ice categories: ice crystals, snow, and graupel.
HARMONIE has been developed mostly for weather prediction in Europe. As pointed out by Romdhani et al. [19], the physical parametrisations in these NWP models might not be fully suited for a hurricane environment. Therefore, it remains important to assess whether HARMONIE is able to accurately predict the dynamical and thermodynamical structure of Irma. The model employs a purely hydrodynamical framework; magnetohydrodynamic effects (see, e.g., [20]) on mature vortex vorticity maintenance remain uncertain.

3.2. Vertical Interpolation

The data provided on hybrid sigma-pressure model levels are interpolated vertically to 55 isentropic levels, ranging from 295 K to 800 K and distributed in a similar fashion to the hybrid model levels. Note that only five isentropes are located above 400 K.
The interpolation scheme is a slightly adapted version of the procedure outlined by Edouard et al. [21]. From the top level downward, a variable F within two hybrid levels 0, 1 (increasing from top downward) is interpolated to some intermediate potential temperature θ level in ln θ -coordinates using
F ( θ ) = l n ( θ / θ 0 ) l n ( θ 1 / θ 0 ) ( F 1 F 0 ) + F 0 .
To ensure the monotonic increase of potential temperature with height and prevent spurious values of isentropic density, defined in Equation (10), in statically near-neutral or unstable regions, model levels 0 and 1 must satisfy the criterion θ 1 θ 0 p 1 p 0 θ p c r i t = 2 × 10 4 K Pa 1 locally. If the criterion is not met, level 1 is replaced by the first (lower) level above the surface for which the criterion with respect to the last valid level is met. Especially in the boundary layer, where θ often decreases with height, the criterion may never be reached and all data below the lowest stable layer are disregarded. This procedure effectively lowers the vertical resolution in regions of low static stability. By doing so, we prevent large deviations from hydrostatic balance. Concerns on the validity of the impermeability of isentropic surfaces to η in regions where θ does not increase with height [22] are deemed irrelevant when applying this level selection in the vertical interpolation procedure.

3.3. Hurricane Centre Definition

The time-dependent hurricane centre is determined by a minimum azimuthal variance approach using sea level pressure. Azimuthal variance is taken to be the variance of section-mean sea level pressure from eight identical (triangular) sections in a 41 × 41 square of grid points centred at some candidate point. The candidate points are all grid points located within a 21 × 21 square of grid points centred at the minimum sea level pressure location. The candidate point with the least azimuthal variance is selected for the hurricane centre location.

3.4. Diabatic Heating

The diabatic term in Equation (5) depends on the diabatic heating rate, which is not directly available in the dataset. Diabatic heating is estimated by applying the continuity equation in isentropic coordinates. The isentropic density, σ , assuming hydrostatic balance, is
σ = 1 g p θ ,
where g is the acceleration due to gravity.
The continuity Equation (similar to Equation (2.13) in [11]) is given by
σ t + h · σ v + σ θ ˙ θ = 0 ,
where v is the wind vector and the second term on the left-hand side represents the horizontal divergence of the isentropic mass flux, σ v . Equation (11) is integrated downward from θ m a x = 800 K , where the cross-isentropic mass flux, σ θ ˙ , is taken to be zero. The diabatic heating rate is then given by
θ ˙ ( θ ) = 1 σ ( θ ) θ m a x θ σ t + h · σ v d θ .
To accurately obtain the vertical cross-isentropic mass flux differences, the integrand of Equation (12) is evaluated on staggered vertical levels by using linearly interpolated winds for the divergence term. An extension for the boundary layer is made by adding modelled 10 m winds and 2 m potential temperature below the lowest isentropic level that is above the surface, and calculating θ ˙ similarly for this additional layer. The available output time step of one hour introduces a source of error in the σ tendency term of Equation (12), which may be reduced in future studies.

3.5. Vorticity Flux Integration

The tendency of volume-integrated isentropic absolute vorticity can be expressed by the closed area integral over the control volume of the horizontal vorticity flux, J ([13], Equation (10)). Because this flux has no cross-isentropic component, a vorticity anomaly can only be created by horizontal convergence of J . Choosing a cylindrical control volume, V, concentric with the hurricane axis, the corresponding vorticity tendency equation is
d d t V η d V = A J r r ^ · n ^ d A ,
where A is the control surface enclosing V and r ^ and n ^ denote the radial unit vector and unit vector normal to A, respectively. The integration needs to be performed over the lateral surface area of the control volume only.

4. Model Validation

Aircraft measurements were made from 5 September 2017 17:43 until 6 September 2017 02:51 UTC on board of one of the Lockheed WP-3D Orion Hurricane Hunter aircraft operated by the NOAA. The aircraft made four passages through the eye of Irma at constant pressure altitude.
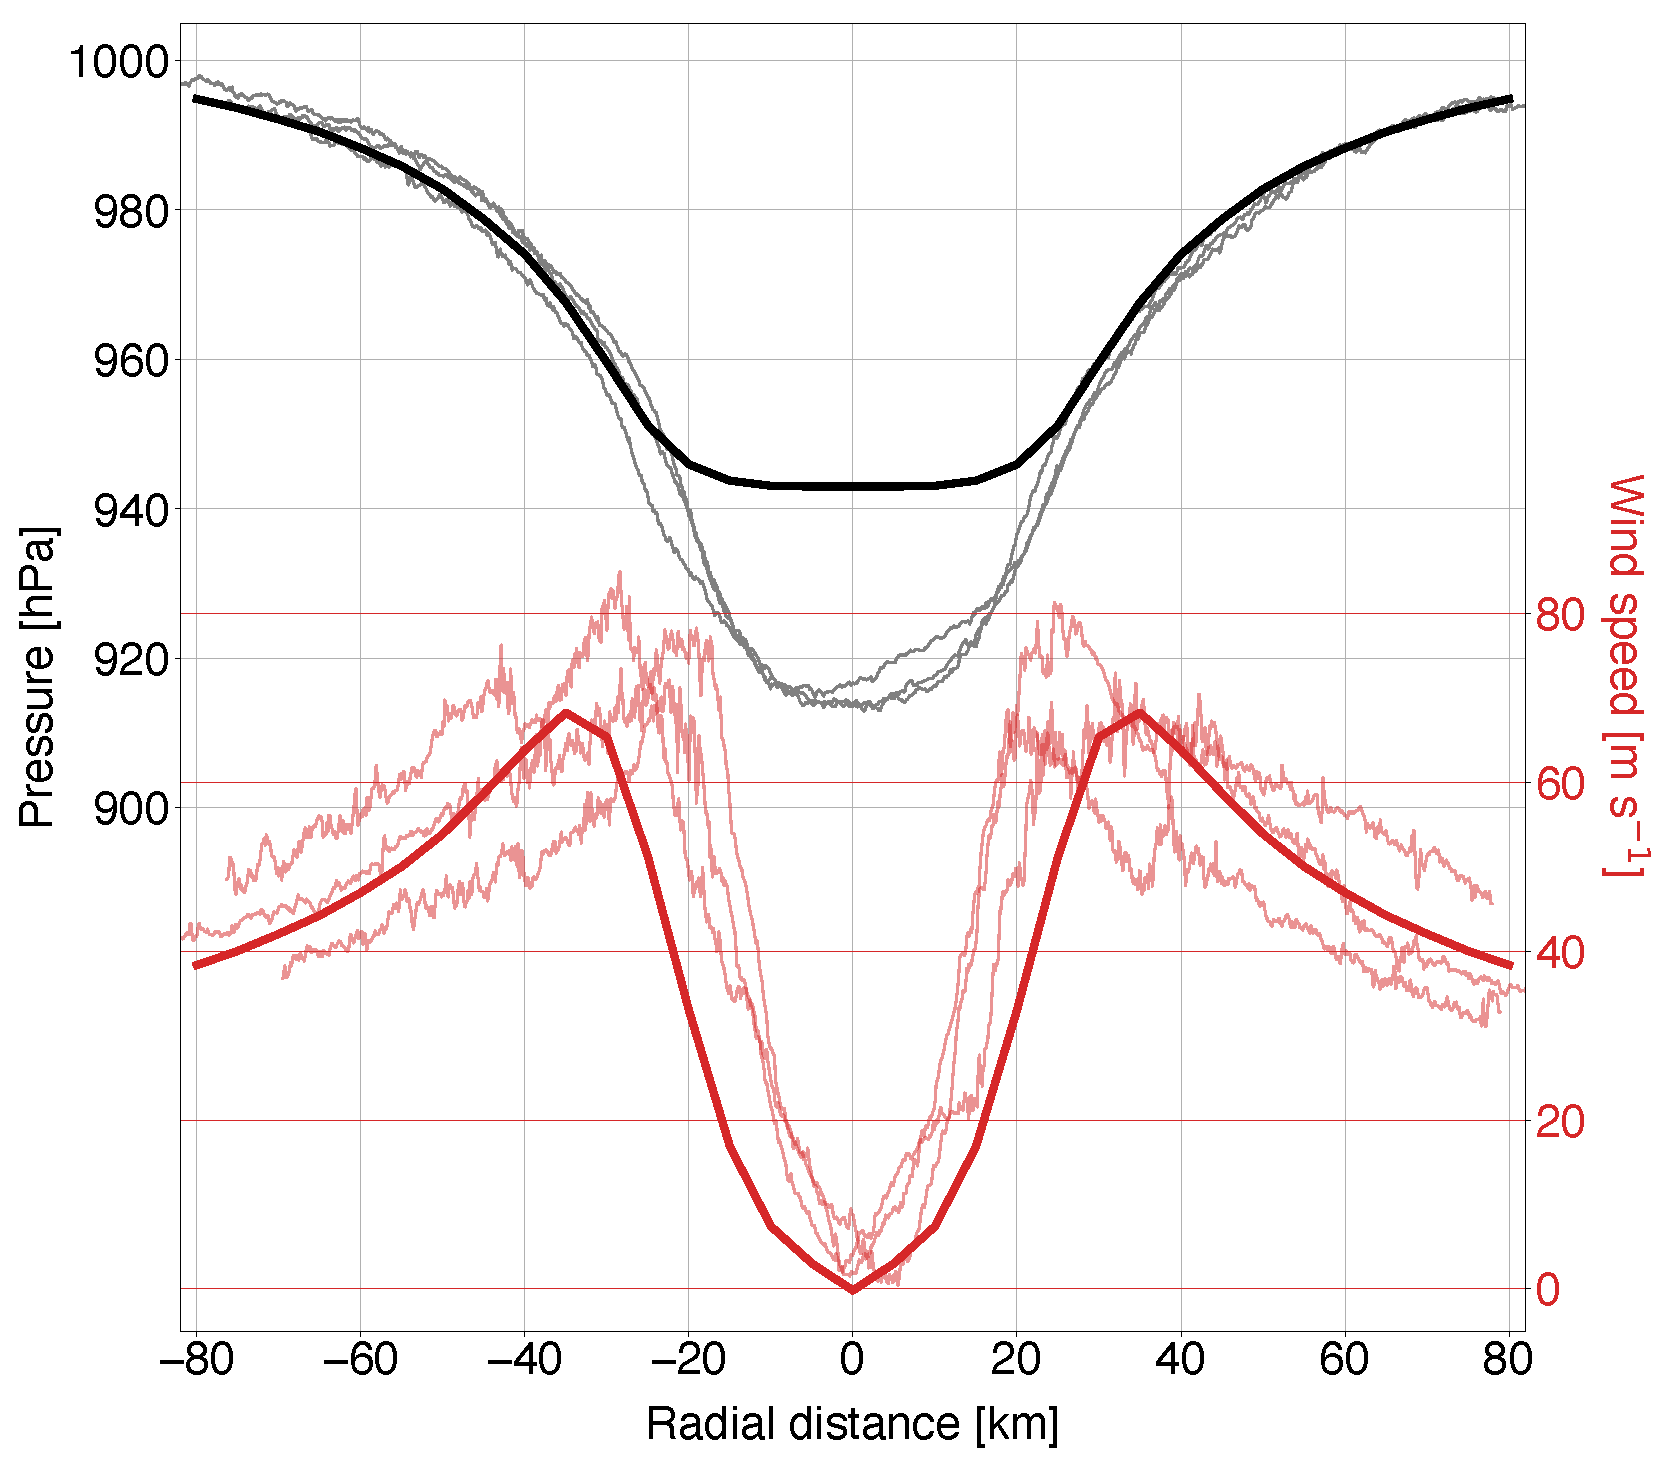
Figure 3 shows the extrapolated sea level pressure and wind speed derived from flight observations and those modelled by HARMONIE. The radial pressure profile of HARMONIE is in close agreement with observations in the eyewall and beyond. Only within 25 km from the centre is the pressure overestimated. The central sea level pressure is overestimated by more than 25 hPa. From the wind profile we can see that HARMONIE underestimates the wind in the inner core region up to the outside of the eyewall. The maximum wind is therefore slightly underestimated as well. The inaccuracy in sea level pressure and wind in the inner-eye region is likely a result of the IFS model initialisation, which the model is not able to correct within the duration of the simulation. Because the inner-eye region does not affect the eyewall vorticity strongly, we consider the pressure and wind profiles to be sufficient for our analyses. To gain full confidence, we also compare the modelled vorticity with observations.
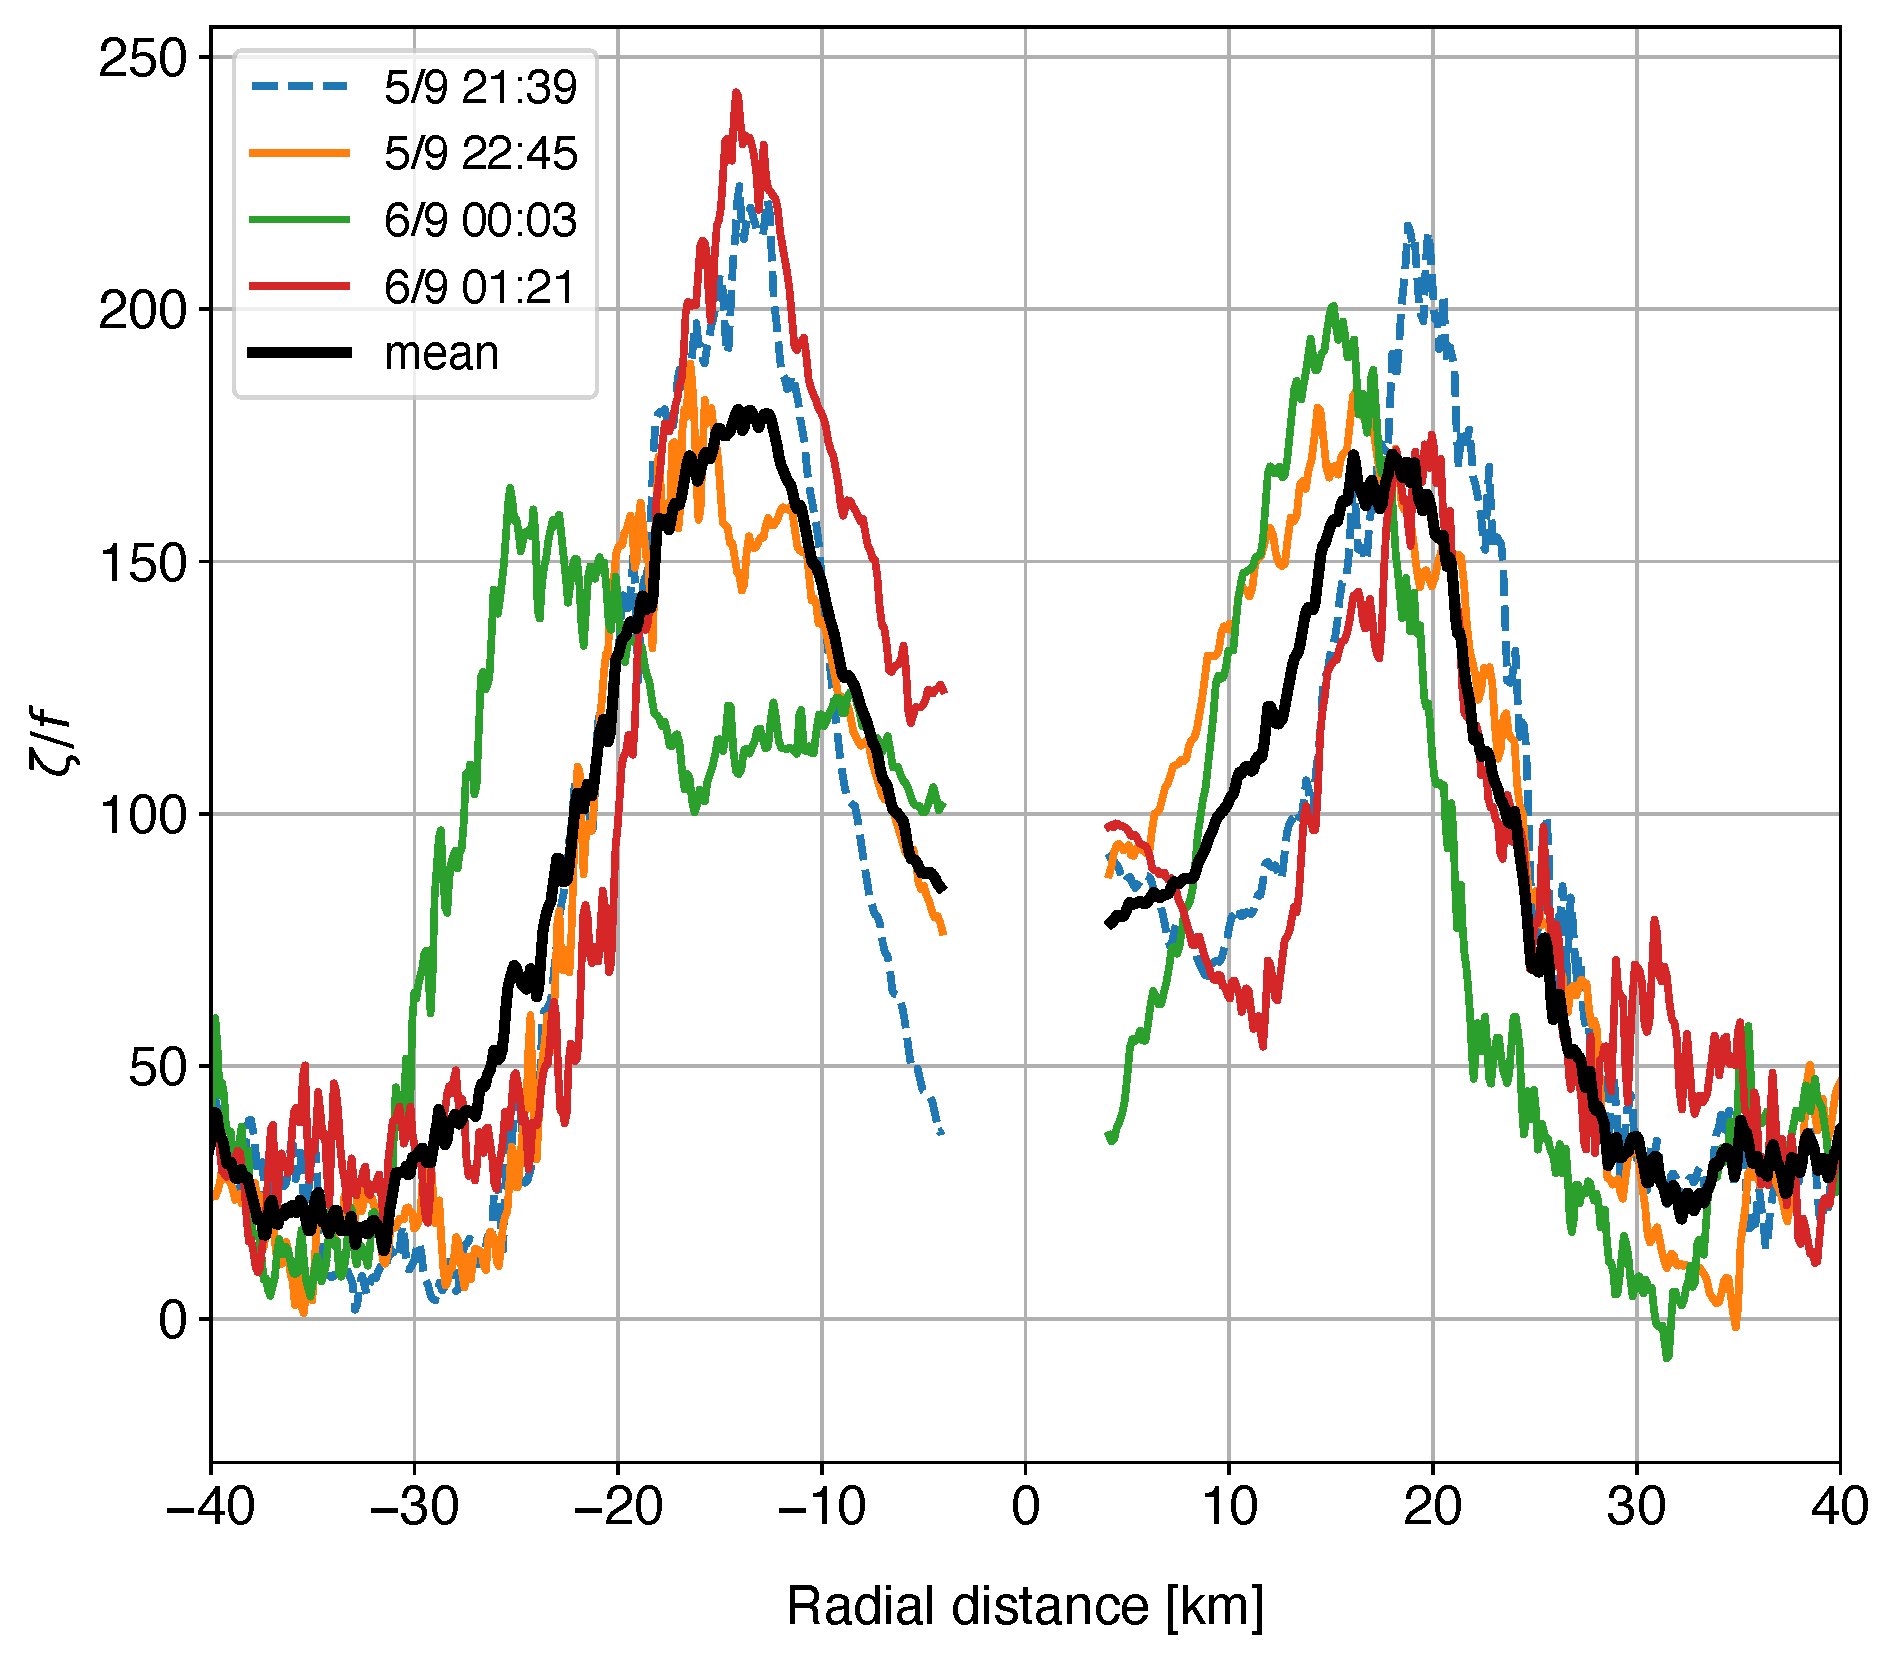
Modelled relative vorticity agrees quite well with observations (Figure 4). From a dynamical point of view, Hurricane Irma presents an interesting case as it exhibits an hollow vorticity tower (HVT) structure [23] throughout its period of peak intensity. The radius of maximum relative vorticity is located inside the radius of maximum wind (Figure 3 and Figure 4). The HVT structure is not trivial, as observations show that (major) steady-state hurricanes tend to have monopolar vorticity structures, while HVTs are associated with intensifying hurricanes [24,25,26].
The modelled absolute vorticity profile, shown in Figure 2a, has a maximum located on the inner side of the eyewall, which is contained roughly within the 2 m s 1 isotach of radial velocity up to the high-level outflow region. This is a feature mostly observed in intensifying hurricanes [25]. Contours of radial velocity, v r , confirm that the air on average diverges from the centre, especially in the eyewall and upper-level outflow region. Isentropic surfaces indicate the extent of the warm core and a region of low static stability at 360–370 K in the eye region. Figure 2b shows lower troposphere mean absolute vorticity along a zonal cross section through the cyclone centre as the simulation progresses. The lower troposphere region and time-averaging period for Figure 2 are chosen to focus on the clear HVT structure. We recognise an initial start-up time of four hours, during which the monopolar vorticity structure at the start of the simulation transforms into an HVT that remains in a stationary state throughout the remaining 32 h of the simulation. During the run, the radius of maximum vorticity fluctuates with a typical period of 4–6 h, presumably due to vortex Rossby waves [27]. The intensity of Hurricane Irma is considered stationary enough to serve as an example of a steady-state mature vortex. The long period of quasi-steady intensity of Irma was supported by high sea surface temperature (Figure S1), abundant mid-tropospheric moisture (Figure S2) and high (> 10 m s 1 ) wind shear occurring only on the right quadrants with respect to the cyclone motion (Figure S3).

5. Results: Vorticity Budget of Irma

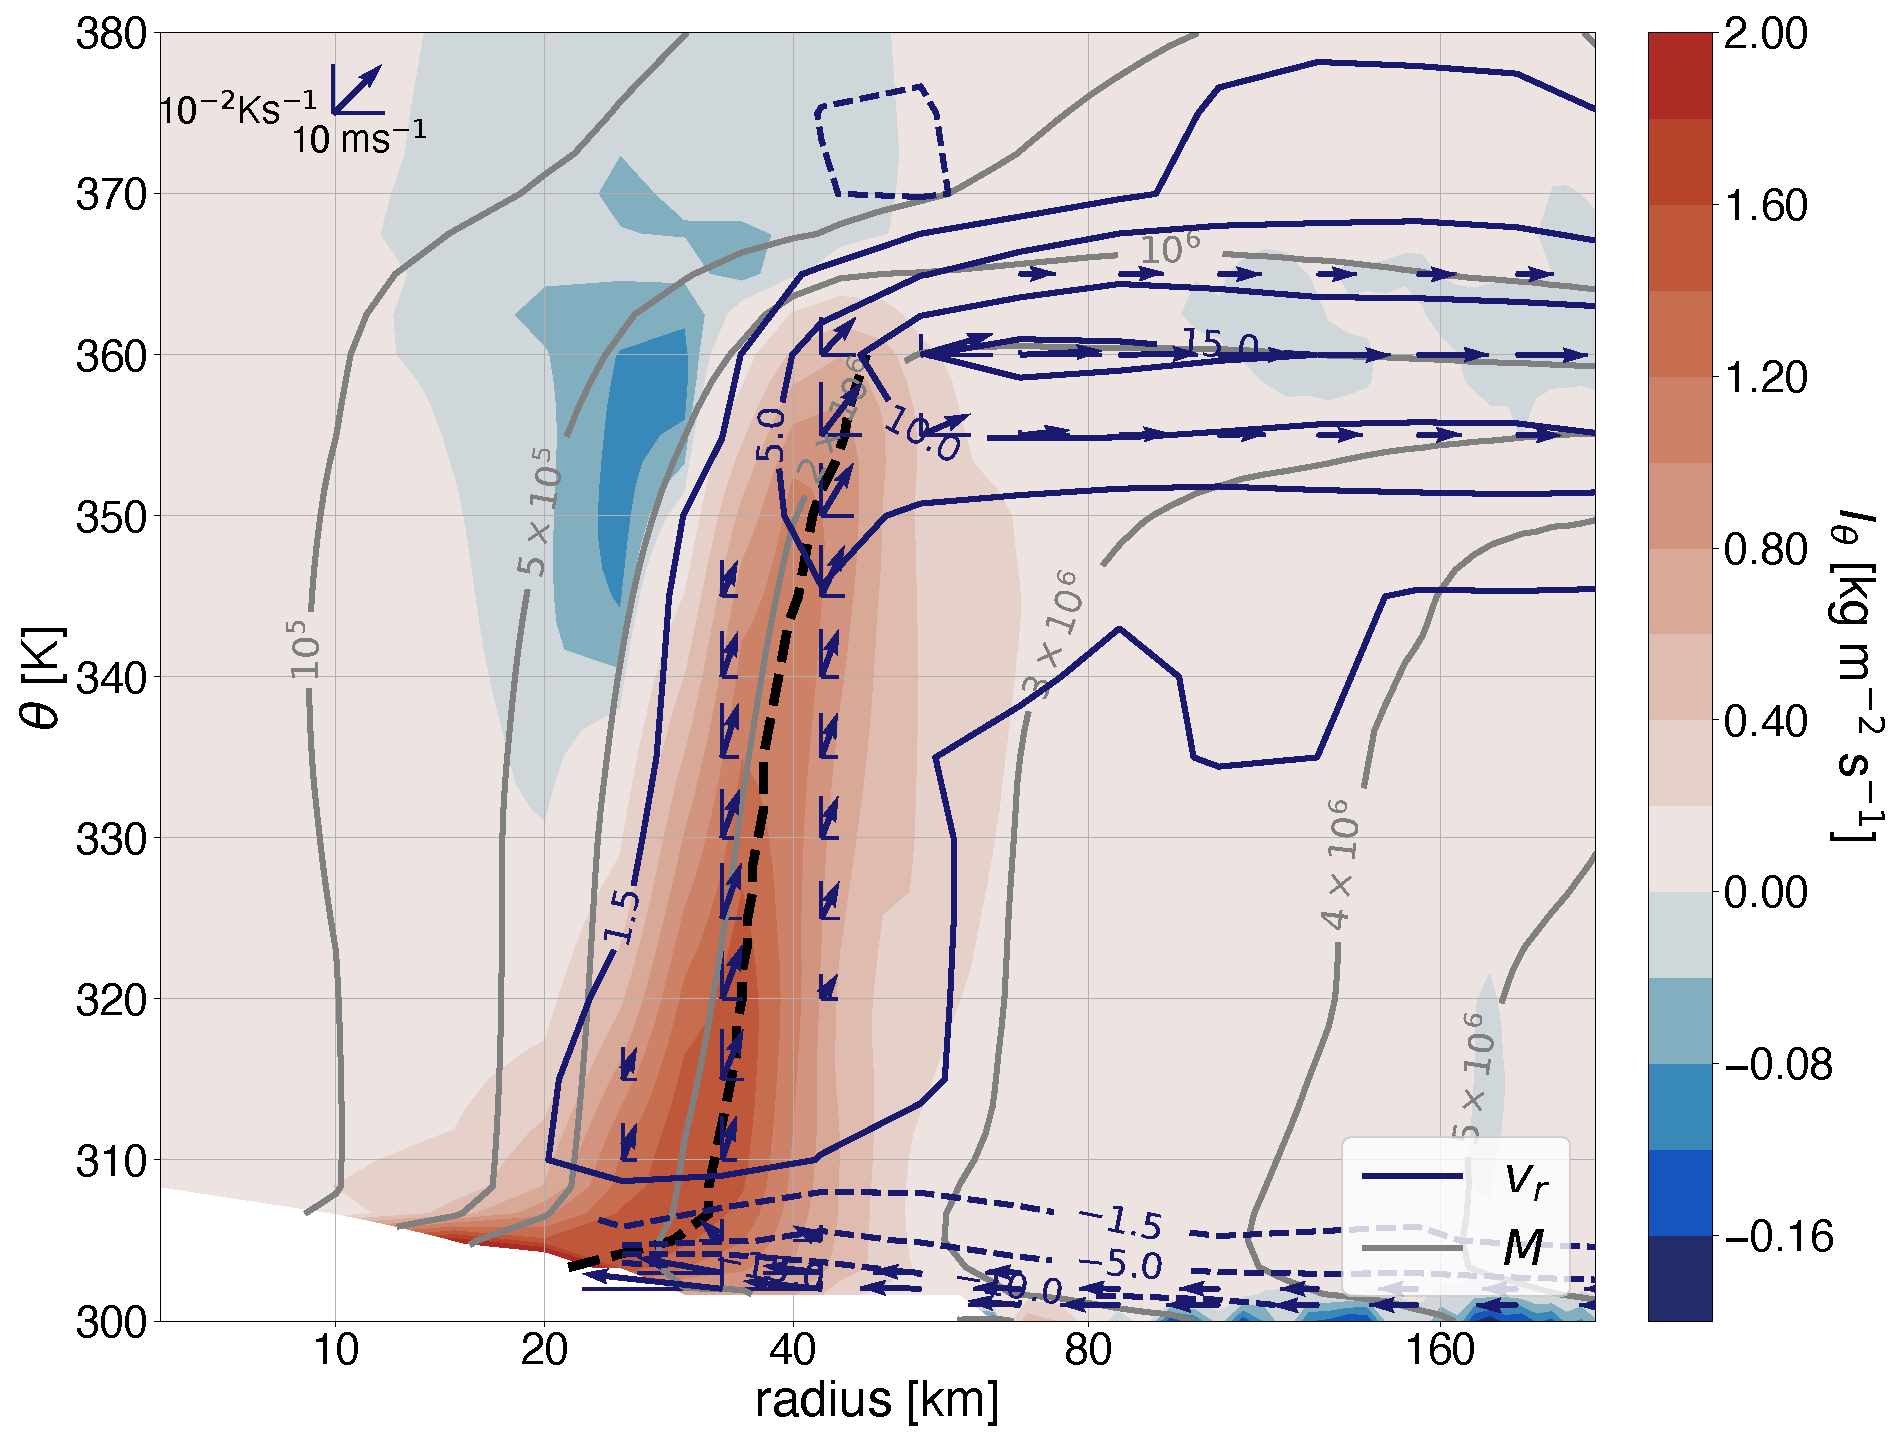
The diabatic heating, calculated using Equation (12), is multiplied by σ to obtain the cross-isentropic mass flux (Figure 5). A transverse velocity vector is constructed from the diabatic heating and scaled radial velocity (see caption), which visualises the secondary circulation in isentropic coordinates. The cross section in Figure 5 clearly shows a secondary circulation, consisting of a shallow inflow layer near the surface, cross-isentropic upwelling in the eyewall and a relatively shallow outflow layer at greater height. Entrainment of dry subsiding lower-stratospheric air most likely causes the pattern of diabatic cooling along the inside of the slanting upper-eyewall region.
Above the boundary layer, the advective isentropic vorticity flux in the eyewall is radially outward (Figure 6a). In the absence of a counteractive inward vorticity flux, this would result in a decrease of η within the inner eyewall region and a spin-down of the vortex. However, the advective isentropic vorticity flux ( J a ) is counteracted by an approximately equal magnitude isentropic vorticity flux ( J h ) due to diabatic heating (Figure 6b). Outward advective fluxes are found in the eyewall where high absolute vorticity values coincide with regions of outward flow. Likewise, inward diabatic vorticity fluxes are present in the eyewall due to the coincidence of negative vertical wind shear and strong diabatic heating. The magnitudes of both the advective and diabatic isentropic vorticity fluxes show a low-level maximum around ( r = 30 km , θ = 312 K ), and a high-level maximum around ( r = 40 km , θ = 355 K ). The low-level maximum coincides with the top of the frictional boundary layer on the radially outward side of the absolute vorticity maximum at r = 20 km . The high-level maximum coincides with the lower portion of the outflow layer, where the vertical wind shear and radial outflow are strong.
While the advective and diabatic isentropic vorticity fluxes have an important and opposite effect on the vorticity tendency, the residual isentropic vorticity flux ( J res ), shown in Figure 6c, is considerably weaker and shows a different distribution. A high-level maximum of the residual flux is located in the upper portion of the high-level outflow layer close to the eyewall and coincides with the high-level extrema in the advective and diabatic vorticity flux components. The maximum indicates that unresolved processes transport absolute vorticity outward across the eyewall. The residual vorticity flux is directed inward along the inside of the eyewall ( r < 32 km ), extending furthest to the hurricane centre at lower altitudes ( 315 K 330 K ). Therefore, unresolved processes sharpen the radial vorticity gradient inside the radius of maximum wind and extend the lower absolute vorticity maximum toward the cyclone centre. A minimum of the residual vorticity flux coincides with the low-level extrema of the advective and diabatic vorticity flux components. As the residual isentropic vorticity flux is relatively small, the maintenance of Irma’s vorticity structure results predominantly from a balance between the advective and diabatic vorticity fluxes.
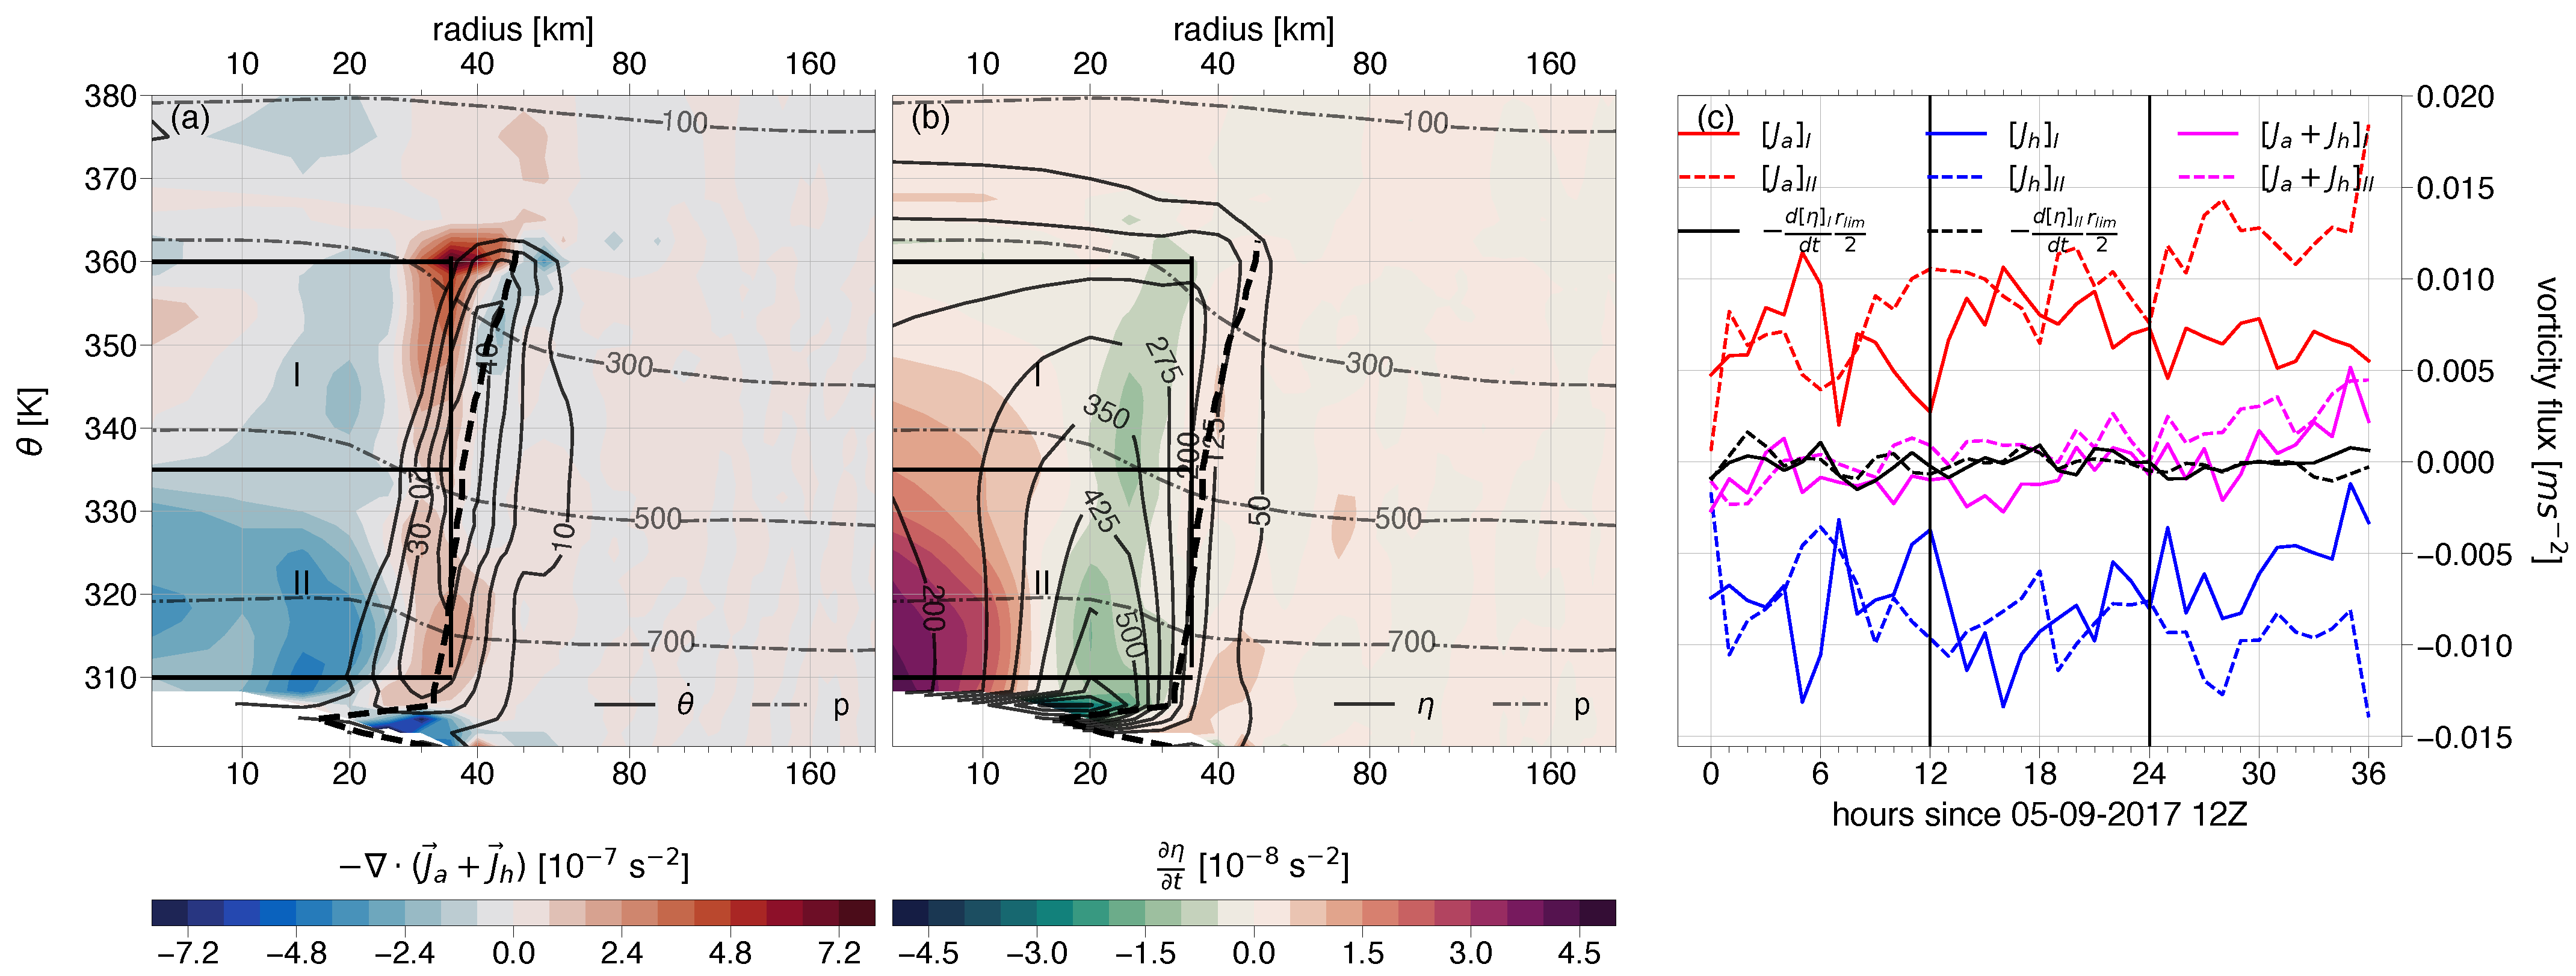
By Equation (1), the vorticity tendency has to be equal to the total vorticity flux convergence, i.e., the negative of the divergence. From the way the residual flux is constructed, this result is trivial. Therefore, we compare the convergence of the most important flux components, J a + J h , to the vorticity tendency (Figure 7a,b). The vorticity tendency is about an order of magnitude smaller than the convergence of the advective and diabatic vorticity flux. Consequently, the residual flux convergence is the inverse of the advective and diabatic vorticity flux convergence to first order. Though the advective and diabatic vorticity flux convergence is large compared to the absolute vorticity tendency, it is rather small compared to the convergence of the individual vorticity flux components (Figure S4), indicating that the advective and diabatic vorticity fluxes mostly cancel out over the indicated period. The high(low)-level advective vorticity flux maximum is slightly weaker (stronger) than the high(low)-level diabatic vorticity flux minimum (Figure 6), causing a dipole pattern in the vorticity flux divergence (Figure 7a). The advective and diabatic vorticity fluxes diverge in the eye region, especially at lower altitudes, mainly caused by the advective vorticity flux (Figure S4), but this weakening effect is counteracted by the residual flux to result in a strengthening of the lower-eye region (Figure 7b). Similarly, a strengthening effect of the advective and diabatic vorticity flux along the inner eyewall (inside the radius of maximum wind) is compensated by the residual flux resulting in a slight weakening.
To evaluate the balance between the advective and diabatic vorticity flux through time, the isentropic vorticity flux is integrated using Equation (13) over the area enclosing two cylindrical control volumes, which are shown in Figure 7a,b. The cylinder radii are chosen to coincide with the eyewall because the radial vorticity fluxes are largest in this region. Since there is no cross-isentropic flux of vorticity, the only flux component considered is the radial flux across the lateral boundary. The area-averaged advective and diabatic components of the radial vorticity fluxes are well balanced for both control volumes (Figure 7c). The sum of the area-averaged advective and diabatic vorticity fluxes is close to the expected vorticity flux given the vorticity tendency (black). The advective and diabatic vorticity fluxes fluctuate with time in an anticorrelated fashion. The Pearson’s correlation coefficients for the two fluxes are equal to 0.88 (volume I) and 0.80 (volume II). This strong anticorrelation indicates the balance between the advective and diabatic isentropic vorticity fluxes holds throughout the simulated period. The net vorticity flux seems to trend upward during the final hours of the simulation, perhaps marking the start of a weakening phase.
The advective and diabatic vorticity flux components are separated in axially symmetric and asymmetric (eddy) components to determine the relative contribution of axisymmetric flow to the strong balance between the advective and diabatic vorticity flux. The axisymmetric and eddy components of the advective vorticity flux are [ v r ] [ η ] and [ v r [ v r ] ] [ η [ η ] ] , respectively, where [ ] is the azimuthal averaging operator. Similarly, the axisymmetric and eddy components of the diabatic vorticity flux are [ θ ˙ ] [ v t θ ] and [ θ ˙ [ θ ˙ ] ] [ v t θ [ v t θ ] ] , respectively. Both the advective and diabatic vorticity fluxes are clearly dominated by the axisymmetric components (Figure 8a,b), suggesting that the advective and diabatic fluxes, which predominantly determine the evolution of Irma’s vorticity structure, are governed by the azimuthal-mean flow, not by eddy motions (Figure 8c,d). This suggests that as tropical cyclones become more axisymmetric, typically when they reach high intensities, as with Irma, the vortex intensity is increasingly sustained through the strong balance between the advective and diabatic vorticity flux components by the axisymmetric flow. This self-sustaining mechanism lasts as long as the diabatic heating is not disrupted by, e.g., landfall, strong windshear, dry air intrusion, or strong vertical stability.

6. Discussion and Conclusions

The extreme persistence of Hurricane Irma has created a valuable case for assessing the budget of isentropic absolute vorticity in an NWP model. By using isentropic coordinates, this budget takes a remarkably simple form. By the impermeability theorem, there is no net cross-isentropic vorticity flux. We have shown that, throughout Irma’s peak intensity stage:
  • The outward advective vorticity flux by the mean flow is counteracted by a mean inward vorticity flux due to diabatic heating;
  • The magnitudes of these fluxes are largest in the eyewall, and strongly anticorrelated in time;
  • The residual vorticity flux, assumed to be dominated by subhourly variations of the flow, has a small effect on the vorticity structure, indicating the importance of the advective and diabatic vorticity fluxes for maintaining the steady state;
  • Both the advective and diabatic vorticity fluxes result from the azimuthal-mean flow and are not eddy-driven.
We conclude that the vorticity tendency during the remarkably long quasi-steady period of peak intensity of Hurricane Irma is governed by a close balance between the outward radial advective vorticity flux and the inward radial vorticity flux associated with diabatic heating term in the axisymmetric flow. The strong anticorrelation between the magnitudes of these fluxes indicates the fast adjustment of the flow to thermal wind balance, which is possible due to the high inertial stability. This is supported by the well-known fact that gradient wind balance is a good approximation to the azimuthal-mean flow in hurricanes above the boundary layer [28]. The residual (turbulent) flux plays a minor role. The fact that the advective and diabatic vorticity fluxes are mostly governed by their azimuthal-mean components is related to the high degree of symmetry in Irma [29].

Supplementary Materials

The following supporting information can be downloaded at: https://www.mdpi.com/article/10.3390/atmos16101146/s1, Figure S1: Sea surface temperature (shaded) and mean sea level pressure (contours, in hPa). The forecast hour is identical to that of the modelled rain shown in Figure 1 of the manuscript. The dashed black line represents the modelled track.; Figure S2: Modelled midtropospheric relative humidity. The midtropospheric relative humidity is calculated as the mass-weighted mean between 320 K and 350 K of the relative humidity calculated using Teten’s formula, e sat = 610.78 · exp ( 17.27 · T C / ( T C + 237.3 ) ) , where e sat is the saturation vapour pressure and T C is the temperature in degrees Celsius. The dashed black line represents the modelled track.; Figure S3: Modelled absolute vertical wind shear between 200 hPa and 850 hPa. The dashed black line represents the modelled track.; Figure S4: As Figure 7a, but showing the convergence of the advective (a), diabatic (b), residual (c) and sum of advective and diabatic (d) vorticity flux components.

Author Contributions

Conceptualisation, J.d.J., A.J.v.D. and M.L.J.B.; methodology, J.d.J.; software, J.d.J.; validation, J.d.J.; formal analysis, J.d.J.; investigation, J.d.J.; writing—original draft preparation, J.d.J.; writing—review and editing, J.d.J., A.J.v.D. and M.L.J.B.; visualisation, J.d.J.; supervision, A.J.v.D. and M.L.J.B.; project administration, M.L.J.B.; funding acquisition, M.L.J.B. All authors have read and agreed to the published version of the manuscript.

Funding

This research was funded by the Dutch Ministry of Education, Culture and Science grant number 16604027 (Van Meenen).

Institutional Review Board Statement

Not applicable.

Informed Consent Statement

Not applicable.

Data Availability Statement

Dataset available on request from the authors. Averaged data and analysis code are provided at https://doi.org/10.5281/zenodo.16949581.

Acknowledgments

We would like to thank Sander Tijm for sharing model output with us. We also want to thank Claudia Wieners and Guus Velders for delivering valuable feedback on the writing.

Conflicts of Interest

The authors declare no conflicts of interest. The funders had no role in the design of the study; in the collection, analyses, or interpretation of data; in the writing of the manuscript; or in the decision to publish the results.

Abbreviations

The following abbreviations are used in this manuscript:
ECMWFEuropean Centre for Medium-Range Weather Forecasts
HARMONIEHIRLAM ALADIN Research on Mesoscale Operational NWP in Euromed
HVThollow vorticity tower
IFSIntegrated Forecast System
NWPnumerical weather prediction

References

  1. Cangialosi, J.P.; Latto, A.S.; Berg, R. National Hurricane Center Tropical Cyclone Report: Hurricane Irma; National Hurricane Center: Miami, FL, USA, 2018; pp. 1–111.
  2. Barcikowska, M.; Feser, F.; von Storch, H. Usability of Best Track Data in Climate Statistics in the Western North Pacific. Mon. Weather. Rev. 2012, 140, 2818–2830. [Google Scholar] [CrossRef]
  3. NOAA National Geophysical Data Center. 2-Minute Gridded Global Relief Data (ETOPO2) v2. 2006. Available online: https://www.ncei.noaa.gov/access/metadata/landing-page/bin/iso?id=gov.noaa.ngdc.mgg.dem:301 (accessed on 8 July 2025).
  4. Torgerson, W.; Schwendike, J.; Ross, A.; Short, C.J. Intensity fluctuations in Hurricane Irma (2017) during a period of rapid intensification. Weather. Clim. Dyn. 2023, 4, 331–359. [Google Scholar] [CrossRef]
  5. Fang, J.; Zhang, F. Initial Development and Genesis of Hurricane Dolly (2008). J. Atmos. Sci. 2010, 67, 655–672. [Google Scholar] [CrossRef]
  6. Raymond, D.J.; López Carrillo, C. The vorticity budget of developing typhoon Nuri (2008). Atmos. Chem. Phys. 2011, 11, 147–163. [Google Scholar] [CrossRef]
  7. Rantanen, M.; Räisänen, J.; Sinclair, V.A.; Lento, J. The extratropical transition of Hurricane Ophelia (2017) as diagnosed with a generalized omega equation and vorticity equation. Tellus A Dyn. Meteorol. Oceanogr. 2020, 72, 1721215. [Google Scholar] [CrossRef]
  8. DesRosiers, A.J.; Bell, M.M.; Cha, T.Y. Vertical Vortex Development in Hurricane Michael (2018) during Rapid Intensification. Mon. Weather. Rev. 2022, 150, 99–114. [Google Scholar] [CrossRef]
  9. Kumar, S.; Verma, S.; Lodh, A. Unravelling the dynamical characteristics of tropical cyclones: Amphan and Nisarga using ERA5 reanalysis. Front. Environ. Sci. 2025, 12, 1475324. [Google Scholar] [CrossRef]
  10. Paul, D.; Panda, J.; Bhasi, I.; Routray, A. A numerical modeling study on highly intensified tropical cyclones of North Indian Ocean using MPAS-A. Nat. Hazards 2025, 121, 15413–15441. [Google Scholar] [CrossRef]
  11. Haynes, P.H.; McIntyre, M.E. On the Evolution of Vorticity and Potential Vorticity in the Presence of Diabatic Heating and Frictional or Other Forces. J. Atmos. Sci. 1987, 44, 828–841. [Google Scholar] [CrossRef]
  12. Haynes, P.H.; McIntyre, M.E. On the Conservation and Impermeability Theorems for Potential Vorticity. J. Atmos. Sci. 1990, 47, 2021–2031. [Google Scholar] [CrossRef]
  13. Delden, A.V. Adjustment to heating, potential vorticity and cyclogenesis. Q. J. R. Meteorol. Soc. 2003, 129, 3305–3322. [Google Scholar] [CrossRef]
  14. Lenderink, G.; Holtslag, A.A.M. An updated length-scale formulation for turbulent mixing in clear and cloudy boundary layers. Q. J. R. Meteorol. Soc. 2004, 130, 3405–3427. [Google Scholar] [CrossRef]
  15. Zhu, P.; Hazelton, A.; Zhang, Z.; Marks, F.D.; Tallapragada, V. The Role of Eyewall Turbulent Transport in the Pathway to Intensification of Tropical Cyclones. J. Geophys. Res. Atmos. 2021, 126, e2021JD034983. [Google Scholar] [CrossRef]
  16. Bengtsson, L.; Andrae, U.; Aspelien, T.; Batrak, Y.; Calvo, J.; de Rooy, W.; Gleeson, E.; Hansen-Sass, B.; Homleid, M.; Hortal, M.; et al. The HARMONIE–AROME Model Configuration in the ALADIN–HIRLAM NWP System. Mon. Weather. Rev. 2017, 145, 1919–1935. [Google Scholar] [CrossRef]
  17. de Rooy, W.C.; Siebesma, P.; Baas, P.; Lenderink, G.; de Roode, S.R.; de Vries, H.; van Meijgaard, E.; Meirink, J.F.; Tijm, S.; van ’t Veen, B. Model development in practice: A comprehensive update to the boundary layer schemes in HARMONIE-AROME cycle 40. Geosci. Model Dev. 2022, 15, 1513–1543. [Google Scholar] [CrossRef]
  18. Pinty, J.P.; Jabouille, P. A mixed-phase cloud parameterization for use in mesoscale non-hydrostatic model: Simulations of a squall line and of orographic precipitations. In Proceedings of the Conference on Cloud Physics, Everett, WA, USA, 17–21 August 1998; pp. 217–220. [Google Scholar]
  19. Romdhani, O.; Zhang, J.A.; Momen, M. Characterizing the Impacts of Turbulence Closures on Real Hurricane Forecasts: A Comprehensive Joint Assessment of Grid Resolution, Horizontal Turbulence Models, and Horizontal Mixing Length. J. Adv. Model. Earth Syst. 2022, 14, e2021MS002796. [Google Scholar] [CrossRef]
  20. Artekha, S.N.; Belyan, A.V. On the role of electromagnetic phenomena in some atmospheric processes. Nonlinear Processes Geophys. 2013, 20, 293–304. [Google Scholar] [CrossRef]
  21. Edouard, S.; Vautard, R.; Brunet, G. On the maintenance of potential vorticity in isentropic coordinates. Q. J. R. Meteorol. Soc. 1997, 123, 2069–2094. [Google Scholar] [CrossRef]
  22. Kieu, C.Q.; Zhang, D.L. Is the isentropic surface always impermeable to the potential vorticity substance? Adv. Atmos. Sci. 2011, 29, 29–35. [Google Scholar] [CrossRef]
  23. Shuang, L.; Wei, Z.; Ji-Chen, L.; Han-Cheng, L. The Contribution of Structure and Evolution of Potential Vorticity Tower to the Intensity Change of Hurricane Wilma (2005). Chin. J. Geophys. 2015, 58, 229–242. [Google Scholar] [CrossRef]
  24. Kossin, J.P.; Eastin, M.D. Two Distinct Regimes in the Kinematic and Thermodynamic Structure of the Hurricane Eye and Eyewall. J. Atmos. Sci. 2001, 58, 1079–1090. [Google Scholar] [CrossRef]
  25. Rogers, R.; Reasor, P.; Lorsolo, S. Airborne Doppler Observations of the Inner-Core Structural Differences between Intensifying and Steady-State Tropical Cyclones. Mon. Weather. Rev. 2013, 141, 2970–2991. [Google Scholar] [CrossRef]
  26. Martinez, J.; Bell, M.M.; Vigh, J.L.; Rogers, R.F. Examining Tropical Cyclone Structure and Intensification with the FLIGHT+ Dataset from 1999 to 2012. Mon. Weather. Rev. 2017, 145, 4401–4421. [Google Scholar] [CrossRef]
  27. Wang, Y. Vortex Rossby Waves in a Numerically Simulated Tropical Cyclone. Part I: Overall Structure, Potential Vorticity, and Kinetic Energy Budgets. J. Atmos. Sci. 2002, 59, 1213–1238. [Google Scholar] [CrossRef]
  28. García-Franco, J.L.; Schwendike, J. Revisiting gradient wind balance in tropical cyclones using dropsonde observations. Q. J. R. Meteorol. Soc. 2020, 147, 801–824. [Google Scholar] [CrossRef]
  29. Green, A.; Gopalakrishnan, S.G.; Alaka, G.J.; Chiao, S. Understanding the Role of Mean and Eddy Momentum Transport in the Rapid Intensification of Hurricane Irma (2017) and Hurricane Michael (2018). Atmosphere 2021, 12, 492. [Google Scholar] [CrossRef]
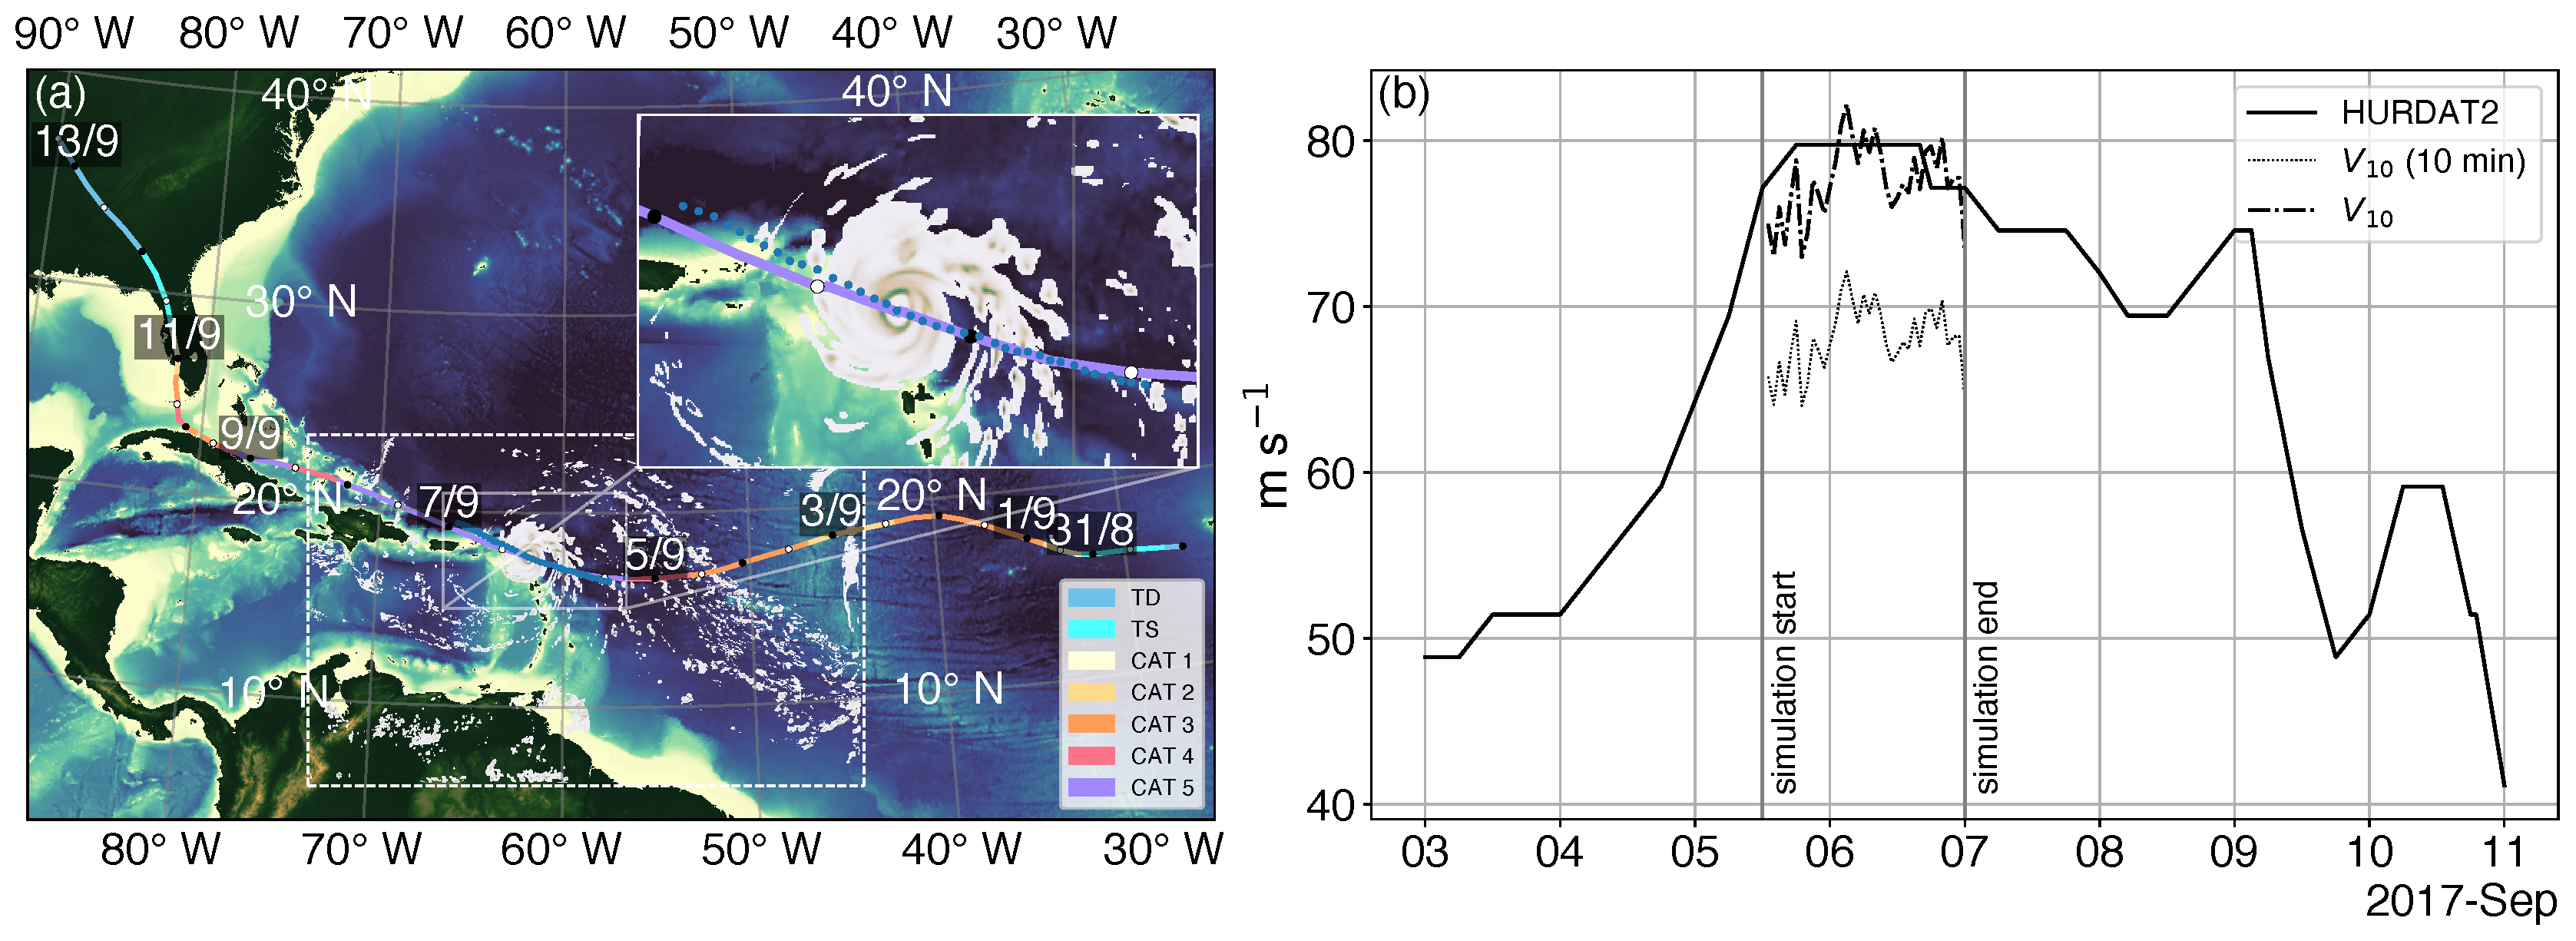
Figure 1. Track of Hurricane Irma and modelled rain intensity (a) and maximum 10 m wind (b). In panel (a), track colour indicates Saffir–Simpson categories for hurricane intensity based on HURDAT2. (Un)filled markers are placed at 12 (00) UTC each day. Within the model domain, indicated by the white dashed-border box, modelled instantaneous precipitation rate at 6 September 08:00 UTC is shown. The inset zooms in on the indicated area and additionally shows the modelled minimum surface pressure location for all saved output times. In panel (b), observed and modelled maximum 1 min sustained winds are shown from 3 to 11 September 2017. The modelled maximum 1 min sustained wind is calculated from the maximum 10 min sustained wind (thin dotted line) by multiplying with a correction factor of 1.14 [2]. Details of the simulation are described in Section 3.1. HURDAT2 best track data and ETOPO2 topography [3] are provided by the National Oceanic and Atmospheric Administration (NOAA).
Atmosphere 16 01146 g001
Figure 2. Azimuthal mean and lower-tropospheric mean zonal cross section of absolute vorticity, η (red shading) in Hurricane Irma, according to a simulation with the HARMONIE weather forecasting model. The model description is given in Section 3.1. The data in panel (a) is time averaged over the period between 00:00 and 12:00, 6 September 2017. Contours show pressure, p, labelled in units of hPa (black), and radial wind, v r , labelled in units of m s 1 , with respect to the moving hurricane centre (blue). Panel (b) shows the time-evolution of mean absolute vorticity along in the layer between 310 K and 340 K along a zonal cross section through the centre of the cyclone.
Atmosphere 16 01146 g002
Figure 3. Modelled (thick) and observed (thin) azimuthal mean sea level pressure (black) and 750 hPa wind speed (red). The measurements originate from a single reconnaissance flight that made four passages through the centre of Irma at the shown times. The last three passages were performed at 750 hPa, the first at 700 hPa and is excluded for consistency. Sea level pressure from reconnaissance data are obtained by extrapolating observed flight level pressure (NOAA). The model data is averaged over the 5 September 21:00–6 September 02:00 UTC period, covering all passages.
Atmosphere 16 01146 g003
Figure 4. Ratio of observed vertical relative vorticity to the average planetary vorticity, f = 4.3013 × 10 5 s 1 . The relative vorticity is ζ = 1 r v t r r , where r and v t represent the radial distance (positive along flight direction) and storm-relative tangential wind, respectively, like in Figure 3. The tangential wind is smoothed by a 1 min moving average before calculating the vorticity, translating to roughly 7 km of flight distance. Values within 4 km of the centre are masked as the vorticity calculation assumes the flight path crossing the centre of rotation exactly and errors are greatly amplified in this region. The hurricane centre is determined at every measurement time by linearly interpolating the locations of the minimum of a tenth order polynomial fit of the extrapolated sea level pressure profiles for each of the passages. Additionally, the first passage at 700 hPa (blue, dashed) and the mean of the four passages are shown.
Atmosphere 16 01146 g004
Figure 5. Azimuthal mean cross-isentropic mass flux averaged over the 6 September 00:00–12:00 UTC period. Contours show the absolute angular momentum per unit mass, M, in m 2 s 1 (grey) and radial velocity, v r , in m s−1 (blue). Arrows show the transverse velocity vector 10 3 u r ^ + θ ˙ θ ^ . Wind vectors are scaled uniformly through the figure to allow for a representative legend, meaning that angle is not preserved. The factor 10 3 has been chosen for displaying purposes. The transverse velocity is shown only if its magnitude exceeds 0.006. The black dashed line indicates the radius of maximum tangential wind.
Atmosphere 16 01146 g005
Figure 6. Azimuthal mean radial vorticity flux components averaged over the 6 September 00:00–12:00 UTC period. Panel (a) shows the advective flux component, J a , absolute vorticity, η , labelled in 10 5 s 1 , and radial wind, v r , in m s 1 . Panel (b) shows the diabatic flux component, J h , the tangential wind, v t , in m s 1 and diabatic heating, θ ˙ , in K h−1. Panel (c) shows the residual flux component, J res , and η in 10 5 s 1 . All plots show isobars (p) in hPa and the radius of maximum tangential wind (black, dashed line). The residual flux is calculated in cylindrical coordinates.
Atmosphere 16 01146 g006
Figure 7. Vertical cross sections of the vorticity flux divergence and η -tendency and averaged vorticity flux along boundary of control volumes. Panel (a) shows a vertical azimuthal mean cross section of radial vorticity flux divergence due to advection and diabatic heating (shading), diabatic heating (contour lines), and the cylindrical areas indicated as control volume I and II, ranging from 335–360 K and 310–335 K, respectively. Their common lateral boundary resides at r = 35 km . Panel (b) shows the vertical azimuthal mean cross section of η -tendency (shading), η (contour lines) and the control volumes. Panel (c) shows the averages of the advective, diabatic, and advective + diabatic components of the radial vorticity flux in red, blue, and magenta, respectively. Each line represents the thickness-weighted average along the lateral boundary of control volume I (solid) or II (dashed), which are depicted in panels (a,b). The black lines in panel (c) represent the negative of the volume-averaged η -tendencies multiplied by r 2 , indicating the expected area-averaged vorticity flux for maintenance of the vorticity balance for each control volume. In panel (a,b), the vertical cross sections represent time-averaged fields over the 6 September 00–12 UTC period, pressure, p, is shown in hPa, and the dashed black line indicates the radius of maximum tangential wind.
Atmosphere 16 01146 g007
Figure 8. Azimuthal mean and eddy components of the advective and diabatic isentropic vorticity fluxes averaged over the 6 September 00–12 UTC period. Panels (a,c) show the mean and eddy components of the advective vorticity flux, respectively. Panels (b,d) show the mean and eddy components of the diabatic vorticity flux, respectively. Details on the calculation can be found in the text. Contours show the isentropic potential vorticity, Z = σ 1 η , in pvu and pressure, p, in hPa.
Atmosphere 16 01146 g008
Disclaimer/Publisher’s Note: The statements, opinions and data contained in all publications are solely those of the individual author(s) and contributor(s) and not of MDPI and/or the editor(s). MDPI and/or the editor(s) disclaim responsibility for any injury to people or property resulting from any ideas, methods, instructions or products referred to in the content.