Article

Can Heat Waves Fully Capture Outdoor Human Thermal Stress? A Pilot Investigation in a Mediterranean City

by
Serena Falasca
1,2,
Ferdinando Salata
3,*,
Annalisa Di Bernardino
2,
Anna Maria Iannarelli
4 and
Anna Maria Siani
2
1
Italian National Agency for New Technologies, Energy and the Environment (ENEA), 00196 Rome, Italy
2
Department of Physics, “Sapienza” University of Rome, 00185 Rome, Italy
3
Department of Astronautical, Electrical and Energy Engineering (DIAEE), “Sapienza” University of Rome, 00185 Rome, Italy
4
SERCO Italia SpA, Frascati, 00044 Rome, Italy
*
Author to whom correspondence should be addressed.
Atmosphere 2025, 16(10), 1145; https://doi.org/10.3390/atmos16101145
Submission received: 31 July 2025 / Revised: 24 September 2025 / Accepted: 27 September 2025 / Published: 29 September 2025
(This article belongs to the Section Biometeorology and Bioclimatology)

Abstract

In addition to air temperature and personal factors, other weather quantities govern the outdoor human thermal perception. This study provides a new targeted approach for the evaluation of extreme events based on a specific multivariable bioclimate index. Heat waves (HWs) and outdoor human thermal stress (OHTS) events that occurred in downtown Rome (Italy) over the years 2018–2023 are identified, characterized, and compared through appropriate indices based on the air temperature for HWs and the Mediterranean Outdoor Comfort Index (MOCI) for OHTS events. The overlap between the two types of events is evaluated for each year through the hit (HR) and false alarm rates. The outcomes reveal severe traits for HWs and OHTS events and higher values of HR (minimum of 66%) with OHTS as a predictor of extreme conditions. This pilot investigation confirms that the use of air temperature threshold underestimates human physiological stress, revealing the importance of including multiple parameters, such as weather variables (temperature, wind speed, humidity, and solar radiation) and personal factors, in the assessment of hazards for the population living in a specific geographical region. This type of approach reveals increasingly critical facets and can provide key strategies to establish safe outdoor conditions for occupational and leisure activities.

1. Introduction

Human thermal comfort is defined as “the state of mind, which expresses satisfaction with the thermal environment” [1,2]. Thus, human thermal perceptions are the result of the combination of meteorological quantities, such as air temperature, humidity, wind speed, and personal factors (e.g., activity and clothing), which should be taken into account, in addition to air temperature, when considering the human thermal sensations [3]. To account for these factors, numerous indices have been developed, which [4] are classified into three categories: (i) the empirical biometeorological indices, which also incorporate other weather variables for populations adapted to the climate of the geographical areas where they live; (ii) the thermal indices, which highlight the link between metabolic activities, dressing, environment, and the human thermal perception; and (iii) the indices based on linear equations, which express the relationship between human comfort and the thermal environment, with no regard to the human conduct. A wide range of tools is currently available to describe people’s thermal perceptions, developed over time by scholars aware of the need for standardization and universalization in defining human (dis)comfort in different climatic regions [5]. In particular, empirical indices have been developed for specific geographical regions through questionnaire surveys and simultaneous meteorological measurements. Some examples are the Mediterranean Outdoor Thermal Comfort Index–MOCI [6], the Turkish Outdoor Comfort Index–TOCI, the Global Outdoor Comfort Index–GOCI, and the Universal Thermal Climate Index–UTCI [7].
In the context of a changing climate, where extreme heat events have increased in intensity and frequency and will continue to increase, as documented by the recent IPCC Sixth Assessment Report, the study of human thermal comfort during such extreme heat events plays a key role in protecting people’s well-being. Extreme heat events include so-called heat waves (HWs), conceptually defined as a “period of consecutive days where conditions are excessively hotter than normal” [8]. Although no universal consensus exists on the criteria used to identify HWs, including metrics and thresholds [9], there is a broad agreement on the negative consequences of HWs on people’s well-being, especially in cities, where a large body of literature has documented their effects at different levels (e.g., mortality, morbidity, thermal stress, air quality, water and electricity consumptions, and relationships with the Urban Heat Island (UHI) [10,11]) In this regard, ref. [12] found that the definition of HWs influences the HW-related risks, in particular the relative risk for cardiovascular disease, which varies between 1.154 and 1.229, depending on the chosen definition.
Numerous studies have highlighted the health consequences of HWs. For example, ref. [13] estimated an average 28% rise in deaths in Australia due to HWs, ref. [14] reported double the mortality risk in people older than 65 in China, and [15] reported an increase of 13.5% in the mortality rate with an HW of at least 9 days per month in Vietnam. Refs. [16,17] focused on the energy consumption for cooling buildings during HWs in Hong Kong and Rome in recent years, finding an increase of 80–140% and 87%, respectively. Ref. [18] demonstrated a UHI intensification of about 0.9 °C during HWs in three Chinese megacities from 2013 to 2015, while [19] proved a lack of synergy between HWs and the UHI for Singapore. Regarding air quality, ref. [20] documented elevated ozone concentrations and concomitant increased concentrations of organic carbon and sulfate aerosols during summer HWs in New York City. Similarly, ref. [21] found that higher ozone, nitrogen dioxide, and particulate matter (PM10) levels coincided with HWs in Birmingham (UK), with concurrent peaks in concentrations of PM10 and ozone and maximum temperatures. Furthermore, several studies show that HWs exacerbate thermal stress conditions [22], and ref. [23] even found that the exposure to the HWs affects the thermal perception of people even after the HW, probably due to a mechanism of psychological adaptation. Analyses conducted in Europe confirmed higher thermal stress conditions during HWs than during non-HW periods [24,25,26].
Despite the interest of the scientific community in investigating people’s thermal sensations during HWs, the identification of extreme heat events remains substantially based on the air temperature only, without including other meteorological variables, such as humidity, solar irradiance, and wind speed. An example of this is given by [27], who proposed the use of a health-based criterion for the definition of HWs (with the UTCI as the reference variable), suggesting a UTCI threshold of the 95th percentile for a hypothetical heat-health warning protocol. Similarly, ref. [28] suggested the “health waves” concept, emphasizing the link between cardiovascular, respiratory emergency calls, and HWs in Milan during the exceptionally hot summer of 2022. He et al. [29] defined HWs based on human thermal comfort indicators, such as wet-bulb globe temperature and apparent temperature, which also include humidity and wind speed, in their investigation on the synergies between HWs and UHIs in Shanghai (China). Nonetheless, generally speaking, the search for outdoor human thermal stress (OHTS) events based on biometeorological indices, while also taking into account individual sensations, appears to be little practiced by the international scientific community to date.
This gap is particularly relevant for the Mediterranean basin, a hot spot for climate change, where numerous observational and modeling studies confirm a strong upward trend in HW intensity and duration during the 21st century [30,31,32], and key questions about societal resilience to extreme weather have also been raised [33]. For Italy, this peculiarity adds to other critical issues, such as the high population and the high average age of the population. Ref. [34] partially addressed the research gap described above, defining a set of indices for the identification and characterization of OHTS events using the MOCI as benchmark, derived from corresponding indices for HWs partly developed ad hoc.
The present study seeks to further address this gap by strengthening the index-based approach by extending its application to the city of Rome, with the further objective of investigating the possible overlaps between HWs and OHTS events. More specifically, the aims of this work are (i) to compare the potential and the limits of HWs and OHTS events, which are defined differently since they are conceived from different objectives, i.e., HWs for “climatic” purposes and OHTS events to quantify the “perception of human thermal sensation”, and (ii) to explore the extent to which HWs, defined on a statistical basis in terms of significant deviation from climatological values, are able to capture outdoor human stress conditions that, on the contrary, depend on extemporaneous sensations.

2. Materials and Methods

The novel elements linked to this approach based on the empirical multivariable index MOCI are twofold: (i) MOCI has been specifically designed for the city of Rome (examined in this study), calibrated on a sample of people living in the Mediterranean area and, therefore, adapted to the local climate, and (ii) MOCI allows for the identification of critical conditions of human thermal sensations in outdoor environments, taking into account other personal and environment factors, in addition to air temperature, which is the only variable generally considered for the identification of extreme heat events.

2.1. Site Description

In the urban center of Rome (41.90° N, 12.50° E), approximately 2.8 million inhabitants live in an area spanning almost 1300 km2, making it the largest and most populous Italian municipality.
The city stretches along the Tiber Valley and is surrounded by hills to the North, West, and South, while to the East, the coast of the Tyrrhenian Sea is about 27 km from the city center. Due to the complex orography of the surrounding area and the proximity of the Tyrrhenian coast, the local climate is strongly influenced by local and synoptic weather circulation. Two prevailing wind patterns can be identified: the drainage flow through the Tiber Valley [35] and the sea/land breeze regime [36], which, during sunny days under high-pressure conditions, generates south-westerly winds during the central hours of the day. According to the Köppen-Geiger climate classification, the region belongs to the Mediterranean climate class (Csa), experiencing mild winters and dry and hot summers [37].
Scientific data on the increase in heat-related risks in Mediterranean cities highlight their vulnerability to climate change, which is causing more frequent, intense, and prolonged HWs [38,39]. For Italy, in particular, maximum values of 10 days/decade of hot days and 6 days/decade of HW frequency, in terms of maximum and minimum temperatures, have been detected [40].
The data used in this study to identify HWs and OHTS events were collected from two stations located in downtown Rome, namely, the Collegio Romano and the Boncompagni stations (Figure 1). The sites will be described in detail in Section 2.2, together with the features of the input data and applications.

2.2. Study Period and Input Data

This study is focused on the May–September period of the years 2018–2023, which is typically the hottest period of the year in Rome (Italy), during which people might experience thermal and thermo-hygrometric discomfort. Meteorological quantities for the computation of the annual minimum and maximum daily temperatures and for the identification and characterization of HWs and OHTS events are supplied by the automatic weather stations located in the sites of Collegio Romano and Boncompagni, respectively. The Collegio Romano station (41.90° N, 12.48° E, 57 m a.s.l.) is the historical meteorological observatory of Rome, active since 1871, and it was selected to provide temperature data that were used to characterize the reference period and identify the HWs. The instrumentation is installed on the rooftop of a building in downtown Rome and is currently managed by the CREA (Council for Agricultural Research and Analysis of Agricultural Economics, https://www.crea.gov.it/, last accessed on 29 July 2025). The observatory provides hourly measurements of air temperature, from which the daily maximum and minimum temperatures over the 2000–2020 period were retrieved [40]. Note that the ETCCDI recommends the thirty-year period of 1961–1990 as the reference period for the calculation of extreme indices, while here, based on the availability of observations (as detailed in Section 2.3 and Section 2.4), the extreme events are identified against the 2000–2020 reference period. The 21-year dataset was previously validated and subjected to a homogenization procedure to identify and remove gross errors and non-climatological signals. The Collegio Romano observatory does not provide the other weather quantities required for the computation of the MOCI, namely, relative humidity, solar irradiation, and wind speed (Equation (1)). Therefore, hourly values of these variables were provided by the Boncompagni monitoring station (described in Section 2.5) of the Lazio Regional Environmental Protection Agency (ARPA Lazio) network (https://www.arpalazio.it/, in Italian, last accessed on 29 July 2025). However, the Boncompagni station did not have a dataset with enough data to cover the reference period for the HW calculation.
The Boncompagni station (41.91° N, 12.50° E, 72 m a.s.l.), compliant with the World Meteorological Organization (WMO), is installed on a rooftop in a densely built-up area in the center of Rome. Measurements have been collected since 2013, but here, only the period of 2018–2023 was selected based on the availability of observations for the May–September period. The temporal coverage of the observations is higher than 80% in the period investigated for the years 2018 to 2023. Table 1 lists the weather quantities employed in this study, together with the corresponding network.
The Collegio Romano and Boncompagni stations are less than 2 km apart and are located in urban settings with similar features of urbanization density and urban fabric. Consequently, the Collegio Romano station can be assumed to be representative of the Boncompagni station with regard to the calculation of HWs [36].

2.3. Extreme Temperature Indices and Heat Waves

The Expert Team on Climate Change Detection and Indices (ETCCDI) was jointly established by the World Meteorological Organization (WMO) and the World Climate Research Program to define a set of climate indices capable of assessing temperature and precipitation extremes worldwide to evaluate the effects of global warming and to design the best tailored strategies to face climate change [41].
In this work, a subset of indices corresponding to the ETCCDI, based on the daily maximum (TX) and minimum (TN) air temperatures, was selected and calculated on a yearly basis, rather than a monthly basis, namely:
-
Annual TXx: the maximum value of daily maximum temperatures across the year
-
Annual TXn: the minimum value of daily maximum temperatures across the year
-
Annual TNx: the maximum value of daily minimum temperatures across the year
-
Annual TNn: the minimum value of daily minimum temperatures across the year
According to the definition proposed by [42], and adapting it to also follow the ETCCDI indices, an HW is defined here as “a spell of at least six consecutive days with daily maximum temperature exceeding the calendar day 90th percentile centered on a 5-day window for the reference period”.

2.4. Severe Outdoor Human Thermal Conditions and Events

As for HWs, OHTS events are identified based on a threshold and duration of a reference variable, which, in this study, is the bioclimatic index Mediterranean Outdoor Comfort Index (MOCI), specifically designed in the city of Rome [6].
The MOCI was developed thanks to a subsequent subset analysis conducted on a big dataset that incorporated personal data and thermal sensations acquired through questionnaires distributed to a large group of residents and observations of ambient temperature, relative humidity, wind speed, and globe radiant temperature acquired during a whole year in Rome. The MOCI has already been widely used for different applications, including a new version containing solar irradiance instead of radiant temperature (e.g., [43]). In this study, the new version of the MOCI is used, which is formulated as follows:
MOCI = −4.257 + 0.146∙Ta + 0.325∙Icl + 0.005∙RH + 0.001∙Is − 0.325∙Ws,
where:
Icl = 1.608 − 0.038∙Ta,
Ta is the air temperature [°C], Icl is the thermal resistance of the clothing, defined as in Equation (2), RH is the relative humidity [%], Is is the solar irradiance [Wm−2], and Ws is the wind speed [ms−1]. As an empirical bioclimatic index, the MOCI turns subjective sensations of progressive hot/cold into numerical values, precisely on an ASHRAE (https://www.ashrae.org/) 7-point scale ranging from −3 (sensation of extreme cold) to +3 (sensation of extreme heat). MOCI values equal to or greater than 0.5 correspond to sensations of human thermo-hygrometric discomfort. This threshold has historical reasons since P.O. Fanger identified Predicted Mean Value (PMV) levels between −0.5 and 0.5 as the comfort range (acceptable conditions of both heat and cold) in his pioneering studies [44,45]. More recent thermo-hygrometric comfort indices (including the MOCI) apply this range to define comfort conditions. In this work, the criterion for the definition of OHTS events proposed by [34] is applied (Table 2), with the threshold event consisting of the maximum daily MOCI equal to 0.5 (i.e., human discomfort threshold) and the minimum duration of six days, consistent with the HW definition [42]. Thus, an OHTS event is defined as a period of at least six consecutive days characterized by maximum daily values of the MOCI being equal to or above 0.5.
Once identified, the OHTS events were characterized using the indices listed in Table 1. Metrics such as frequency, intensity, and duration correspond to those for the HW, as shown in Table 1. On the other hand, the cumulative extra-MOCI and the cumulative heat during HWs have been conceptualized ad hoc, with the aim of showing the accumulation of stress to which the human body is subjected during the selected period of the year.

2.5. Hit Rate and False Alarm Rate

The overlapping of HWs and OHTS events is investigated here using the contingency table (Table 3). It is well-known that when predicting an event through a selected quantity (the “predictor”), it is possible to build a contingency table containing four outcomes: the number of (a) hits (i.e., events that occur and are correctly predicted by the predictor), (b) false alarms (i.e., events that do not occur but are predicted by the predictor), (c) misses (i.e., events that occur but are not predicted by the predictor), and (d) correct negatives (i.e., events that do not occur and are not predicted by the predictor).
For each event, only two options are possible, namely, occurrence or non-occurrence. Consequently, the hit rate (HR) and false alarm rate (FR) are defined as follows:
HR = a/(a + c),
and
FR = b/(b + d),
In this work, for each year, two contingency tables were computed using (i) the HW event as a predictor of OHTS events and (ii) the OHTS event as a predictor of HWs. In case (i), the quantity a (“hits”) is the sum of the days classified simultaneously as an HW and an OHTS event in a certain year, the quantity b (“false alarms”) is the sum of the days classified as an HW and not as an OHTS event, the quantity c (“misses”) is the sum of the days not classified as an HW but classified as an OHTS event, and the quantity d (“correct negatives”) is the sum of the days neither classified as an HW nor human thermal stress in a certain year. In case (ii), the procedure is the same but the role of HW and human thermal stress events is reversed and consequently the roles of false alarms and misses, while hits and correct negatives coincide in cases (i) and (ii).

3. Results

3.1. Extreme Temperature Indices

Given that air temperature plays a crucial role in the occurrences of HWs and OHTS events, in this section, the values of the TXx, TXn, TNx, and TNn at the Boncompagni station in the years 2018–2023 are presented (Figure 2) and discussed to provide an overview of the characteristics of these years.
TNn was greater than 10 °C, except in 2019 and 2021. It peaked in 2023 (equal to 11.7 °C), while in 2019, it did not even reach 8 °C. TNx was greater than 25 °C, with a peak in 2023 (28 °C), followed by 2021, with approximately 27 °C. TXn showed a significant increase, ranging between approximately 11 °C in 2019 and 20 °C in 2022. TXx was around 37 °C in 2019 and 2020, while it was around 40 °C in the last three years (2021–2023), with a peak of 40.5 °C in 2022. In the year 2018, it was about 39 °C. It can be summarized that 2019 presents the minimum levels of temperatures (TNn and TXn) in the period examined, while the maximum levels (TNx and TXx) are similar to other years. Similarly, the last three years (2021–2023) present characteristics of “extreme” years, both from the point of view of minimum temperatures, i.e., TNn and TNx (especially the year 2023), and that of maximum temperatures, i.e., TXn and TXx (especially the year 2022).

3.2. Comparison Between Heat Waves and Outdoor Human Thermal Stress Events

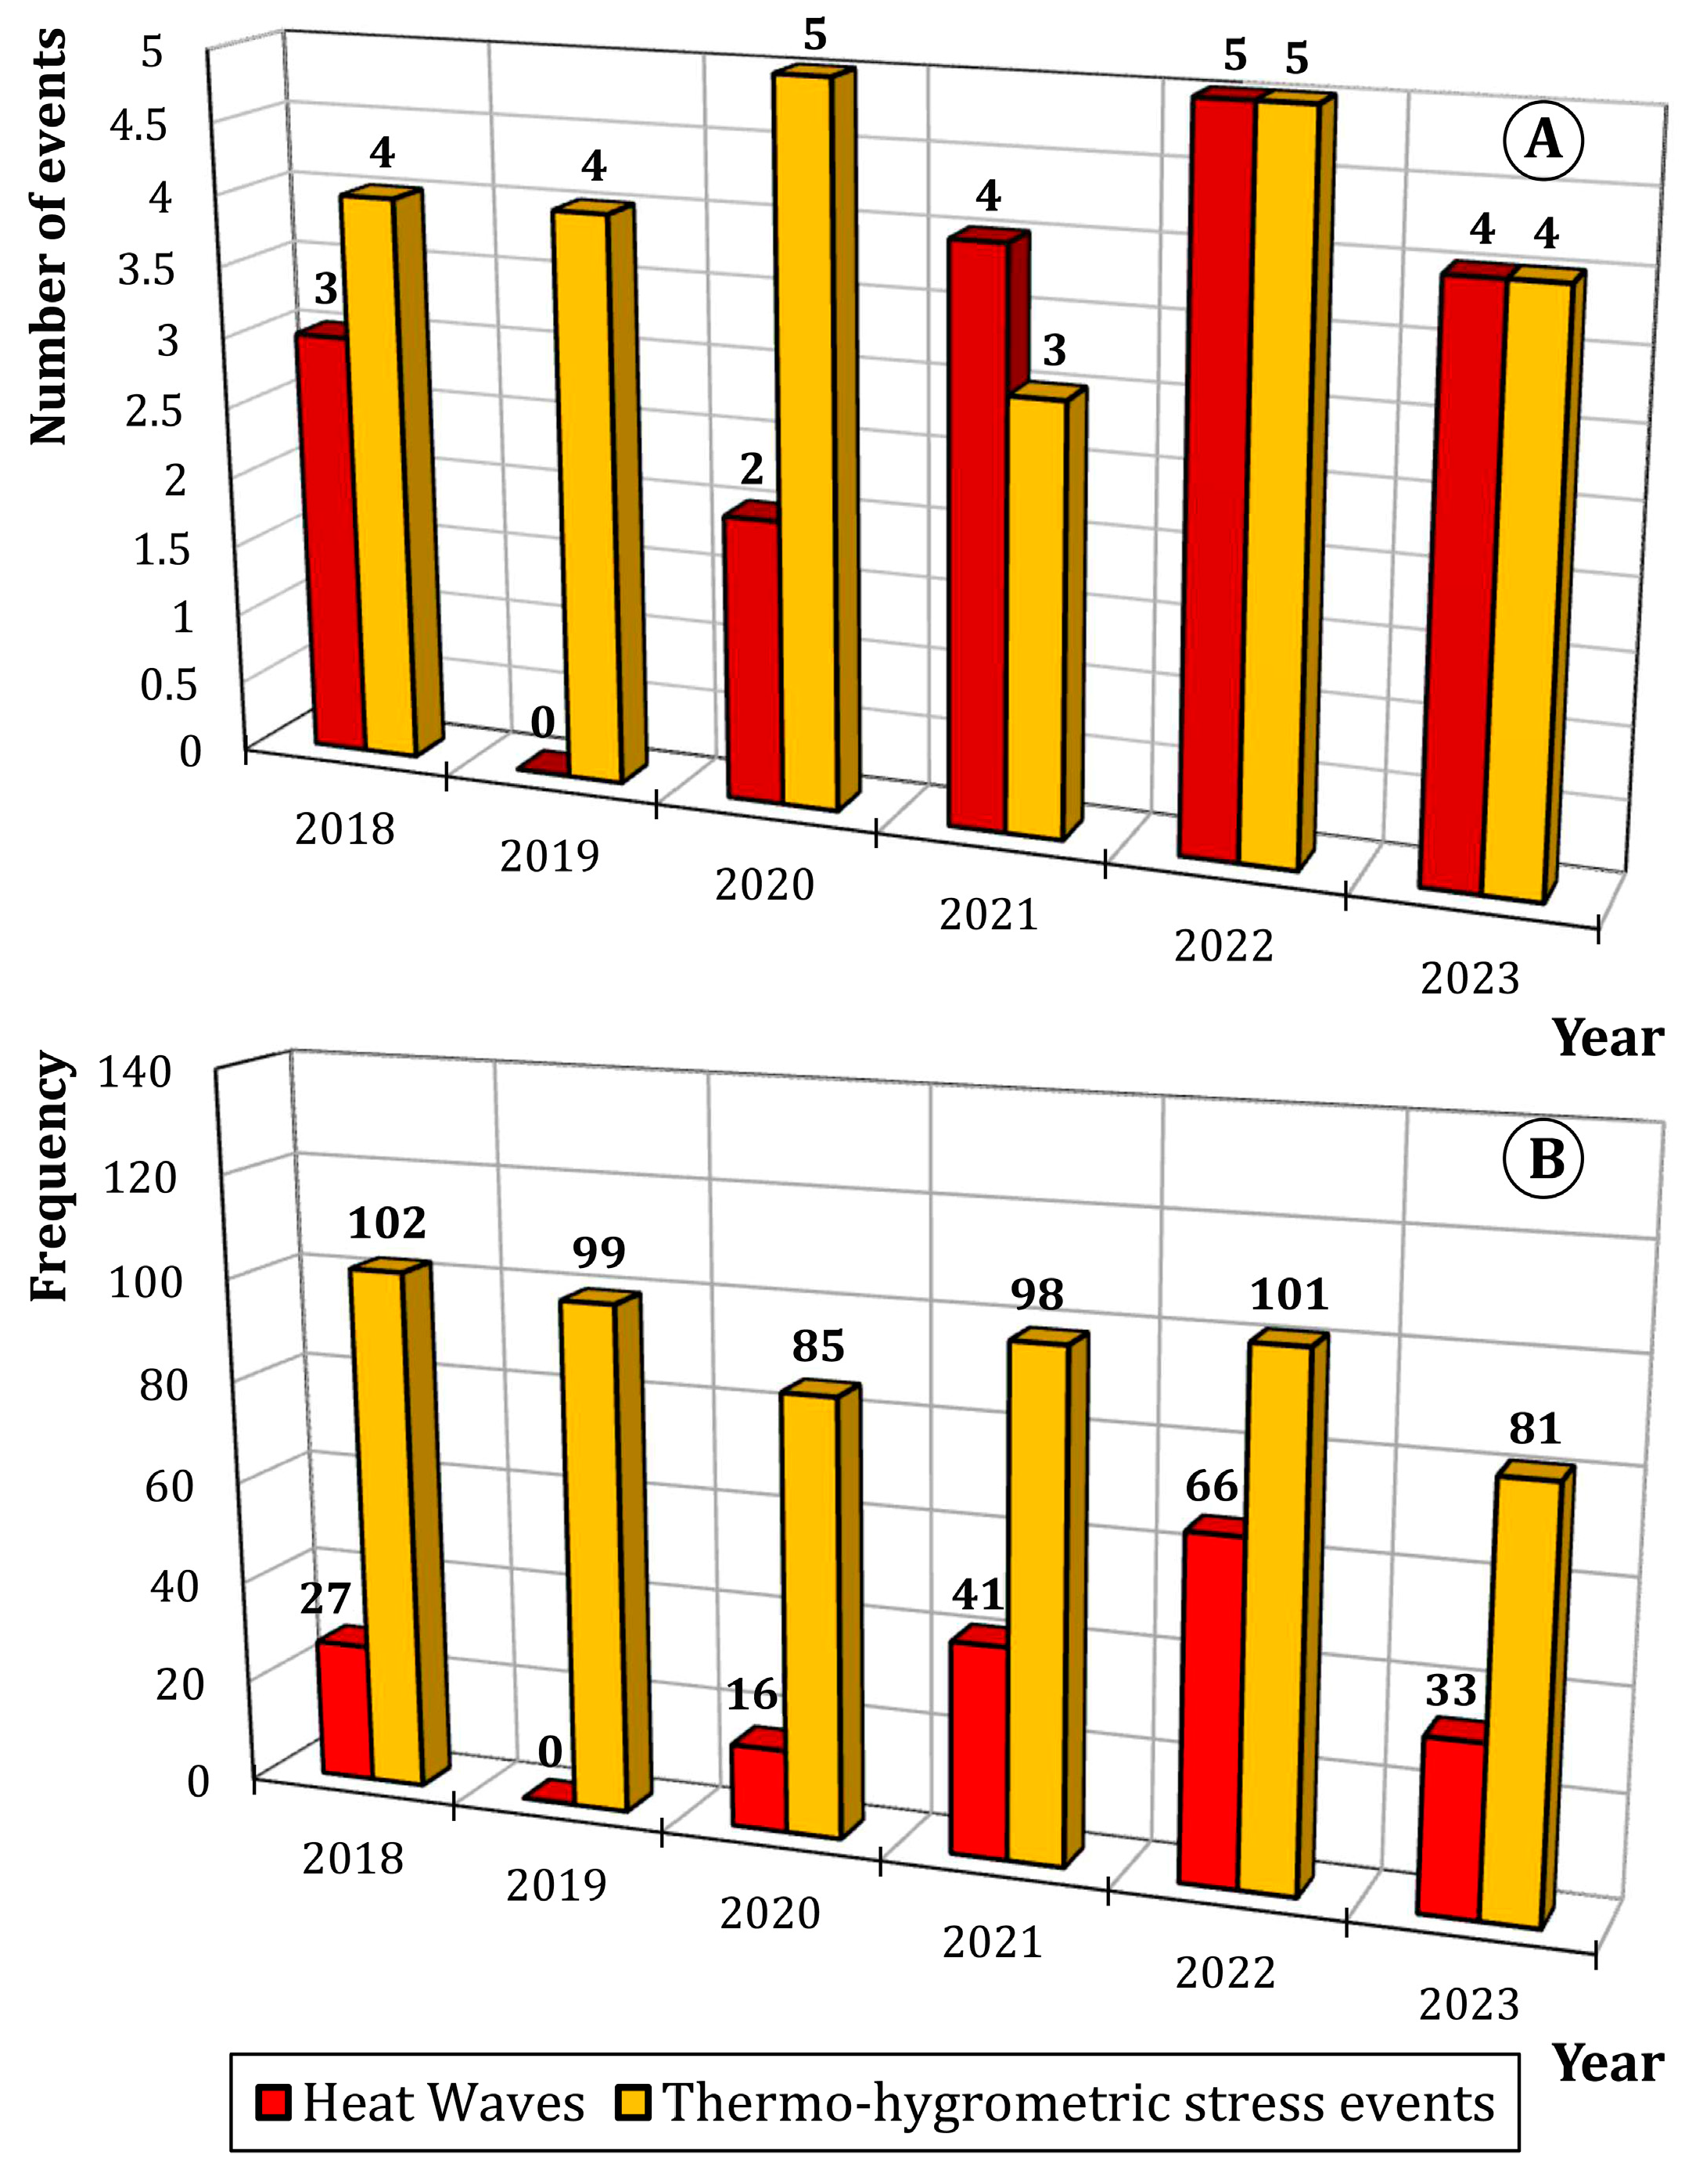
The number of OHTS events (Figure 3A) is always higher than that of HWs, except in the years 2022 and 2023 (when these numbers are equal), and in the year 2021 (when HWs are more abundant than OHTS events by one unit). In one of the six years analyzed, namely, 2019, no HWs were even identified, while four OHTS events were experienced. Furthermore, in the year 2019, the frequency of OHTS events (Figure 3B) was high (99 days) and close to the highest values for the period examined (102 days in 2018 and 101 days in 2022). The lowest values were experienced in 2020 (85 days) and 2023 (81 days). The year 2021 also had a rather high frequency of events (Figure 3B), equal to 98 days. The frequency of HWs has a range that extends from 16 (in 2020) to 66 (in 2022), with 2021 presenting an intermediate value, equal to 41. It is worth highlighting that the frequency of OHTS events is always greater than the duration of two months (about 60 days), and it was even greater than three months in 2018, 2019, 2021, and 2022. On the other hand, HWs have a frequency higher than a month in three out of six years, specifically, the years 2021–2023.
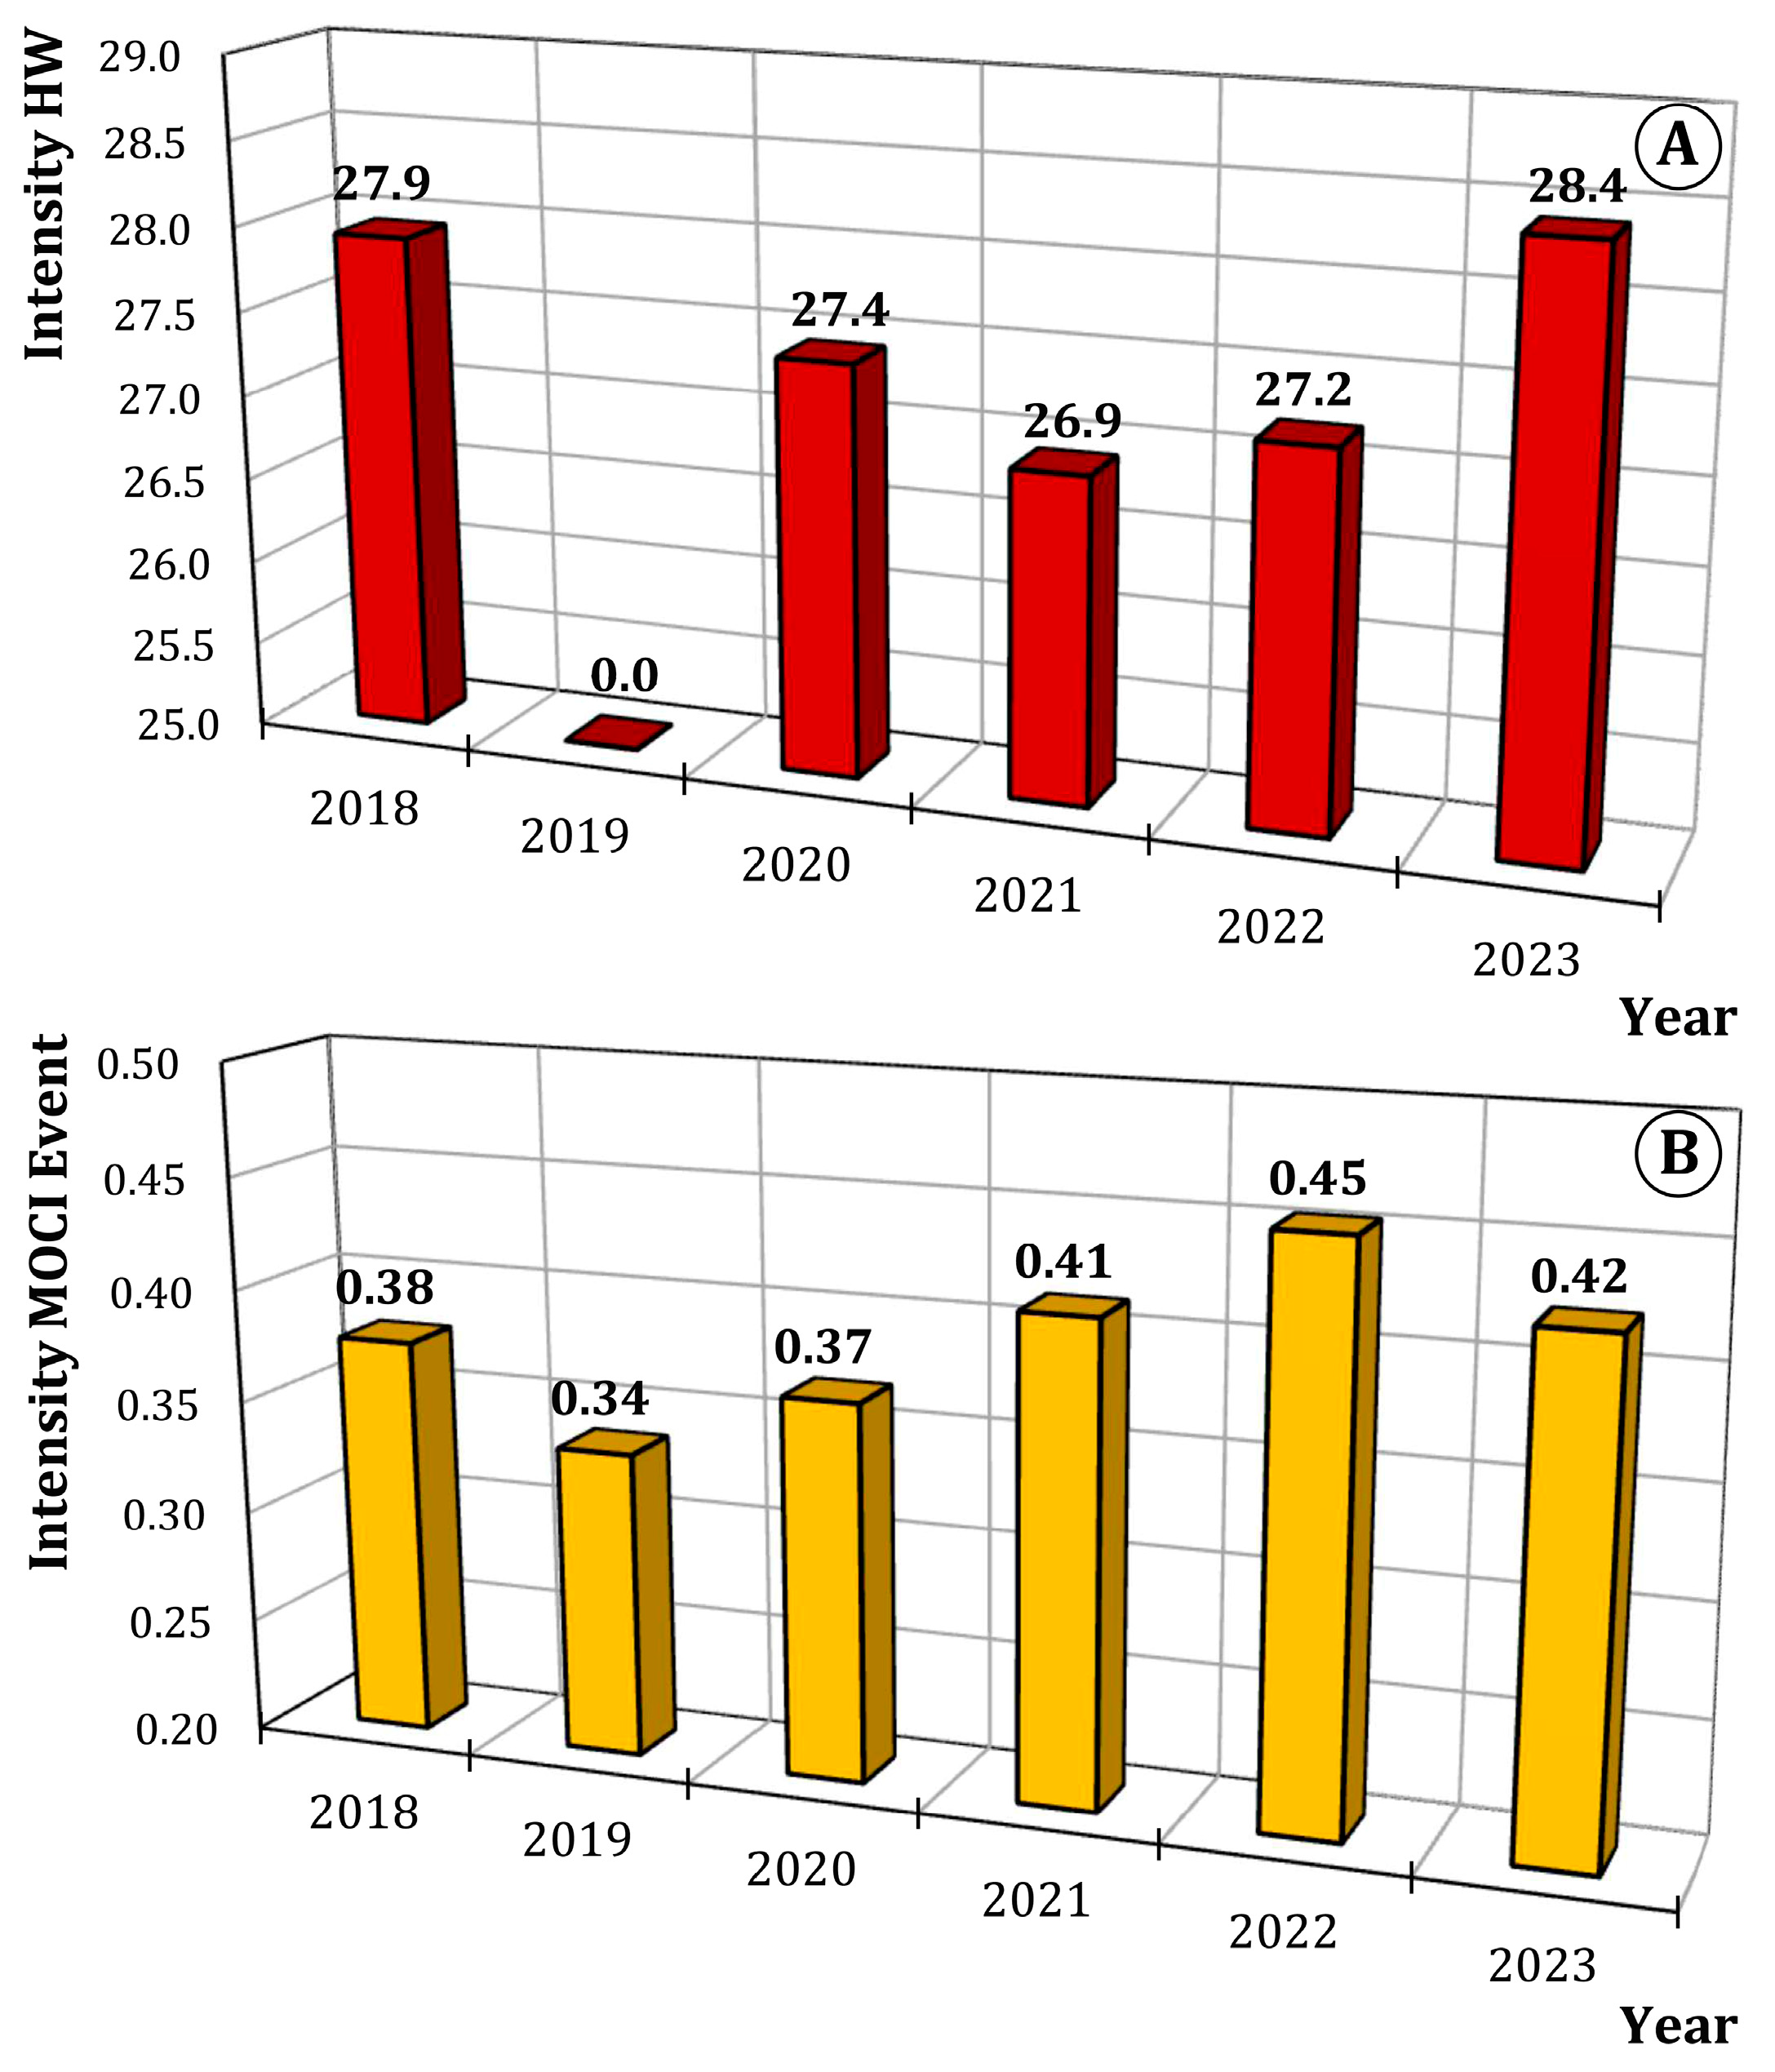
Regarding the intensity of the events (Figure 4), no relevant difference was observed between the six years, both with regard to the HWs and the OHTS events, with a variation between maximum and minimum intensity equal to approximately 2 °C for the HWs and 0.2 for the MOCI. As for the HWs, the maximum and minimum intensities occurred in 2023 and 2021, respectively, while the maximum and minimum intensities of OHTS events were recorded in 2022 and 2019 (in 2019, no HWs occurred).
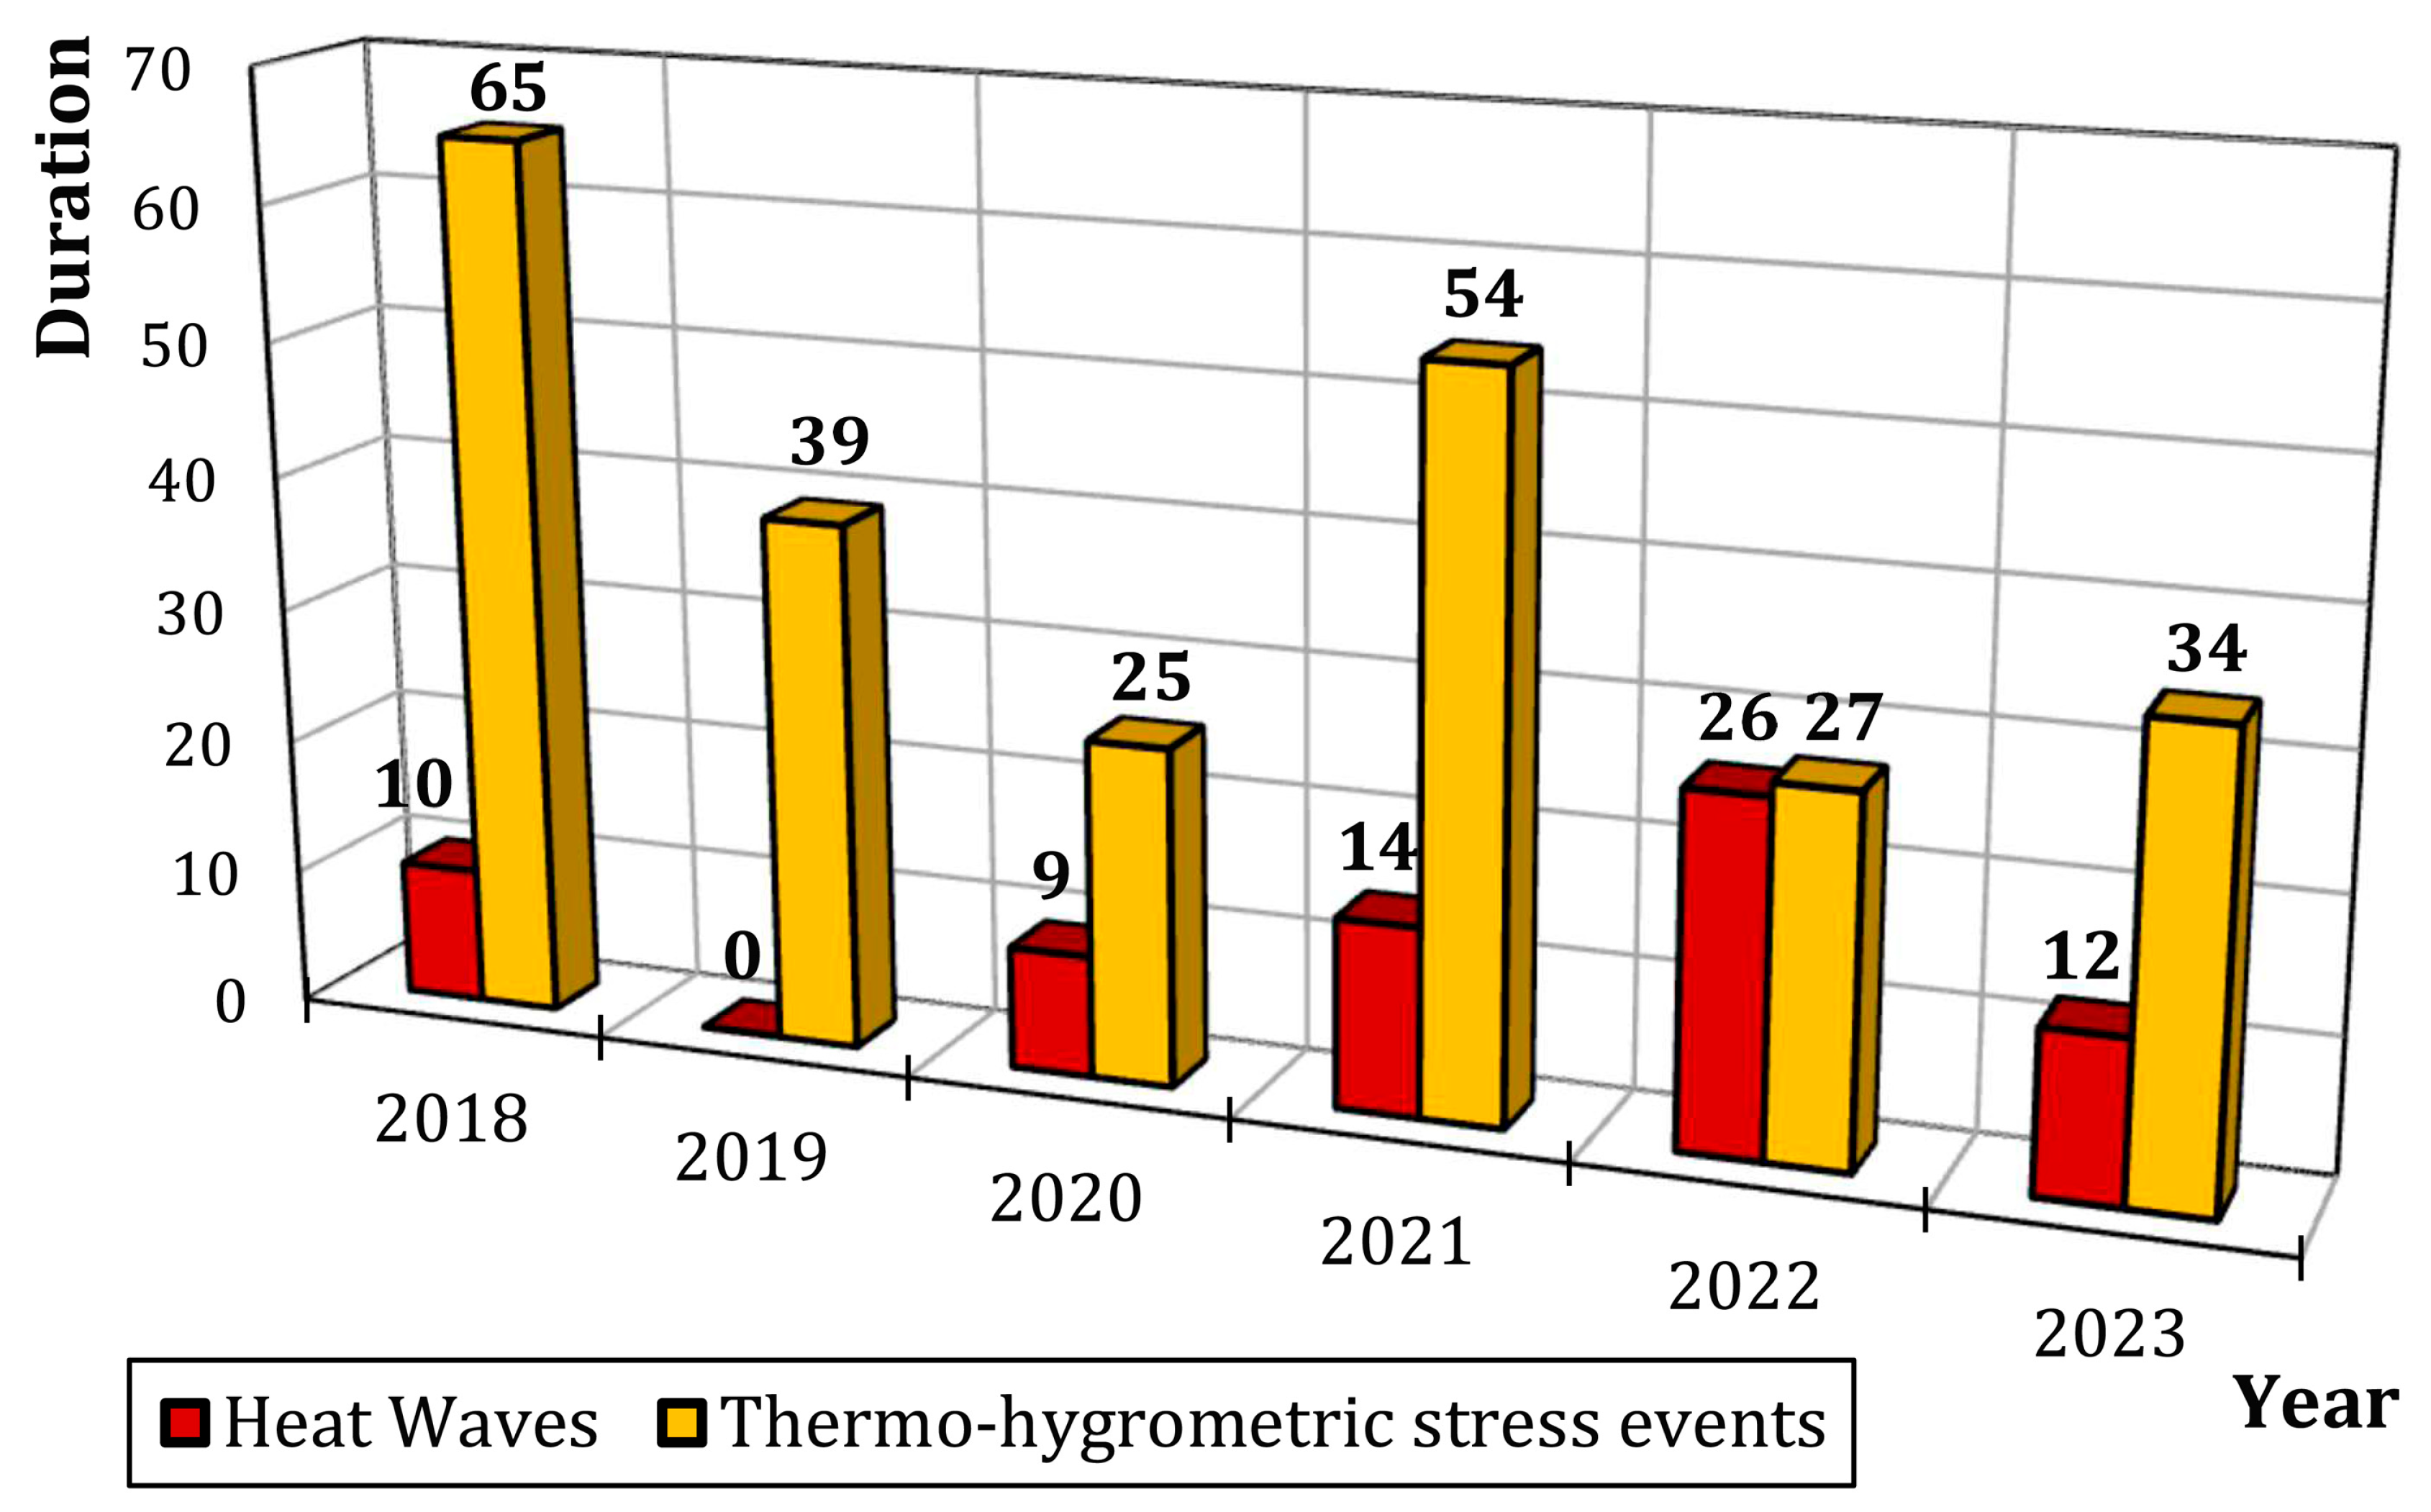
The duration of OHTS events (Figure 5) was much longer than that of HWs: the former ranged from 25 days in 2020 to 65 days in 2018, without a particular trend in the period examined. On the contrary, the duration of HWs ranged from 9 (2020) to 26 days (2022), with a progression between 2020 and 2022. In 2018 and 2023, the duration of HWs was 10 and 12 days, respectively.
Excluding the year 2019, during which no HWs occurred, the cumulative heat range (Figure 6) is from 29 (in the year 2020) to 180 (in the year 2022). The years 2023, 2018, and 2021 have intermediate and increasing values, equal to 56, 65, and 97, respectively. The extreme values of cumulative extra-MOCI also occurred in 2020 (the minimum, equal to 56) and in 2022 (the maximum, equal to 96). However, the range between the maximum and minimum value of this quantity is narrower than that of the cumulative heat, and the differences between the values of the different years are smaller. The cumulative extra-MOCI is equal to, in increasing order, 58 in 2019, 61 in 2023, 84 in 2018, and 86 in 2021.

3.3. Overlapping of Heat Waves and Outdoor Human Thermal Stress Events

As described in Section 2.3, the overlapping of the HWs and outdoor OHTS events was investigated through HR and FR. These two parameters were computed using the HWs as predictors of outdoor OHTS events and vice versa. The resulting scores are displayed as percentage values in Table 4. The year 2019 was excluded from this analysis as there were no HW occurrences. According to the definitions of HR and FR, when the HR of the MOCI is 100%, the FR of the HW is zero. In the years 2018, 2020, and 2022, the HR of the MOCI was equal to 100%, which means that all the days of HWs were also days of OHTS events. At the same time, not all the days of OHTS events were also HWs; indeed, FR was equal to 60%, 50%, and 40%, respectively. It is interesting to note that in 2021 and 2023, characterized by an MOCI HR of less than 100%, the “misses” occurred for a few days (14 days in 2021 and 6 days in 2023) at the end of September, when the temperature conditions determined the identification of an HW but not of an OHTS event.
When using HW as a predictor, the HR reached the maximum value of 65% in 2022, which, as discussed above, was an exceptionally hot year. In other years, the HR values were between 13% and 33%. The corresponding FR values were also higher when considering the OHTS events as a predictor, with FR values ranging between 40% in 2022 and 63% in 2021. When using HWs as a predictor, the FR was equal to zero in three out of six years, while it reached a maximum of 25% in the other years.
The overlap between days falling in the two categories of severe events can also be conceived as the ratio between the hits (equal for the two predictors) and the frequency of the “predicted” quantity. Such values correspond to the HR of the predictor. Thus, in the case of HWs as a “predictor”, the HR also represents the percentage of OHTS events that are HWs, and, in the case of OHTS events as a predictor, the HR represents the percentage of HWs that are OHTS events. The HR with HWs as a predictor is always lower than the corresponding HR with OHTS events as a predictor, confirming that the counting of HW days in a year underestimates the days people experience extreme human thermal discomfort. The HR columns in Table 4 show that in three years (2018, 2020, and 2022) out of the five years analyzed (the year 2019 was not included in the analysis due to the lack of detected HWs), all HW days are characterized by OHTS, and in the remaining years, more than half of the HW days are characterized by OHTS (82% in 2023 and 66% in 2021). On the contrary, much less than half of the OHTS days are also HW days for all years, except 2022, in which 65% of the OHTS days are also HW days.

4. Discussion

HWs significantly influence many aspects of the quality and life expectancy of city dwellers. In the city of Rome, the subject of this study, i.e., HWs between 1991 and 2015, were found to be the deadliest events, with an increase in mortality, even in the days following HWs [47,48]. At the same time, preparing the population for such extreme events, for example, through the implementation of preventive measures and early warning, can help prevent and reduce mortality [49].
In this perspective, this study aims to introduce elements of originality in identifying heat stress conditions for people that include variables other than temperature. Indeed, while severe events such as HWs are generally defined and classified based on air temperature levels, outdoor human thermal perception is controlled not only by air temperature but also by other meteorological quantities and personal factors. In this sense, it has been widely demonstrated that it is essential to specifically analyze the response of local populations to external climate forcing, taking into account the geographical and climatic context. For this reason, outdoor human thermal perception is often quantified using bioclimatic indices, such as the MOCI applied in this study.
The application of the contingency table between HWs and MOCI events highlights how HWs are frequently associated with OHTS conditions (with HW as a predictor, where the HR is between 13% and 33%, except for the HR of 65% in 2022), as widely demonstrated by the published literature. For example, ref. [50] recently observed “very extreme” heat stress during HW days compared to “severe” heat stress during a normal summer day. On the other hand, in this study, the HR is always lower with HWs as a predictor than with OHTS as a predictor, meaning that OHTS events also occur when thermal conditions alone do not determine the occurrence of a HW, but the concomitance of thermal conditions and other weather conditions does. In other words, on days when temperatures are such that they do not cause an HW event, the combination of weather conditions derived from wind, radiation, and humidity determines conditions of thermal discomfort for the population. The weight of a single weather variable in determining the MOCI level and, therefore, the thermal sensation, is included in the MOCI equation (Equation (1)) and depends on the sensitivity of the Mediterranean normotype, upon which this index was built. In particular, in their review, Lai et al. (2020) highlighted how the relative weight of radiation and wind speed in indices similar to the MOCI can vary depending on the reference climate [51]. Furthermore, even from a temporal perspective, this OHTS event-based approach allows for identifying OHTS conditions in the early or late summer season, when temperatures may not be high enough to detect HWs from a climatic perspective. This insight has already been introduced by [49], who detected a crucial role of the timing of summer temperatures in relation to mortality risk. It is important to emphasize that psychological, as well as physical and physiological, parameters also contribute to MOCI levels. Therefore, the occurrence of OHTS events at the beginning and end of the hot season (during the months of May and September) can reveal lower susceptibility of the local population to certain weather conditions compared to the height of summer (the months of July and August in Rome).
Thus, the findings prove that a bioclimatic comfort index, such as the MOCI, explicitly designed for the Mediterranean population and based on a set of quantities influencing the feelings of (dis)comfort of that population, is much more effective in defining and identifying dangerous weather events for human health that go beyond just heat conditions. In other words, HWs are suitable for identifying extreme heat from a climatic point of view but are not suitable for identifying thermal stress conditions of people. These findings make the data on the increasing overheating of urban areas even more alarming, also due to the high population density. It is important to note that studies based on climate projections under the Intergovernmental Panel on Climate Change (IPCC) scenarios show a clear worsening of outdoor comfort conditions in the future, with well-known negative impacts that are widely proven at several levels.
Another interesting aspect to consider when applying multivariable indices like the MOCI is that quantities such as solar radiation and wind have greater spatial variability within the city than air temperature, as they are subject to a stronger influence of shading and surface roughness. This approach, therefore, allows for detecting even slight variations in the degree of thermal stress. This study is based on data from a single weather station, which represents a limitation as only the temporal variability in weather parameters can be explored. From a spatial perspective, an urban context characterized by a high building density and a relatively limited presence of green spaces is examined, where notoriously thermal and outdoor thermo-hygrometric comfort conditions are more challenging than in more peripheral areas.
Moreover, a new approach to early warning systems is introduced here, specifically for cities, for example, integrating this methodology based on OHTS events into specific urban HW warning systems and for the activation of a set of safety factors at a regulatory level in the management of occupational and leisure activities, with social implications as well. In this regard, ref. [31] suggests adopting a holistic approach to weather extremes. Furthermore, urban populations are typically heterogeneous from a demographic and social point of view, and it is understandable that the most fragile and low-income population groups are more exposed to the consequences of extreme heat. Finally, it is essential to emphasize that this pilot study focuses on the general conditions of OHTS, while a more targeted approach to the livability of open urban spaces, such as the thermal usability approach, exists and can be applied. More specifically, this approach considers various aspects, such as walkability, usability, operation, and workability [52].

5. Conclusions

This study presents a first approach to the exploration of the possibility of defining severe thermal events taking into account all the parameters influencing human out-door (dis)comfort. The results of this method were then compared to those of the air temperature-based method for the identification of the HWs. This study represents a pilot investigation for Rome (Italy), a city with severe thermal stress conditions. The dataset used was provided by the Boncompagni ARPA station, which is located in downtown Rome, with a high urbanization density and traffic. The dataset covers a few recent years, which are not sufficient for identifying a trend; however, acute traits in the number, duration, frequency, and cumulative heat of HWs and in the intensity and frequency of OHTS events are demonstrated.
For the first time, the method of the contingency table is applied to evaluate the effectiveness of the air temperature as a benchmark for evaluating OHTS conditions. The outcomes of the prediction of OHTS events (the predicted) by the HWs (the predictor) are compared to the outcomes of the prediction of HWs (the predicted) by the OHTS events (the predictor), which showed that the number of days of the year in which people experience OHTS conditions is higher than that of HWs.
The present results also confirm that air temperature is not adequate for identifying people’s thermal distress conditions. The sensations of hot discomfort perceived by humans are linked not only to temperature but also to other quantities, such as relative humidity, wind intensity, solar radiation, and personal conditions, which should be included in the identification of dangerous thermal conditions. The climatic conditions categorized as severe by a multivariable index, such as the MOCI, are crucial as they can have consequences both on human health and the daily lifestyle habits of a population, although from a purely climatic point of view, they tend to overestimate the occurrence of HWs.
Therefore, studies like this shed light on the opportunity to treat these issues from a social/socio-economic point of view as well. This is why it is crucial to expand the concept of HWs beyond just temperature, considering other factors that contribute to their overall impact. Moreover, it would be very stimulating to extend the methodology introduced in this article and in [34] to other urban contexts (e.g., suburban) of the same city, other Mediterranean cities, as well as to cities in other geographical areas, for which tailored indices should be employed. It should be noted that an extension of this study should also consider a longer time series to overcome the limitation linked to a 6-year dataset.

Author Contributions

Conceptualization, S.F. and F.S.; methodology, S.F., F.S., A.D.B. and A.M.S.; software, S.F. and A.D.B.; formal analysis, S.F., F.S., A.D.B., A.M.I. and A.M.S.; investigation, S.F. and F.S.; data curation, S.F. and A.D.B.; writing—original draft preparation, S.F. and F.S.; writing—review and editing, A.D.B., A.M.I. and A.M.S.; visualization, F.S. and A.D.B.; supervision, A.M.S. All authors have read and agreed to the published version of the manuscript.

Funding

This research received no external funding.

Institutional Review Board Statement

Not applicable.

Informed Consent Statement

Not applicable.

Data Availability Statement

The original data from the Boncompagni station presented in this study are openly available in the ARPA LAZIO repository (Ambiente-ARPA Lazio, in Italian). The original data from the Collegio Romano station are available upon request.

Acknowledgments

The authors gratefully acknowledge ARPA Lazio for providing weather data and the Council for Agricultural Research and Analysis of Agricultural Economics—Historical Meteorological Archive of the ex-CMA, Collegio Romano Observatory—for supplying the meteorological data.

Conflicts of Interest

Author Anna Maria Iannarelli was employed by the company Serco. The remaining authors declare that the research was conducted in the absence of any commercial or financial relationships that could be construed as a potential conflict of interest..

Abbreviations

The following abbreviations are used in this manuscript:
HWHeat wave
OHTS Outdoor human thermal stress event
MOCIMediterranean Outdoor Comfort Index
HRHit rate
FRFalse alarm rate

References

  1. ASHRAE Standard 55-2004; Thermal Environmental Conditions for Human Occupancy. ANSI/ASHRAE Standard: Atlanta, GA, USA, 2004.
  2. ASHRAE Standard 55-2010; Thermal Environmental Conditions for Human Occupancy. ANSI/ASHRAE Standard: Atlanta, GA, USA, 2010.
  3. Nikolopoulou, M.; Lykoudis, S. Thermal Comfort in Outdoor Urban Spaces: Analysis across Different European Countries. Build. Environ. 2006, 41, 1455–1470. [Google Scholar] [CrossRef]
  4. Coccolo, S.; Kämpf, J.; Scartezzini, J.-L.; Pearlmutter, D. Outdoor Human Comfort and Thermal Stress: A Comprehensive Review on Models and Standards. Urban Clim. 2016, 18, 33–57. [Google Scholar] [CrossRef]
  5. Potchter, O.; Cohen, P.; Lin, T.-P.; Matzarakis, A. Outdoor Human Thermal Perception in Various Climates: A Comprehensive Review of Approaches, Methods and Quantification. Sci. Total Environ. 2018, 631–632, 390–406. [Google Scholar] [CrossRef] [PubMed]
  6. Golasi, I.; Salata, F.; De Lieto Vollaro, E.; Coppi, M.; De Lieto Vollaro, A. Thermal Perception in the Mediterranean Area: Comparing the Mediterranean Outdoor Comfort Index (MOCI) to Other Outdoor Thermal Comfort Indices. Energies 2016, 9, 550. [Google Scholar] [CrossRef]
  7. Jendritzky, G.; De Dear, R.; Havenith, G. UTCI—Why Another Thermal Index? Int. J. Biometeorol. 2012, 56, 421–428. [Google Scholar] [CrossRef]
  8. Perkins, S.E.; Alexander, L.V. On the Measurement of Heat Waves. J. Clim. 2013, 26, 4500–4517. [Google Scholar] [CrossRef]
  9. Horton, R.M.; Mankin, J.S.; Lesk, C.; Coffel, E.; Raymond, C. A Review of Recent Advances in Research on Extreme Heat Events. Curr. Clim. Change Rep. 2016, 2, 242–259. [Google Scholar] [CrossRef]
  10. Kim, D.-W.; Kwon, C.; Kim, J.; Lee, J.-S. Characteristics of Heat Waves from a Disaster Perspective. J. Prev. Med. Public Health 2020, 53, 26–28. [Google Scholar] [CrossRef]
  11. Yadav, N.; Rajendra, K.; Awasthi, A.; Singh, C.; Bhushan, B. Systematic Exploration of Heat Wave Impact on Mortality and Urban Heat Island: A Review from 2000 to 2022. Urban Clim. 2023, 51, 101622. [Google Scholar] [CrossRef]
  12. Lv, L.-S.; Yin, L.; Liu, Y.; Zhou, C.-L.; Hu, J.; An, N.; Xie, X.; Zhang, X.-E.; Zhang, M.; Liu, X.-Y. The Effect of Heatwave and Cold Spell on Cardiovascular Disease Mortality in Central China, 2018–2022. Int. J. Biometeorol. 2025, 69, 581–589. [Google Scholar] [CrossRef]
  13. Cheng, J.; Xu, Z.; Bambrick, H.; Su, H.; Tong, S.; Hu, W. Heatwave and Elderly Mortality: An Evaluation of Death Burden and Health Costs Considering Short-Term Mortality Displacement. Environ. Int. 2018, 115, 334–342. [Google Scholar] [CrossRef] [PubMed]
  14. Xi, D.; Liu, L.; Zhang, M.; Huang, C.; Burkart, K.G.; Ebi, K.; Zeng, Y.; Ji, J.S. Risk Factors Associated with Heatwave Mortality in Chinese Adults over 65 Years. Nat. Med. 2024, 30, 1489–1498. [Google Scholar] [CrossRef]
  15. Nguyen, C.V.; Nguyen, M.; Nguyen, T.T. The Impact of Cold Waves and Heat Waves on Mortality: Evidence from a Lower Middle-income Country. Health Econ. 2023, 32, 1220–1243. [Google Scholar] [CrossRef]
  16. Morakinyo, T.E.; Ren, C.; Shi, Y.; Lau, K.K.-L.; Tong, H.-W.; Choy, C.-W.; Ng, E. Estimates of the Impact of Extreme Heat Events on Cooling Energy Demand in Hong Kong. Renew. Energy 2019, 142, 73–84. [Google Scholar] [CrossRef]
  17. Zinzi, M.; Agnoli, S.; Burattini, C.; Mattoni, B. On the Thermal Response of Buildings under the Synergic Effect of Heat Waves and Urban Heat Island. Sol. Energy 2020, 211, 1270–1282. [Google Scholar] [CrossRef]
  18. Jiang, S.; Lee, X.; Wang, J.; Wang, K. Amplified Urban Heat Islands during Heat Wave Periods. JGR Atmos. 2019, 124, 7797–7812. [Google Scholar] [CrossRef]
  19. Chew, L.W.; Liu, X.; Li, X.-X.; Norford, L.K. Interaction between Heat Wave and Urban Heat Island: A Case Study in a Tropical Coastal City, Singapore. Atmos. Res. 2021, 247, 105134. [Google Scholar] [CrossRef]
  20. Wu, Y.; Zhao, K.; Huang, J.; Arend, M.; Gross, B.; Moshary, F. Observation of Heat Wave Effects on the Urban Air Quality and PBL in New York City Area. Atmos. Environ. 2019, 218, 117024. [Google Scholar] [CrossRef]
  21. Kalisa, E.; Fadlallah, S.; Amani, M.; Nahayo, L.; Habiyaremye, G. Temperature and Air Pollution Relationship during Heatwaves in Birmingham, UK. Sustain. Cities Soc. 2018, 43, 111–120. [Google Scholar] [CrossRef]
  22. Huang, X.; Yao, R.; Xu, T.; Zhang, S. The Impact of Heatwaves on Human Perceived Thermal Comfort and Thermal Resilience Potential in Urban Public Open Spaces. Build. Environ. 2023, 242, 110586. [Google Scholar] [CrossRef]
  23. Lam, C.K.C.; Gallant, A.J.E.; Tapper, N.J. Short-Term Changes in Thermal Perception Associated with Heatwave Conditions in Melbourne, Australia. Theor. Appl. Clim. 2019, 136, 651–660. [Google Scholar] [CrossRef]
  24. Yu, S.-Y.; Lin, T.-P.; Matzarakis, A. Heat Impact Assessment and Heat Prevention Suggestions for Thermal Comfort at Large-Area and Long-Duration Outdoor Sport Events in Taiwan. Atmosphere 2025, 16, 805. [Google Scholar] [CrossRef]
  25. Herdt, A.J.; Brown, R.D.; Scott-Fleming, I.; Cao, G.; MacDonald, M.; Henderson, D.; Vanos, J.K. Outdoor Thermal Comfort during Anomalous Heat at the 2015 Pan American Games in Toronto, Canada. Atmosphere 2018, 9, 321. [Google Scholar] [CrossRef]
  26. Tomczyk, A.M.; Bednorz, E. Thermal Stress during Heat Waves and Cold Spells in Poland. Weather. Clim. Extrem. 2023, 42, 100612. [Google Scholar] [CrossRef]
  27. Di Napoli, C.; Pappenberger, F.; Cloke, H.L. Verification of Heat Stress Thresholds for a Health-Based Heat-Wave Definition. J. Appl. Meteorol. Climatol. 2019, 58, 1177–1194. [Google Scholar] [CrossRef]
  28. Zendeli, D.; Colaninno, N.; Maiullari, D.; Van Esch, M.; Van Timmeren, A.; Marconi, G.; Bonora, R.; Morello, E. From Heatwaves to ‘Healthwaves’: A Spatial Study on the Impact of Urban Heat on Cardiovascular and Respiratory Emergency Calls in the City of Milan. Sustain. Cities Soc. 2025, 124, 106181. [Google Scholar] [CrossRef]
  29. He, B.-J.; Wang, J.; Liu, H.; Ulpiani, G. Localized Synergies between Heat Waves and Urban Heat Islands: Implications on Human Thermal Comfort and Urban Heat Management. Environ. Res. 2021, 193, 110584. [Google Scholar] [CrossRef] [PubMed]
  30. Molina, M.O.; Sánchez, E.; Gutiérrez, C. Future Heat Waves over the Mediterranean from an Euro-CORDEX Regional Climate Model Ensemble. Sci. Rep. 2020, 10, 8801. [Google Scholar] [CrossRef]
  31. Erlat, E.; Türkeş, M.; Aydin-Kandemir, F. Observed Changes and Trends in Heatwave Characteristics in Turkey since 1950. Theor. Appl. Climatol. 2021, 145, 137–157. [Google Scholar] [CrossRef]
  32. Wedler, M.; Pinto, J.G.; Hochman, A. More Frequent, Persistent, and Deadly Heat Waves in the 21st Century over the Eastern Mediterranean. Sci. Total Environ. 2023, 870, 161883. [Google Scholar] [CrossRef] [PubMed]
  33. Hochman, A.; Marra, F.; Messori, G.; Pinto, J.G.; Raveh-Rubin, S.; Yosef, Y.; Zittis, G. Extreme Weather and Societal Impacts in the Eastern Mediterranean. Earth Syst. Dynam. 2022, 13, 749–777. [Google Scholar] [CrossRef]
  34. Falasca, S.; Di Bernardino, A.; Salata, F. On the Identification and Characterization of Outdoor Thermo-Hygrometric Stress Events. Urban Clim. 2023, 52, 101728. [Google Scholar] [CrossRef]
  35. Petenko, I.; Mastrantonio, G.; Viola, A.; Argentini, S.; Coniglio, L.; Monti, P.; Leuzzi, G. Local Circulation Diurnal Patterns and Their Relationship with Large-Scale Flows in a Coastal Area of the Tyrrhenian Sea. Bound.-Layer Meteorol. 2011, 139, 353–366. [Google Scholar] [CrossRef]
  36. Di Bernardino, A.; Iannarelli, A.M.; Diémoz, H.; Casadio, S.; Cacciani, M.; Siani, A.M. Analysis of Two-Decade Meteorological and Air Quality Trends in Rome (Italy). Theor. Appl. Climatol. 2022, 149, 291–307. [Google Scholar] [CrossRef]
  37. Beck, H.E.; McVicar, T.R.; Vergopolan, N.; Berg, A.; Lutsko, N.J.; Dufour, A.; Zeng, Z.; Jiang, X.; Van Dijk, A.I.J.M.; Miralles, D.G. High-Resolution (1 Km) Köppen-Geiger Maps for 1901–2099 Based on Constrained CMIP6 Projections. Sci. Data 2023, 10, 724. [Google Scholar] [CrossRef]
  38. Fanger, P.O. Thermal Comfort: Analysis and Applications in Environmental Engineering; McGraw-Hill: New York, NY, USA, 1972; ISBN 9780070199156. [Google Scholar]
  39. Fanger, P.O. Assessment of Man’s Thermal Comfort in Practice. Occup. Environ. Med. 1973, 30, 313–324. [Google Scholar] [CrossRef]
  40. Guo, Y.; Gasparrini, A.; Armstrong, B.G.; Tawatsupa, B.; Tobias, A.; Lavigne, E.; Coelho, M.D.S.Z.S.; Pan, X.; Kim, H.; Hashizume, M.; et al. Temperature Variability and Mortality: A Multi-Country Study. Environ. Health Perspect. 2016, 124, 1554–1559. [Google Scholar] [CrossRef] [PubMed]
  41. Papadopoulos, G.; Keppas, S.C.; Parliari, D.; Kontos, S.; Papadogiannaki, S.; Melas, D. Future Projections of Heat Waves and Associated Mortality Risk in a Coastal Mediterranean City. Sustainability 2024, 16, 1072. [Google Scholar] [CrossRef]
  42. Nastos, P.; Saaroni, H. Living in Mediterranean Cities in the Context of Climate Change: A Review. Int. J. Climatol. 2024, 44, 3169–3190. [Google Scholar] [CrossRef]
  43. Settanta, G.; Fraschetti, P.; Lena, F.; Perconti, W.; Piervitali, E. Recent Tendencies of Extreme Heat Events in Italy. Theor. Appl. Clim. 2024, 155, 7335–7348. [Google Scholar] [CrossRef]
  44. Karl, T.R.; Nicholls, N.; Ghazi, A. (Eds.) CLIVAR/GCOS/WMO Workshop on Indices and Indicators for Climate Extremes Workshop Summary; Weather and Climate Extremes; Springer: Dordrecht, The Netherlands, 1999; pp. 3–7. [Google Scholar]
  45. Fischer, E.M.; Schär, C. Consistent Geographical Patterns of Changes in High-Impact European Heatwaves. Nat. Geosci. 2010, 3, 398–403. [Google Scholar] [CrossRef]
  46. Falasca, S.; Ciancio, V.; Salata, F.; Golasi, I.; Rosso, F.; Curci, G. High Albedo Materials to Counteract Heat Waves in Cities: An Assessment of Meteorology, Buildings Energy Needs and Pedestrian Thermal Comfort. Build. Environ. 2019, 163, 106242. [Google Scholar] [CrossRef]
  47. Perkins-Kirkpatrick, S.E.; Lewis, S.C. Increasing Trends in Regional Heatwaves. Nat. Commun. 2020, 11, 3357. [Google Scholar] [CrossRef]
  48. Oudin Åström, D.; Schifano, P.; Asta, F.; Lallo, A.; Michelozzi, P.; Rocklöv, J.; Forsberg, B. The Effect of Heat Waves on Mortality in Susceptible Groups: A Cohort Study of a Mediterranean and a Northern European City. Environ. Health 2015, 14, 30. [Google Scholar] [CrossRef]
  49. De’ Donato, F.; Leone, M.; Scortichini, M.; De Sario, M.; Katsouyanni, K.; Lanki, T.; Basagaña, X.; Ballester, F.; Åström, C.; Paldy, A.; et al. Changes in the Effect of Heat on Mortality in the Last 20 Years in Nine European Cities. Results from the PHASE Project. Int. J. Environ. Res. Public Health 2015, 12, 15567–15583. [Google Scholar] [CrossRef]
  50. Sánchez Jiménez, J.L.; Ruiz De Adana, M. Assessment of Outdoor Thermal Comfort in a Hot Summer Region of Europe. Atmosphere 2024, 15, 214. [Google Scholar] [CrossRef]
  51. Lai, D.; Lian, Z.; Liu, W.; Guo, C.; Liu, W.; Liu, K.; Chen, Q. A Comprehensive Review of Thermal Comfort Studies in Urban Open Spaces. Sci. Total Environ. 2020, 742, 140092. [Google Scholar] [CrossRef]
  52. Huang, B.; Dong, X.; Tian, Y.; Yin, M.; Qiu, Y.; He, B.-J. Experimental Investigation of the Thermal Usability of Outdoor Environments in Rideability, Walkability, Entertainmentability, Exercisability and Workability for Urban Heat Mitigation, Adaptation and Governance. Nat. Hazards 2024, 120, 2005–2034. [Google Scholar] [CrossRef]
Figure 1. (a) Geographical map of Italy: the yellow marker identifies the city of Rome. (b) Expansion of Rome (delimited by the black dashed circle) and its surroundings, with the red and cyan markers identifying the Boncompagni and Collegio Romano sites, respectively.
Atmosphere 16 01145 g001
Figure 2. Annual maximum (TXx) and minimum (TXn) values of daily maximum temperatures and annual maximum (TNx) and minimum (TNn) values of daily minimum temperatures for the years 2018–2023 at the Boncompagni site.
Atmosphere 16 01145 g002
Figure 3. (A) Number of heat waves and outdoor human thermal stress events detected in the years 2018–2023. (B) Frequency of events in (A).
Atmosphere 16 01145 g003
Figure 4. Intensity of events detected in the years 2018–2023: (A) heat waves and (B) outdoor human thermal stress events.
Atmosphere 16 01145 g004
Figure 5. Duration of heat waves and outdoor human thermal stress events during the years 2018–2023.
Atmosphere 16 01145 g005
Figure 6. Cumulative heat and cumulative extra-MOCI during the years 2018–2023.
Atmosphere 16 01145 g006
Table 1. Summary of input data and their features.
SiteVariable 1Time SpanNetworkPurpose
Collegio
Romano
Air Temperature2000–2020CREABaseline for the detection of HWs
BoncompagniAir Temperature,
wind speed,
relative humidity, and
solar irradiance
2018–2023ARPA LazioExtreme temperature indices
1 All variables have hourly frequencies.
Table 2. Indices for the identification and characterization of HWs and OHTS events applied in this study. The quantities apply to the May–September period of each year.
QuantityDescriptionUnits
Heat waves (HWs)A spell of at least six consecutive days with the daily maximum temperature exceeding the calendar day 90th percentile centered on a 5-day window for the reference period-
Outdoor human thermal stress events (OHTS events)A period of at least six consecutive days characterized by maximum daily values of the MOCI always being equal to or above 0.5. The maximum MOCI is computed considering the hourly MOCI values between 8:00 and 22:00 LT-
FrequencySum of all days of HWs/OHTS events [46][Days]
IntensityAverage temperature and MOCI across all days of HWs and OHTS events, respectively[°C] for HWs
[-] for OHTS
DurationNumber of days of the longest HW/OHTS event [Days]
Cumulative heat
(during HWs)
Sum of the anomaly between each HW day and the calendar day 90th percentile across all HW days [46][°C]
Table 3. Structure of the contingency table.
Predicted
EventNon-Event
PredictorEventab
Non-eventcd
Table 4. Hit Rate and False Alarm Rate (as percentage) computed for heat waves as “predictor” of outdoor human thermal stress events and for outdoor human thermal stress event as “predictor” of heat waves.
YearPredictor: Heat WavesPredictor: Outdoor Human Thermal Stress Events
Hit RateFalse Alarm RateHit RateFalse Alarm Rate
201826010060
202019010050
202128256663
202265010040
20233388245
Disclaimer/Publisher’s Note: The statements, opinions and data contained in all publications are solely those of the individual author(s) and contributor(s) and not of MDPI and/or the editor(s). MDPI and/or the editor(s) disclaim responsibility for any injury to people or property resulting from any ideas, methods, instructions or products referred to in the content.