Next Article in Journal
Can Heat Waves Fully Capture Outdoor Human Thermal Stress? A Pilot Investigation in a Mediterranean City
Previous Article in Journal
Responses of the East Asian Winter Climate to Global Warming in CMIP6 Models
 
 
atmosphere-logo
Article Menu

Article Menu

Article

Urban Health Assessment Through a Planetary Health Perspective: Methods and First Results from the Rome NBFC Experiment

by
Carmina Sirignano
1,2,*,
Daiane De Vargas Brondani
1,2,
Gianluca Di Iulio
1,3,
Chiara Anselmi
4,
Stefania Argentini
1,
Alessandro Bracci
1,
Carlo Calfapietra
2,4,
Silvia Canepari
5,
Giampietro Casasanta
1,
Giorgio Cattani
6,
Simona Ceccarelli
7,
Hellas Cena
8,9,
Tony Christian Landi
1,2,
Rosa Coluzzi
10,
Rachele De Giuseppe
8,
Stefano Decesari
1,2,
Annalisa Di Cicco
11,
Alessandro Domenico Di Giosa
12,
Luca Di Liberto
1,
Alessandro Di Menno di Bucchianico
6,
Marisa Di Pietro
3,
Oxana Drofa
1,
Simone Filardo
3,13,
Raffaela Gaddi
6,
Alessandra Gaeta
6,
Clarissa Gervasoni
2,14,
Alessandro Giammona
2,14,
Michele Pier Luca Guarino
15,
Laura De Gara
2,16,
Maria Cristina Facchini
1,
Vito Imbrenda
10,
Antonia Lai
17,
Stefano Listrani
12,
Alessia Lo Dico
2,14,
Lorenzo Marinelli
1,
Lorenzo Massimi
5,
Maria Cristina Monti
18,
Luca Mortarini
19,
Marco Paglione
1,2,
Ferdinando Pasqualini
1,
Danilo Ranieri
20,
Laura Restaneo
14,16,
Matteo Rinaldi
1,2,
Eleonora Rubin
16,
Andrea Scartazza
2,4,
Rosa Sessa
3,
Alice Traversa
20,
Lina Fusaro
2,21,†,
Annamaria Altomare
2,16,†,
Gloria Bertoli
2,14,† and
Francesca Costabile
1,2,*,†
add Show full author list remove Hide full author list
1
Institute of Atmospheric Sciences and Climate, National Research Council (CNR-ISAC), 00133 Rome, Italy
2
National Biodiversity Future Center (NBFC), 90133 Palermo, Italy
3
Department of Public Health and Infectious Diseases, Sapienza University, 00185 Rome, Italy
4
Research Institute on Terrestrial Ecosystems, National Research Council (CNR-IRET), 05010 Porano, Italy
5
Department of Environmental Biology, Sapienza University, 00185 Rome, Italy
6
Italian Institute for Environmental Protection and Research, 00144 Rome, Italy
7
Department of Experimental Medicine, Sapienza University, 00185 Rome, Italy
8
Laboratory of Dietetics and Clinical Nutrition, Department of Public Helath, Experimental and Forensic Medicine, University of Pavia, 27100 Pavia, Italy
9
Clinical Nutrition and Dietetics Service, Unit of Internal Medicine and Endocrinology, Istituti Clinici Scientifici Maugeri IRCCS, 27100 Pavia, Italy
10
Institute of Methodologies for Environmental Analysis, National Research Council (CNR-IMAA), 85050 Tito Scalo, Italy
11
Institute of Marine Sciences, National Research Council (CNR-ISMAR), 01330 Rome, Italy
12
Regional Environmental Protection Agency (ARPA), 20162 Rome, Italy
13
Regional Department of Clinical Microbiology, University Hospital Waterford, X91 ER8E Waterford, Ireland
14
Istituto di Bioimmagini e Sistemi Biologici Complessi, National Research Council (CNR-IBSBC), 20054 Segrate, Italy
15
Research Unit of Gastroenterology, Università Campus Bio-Medico, 00128 Rome, Italy
16
Department of Sciences and Technologies for Sustainable Development and One Health, Università Campus Bio-Medico, 00128 Rome, Italy
17
ENEA, Italian National Agency for New Technologies, Energy and Sustainable Economic Development, 00044 Frascati, Italy
18
Biostatistics and Clinical Epidemiology Unit, Department of Public Health, Experimental and Forensic Medicine, University of Pavia, 27100 Pavia, Italy
19
Department of Earth Sciences “Ardito Desio”, State University, 20133 Milan, Italy
20
Department of Life Sciences, Health and Health Professions, Link Campus University, 00165 Rome, Italy
21
Institute of BioEconomy, National Research Council (CNR-IBE), 01330 Rome, Italy
*
Authors to whom correspondence should be addressed.
These authors contributed equally to this work.
Atmosphere 2025, 16(10), 1144; https://doi.org/10.3390/atmos16101144
Submission received: 31 July 2025 / Revised: 12 September 2025 / Accepted: 27 September 2025 / Published: 29 September 2025
(This article belongs to the Section Air Quality and Health)

Abstract

Addressing the planetary crisis associated with climate change, biodiversity loss, global pollution, and public health requires novel and holistic approaches. Here, we present the methodology and initial results of an experiment conducted in Rome within the framework of the National Biodiversity Future Center (NBFC) project, Spoke 6. The major objective of this study was to outline the planetary health approach as a lens to assess urban health. This transdisciplinary case study explored the relationship between urban traffic-related external exposome and pro-oxidative responses in humans and plants. This methodology is based on the integration of atmospheric dynamics modeling, state-of-the-art aerosol measurements, biomonitoring in human cohorts, in vitro cellular assays, and the assessment of functional trait markers in urban trees. The results indicate that short-term exposure to urban aerosols, even at low concentrations, triggers rapid oxidative and inflammatory responses in bronchial epithelial cells, modulates gene and miRNA expression, alters gut microbiota diversity, and induces functional trait changes in urban trees. This study also highlights the feedback mechanisms between vegetation and atmospheric conditions, emphasizing the role of urban greenery in modulating microclimate and exposure. The methodology and initial results presented here will be further analyzed in future studies to explore proof of a cause–effect relationship between short-term exposure to traffic-related environmental stressors in urban areas and oxidative stress in humans and plants, with implications for chronic responses. In a highly urbanized world, this evidence could be pivotal in motivating the widespread implementation of planetary health approaches for assessing urban health.

1. Introduction

Air pollution, especially in urban areas, is the second leading cause of death worldwide, causing 8.1 million deaths yearly [1]. Fine particulate matter (PM2.5, aerodynamic diameter dp ≤ 2.5 μm, including also PM1, aerodynamic diameter dp ≤ 1 μm) causes 58% of this mortality [1] and 5 million premature deaths [2]. The PM2.5 mass concentration in European countries has decreased over the past 20 years [3]. Although mortality and morbidity also occur at low PM2.5 levels [4,5,6,7,8], our understanding of the concentration–response relationship at the current EU levels remains incomplete. In particular, the contribution of short-term exposure to long-term outcomes remains unclear, as highlighted in recent literature [9]. This underscores the need to better understand the mechanisms linking acute responses to chronic effects. The new EU air quality directive (EC/2024/2881) focuses on monitoring ultrafine particles (UFPs), black carbon (BC), and Oxidative Potential (OP).
Climate change, global pollution, biodiversity loss, and public health crises have emerged as planetary problems [10] that affect the entire Earth system. The study of interconnections is the frontier of this research. For example, air pollution and climate change are interconnected through complex mechanisms, including reactive pollutant formation from hot weather and UV radiation [11], and this affects the health of the planet, including people, vegetation, and ecosystems, from a One Health (https://www.who.int/news-room/fact-sheets/detail/one-health, accessed on 30 July 2025) perspective. Planetary health is the science of these relationships, exploring how human, animal, and plant health are connected as one in the health of the planet [12,13,14,15].
Human health depends on both genetic and environmental factors. The exposome encompasses all human environmental exposures from conception to death, including external (environmental pollutants), internal (chemical metabolism and inflammation), and general external (climate) exposomes [16,17]. Cities house over half of the world’s population [18], with the urban exposome representing combined exposure to urban stressors, such as air pollution, heat, noise, climate, extreme events, and a lack of green space [16].
Novel approaches are needed to address urban health using the exposome approach. Giammona et al. (2024) [19] reviewed the literature describing the involvement of microRNAs (miRNAs) or long noncoding RNAs on the main biological processes involved in oxidative stress, inflammation, autophagy (PI3K), cell proliferation (NFkB, STAT3), and EMT (Notch, AKT, Wnt/β-catenin) pathways. miRNAs, as well as gene expression profiles, respond to air pollution, particularly PM2.5, modulating some key genes involved in epigenetic modification or in key mediators of biological processes. Assessing miRNAs in cell lines and human fluids in response to exposure to urban environmental stressors can provide valuable information. Long-term exposure of lung cells to PM2.5 could alter the expression of miRNAs, causing alterations in the tissue involved in the onset of a pathological state. Vriens et al. (2016) [20] suggested a possible epigenetic mechanism via which cells respond rapidly to small particles as exemplified by miR-222 changes in the extracellular fraction of saliva.
Human biomonitoring is a key tool for defining exposure–disease risks, particularly for assessing human exposure to air pollution [17,21,22]. The levels of substances measured in body fluids (blood, urine, and saliva) or tissues (hair) can aid in identifying the potential health risks associated with environmental exposure. From a One Health perspective, the importance of air pollution on individual health has recently emerged through the development of human intestinal dysbiosis, characterized by alterations in microbial biodiversity [23]. The intestinal microbiota plays a key role in the health of individuals by performing several strategic functions, such as the production of antimicrobial substances and immune system stimulation [24]. Moreover, intestinal bacteria produce short-chain fatty acids, which control the differentiation of intestinal epithelial cells, synthesize vitamin K, biotin, and folates, and intervene in the metabolism of bile acids, hormones, and drugs [23]. In addition to air pollution, other factors that determine the modulation of the intestinal microbiota belong to the patient’s lifestyle, including eating habits, drug intake, and physical activity levels.
Nature-based Solutions (NbS) are a measure for mitigating urban environmental stressors in cities. Urban trees and plants, especially their leaves, can trap and absorb airborne particles [25,26]. By improving air quality, urban vegetation contributes to the overall well-being of city inhabitants and enhances urban aesthetics. Although urban stressors can be mitigated by vegetation, they can also negatively affect plants [27]. High concentrations of PM2.5 can damage leaf structures by clogging stomata, thereby reducing photosynthetic efficiency and gas exchange. Over time, this can lead to reduced growth, vitality, and overall health of the plants [28]. Certain types of PM2.5, particularly UFPs containing heavy metals, can be toxic to plants and alter their biochemical processes. Highlighting the delicate balance between these processes in urban ecosystems and understanding the negative aspects of this relationship are crucial factors for developing sustainable urban greening strategies.
In this study, we present the methodology and first results of an experiment conducted in Rome (Italy) within the framework of the National Biodiversity Future Center (NBFC, https://www.nbfc.it/, accessed on 30 July 2025). NBFC is the first National Research and Innovation Center in Italy dedicated to biodiversity, funded by the Italian Ministry of Research through European Union resources under the NextGenerationEU initiative. The primary objective of NBFC is to develop effective strategies for monitoring, conserving, restoring, and enhancing biodiversity across various Italian regions. Spoke 6 of NBFC focuses on envisioning sustainable and resilient cities centered on human well-being, where health and quality of life are improved through the integration of NbS. Its mission is to promote innovative approaches to enhance urban health and well-being by addressing biodiversity loss and mitigating the adverse effects of the exposome on health [14]. We conducted the experiment described here in the context of NBFC–Spoke 6.
The major objective of this paper is to outline the holistic planetary health approach used in the Rome NBFC experiment as a lens to assess urban health. Our study builds a transdisciplinary case study to explore the relationships linking urban traffic-related external exposome and pro-oxidative responses in humans and plants.
The methodology is based on the integration of atmospheric dynamics modeling, state-of-the-art in situ aerosol measurements, biomonitoring in human cohorts, in vitro cellular assays, and assessment of functional trait markers in urban trees. Figure 1 summarizes the approach adopted in the Rome NBFC experiment. We assessed in situ aerosol physicochemical properties on time scales of minutes during both intensive (three months) and extensive (four years) field measurements. The focus was on particle size distributions (particle diameter from 8 to 1000 nm), fine particulate matter (PM2.5 and PM1) chemical components (BC, organic aerosols, nitrates, and metals), acellular reactive oxygen species (ROS), Oxidative Potential, and source apportionment analysis. Cellular response to PM2.5 and PM1 samplers was evaluated in vitro in lung epithelial cell lines. Viability and morphological alterations were evaluated as preliminary assays for subsequent cellular ROS level assessments. Epigenetic markers of inflammation and oxidative stress, as well as their related microRNAs (miRNAs), were assessed in human lung epithelial cell lines and human specimens (saliva) over sub-daily periods (6–12 h). The biodiversity of the gut microbiota was assessed for one year in an urban population cohort (IBD/IBS cohort). Biological characterization of PM1 aerosol fractions was conducted using metagenomic analysis of airborne environmental DNA. A Parallelized Large-Eddy Simulation Model (PALM) [29] was used to investigate the role of vegetation and meteorological conditions in PM2.5 dynamics by simulating variations in vegetation cover using two nested domains with different resolutions. Functional traits related to the photosynthetic machinery were analyzed in two evergreen species, Quercus ilex L. and Laurus nobilis L., which were sampled at increasing distances from a major road and were expected to have different sensitivities to PM2.5-induced oxidative stress. Here, we present the methodology and the initial results, which will be analyzed in future studies.

2. Materials and Methods

2.1. Sites

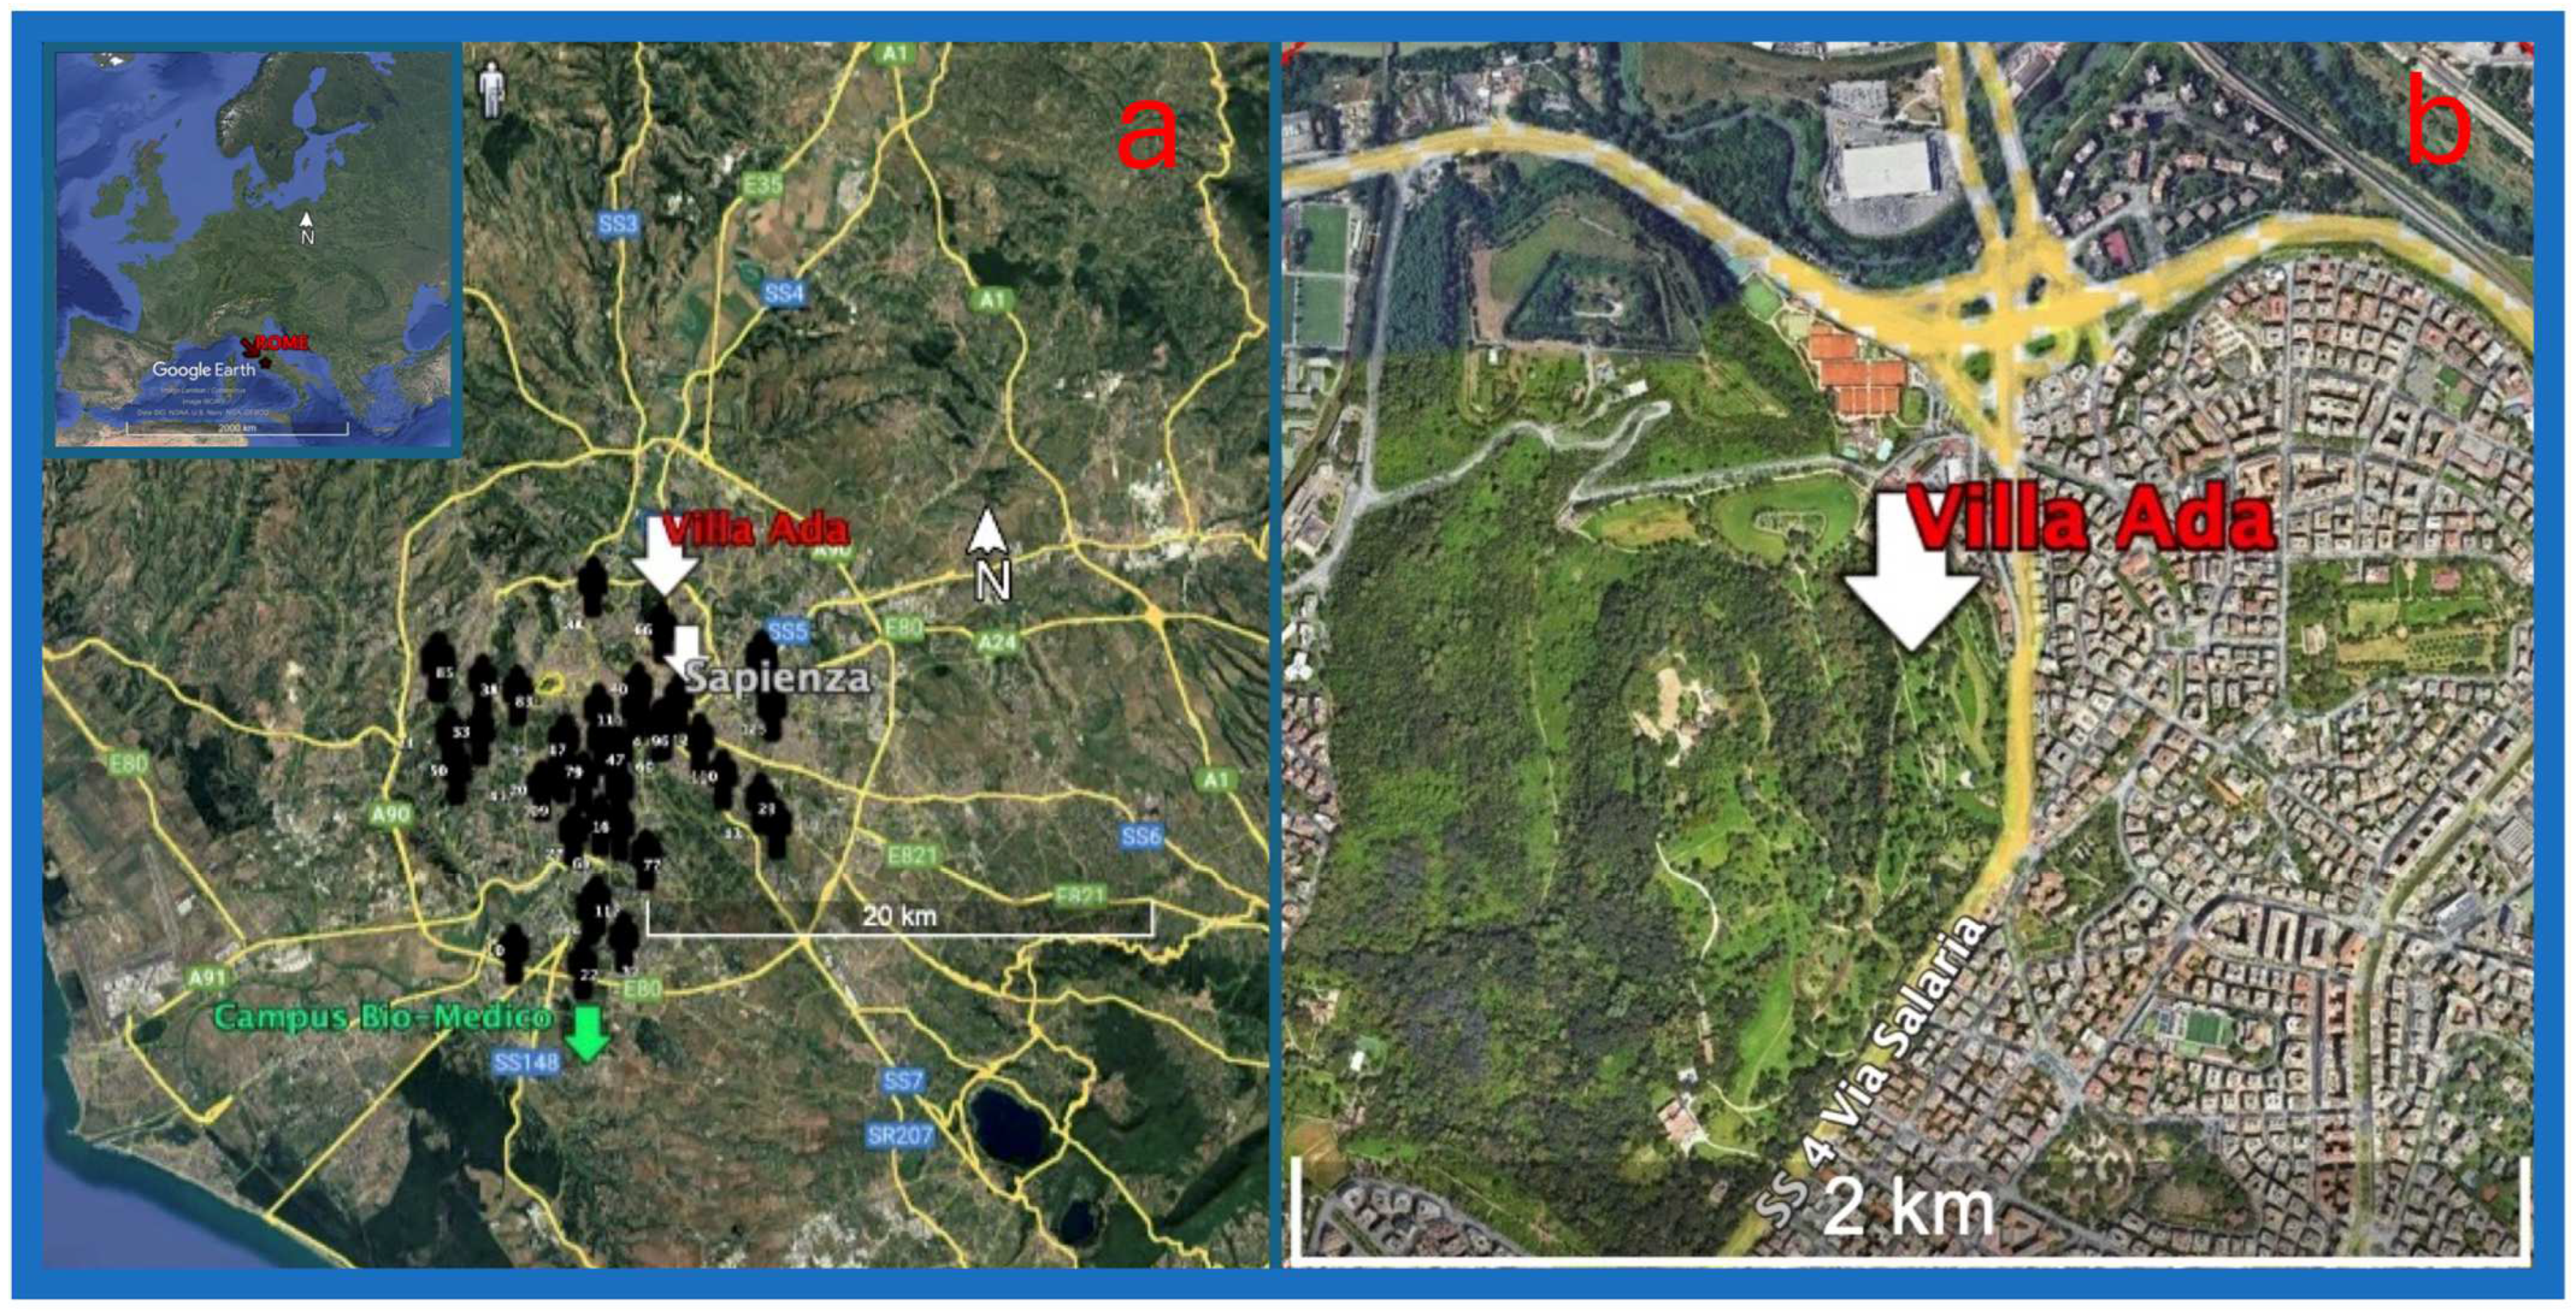
The experiment was conducted in Rome (Italy) (Figure 2). Sampling and measurements were performed at several locations. These include a site in an urban forest, Villa Ada Park (Villa Ada), which is considered representative of urban background conditions, located in downtown Rome. The site is close to Via Salaria (SS4), a heavily trafficked road.
An intensive field campaign was conducted from late spring to early summer in 2025 at this site. Measurements were also taken at the University of Rome La Sapienza in downtown Rome (Sapienza), representative of traffic exposure, and at Campus Bio-Medico University (Campus Bio-Medico), representative of the suburban background.
The concentrations of regulated air pollutants, such as PM2.5, O3, and NO2, in the ambient air of Rome were obtained from the air quality monitoring network of the regional environmental protection agency (ARPA Lazio, https://www.arpalazio.it, accessed on 30 July 2025), specifically from an urban background station located within the urban park of Villa Ada. Prior to the intensive field campaign of the Rome NBFC experiment, proxy data of urban traffic exposure and samples of fine particulate matter collected at Villa Ada were also obtained from ARPA Lazio monitoring activity. Micrometeorological data were collected from the nearest urban station (AL007, Boncompagni) of the regional micrometeorological monitoring network operated by ARPA Lazio. This dataset was used to reconstruct the patterns of the study area and spanned July 2020 to July 2024.
The choice of measurement sites was based on the relevant air quality representativeness as indicated by the EU Air quality regulations. Villa Ada Park is a supersite of the regional air quality environmental protection agency (ARPA Lazio), representative of the urban background, being within a large green area in central Rome, yet close to a major traffic corridor (Via Salaria), and residential areas. Sapienza University can be considered as representative of an urban background with minimal vegetation highly influenced by traffic. The sites are close to each other, less than 3 km apart, both representative of the urban background according to the European Environmental Agency’s criteria, differing only in the urban forest present at Villa Ada Park (for which this site was chosen by ARPA Lazio as the supersite representative of the urban background of Rome). Campus Bio-Medico University serves as a suburban background site, being in a park, 30 km far from downtown Rome. These sites were selected to capture a gradient of urban exposure conditions and were chosen also because experimental campaigns data were supported by existing air quality and meteorological monitoring networks on sites (ARPA Lazio), ensuring spatial and contextual relevance for the study objectives.

2.2. PM2.5 Modeling

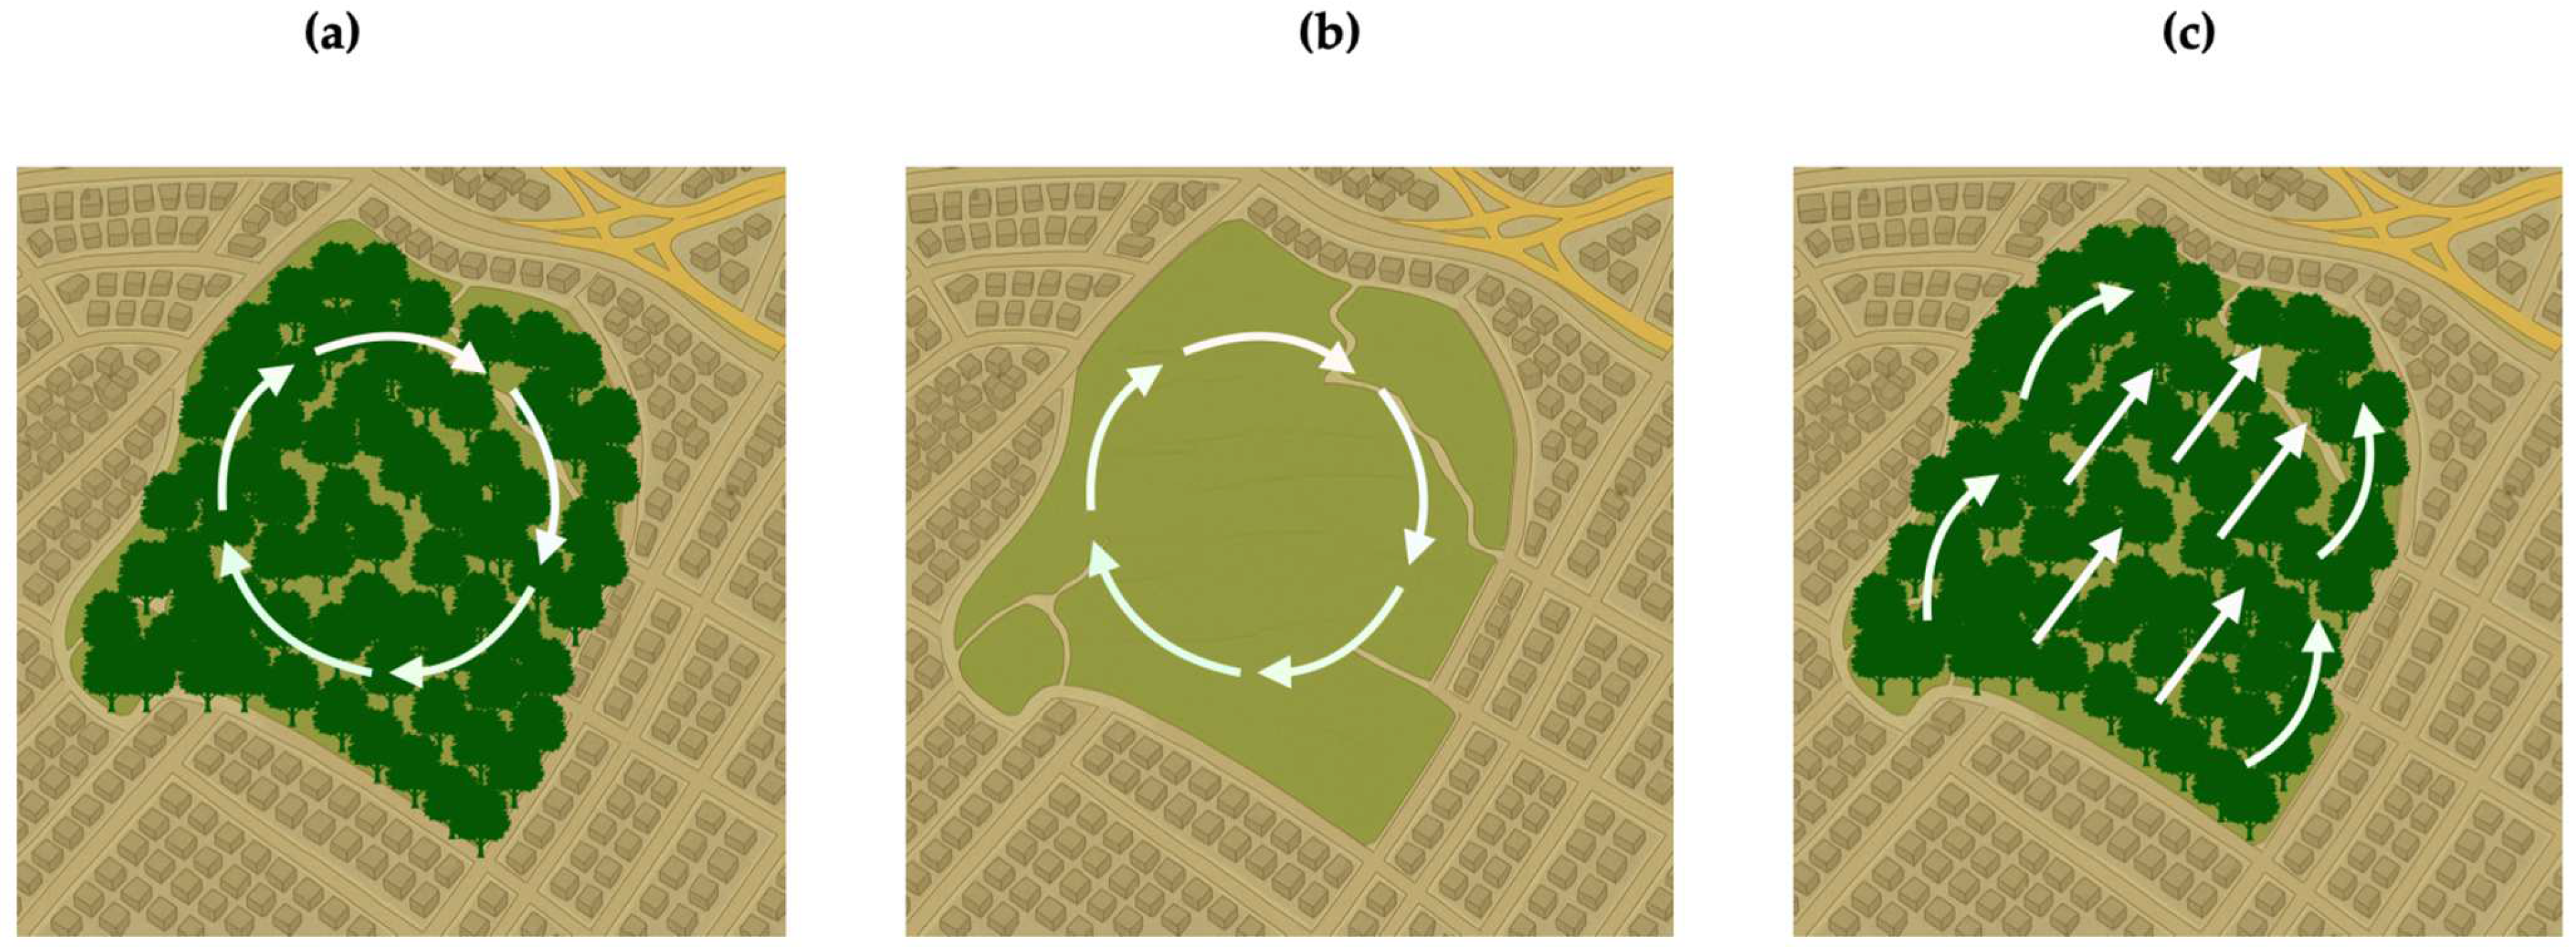
High-resolution numerical experiments using PALM [29] were conducted to evaluate the role of vegetation and meteorological conditions in PM2.5 dynamics at Villa Ada. Two nested domains were used in this study. The outer domain, representing the broader urban area of Rome, covers a 5 × 5 km area with an isotropic grid of 20 m resolution. The inner domain, centered on Villa Ada Park, spans a 2× 2 km area using a 10 m resolution isotropic grid. Interactive feedback between the domains was ensured using a two-way nesting setup with mixed data transfer. The three distinct simulated scenarios are illustrated in Figure 3. The first scenario (Scenario 1, Figure 3a) represents the baseline, that is, the actual vegetation of the park as derived from the CLC plus Backbone Copernicus product (https://land.copernicus.eu/en/products/clc-backbone, accessed on 30 July 2025) under heatwave conditions with stagnant airflows. The second scenario (Scenario 2, Figure 3b) shared the same meteorological forcing, but the park vegetation was replaced with short grass. In the third scenario (Scenario 3, Figure 3c), the effect of a post-rainfall episode with enhanced ventilation was simulated, considering actual Villa Ada Park vegetation. In all simulations, PM2.5 was treated as a passive tracer, neglecting chemical reactions. The traffic emissions are parameterized using OpenStreetMap (OSM), based on street types supplied in the additional static driver input file used by PALM. Meteorological boundary conditions were provided by the MOLOCH model [30] to ensure realistic inputs of the wind and potential temperature profiles. Simulations for Scenarios 1 and 2 began on 8 October 2023, at 03:00 UTC, whereas Scenario 3 (after rain) began on 23 October 2023, at 03:00 UTC. Each simulation was run for 24 h, preceded by an additional 24 h spin-up period to allow for model adjustment and stabilization.

2.3. Atmospheric Aerosol Measurements

2.3.1. Sampling Lines

At the Villa Ada site, the equipment was deployed within AEROLAB, an exploratory mobile platform housed in an insulated ISO 10’ container and designed to host both advanced in situ and remote sensing instrumentation for aerosol and atmospheric measurements. The facility was developed following the ACTRIS (https://www.actris.eu/, accessed on 30 July 2025) guidelines for mobile atmospheric laboratory, including standardized sampling line, internal temperature and humidity control, and data quality procedures.
Four different sampling lines were housed in AEROLAB.
All equipment used to characterize aerosol microphysical and optical properties was connected to the first sampling line through an aerosol splitter. In this 2 m long stainless-steel line, aerosols were sampled through a PM1 sampling head and dried to a relative humidity of approximately 20–30% using a Nafion dryer (Perma Pure, Lakewood, CA, USA).
A second sampling line drew ambient air through a cyclone with a size cutoff of 2.5 µm at a flow rate of 2.5 L min−1 for chemical speciation. Submicron aerosol was then sampled after drying the air flow (RH < 40%) through a critical orifice of 100 μm diameter at the inlet of an Aerosol Chemical Speciation Monitor (ACSM).
A third sampling line was dedicated to PM1 sample collection for OP and metal analysis using dual-channel samplers operating at 2.3 m3/h (Gemini; Dadolab Srl, Cinisello Balsamo, MI, Italy). Parallel daily PM1 samples were collected on PTFE membrane filters (Pall R2PJ047, Pall Life Sciences, Ann Arbor, MI, USA) and 47 mm quartz fiber filters (Pallflex Tissuquartz 2500 QAO-UP, Pall Life Sciences, Ann Arbor, MI, USA). Fifty samples were collected for each filter type. PTFE filters were used for the elemental analysis of both water-soluble and insoluble metal fractions and the assessment of the OP in the water-soluble fraction (Section 2.4.1). Quartz fiber filters were analyzed for total OP (Section 2.4.2), and for cell viability and morphology (Section 2.5.1), as preliminary assays for cellular ROS level assessment.
The fourth sampling line was used to characterize the biological components of the aerosols. This consists of a PM1 cyclone that draws air from the outside and, through a stainless-steel line, deposits the particulate matter onto a filter mounted on a custom-designed filter holder, which ensures a uniform distribution of the sample over the entire analysis surface. The system was connected to a pump that maintained a laminar flow throughout the sampling process.

2.3.2. Particle Number Size Distribution

The Particle Number Size Distribution (PNSD) was measured using a custom-built Scanning Mobility Particle Sizer (SMPS) from TROPOS (Leipzig, Germany) [31], equipped with a butanol-based condensation particle counter (CPC, TSI model 3772). The SMPS measured in the electrical mobility particle diameter range of 10–800 nm. The setup involved particle neutralization using a bipolar charger, classification using a Differential Mobility Analyzer (DMA), and counting using the CPC. To complement this, the total particle number concentration was continuously measured by a TSI CPC 3750, butanol-based condensation particle counter (TSI Inc., Shoreview, MN, USA). The instrument was configured and validated for operation with a 50% cut-off diameter (Dp50) of 10 nm in accordance with the ACTRIS data quality requirements. Particle size-dependent losses in the sampling line were calculated according to Hinds (1999) [32].

2.3.3. Non-Refractory PM1 Chemical Characterization

A quadrupole ACSM (Q-ACSM; Aerodyne Research Inc., Billerica, MA, USA) was used to measure the composition and mass of non-refractory submicron aerosols (organics, sulfate, nitrate, ammonium, and chloride) with a time resolution of 30 min [33]. Submicron aerosols sampled at the inlet of the ACSM’s aerodynamic lens were flash-vaporized at approximately 600 °C and subsequently ionized by electron impact ionization at 70 eV. Finally, the fragments were detected using a quadrupole mass spectrometer. The nitrate ionization efficiency and relative ionization efficiencies for sulfate and ammonium were determined through calibration with ammonium nitrate and ammonium sulfate aqueous solutions, as described by Freney et al. (2019) [34].

2.3.4. Aerosol Optical Properties

Aerosol optical properties were assessed using a 3-wavelength nephelometer (Aurora 3000, Ecotech Pty Ltd (Acoem), Knoxfield, VIC, Australia) and a 7-wavelength (370, 470, 520, 590, 660, 880, and 950 nm) aethalometer (model A33, Magee Scientific, Ljubljana, Slovenia). The AE33 provided BC mass concentration (equivalent BC, eBC [35]) with a 1 min time resolution. According to the instrument manufacturer, the eBC mass concentration from AE33 was obtained from measurements at λ = 880 nm with a mass absorption coefficient of 7.77 m2 /g. eBC was continuously measured at the Villa Ada site, since July 2020. In a preliminary test experiment, measurements were also taken both indoors and outdoors at Sapienza [6]. The nephelometer provided measurements of the aerosol total scattering and backscattering coefficients at 450, 525, and 635 nm. The source apportionment of eBC from fossil fuels (eBCff) and biomass burning (eBCbb) was performed following the “aethalometer model” [36]. Further insights on the eBC measurement and source apportionment at the site are the focus of future work.

2.3.5. BC and Urban Heat Island

BC, particularly its traffic-related fraction, exerts a positive radiative forcing due to its ability to absorb radiation in the visible range and re-emit it in the infrared, thereby playing a role in increasing temperatures in urbanized areas [37]. BC was considered in relation to the UHI effect primarily due to its unique optical properties, which distinguish it from broader particulate matter (PM) categories such as PM2.5. Although PM is widely studied in relation to UHI through its role in aerosol optical depth (AOD) and radiative forcing, recent results also highlight the role of BC in aggravating UHI, especially during nighttime, for example, the study by Wang et al. (2022) [38]. The urban heat island (UHI) intensity was estimated using the method developed by [39] and applied to the city of Rome by Cecilia et al. (2023) [40], based on the satellite-derived imperviousness (IMP) product. This variable represents the degree of urbanization, expressed as the percentage of sealed or built-up surfaces, ranging from 0% (completely rural) to 100% (fully urbanized). This method relies on the assumption of a linear relationship between air temperature and imperviousness. For each hourly interval, linear regression was performed using temperature values from 12 fixed weather stations and the corresponding IMP values calculated within a 1400 m radius around each station. The UHI intensity was then estimated as the temperature difference between a fully urbanized area and a completely rural area (UHI = T(100) − T(0)) based on the slope of the regression.

2.3.6. Aerosol Profiling

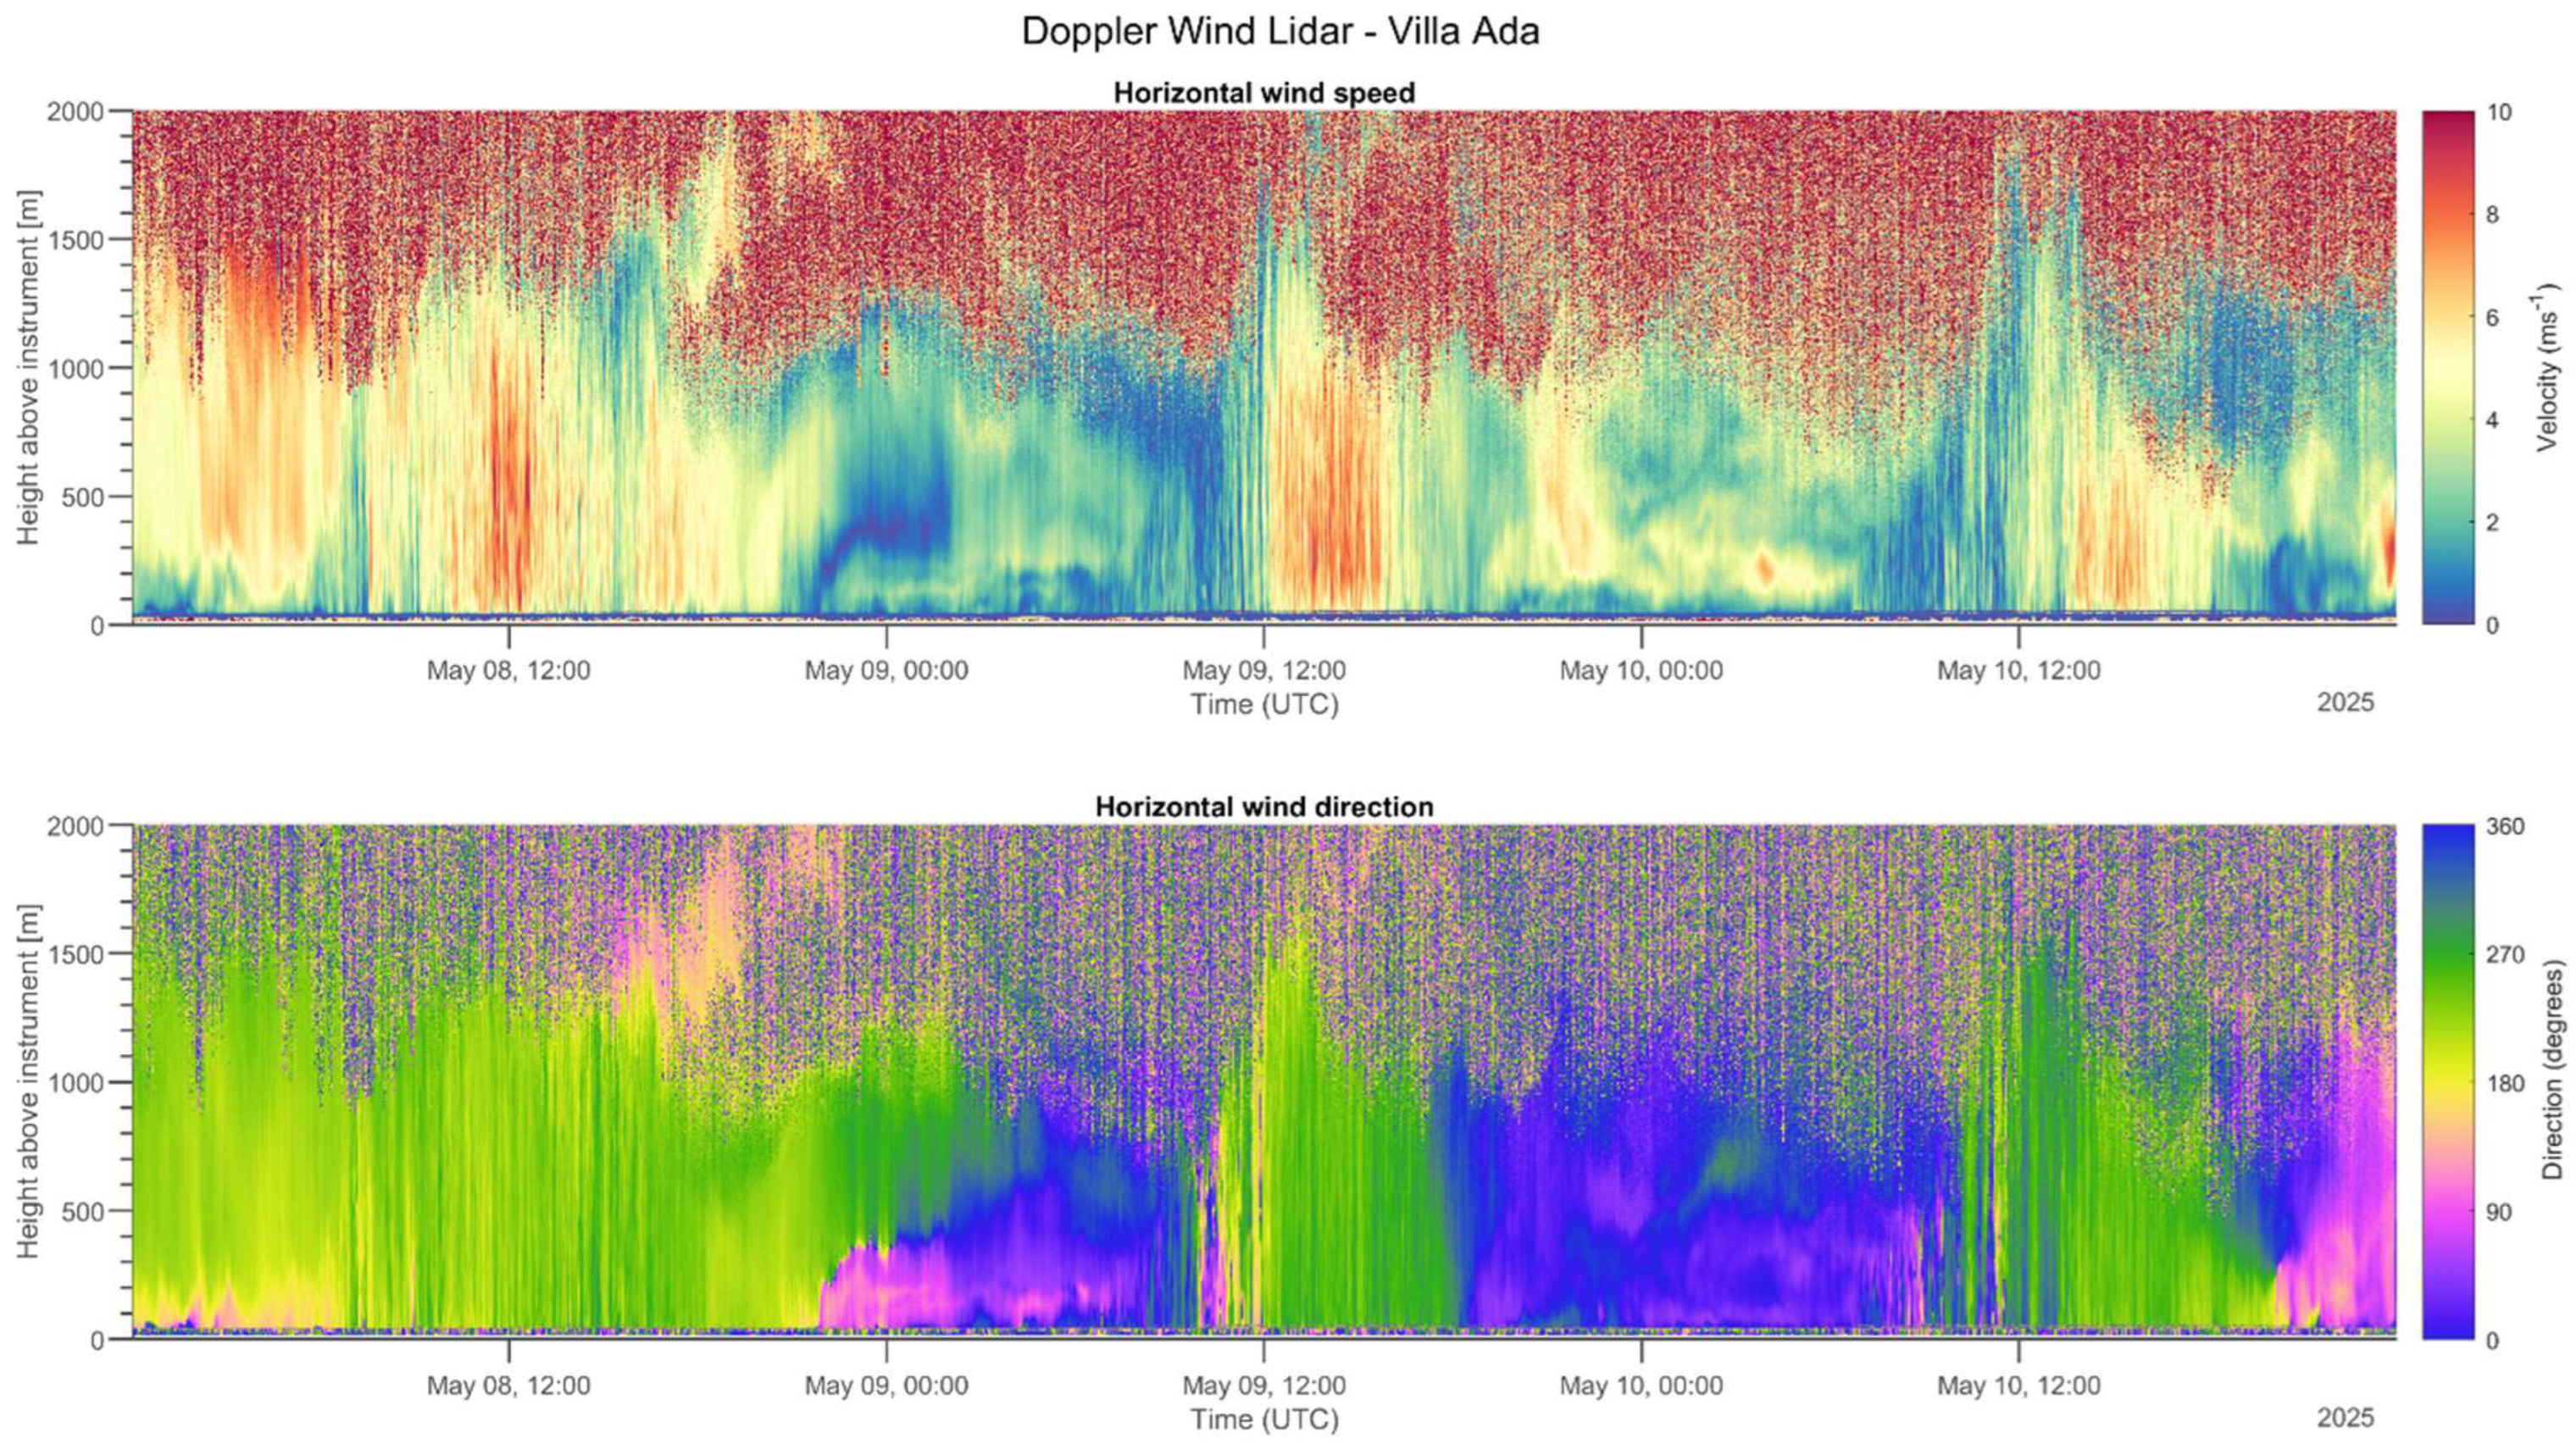
A Doppler Lidar Halo (METEK GmbH, Elmshorn, Germany) was deployed. The Doppler Wind Lidar StreamLine XR emits laser pulses at 1.5 μm with low energy and a high repetition rate. It delivers range-resolved measurements of backscattered radiation from atmospheric aerosols and clouds, as well as their radial velocities, based on the Doppler shift of the backscattered signal. By exploiting its scanning capability, it enables the retrieval of both vertical and horizontal wind using aerosols as tracers [41].

2.3.7. Insoluble and Soluble Metals

PTFE filters were weighed before and after sampling to determine the PM1 mass concentrations. Elemental characterization was performed by separating the water-soluble and insoluble fractions [42]. This method provides insights into the chemical form in which each element is present, which can be indicative of its emission source [43].
Briefly, the plastic support ring was removed from each filter, which was then extracted in 10 mL of deionized water for 30 min using a rotating agitation (RA; Rotator, 60 rpm; Rotator, Glas-Col, Terre Haute, IN, USA). The extract was filtered through a cellulose nitrate filter (0.45 μm pore size; Merck Millipore Ltd., Billerica, MA, USA). Both the original membrane filter and cellulose nitrate filter were subsequently digested using microwave-assisted acid digestion (Ethos Touch Control with Q20 rotor, Milestone, Bergamo, Italy) with 2 mL of concentrated HNO3 (67%) and 1 mL of H2O2 (30%) (Promochem, LGC Standards GmbH, Wesel, Germany). The digested solutions were diluted to 50 mL with deionized water and filtered using syringe filters (0.45 μm pore size; GVS Filter Technology, Morecambe, UK).
Element concentrations in both fractions were quantified using inductively coupled plasma mass spectrometry (ICP-MS; PlasmaQuant MS Q, Analitik Jena GmbH + Co. KG, Jena, Germany) equipped with a glass nebulizer (0.4 mL min−1; Analytik Jena AG, Jena, Germany).

2.3.8. Bioaerosol in PM1

Particles for metagenomic characterization of bioaerosol were collected on electrostatic filters (AirPrep™, InnovaPrep, Drexel, MO, USA) using a dedicated sampling line (Section 2.3.1). The sampling time was determined through preliminary DNA concentration tests with one daily sample operated at 2.5 L min−1. Negative controls were included to prevent any contamination. The PM1 electrostatic filter samples were eluted using a PBS AirPrep Elution Kit (InnovaPrep, Drexel, MO, USA). DNA extraction from low-biomass samples was performed according to the method described by Heavens et al. (2021) [44]. Metagenomic sequencing will be performed using Oxford Nanopore Technologies MinION with R.10.4.1 flow cell and Rapid Barcoding Kit (SQK-RBK114.24). Sequences will be analyzed using MARTi software [45,46], which provides taxonomic and antimicrobial resistance gene information supporting several classification methods (e.g., BLAST, Centrifuge, Kraken2) [45,46].

2.3.9. Indoor UFP

The Particle Number Concentration (PNC) was simultaneously measured indoors at two sites in Rome using condensation particle counters (CPC3007, TSI Inc., Shoreview, MN, USA; minimum detectable particle (D50): 10 nm; time resolution: 1 min).
The first sampler was placed on the third floor of the Hygiene Building of the Sapienza University Campus, and the second sampler was placed on the first floor of the Research and Teaching Hub of the Campus Bio-Medico University (Sapienza and Campus Bio-Medico in Figure 2).
The isopropyl alcohol reservoir of the samplers has a capacity that allows 6–8 h of continuous operation. Thus, a 4.5 h measurement cycle was adopted (9:00 a.m.–1:30 p.m.). Before each cycle, isopropyl alcohol cartridges and batteries were changed, along with zero-check and leak-proof tests, following the manufacturer’s instructions.

2.4. Particle-Bound Reactive Oxygen Species and Oxidative Potential

2.4.1. Particle-Bound ROS

Particle-bound ROS (PB-ROS) were measured using two complementary approaches: a semi-continuous system based on a particle-into-liquid sampler (PILS) and an offline filter-based method. Both methods employed the 2,7-dichlorofluorescein (DCFH) assay to quantify ROS activity.
The PILS system operated at a time resolution of 2 h, collecting soluble species and suspending insoluble particles into an aqueous solution. Ambient air was sampled at a flow rate of 15 L·min−1 through a PM2.5 cyclone. The collection efficiency of the PILS system has been reported to be greater than 97% for particles with diameters between 0.03 and 10 μm [47]. This has been further supported by our recent work by Di Iulio et al. (2025) [48], where we show that PB-ROS measured with PILS are largely associated with nanoparticles. Sorooshian et al. (2006) [49] highlighted that the efficiency of particle activation in the condensation chamber can be sensitive to the water accommodation coefficient, particularly for strongly insoluble particles. However, since the present study focuses on urban background aerosol, where particles are not completely insoluble but exhibit different degrees of hygroscopicity, the underestimation of insoluble nanoparticles can be considered negligible.
In parallel, a PM1 sampling line collected aerosol particles on PTFE filters. Each filter was extracted in 10 mL of deionized water via rotary agitation (60 rpm; Glas-Col, Terre Haute, IN, USA) for 30 min. The extract was then analyzed using the DCFH assay, following the protocol by Massimi et al. (2020) [42]. Results from both PILS- and filter-based PB-ROS analyses were converted to nanomole H2O2 equivalents. PB-ROS concentrations are presented as volume-normalized levels—in units of nmol H2O2·L−1 for the PILS and nmol H2O2·m−3 for the filter-based method—and as mass-normalized values (nmol H2O2·µg−1).

2.4.2. Oxidative Potential

The Oxidative Potential (OP) of PM was assessed exclusively using the dithiothreitol (DTT) assay. Water-soluble OP was determined using PM1 samples collected on PTFE filters. Each filter was extracted in 10 mL of deionized water under rotary agitation (60 rpm; Glas-Col, USA) for 30 min. The extract was filtered through a nitrocellulose membrane and analyzed following the protocol by Massimi et al. (2020) [42].
Total OP was assessed from PM1 samples collected on quartz fiber filters. Three portions of each filter were extracted in 0.7 mL of deionized water under rotary agitation (30 rpm; Glas-Col, USA) for 30 min. The extract and the residual filter portion were then subjected to the DTT assay, according to Gao et al. (2017) [50] and Giammona et al. (2025, under review) [51].
All OP results were expressed both as volume-normalized concentrations (nmol DTT min−1·m−3) and as mass-normalized values (nmol DTT min−1·µg−1).

2.5. In Vitro Cell Lines

2.5.1. Cell Viability and Morphology

BEAS-2B cells (CRL-3588™) were purchased from ATCC (Manassas, VA, USA) and maintained at 37 °C in an incubator with a 5% CO2-humidified atmosphere in RPMI-1640 medium (Sigma-Aldrich, Merck KGaA, Darmstadt, Germany) supplemented with 10% fetal bovine serum (Gibco, Thermo Fisher Scientific, Waltham, MA, USA), 1 mm sodium pyruvate (Gibco, Thermo Fisher Scientific, Waltham, MA, USA), 100 U/mL penicillin, 100 mg/mL streptomycin, and 2 mM L-glutamine (Gibco, Thermo Fisher Scientific, Waltham, MA, USA).
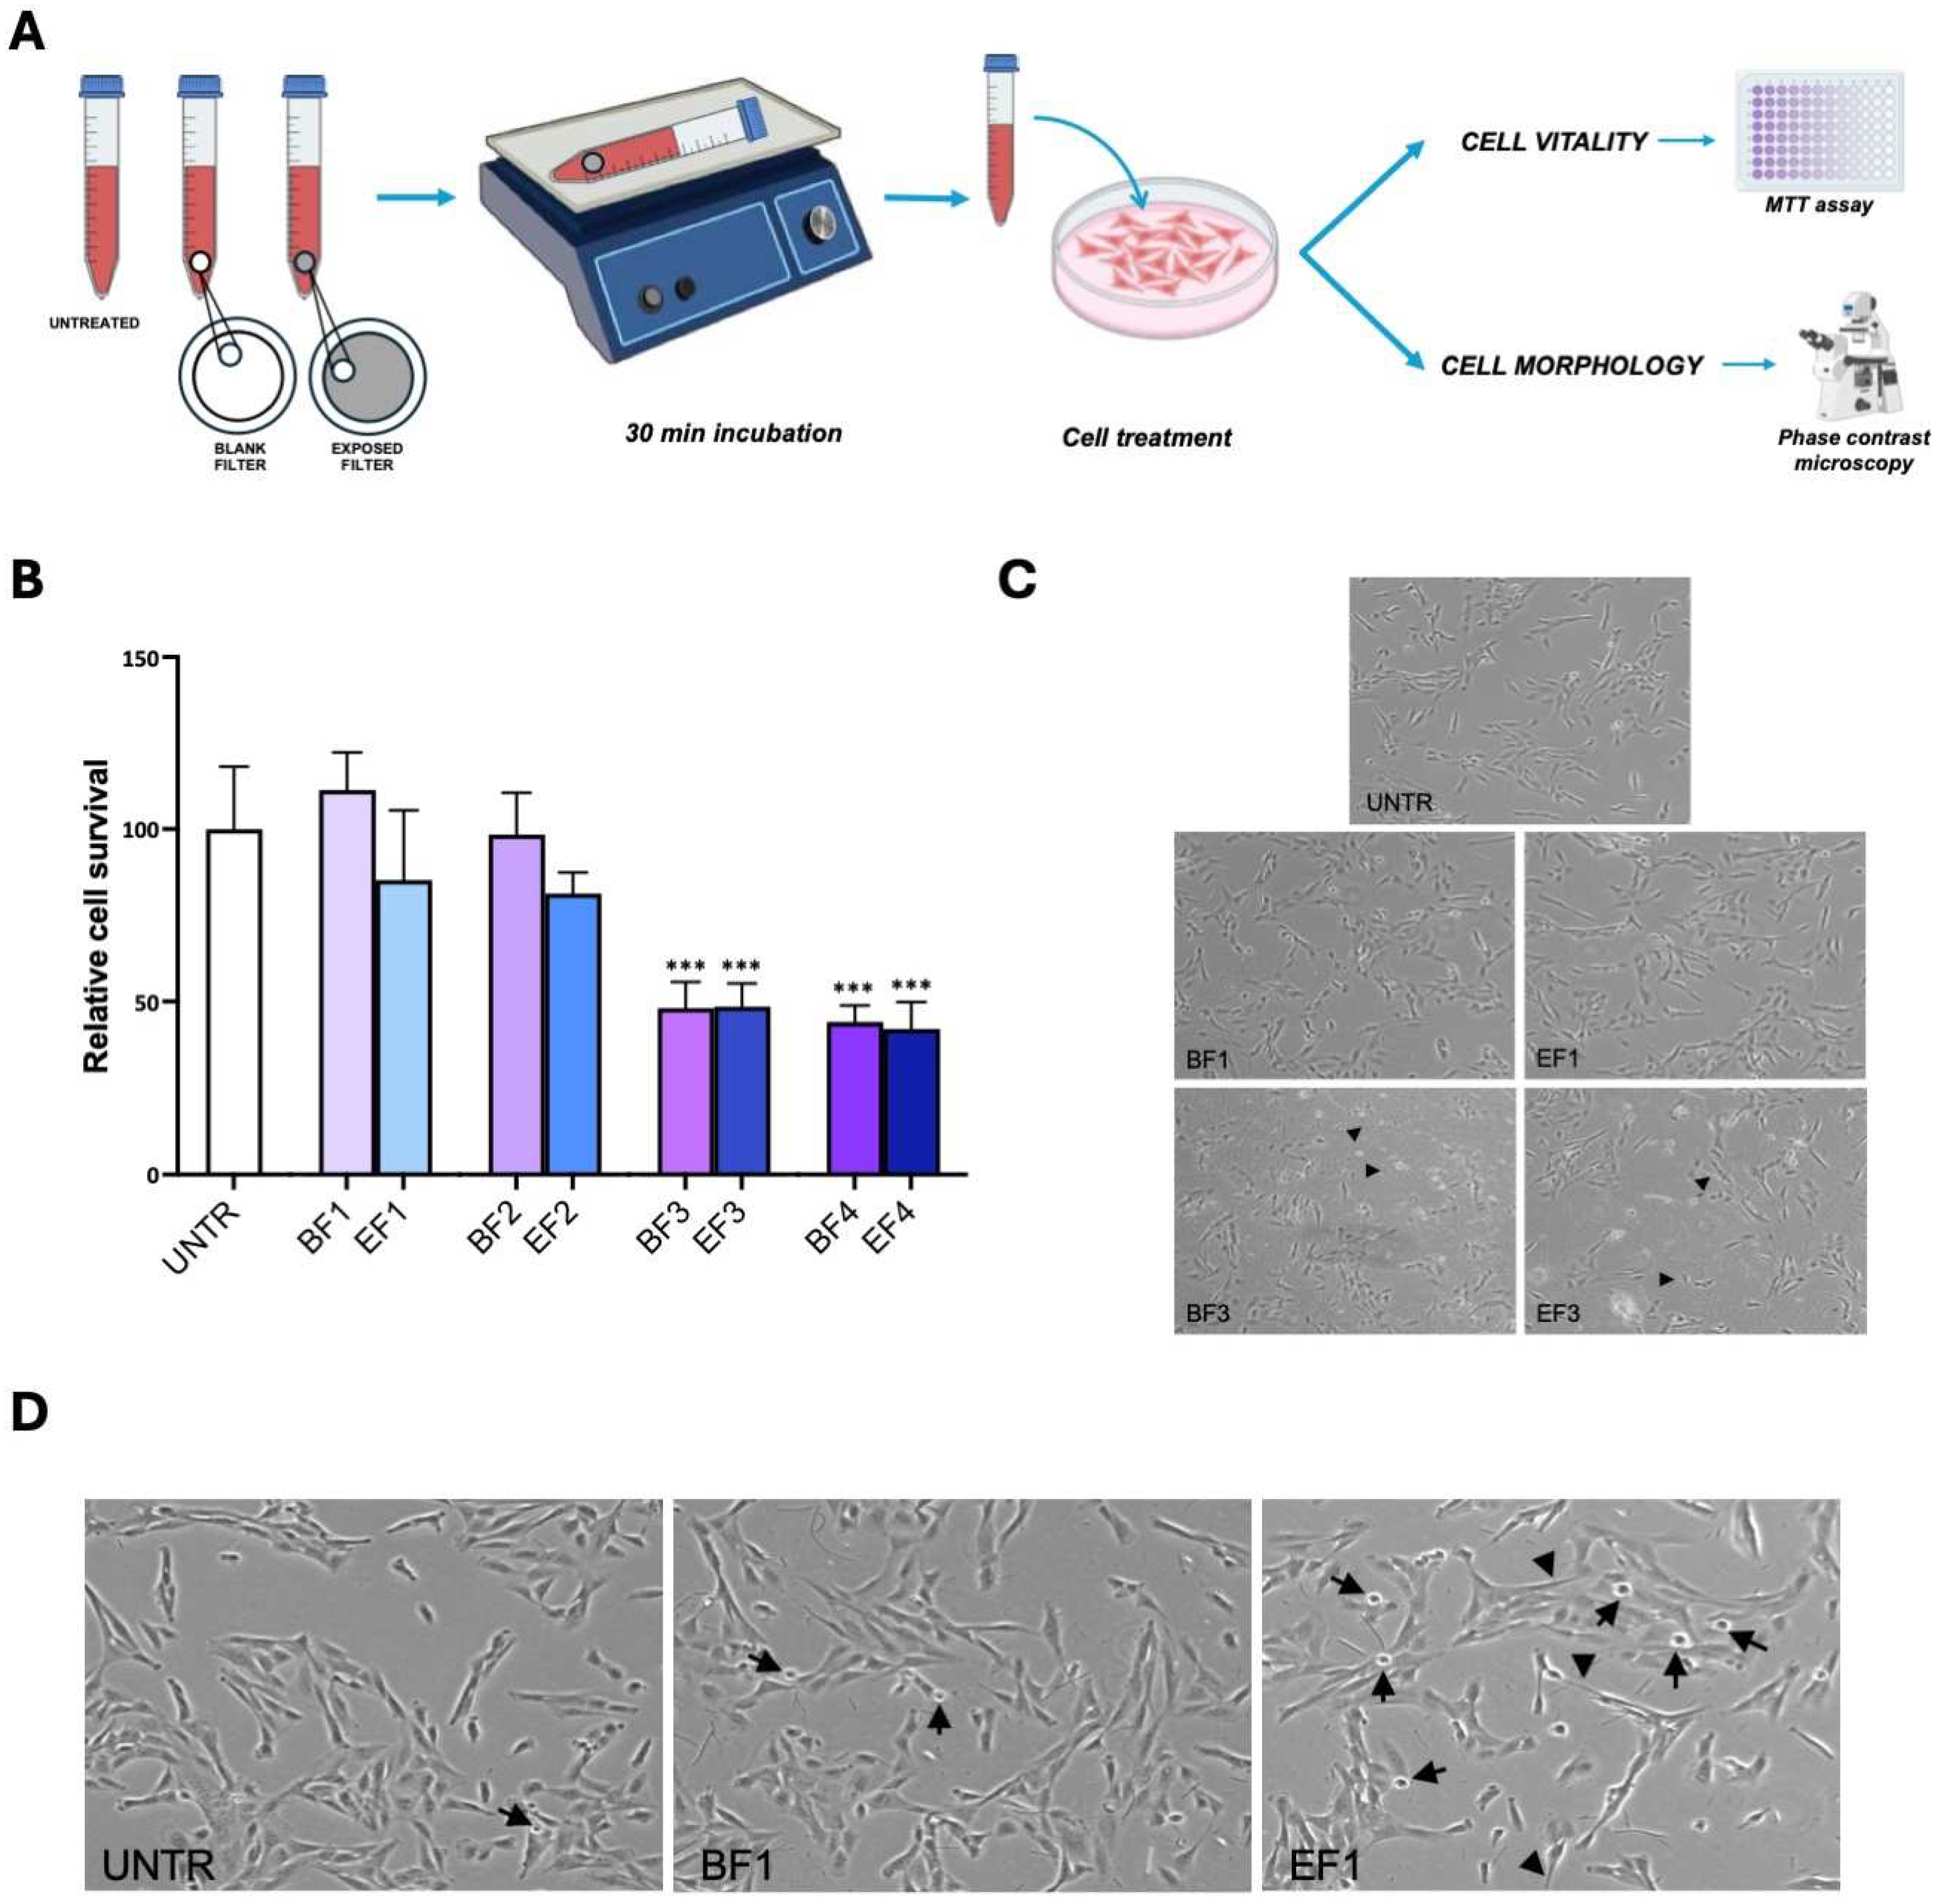
For the in vitro experiments, quartz fiber filters exposed to urban air pollution, which are referred to as exposed filters (EFs), were incubated in RPMI medium without FBS for 30 min with gentle shaking to allow soluble particles to reach the medium. Blank (unexposed) filters (BFs) were used as controls. Media with variable amounts of released traffic-related air pollutants (TRAPs) were obtained by incubating an increasing number of 6 mm diameter BF/EF filter portions (1–4) in the same volume of RPMI (1 mL). The filter portions were removed from the extraction media after the extraction procedure. The samples obtained from 1, 2, 3, or 4 BF/EF filter portions were indicated as BF/EF1, BF/EF2, BF/EF3, and BF/EF4, respectively, and added to the cells for different time points.
Preliminary investigations on exposed cells included the execution of cytotoxicity assay (MTT) and morphological observation.
To assess the viability and uncover possible cytotoxic effects of TRAPs, BEAS-2B cells were seeded in 96-well plates at a density of 4 × 10³ cells/well in 150 μL of medium and incubated for 24 h at 37 °C. Cells were then treated with the BF/EF extraction media obtained as described above, for 4 h.
After treatment, 3-(4,5-dimethylthiazol-2-yl)-2,5-Diphenyltetrazolium bromide (MTT) (Sigma-Aldrich, Merck KGaA, Darmstadt, Germany) was added to each well at a final concentration of 0.5 mg/mL, and the plates were then incubated for 3 h at 37 °C. The medium was then removed, and 100 μL of dimethyl sulfoxide (DMSO) (SERVA Electrophoresis GmbH, Heidelberg, Germany) was added to each well and incubated for 5 min at 37 °C. The absorbance was then measured at OD = 550 nm using a microplate reader (Bio-Rad, Hercules, CA, USA). The absorbance values obtained from six determinations per assay for each experimental condition in three independent experiments were used to determine the relative survival of cells treated with each BF/EF extraction medium with respect to untreated cells.
To evaluate cell morphology, BEAS-2B cells were seeded in 6-well plates (2 × 10⁵ cells/well) and incubated for 24 h. The cells were then treated with BF1 and EF1 samples for 12 h. Images were captured using an EVOS xl transmitted light microscope (AMG, Thermo Fisher Scientific, Waltham, MA, USA).

2.5.2. Gene Expression and miRNA

Gene expression patterns and miRNA expression were assessed in cell lines (single controlled exposure) and human saliva samples through pathways linked to (acute or systemic) inflammation and oxidative stress (subdaily period, 6–12 h).
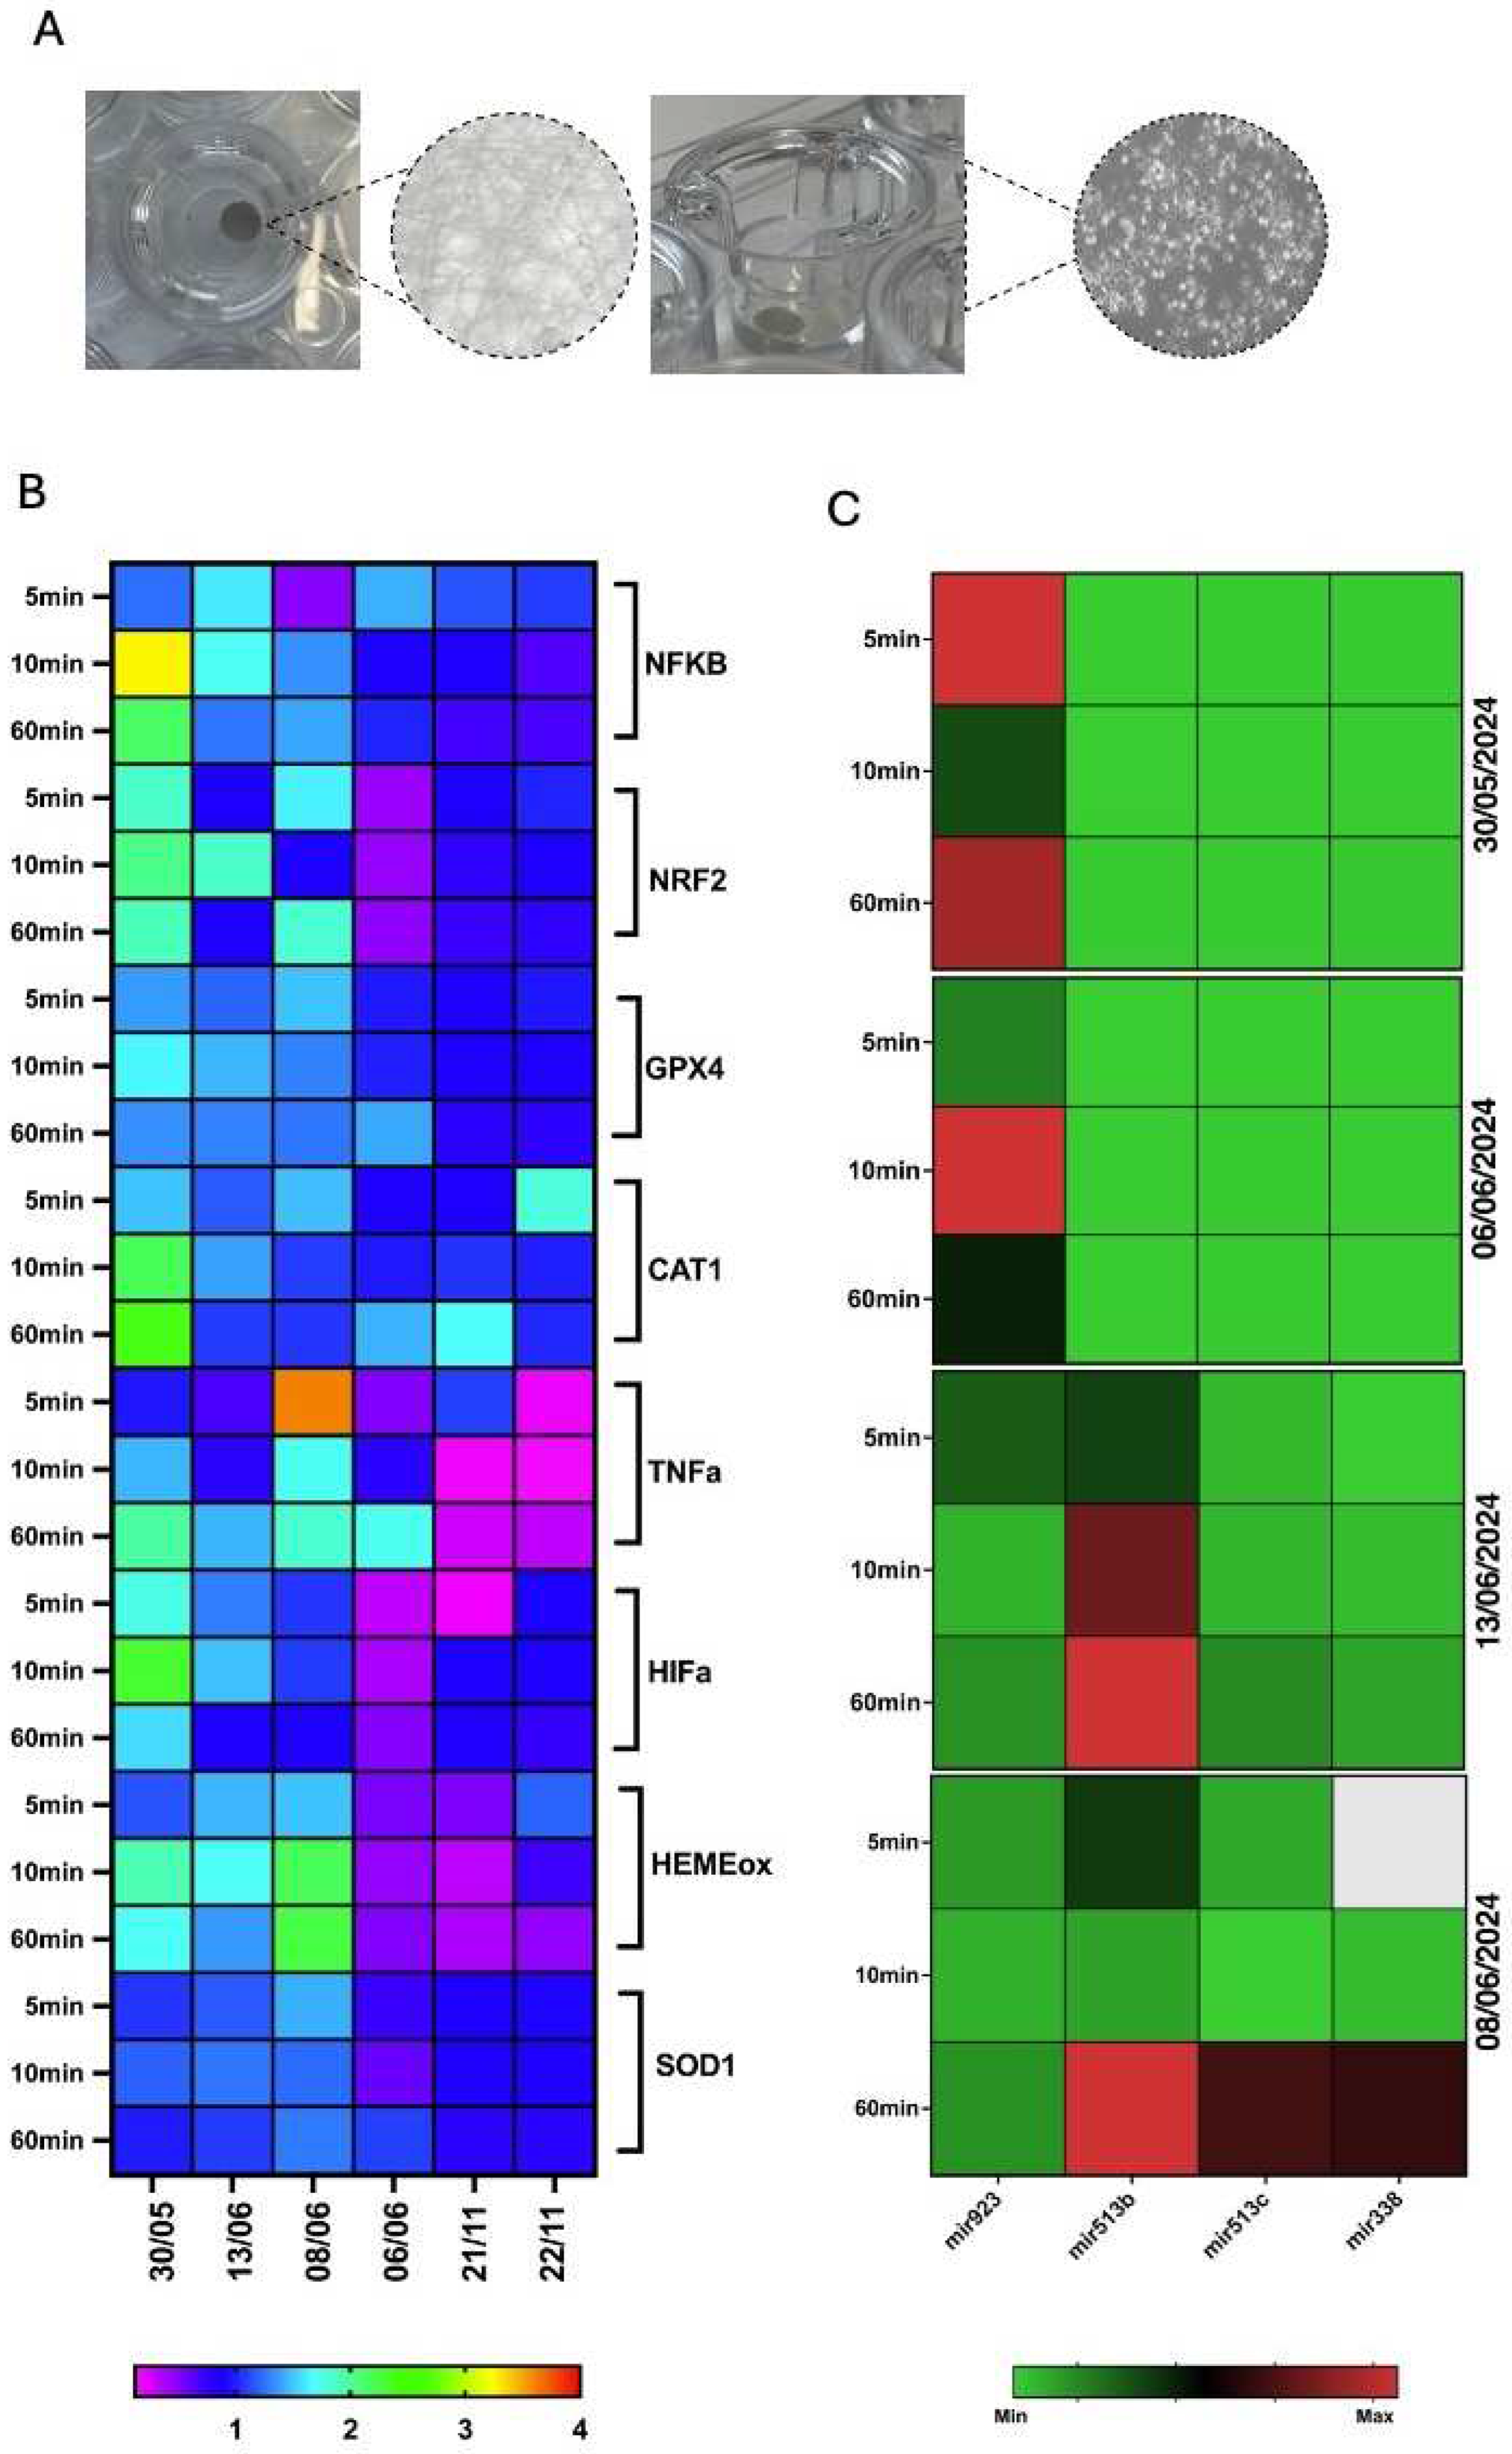
Normal human bronchial epithelial cells (BEAS-2B; ATCC® CRL-3588™) were obtained from the American Type Culture Collection (ATCC) and were cultured according to the manufacturer’s instructions. The cells were maintained in BEBM complete medium (GIBCO, PCS-300-030) supplemented with a Bronchial Epithelial Cell Growth Kit (GIBCO, PCS-300-040) and antibiotics (10 U/mL penicillin and 10 μg/mL streptomycin; Euroclone). The cultures were grown in collagen-coated flasks at 37 °C in a humidified incubator with 5% CO2, and the medium was replaced every 2–3 days. For the exposure experiments, a 6 mm diameter section of an air filter was placed in the upper chamber of the Transwell™ inserts. BEAS-2B cells (100,000 cells per well) were seeded into collagen-coated lower chambers of a 12-well plate. Each upper chamber received 1 mL of culture medium to facilitate contact with the filter and exposure to its contents. The cells were exposed to the filters for five durations: 5, 10, 20, and 60 min, and 24 h. Following exposure, the cell number and viability were assessed using the trypan blue exclusion assay and quantified using both manual and automated cell counting (Diatech Lab Line, Jesi, Italy). Control samples were exposed to blank filters.
Total RNA was isolated using the TriPure isolation reagent (Roche, Basel, Switzerland) and subjected to DNase I treatment (Roche Diagnostics, Indianapolis, IN, USA). miRNAs were extracted using the TriPure isolation reagent and then reverse-transcribed and amplified starting from 10 ng of RNA using TaqMan small RNA assays (Applied Biosystems, Thermo Fisher Scientific, Waltham, MA, USA). For gene expression analysis, reverse transcription was conducted using the PrimeScript reverse transcription master mix (Takara Bio Inc., Shiga, Japan) with 500 ng of RNA. qPCR amplification was performed at 60 °C using 2× SYBR Green Fast qPCR Mix (No ROX) (Fisher Molecular Biology) on a CFX Connect real-time system (Bio-Rad, Santa Clara, CA, USA), starting from 5 ng of cDNA. Changes in the target mRNA content of the S14 housekeeping gene were determined using the Delta-Delta Ct method. They are represented as fold induction (FOI) compared to the control levels (vehicle). For miRNA expression analysis, TaqMan PCR amplification was performed at 60 °C using the CFX Connect real-time system. Changes in target miRNA content were measured using miR-16 as the housekeeping gene and applying the ∆∆Ct method. The overall gene expression related to days of pollution was represented using clustergram heatmaps, comparing FOI to the control levels (untreated cells). All analyses were performed using GraphPad Prism version 10.0.

2.6. Cohorts Studies

2.6.1. The IBD/IBS Cohort for Assessing the Biodiversity of the Gut Microbiota

The IBD/IBS cohort included 140 participants, including healthy subjects and subjects affected by chronic gastrointestinal disorders (inflammatory bowel disorders—IBD—or irritable bowel syndrome—IBS). Figure 2a shows an example of the distribution of heavily urban traffic-exposed participants (black human icons) and a few classified as living in rural areas (white human icons). In this paper, we present the first results from a subset of these, including 33 individuals invited to participate in the preliminary study, 5 living in rural areas, 11 in suburban areas, and 17 in urban areas. Fecal samples were collected for microbiota analysis.
Metagenomic analysis (DNA isolation and quantification; 16s rDNA amplification; illumina MiSeq sequencing and bioinformatic analysis) was performed according to the following procedures.
After thawing, fecal samples (≤150 mg) were aliquoted and transferred into 2 mL screw cap tubes containing glass beads and BashingBead™ lysis buffer (Zymo Research, Tustin, CA, USA). The tubes were then vortexed for 30 min on an iSWIX System (Neuation Technologies, Gujarat, India), and up to 400 μL of the supernatant was used for DNA extraction using the Quick-DNA™ Fecal/Soil Microbe Miniprep Kit (Zymo Research, USA), according to the manufacturer’s instructions. DNA was quantified using fluorescence spectroscopy (Quant-iT™ PicoGreen® dsDNA Assay Kit, Thermo Fisher, Waltham, MA, USA), and its integrity was checked using agarose gel electrophoresis.
Dual-indexed universal primers (341F, CCTACGGGNGGCWGCAG, and 802R, GACTACHVGGGTATCTAATCC; Illumina, San Diego, CA, USA) were used for two-step PCR amplification of the V3–V4 hypervariable regions of the 16s rRNA gene (16S/ITS Nextera two-step PCR kit, Illumina Inc., USA), as previously described [52].
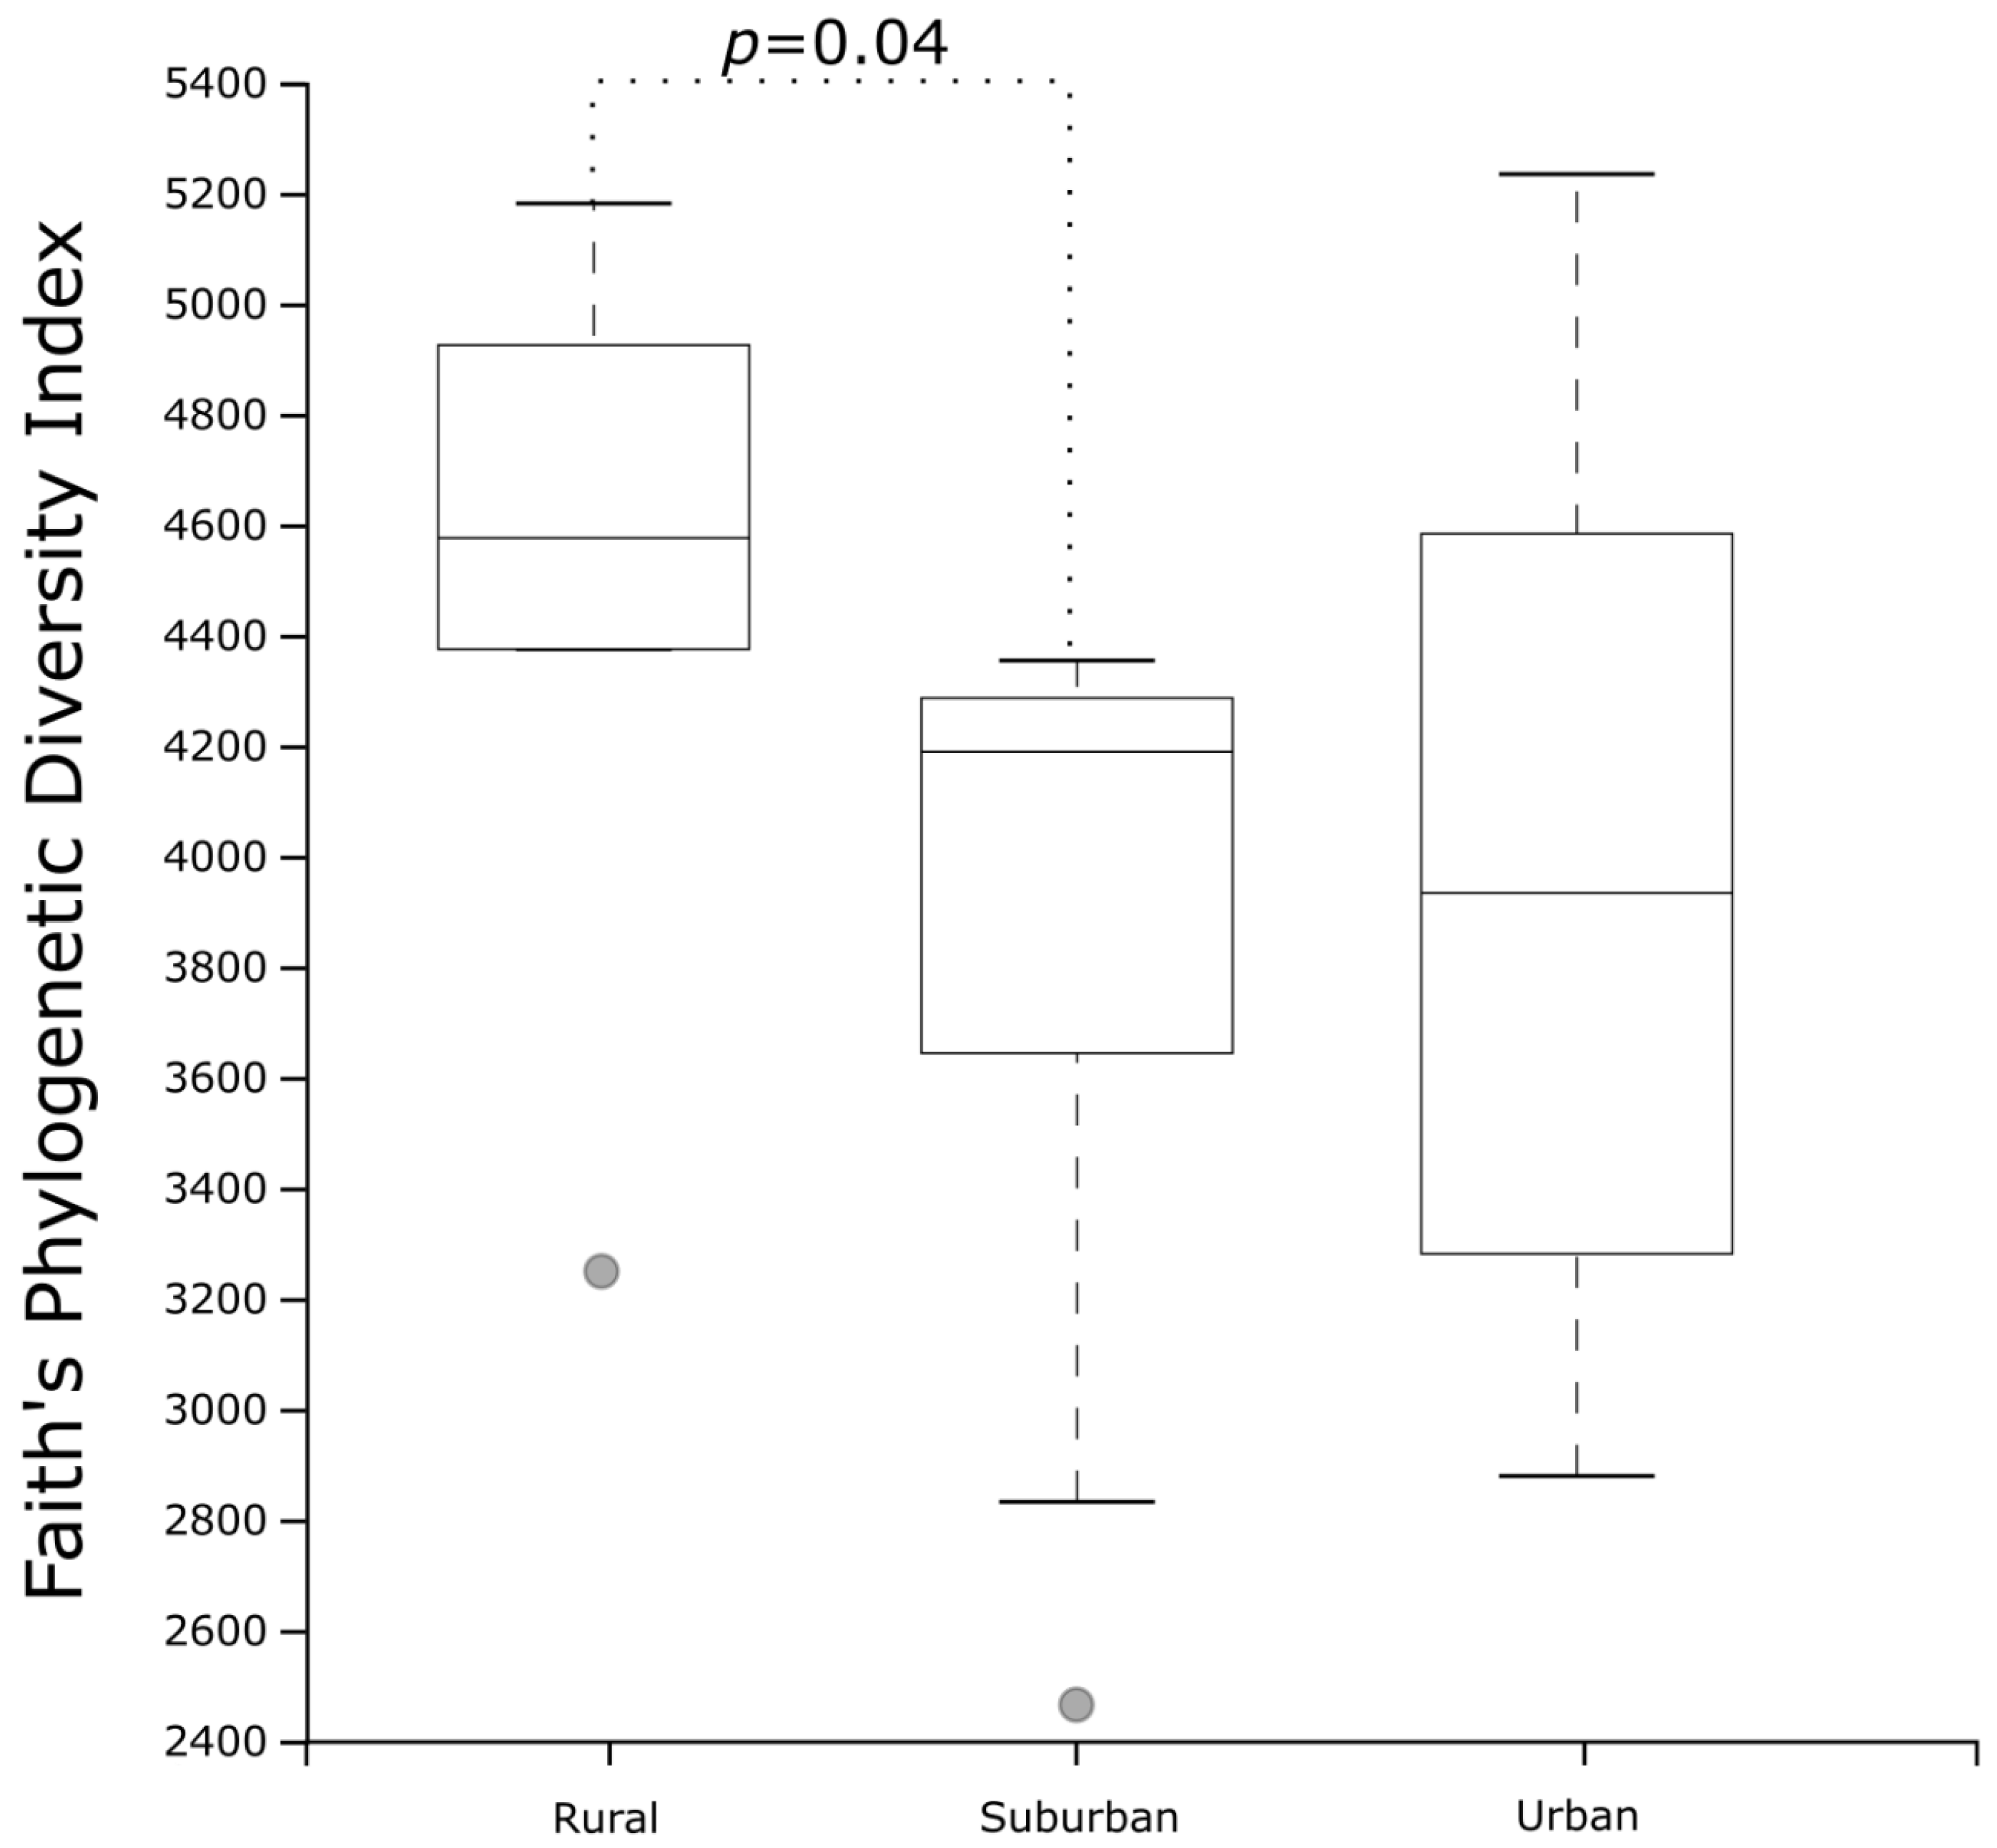
The sequencing data were classified into operational taxonomic units (OTUs) using the software framework QIIME2 (version 2023.9-amplicon), as previously described [52]. Bioinformatic analysis of the OTUs was performed by normalizing all samples to the sample with the lowest read count for alpha diversity comparisons. Faith’s phylogenetic diversity (PD) index, defined as the sum of the branch lengths of a phylogenetic tree connecting all species in the community, was used as a metric for alpha rarefaction analysis. Alpha diversity indices were expressed as medians and interquartile ranges (IQRs) and nonparametric t-test based on Monte Carlo permutations was used for alpha diversity comparisons.

2.6.2. The EMERGE Cohort

A total of 24 voluntary healthy subjects, living in urban or peri-urban areas, were enrolled for miRNA assessment. They conducted a diagnostic assessment visit. Saliva samples from these healthy volunteers were collected every 4 h for 15 days during the 3-months-intensive field campaign. Saliva samples were analyzed for miRNAs to verify that exposure to urban particulate matter could induce the modulation of 12 selected miRNAs in the comparison between the different groups. Oral swab samples were collected along with saliva samples from these healthy volunteers.
One salivary sample a day from each volunteer was collected in the same period for microbiota analysis.

2.7. Vegetation

The measures carried out on vegetation in Villa Ada urban forest were focused on two evergreen species, Quercus ilex L. and Laurus nobilis L., sampled at two different spots: the inner part of the urban park, considered as control, and in the vicinity of the road Via Salaria, source of vehicular traffic emissions [53].
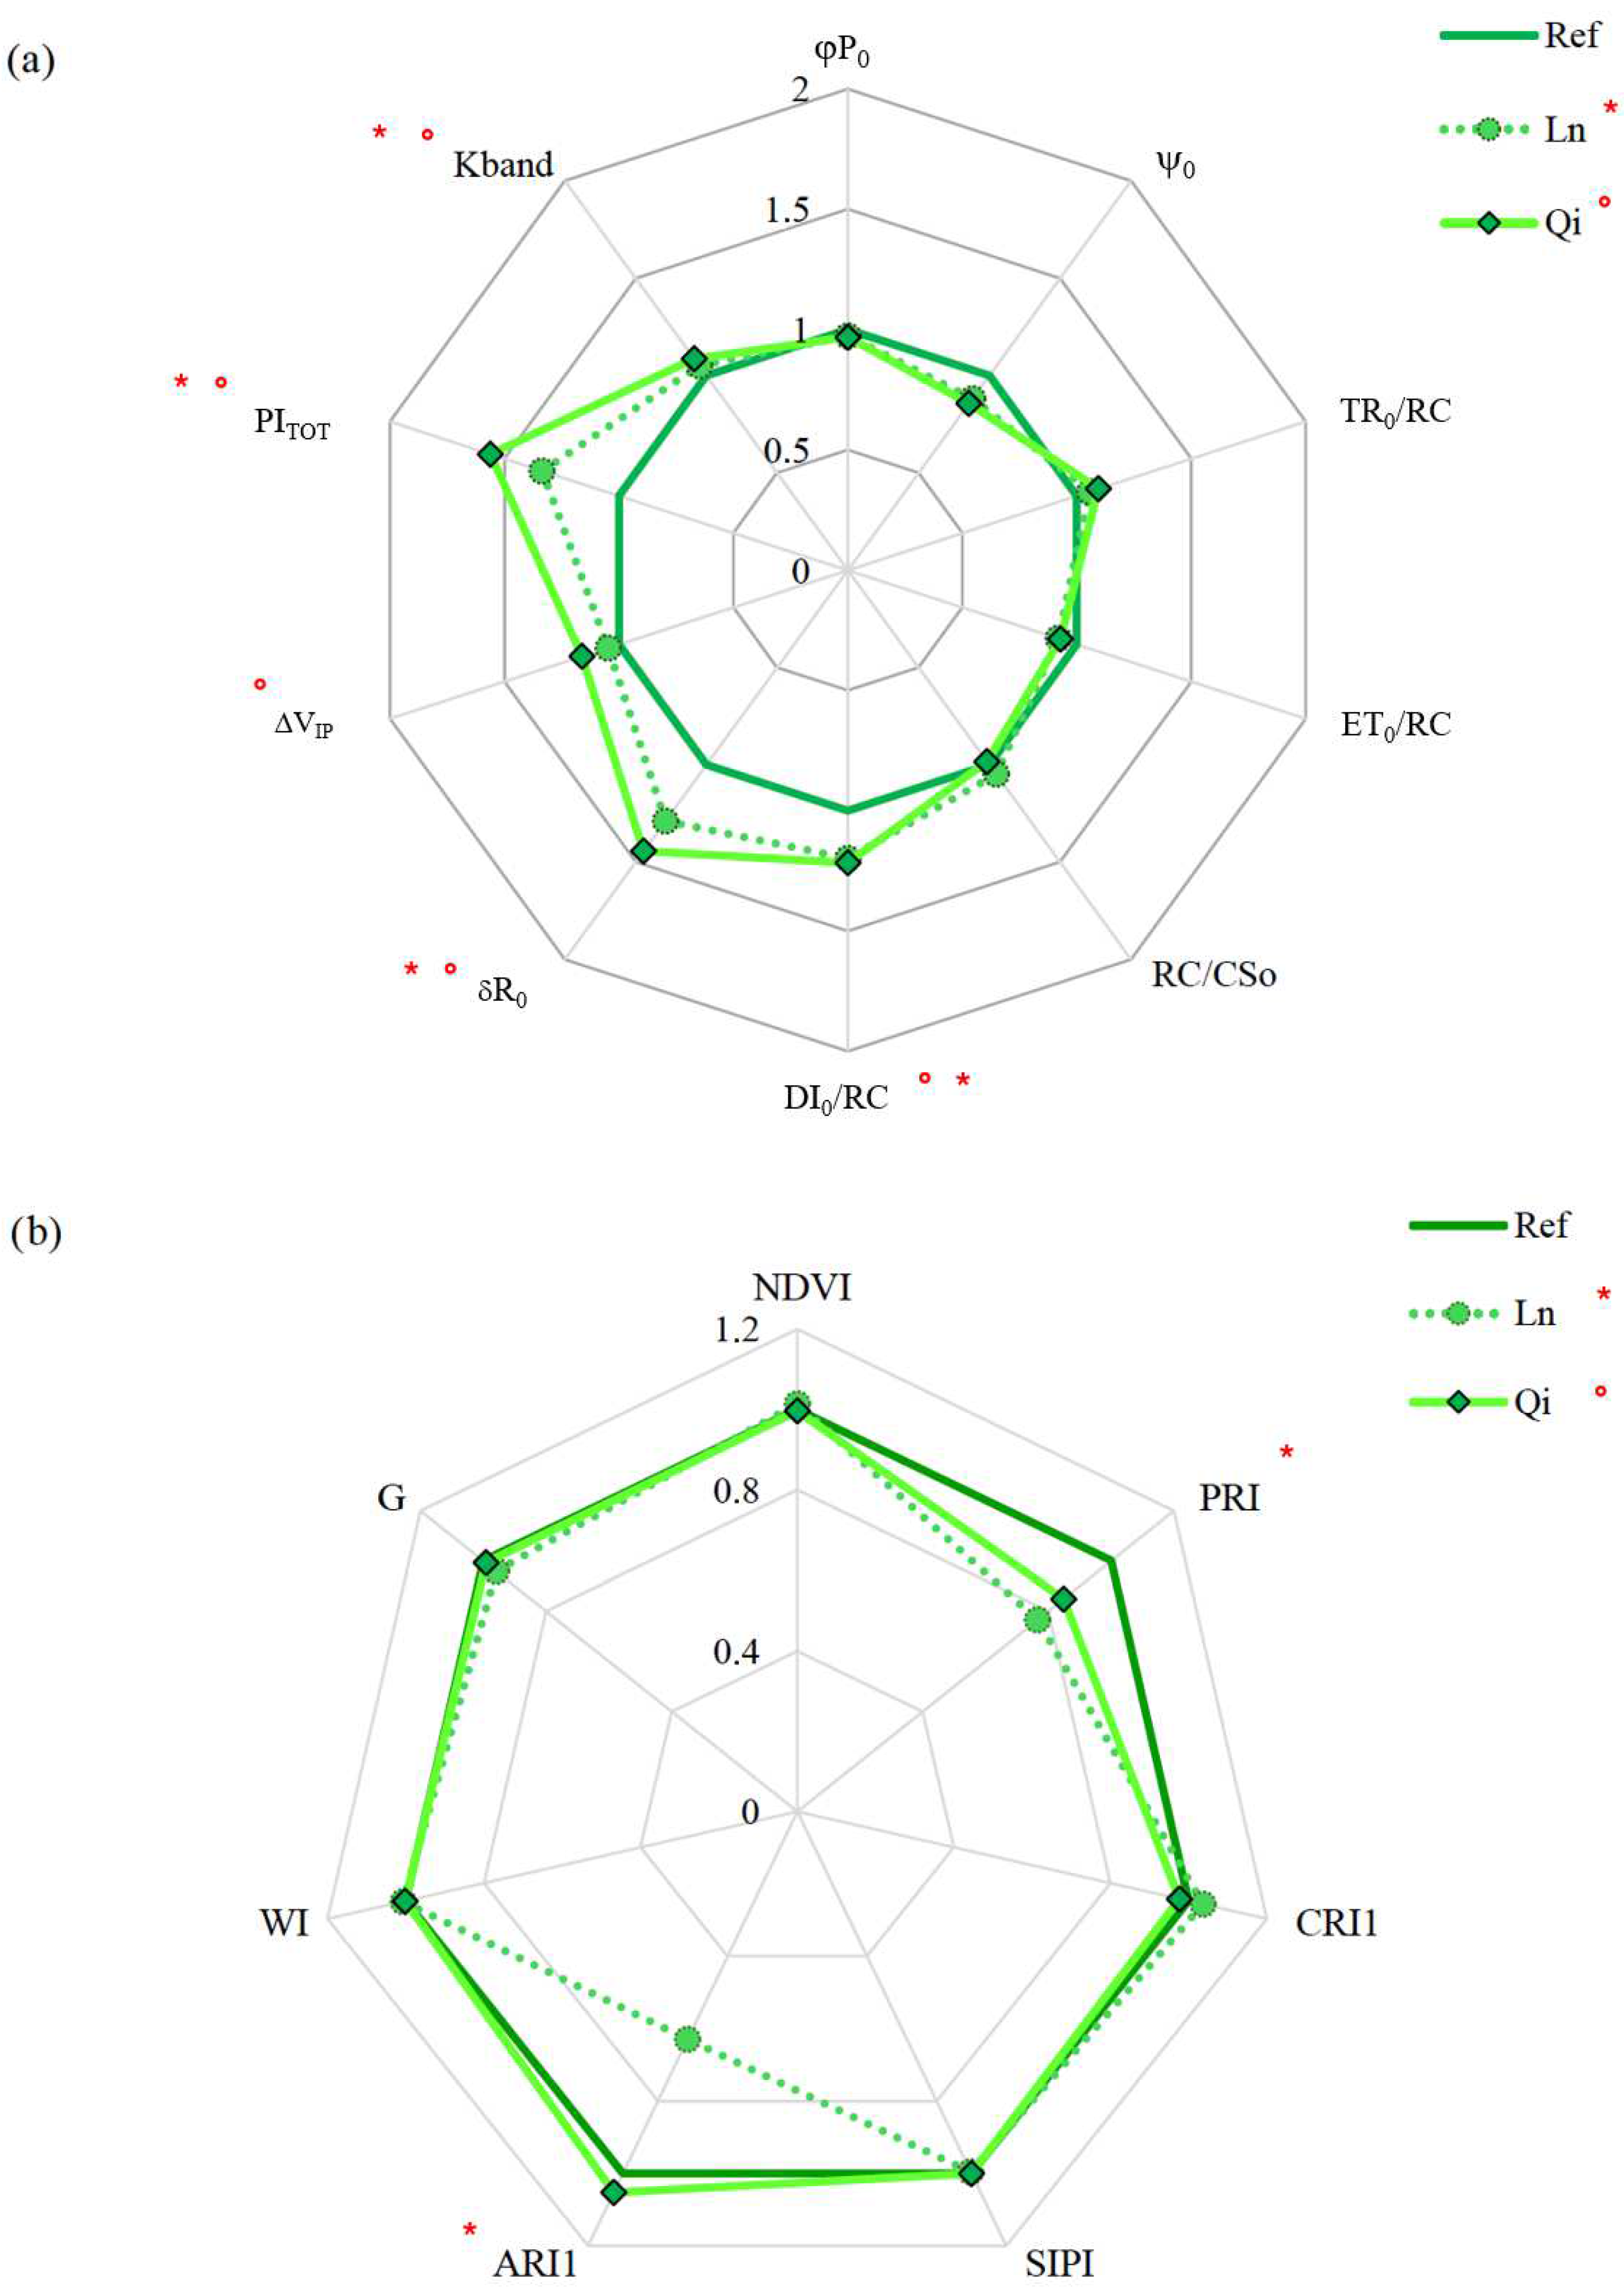
Samples were collected in January 2025, under stable meteorological conditions, more than 15 days after the last rain event, to avoid the influence of rainfall on PM leaf deposition [54]. For each spot (inner park and Via Salaria), three representative adult trees were sampled, and sun-exposed, fully developed leaves, were collected at 1.50 m height from the outer part of the crown. For each tree, twigs were detached, stored in sealed plastic bags to avoid dehydration, and brought to the laboratories where functional traits were measured on three leaves for each twig and data were aggregated for each sampled tree (n = 3). Measures of chlorophyll fluorescence (ChlF) and reflectance in visible region were assessed. For ChlF, after dark adaptation, the primary acceptors reach a complete oxidation state and then are exposed to a saturating red actinic light pulse of 3000 μmol photons m−2 s−1 of 1 s duration and the kinetics of the polyphasic prompt fluorescence transient (FT) rise is recorded by a direct fluorometer, Handy PEA (Hansatech Instruments, Norfolk, UK). The FT was elaborated using the JIP-test, a tool that translates this polyphasic fluorescence transient into a constellation of biophysical parameters, which quantify the single steps of the photochemical pathway through both photosystem II (PSII) and photosystem I (PSI) [55]. In this study, the following JIP-test parameters were considered: φP0, maximum quantum yield of primary photochemistry expresses the probability that an absorbed photon will be trapped by the PSII reaction center (RC) and will reduce one QA; Ψ0, expresses the probability that a photon trapped by the PSII RC enters the electron transport chain; TR0/RC, reducing QA energy flow for each RC; ET0/RC, the electron transport beyond QA per RC; RC/CS0, a pool of active RC per PSII antenna complex; DI0/RC, effective dissipation in an active RC; δR0, probability that an electron is transported from reduced PQ to the electron acceptor side of PSI; ΔVIP, the efficiency of electron transport to reduce the end acceptors beyond the PSI; PITOT, Total Performance Index (potential) for energy conservation from photons absorbed by PSII to the reduction of PSI end acceptors; K band, reflects the photochemical reduction of QA providing information about the state of the donor side of PSII, and is related to the inactivation of oxygen evolving complex. Reflectance indices were measured on the same leaves sampled for ChlF using a PolyPen RP 410 UVIS (Photon Systems Instruments, Drásov, Czech Republic) within the range of 380–790 nm. Using Spectrapen software, the following spectral reflectance indices were calculated: normalized difference vegetation index: NDVI has been used as a proxy of green biomass and used to estimate the photosynthetic carbon assimilation; photochemical reflectance index: PRI calculated using reflectance at 531 nm and 570 nm, reflects the de-epoxidation state of xanthophyll cycle pigments, which are associated with photosystem II (PSII); anthocyanin reflectance index: ARI is the inverse reflectance at 550 and 700 nm, allowing an estimation of anthocyanin accumulation; carotenoid reflectance index: CRI550 estimates the total carotenoid content in plants, since it combines the range in which the reflectance to carotenoid is maximal and the reflectance at 550 nm to remove the Chl effect; Structure-Insensitive Pigment Index: SIPI is associated with the ratio of total carotenoids to Chl a, and since it considers the near-infrared band (800 nm), it allows mitigating the effects of within-leaf structural properties on reflectance; Water Index: WI has been found as a good indicator of water content at leaf level.

3. Results

3.1. Four-Year Wind Patterns

The statistical analysis of data collected over the past four years has uncovered a distinct seasonality in local wind patterns (Figure 4). Each polar plot represents a different season—spring, summer, autumn, and winter—and illustrates the percentage of wind occurrences by direction. Wind speeds are color-coded: blue (0–2 m/s), green (2–4 m/s), yellow (4–6 m/s), and red (≥6 m/s). The maximum observed wind speed during the study period was 6.68 m/s, which falls within the highest category of the color scale. Throughout all seasons, the most frequent wind directions vary, though certain seasons exhibit notable directional consistency. The seasonal wind roses consistently show a predominance of winds from the north across all seasons, with secondary contributions from the south and east during spring (MAM) and summer (JJA), attributable to the mesoscale circulation (sea breeze). In these two seasons, northern winds reach frequencies of about 20%, with mean wind speeds of 1.68 m/s in spring and 1.65 m/s in summer. During autumn (SON), the wind direction distribution becomes more varied, with significant contributions from the north (~25%) and southeast, and a slight decrease in mean wind speed to 1.54 m/s. Winter (DJF) maintains a dominant northern flow (~25%) with additional input from the west-southwest, while the mean wind speed remains similar at 1.55 m/s. Across all seasons, calm conditions were negligible (0%), indicating persistent atmospheric ventilation. While spring and summer exhibit more directional wind patterns—primarily from the north and south—with relatively higher frequencies and wind speeds, autumn and winter display more uniform distributions and slightly reduced wind intensities. This seasonal contrast in wind regimes influence urban microclimate dynamics, including ventilation, pollutant dispersion, heat exchange, and moisture transport.
Pollution sources affecting the Villa Ada Park area include a combination of urban, industrial, and transportation-related emissions. The city of Rome itself contributes significantly through vehicular traffic, residential heating, and commercial activities. Major roadways such as Via Salaria, which encircle the park, are key local sources of traffic-related pollutants. Regionally, emissions from the broader metropolitan area include industrial zones to the east and south. During spring and summer, mesoscale circulations such as sea breezes may carry pollutants inland from coastal areas, while northerly and southwesterly winds can channel urban and peri-urban emissions directly into the park [56].
In particular, the prevalence of northerly and southwesterly winds during spring and summer may enhance differences in the dispersion of pollutants originating from Via Salaria. Given that Via Salaria encircles the park and due to the wind regime, emissions in the south and western sectors may pass through wooded areas, which could act as a natural filter, while emissions carried from the north may impact the site more directly.

3.2. PM2.5 Dynamics

3.2.1. Four-Year Statistics of PM2.5 and Associated Pollutants

Table 1 shows descriptive statistics by season of the mass concentration of the air pollutants in particles (PM2.5, PM1) measured daily during the last 4 years, in the urban forest. For comparison we also show gaseous phase pollutants: nitrous oxide (NO2), carbon monoxide (CO), and ozone (O3), starting from hourly aggregated data [57]. Besides mean levels and standard deviation (SD), IQR is given by reporting the 75th percentile (p75) and the 25th percentile (p25) of each dataset.
Seasonal variations in pollutant concentrations were observed across all measured species with distinct patterns emerging for each.
PM1 concentrations were lowest in summer (mean = 5 µg/m3) and highest in winter (mean = 8 µg/m3), with spring and fall showing intermediate values (7 µg/m3). IQR was narrowest in summer (4–6 µg/m3) and widest in winter (5–11 µg/m3), indicating greater variability during colder months.
PM2.5 followed a similar seasonal trend, with the highest mean concentration in winter (16 µg/m3) and the lowest in summer (10 µg/m3). The IQR expanded significantly in winter (9–23 µg/m3), suggesting increased particulate matter accumulation during this season.
The NO2 levels peaked in winter (mean = 26 µg/m3) and were lowest in fall (17 µg/m3), with spring and summer showing intermediate values (24 and 19 µg/m3, respectively). This pattern is consistent with increased emissions and reduced atmospheric dispersion during colder months.
CO concentrations remained relatively stable across seasons, ranging from 0.4 to 0.6 mg/m3. The highest values were recorded in winter (mean = 0.6 mg/m3), while fall showed the lowest (0.4 mg/m3), reflecting weak seasonal differences.
O3 exhibited an inverse seasonal pattern compared to the other pollutants, with the highest concentrations in fall (mean = 59 µg/m3) and summer (42 µg/m3), and the lowest in winter (21 µg/m3). This trend aligns with the photochemical nature of ozone formation, which is enhanced by solar radiation and temperature.
Interannual variability assessed using complete annual records from 2021 to 2023 (Section S2) shows that concentrations remained relatively stable.

3.2.2. PM2.5 Modeling

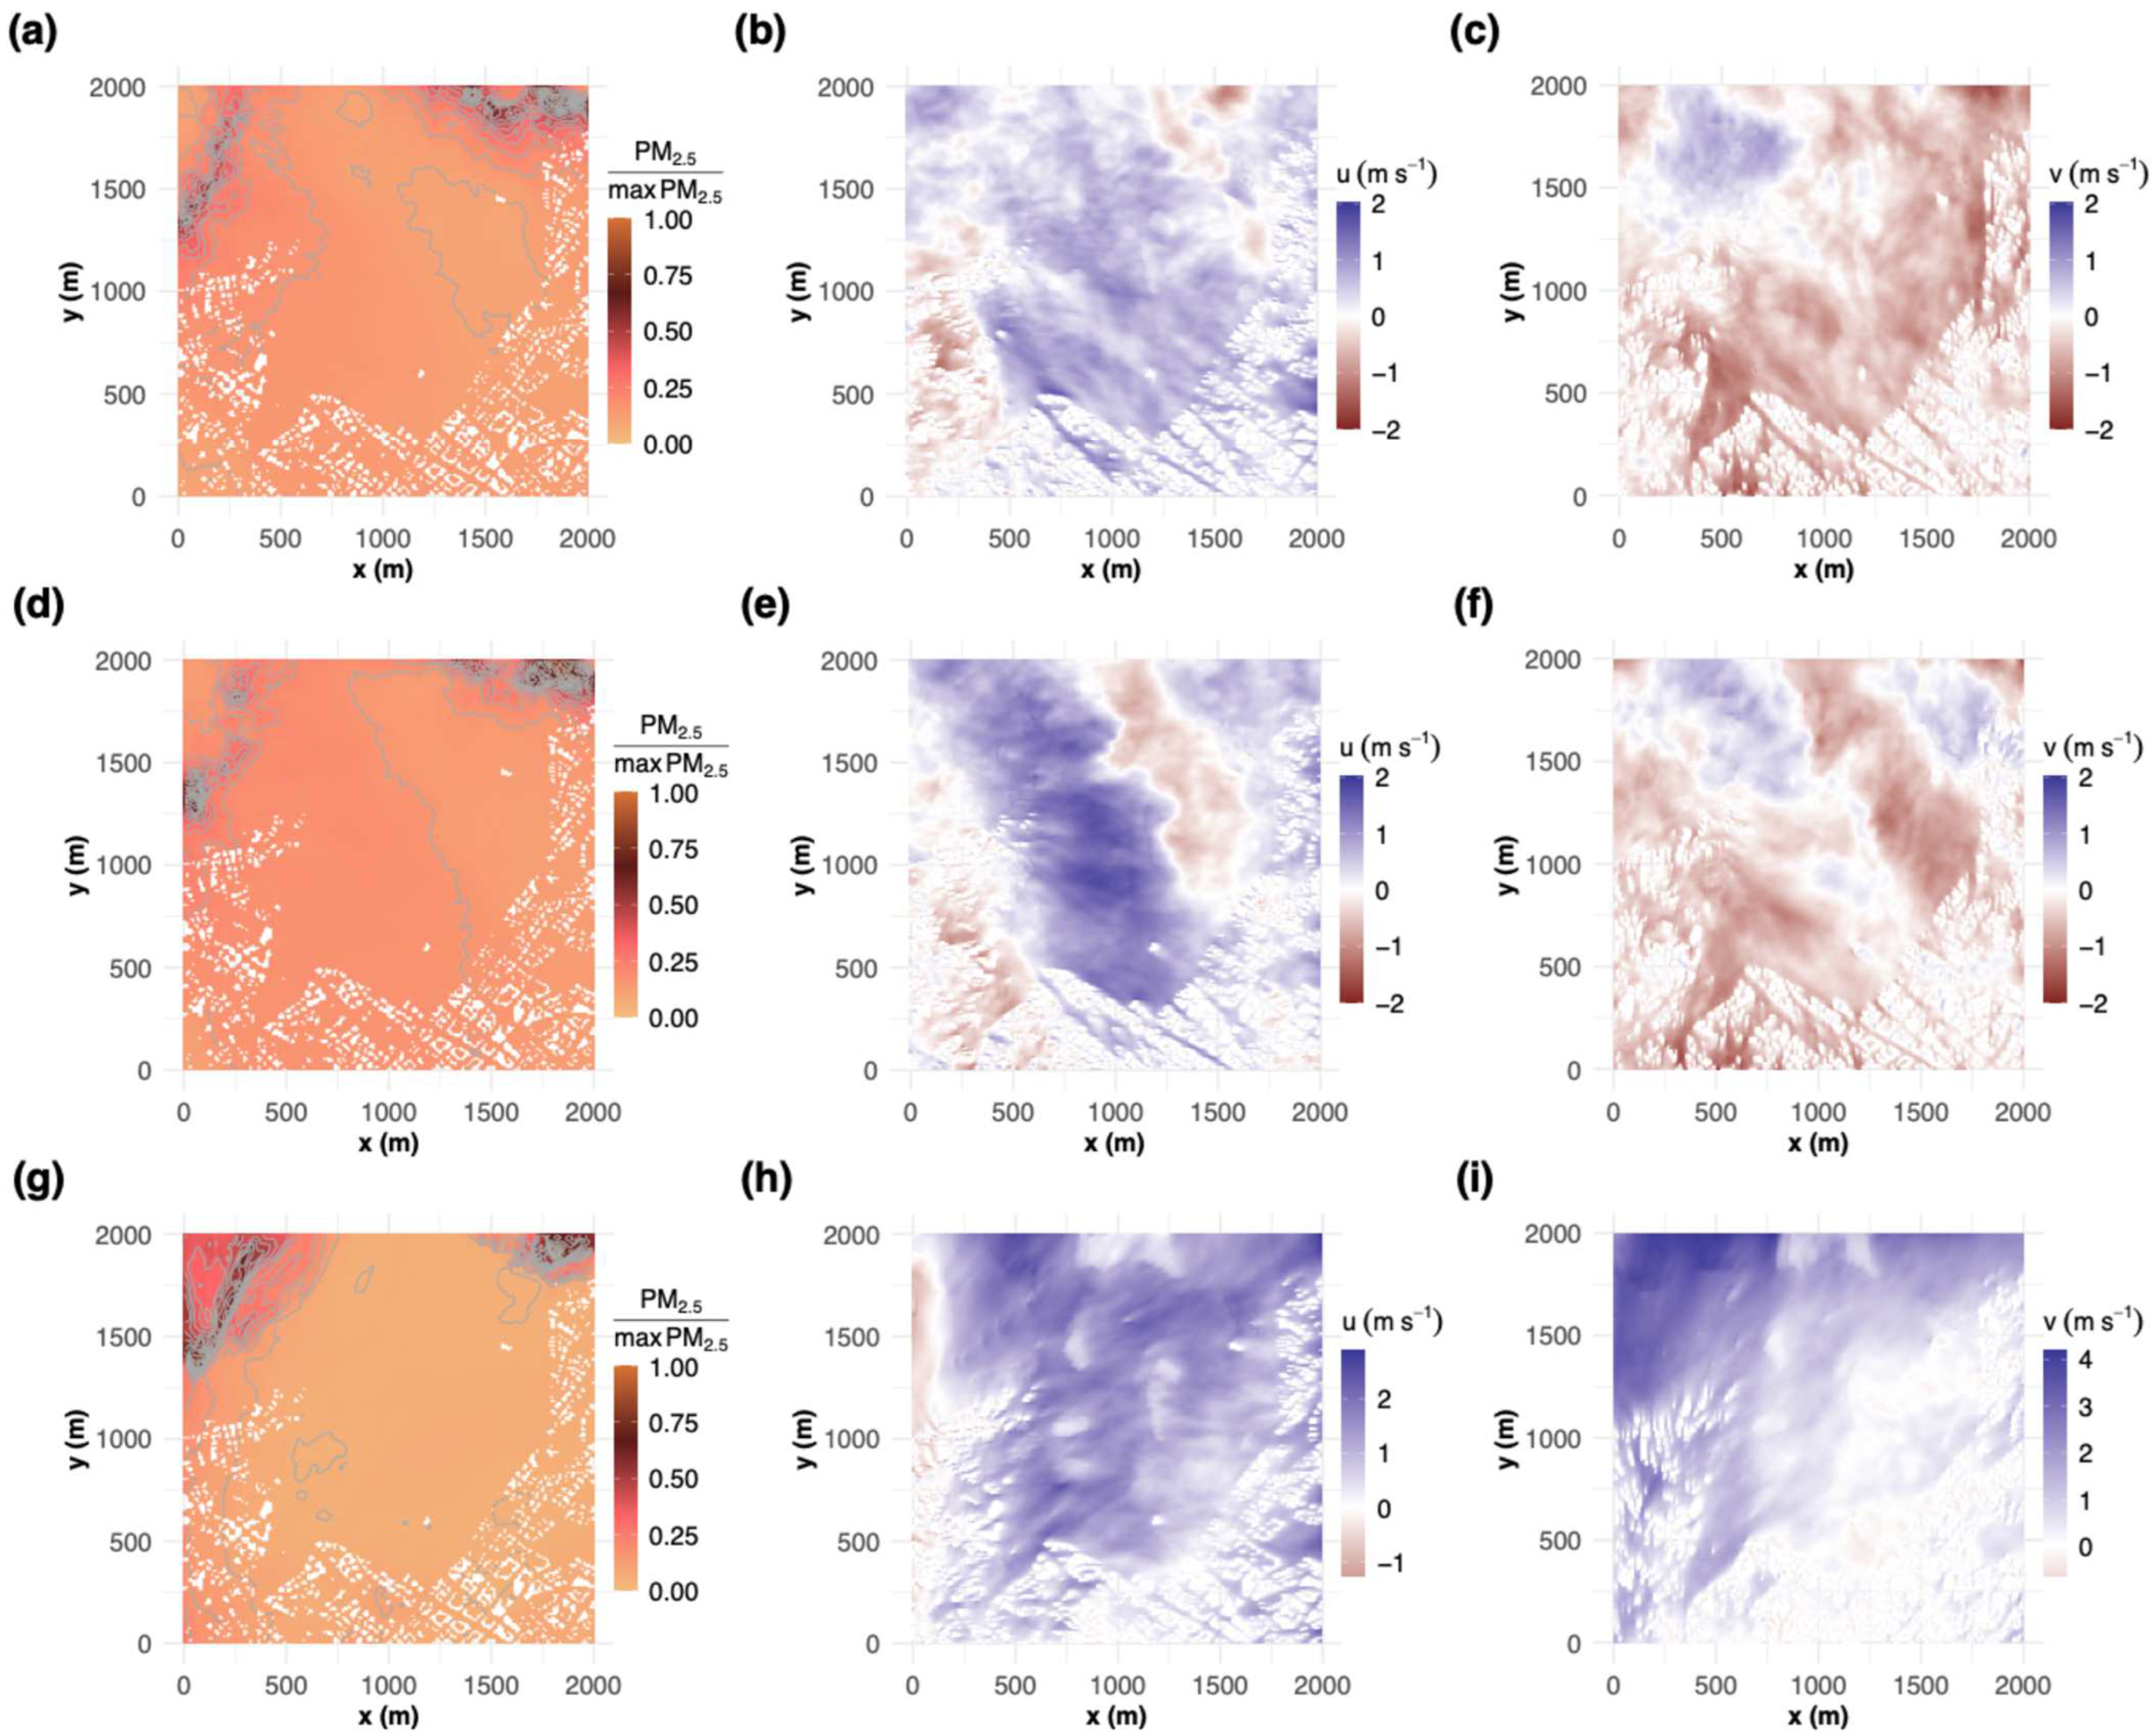
Figure 5 reveals how vegetation structure and atmospheric dynamics can modulate pollutant dispersion across the three simulated scenarios. Scenarios 1–2 began on 8 October 2023 at 03:00 UTC, and Scenario 3 on 23 October 2023 at 03:00 UTC. All panels show the instantaneous fields at 13:00 UTC. See Supplementary Materials, Section S1, for details on the initial and boundary conditions used in PALM simulations. In Scenario 1 (Figure 5a–c), the low-wind conditions associated with the heatwave facilitate particulate accumulation in the northern sector of the domain, where localized peaks of PM2.5 highlight the presence of Via Salaria, a major traffic corridor. The wind fields (u and v components) show weak and disorganized patterns, suggesting limited advective removal and turbulent mixing within the park. In Scenario 2 (Figure 5d–f), the absence of tall vegetation within the park strongly affects wind patterns. The evident converging circulation within the park enhances the concentration of particulate matter. In contrast, Scenario 3, the after-rain episode (Figure 5g–i), shows a substantial increase in both wind components, leading to a notable reduction in pollutant concentration across the domain.
These preliminary results emphasize the complex relationship between vegetation, wind, and PM2.5 dynamics. The tree cover not only influences PM2.5 concentrations through deposition processes but also affects the wind field. The post-rain scenario with enhanced ventilation demonstrated a greater capacity for pollutant removal, particularly within the park. Further simulations will help understand and contribute to assessing the importance of vegetation on the dispersion process in the proximity of the park.

3.3. Aerosol Profiling

In the Rome NBFC experiment campaign, the Doppler Wind Lidar was used to pursue three main objectives: (1) qualitatively assess the aerosol load along the vertical profile, (2) investigate the impact of long- and short-range aerosol transport on aerosols, as for example in Kotthaus et al. (2023) and Shrestha et al. (2022) [58,59], and (3) detect local and mesoscale dynamic structures. The lidar is operated in a repeating 5 min cycle, alternating between the STARE mode, which provides continuous measurements of aerosol backscatter and vertical velocity, and the VAD-6 mode, which reconstructs horizontal wind profiles along the vertical.
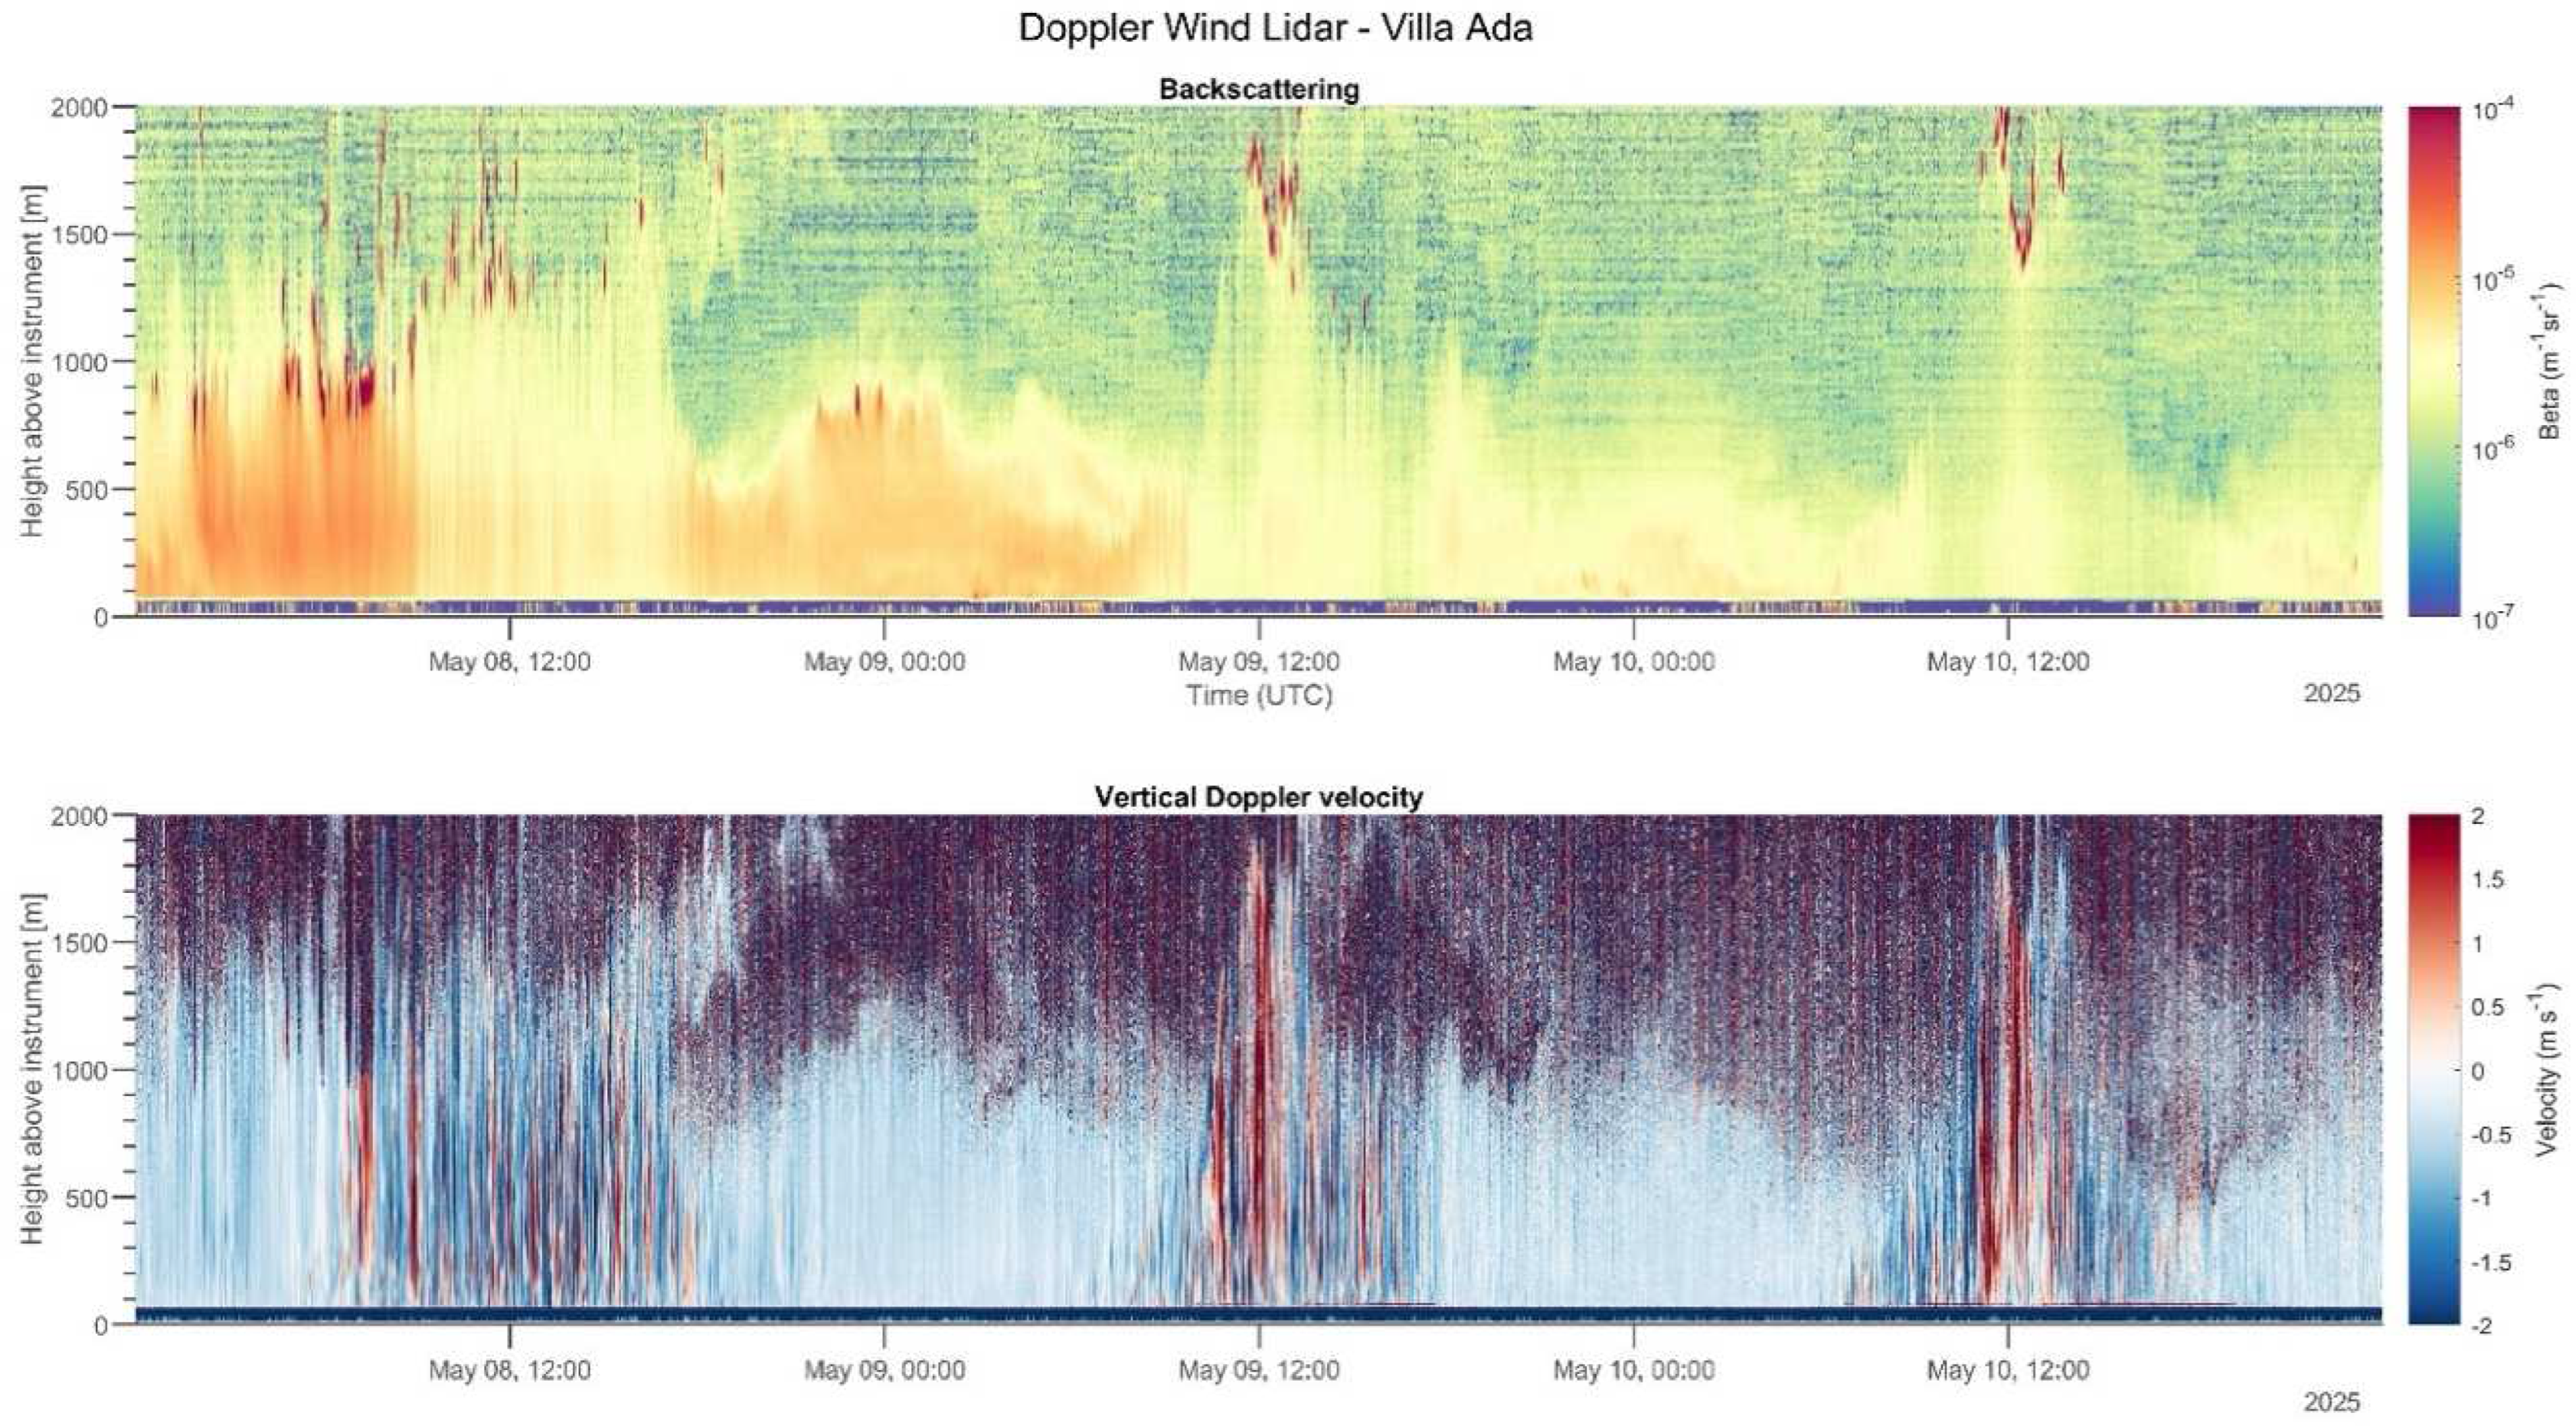
Figure 6 shows Doppler Wind Lidar (DWL) observations collected at Villa Ada Park in 2025 from 8 to 10 May to depict boundary layer dynamics and aerosol variability under different synoptic and local wind conditions.
The backscattering coefficient (Figure 6, upper panel) reveals a deep and well-developed convective boundary layer on 8 May, with aerosol mixing extending up to 1.5 km during the day and sustained high backscatter values, indicating aerosol load and strong vertical distribution. This is further supported by the vertical Doppler velocity (bottom panel), which highlights the updrafts (red) during the daytime convective period, reflecting vigorous vertical mixing. At night, more stable conditions prevailed with weaker and predominantly downward motions (blue), and the aerosol layer became more confined near the surface. Vertically coherent structures, associated with thermals, were also clearly visible during the daytime on all three days under examination, confirming the presence of organized convective processes within the boundary layer.
In Figure 7, the horizontal wind profiles show persistent synoptic westerly winds throughout 8 May, with speeds exceeding 6–8 m/s above 500 m. This synoptic flow likely supports continuous aerosol entrainment and dispersion in the boundary layer. Toward the evening, the wind weakens, allowing the aerosol layer to become more stratified near the surface. On 9 May, the backscatter data show convective growth of the boundary layer during the morning, with well-mixed aerosol reaching ~1.2 km. After 15 UTC, a sharp decrease in backscatter values was observed, especially above 500 m, suggesting a rapid removal or dilution of aerosols due to an air mass change. The wind direction and speed plots indicate a typical sea breeze setting at around 12 UTC, with surface winds rotating from variable/northerly to south-southwesterly (180–240 degrees) and increasing speed. Indeed, in the afternoon, a pronounced northerly flow develops, which is clearly visible in both wind direction and speed, bringing cleaner air that matches the observed drop in boundary layer height in the backscatter plot. On 10 May, the backscatter coefficient remained lower than in the previous days, with aerosols mostly confined below 1 km, suggesting a reduced aerosol load and a weaker convective activity. The wind field shows a weaker sea breeze around midday, with a shift to southwesterly winds and only a limited increase in wind speed.

3.4. Black Carbon

3.4.1. Four-Years BC Patterns and Source Apportionment

Figure 8 illustrates the seasonal polar plots of mean eBC concentrations from fossil fuel (eBCff) and biomass burning (eBCbb) sources. A detailed evaluation of the temporal variability of eBC contributing to sub-micrometer aerosol mass at the site will be presented in future work. Both eBCff and eBCbb show elevated concentrations during autumn and winter across the study period, with eBCff consistently higher than eBCbb, reflecting the predominance in the study area of fossil fuel sources, related to vehicular traffic. eBCbb concentrations are primarily observed during cold seasons, with significant differences between day (warmer hours) and night (colder hours). Notably, eBCff exhibits well-defined morning traffic rush hour patterns (around 8 o’clock, local time, in all seasons and around 8 o’clock a.m. and p.m., local time, during cold seasons), that are absent during weekends.
The plots reveal distinct wind directions associated with peak concentrations, suggesting specific source regions and the influence of atmospheric dynamics on pollutant dispersion. Interestingly, in the first and fourth quadrants during the traffic rush hours, the eBCff levels are higher than in the third quadrant (W-S). As previously noted, (Figure 2b and Figure 4), the heavily trafficked street of Via Salaria (SS4) encircles the park. Emissions from southern and western sectors pass through the wooded areas, which can act as natural filters, but also affect the wind field.

3.4.2. BC Indoors/Outdoors

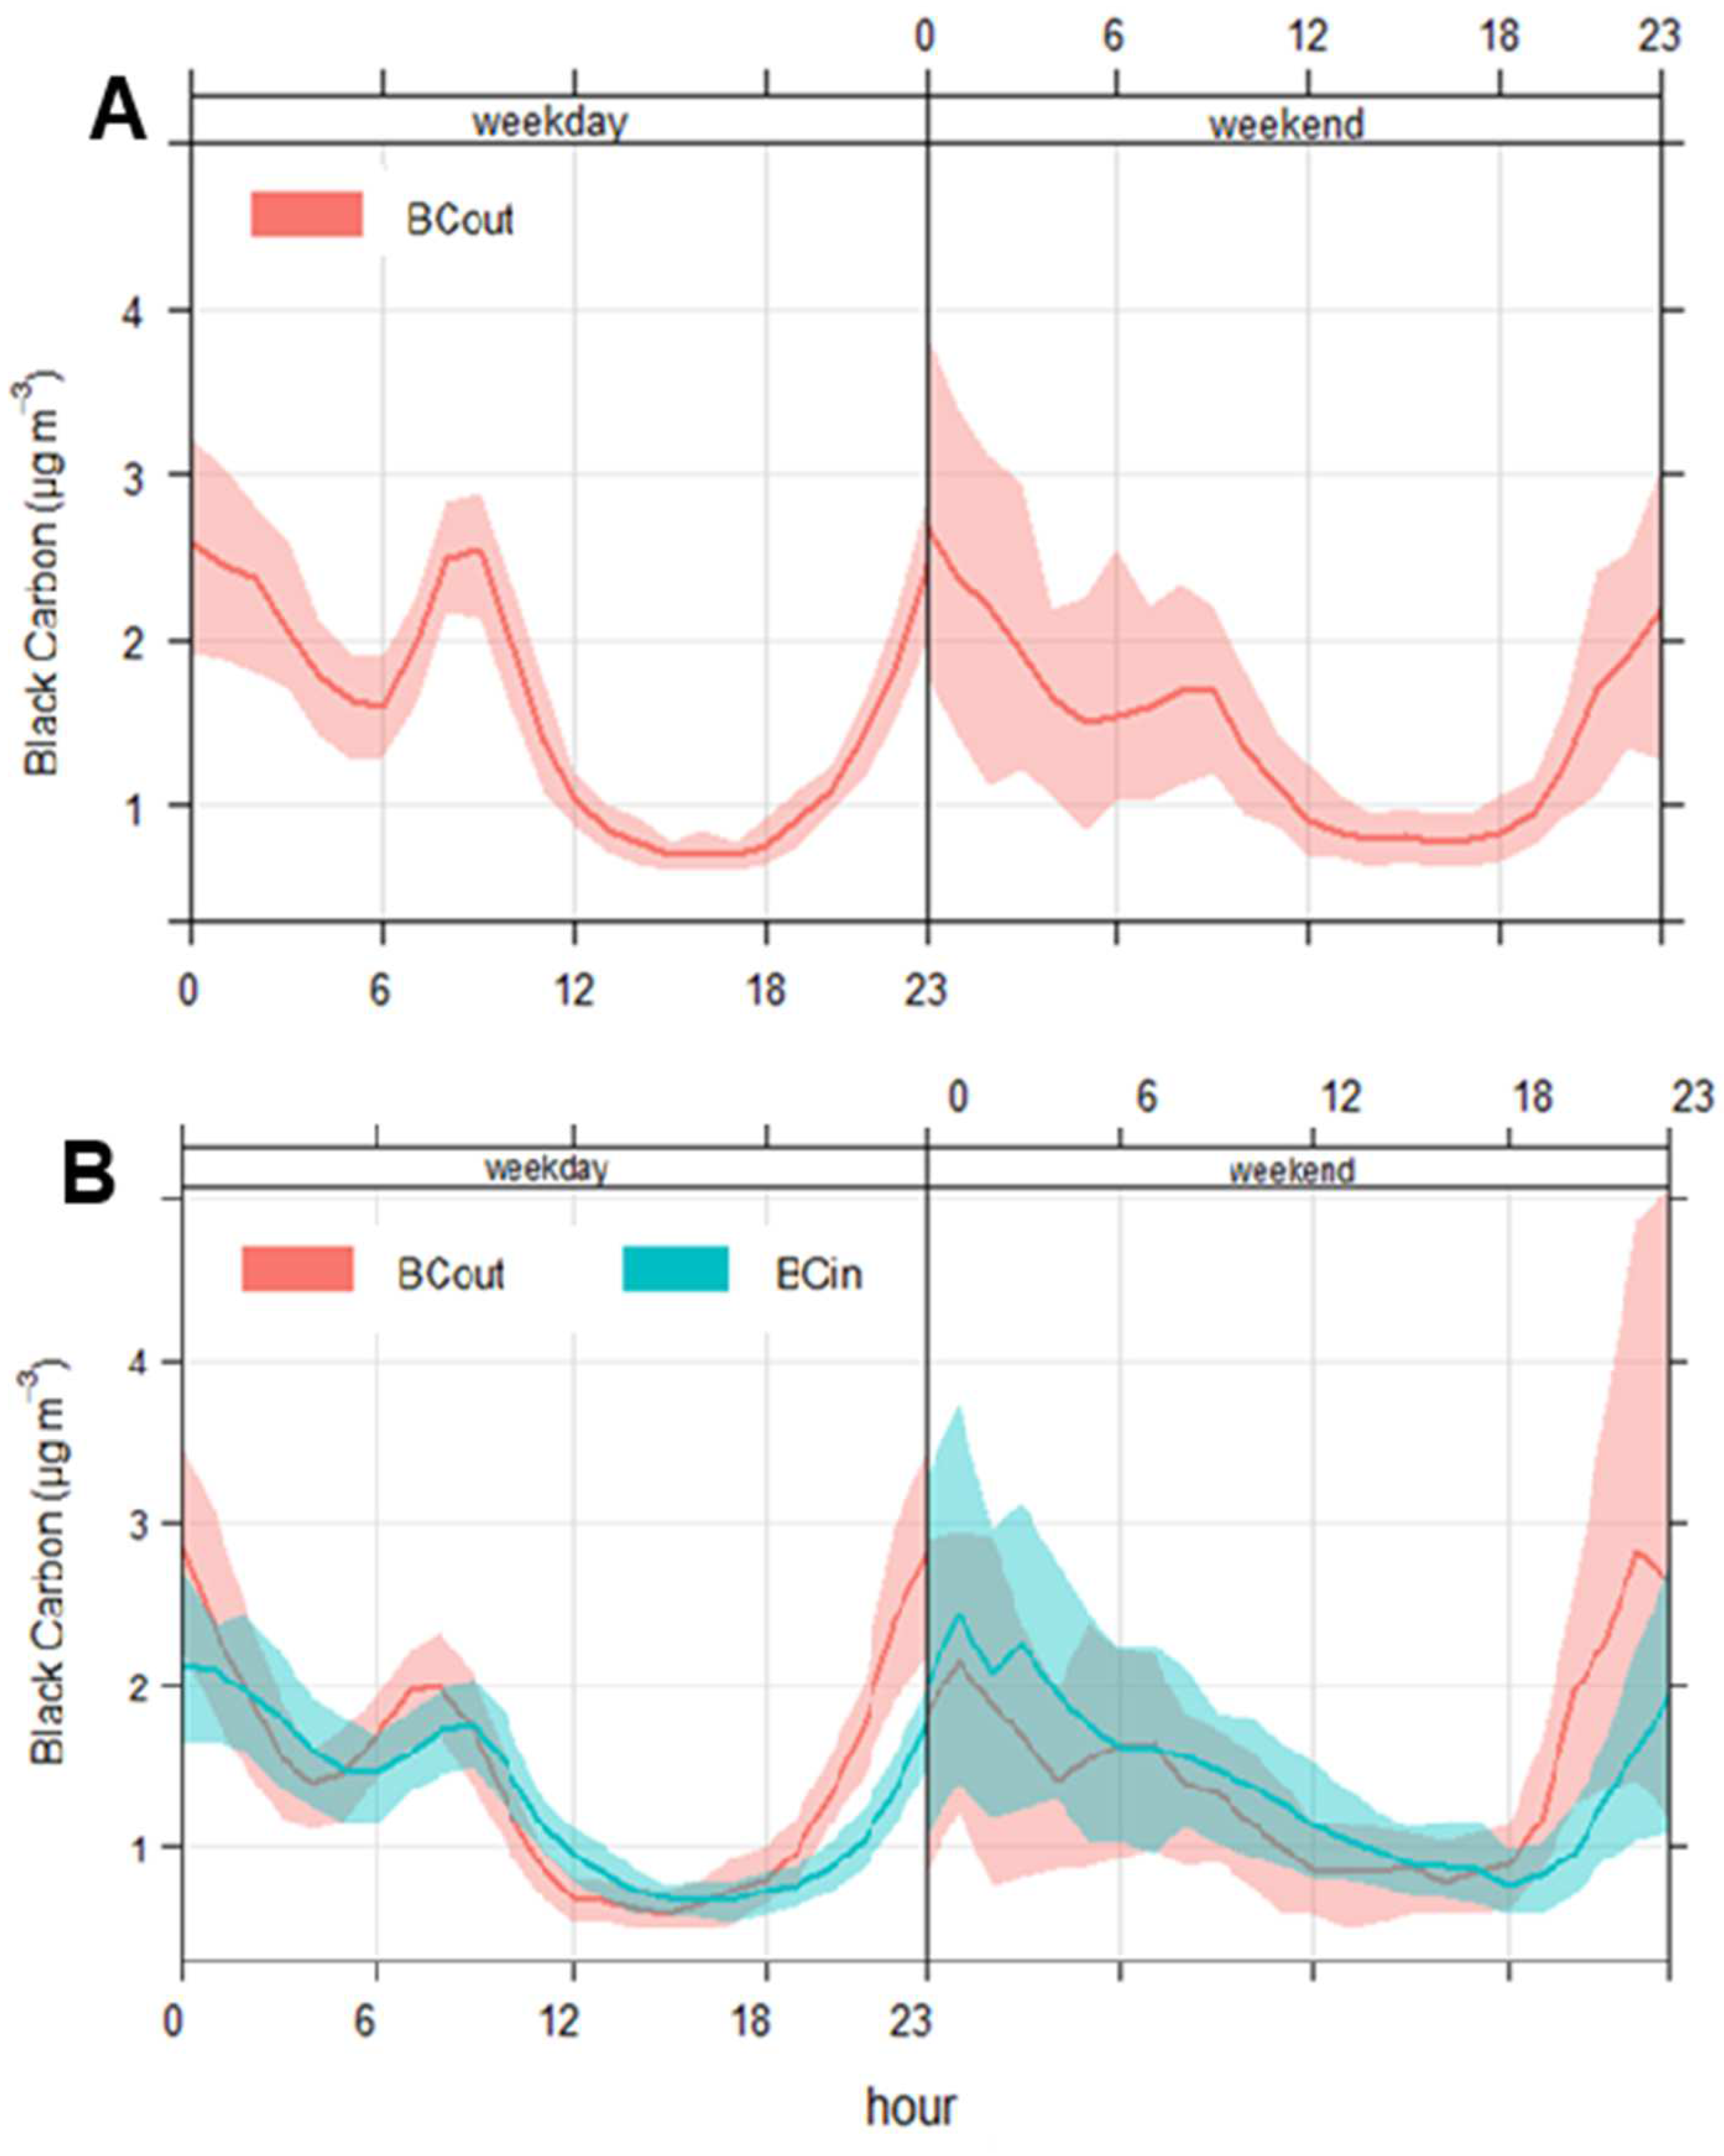
Figure 9 shows the diurnal cycles of the eBC measured in the spring season at (A) the urban forest site (Villa Ada, Figure 2a) and (B) the urban site (Sapienza, Figure 2a), both indoors and outdoors. Interestingly, the data indicate a low variability of the exposure to the eBC from indoor to outdoor, apart from a slight delay in the peaks previously noted indoors [6]. The major differences observed between the two sites occurred during the morning rush hours, whereas at midday the sites, both indoors and outdoors, experienced a similar exposure to BC.

3.4.3. BC and UHI

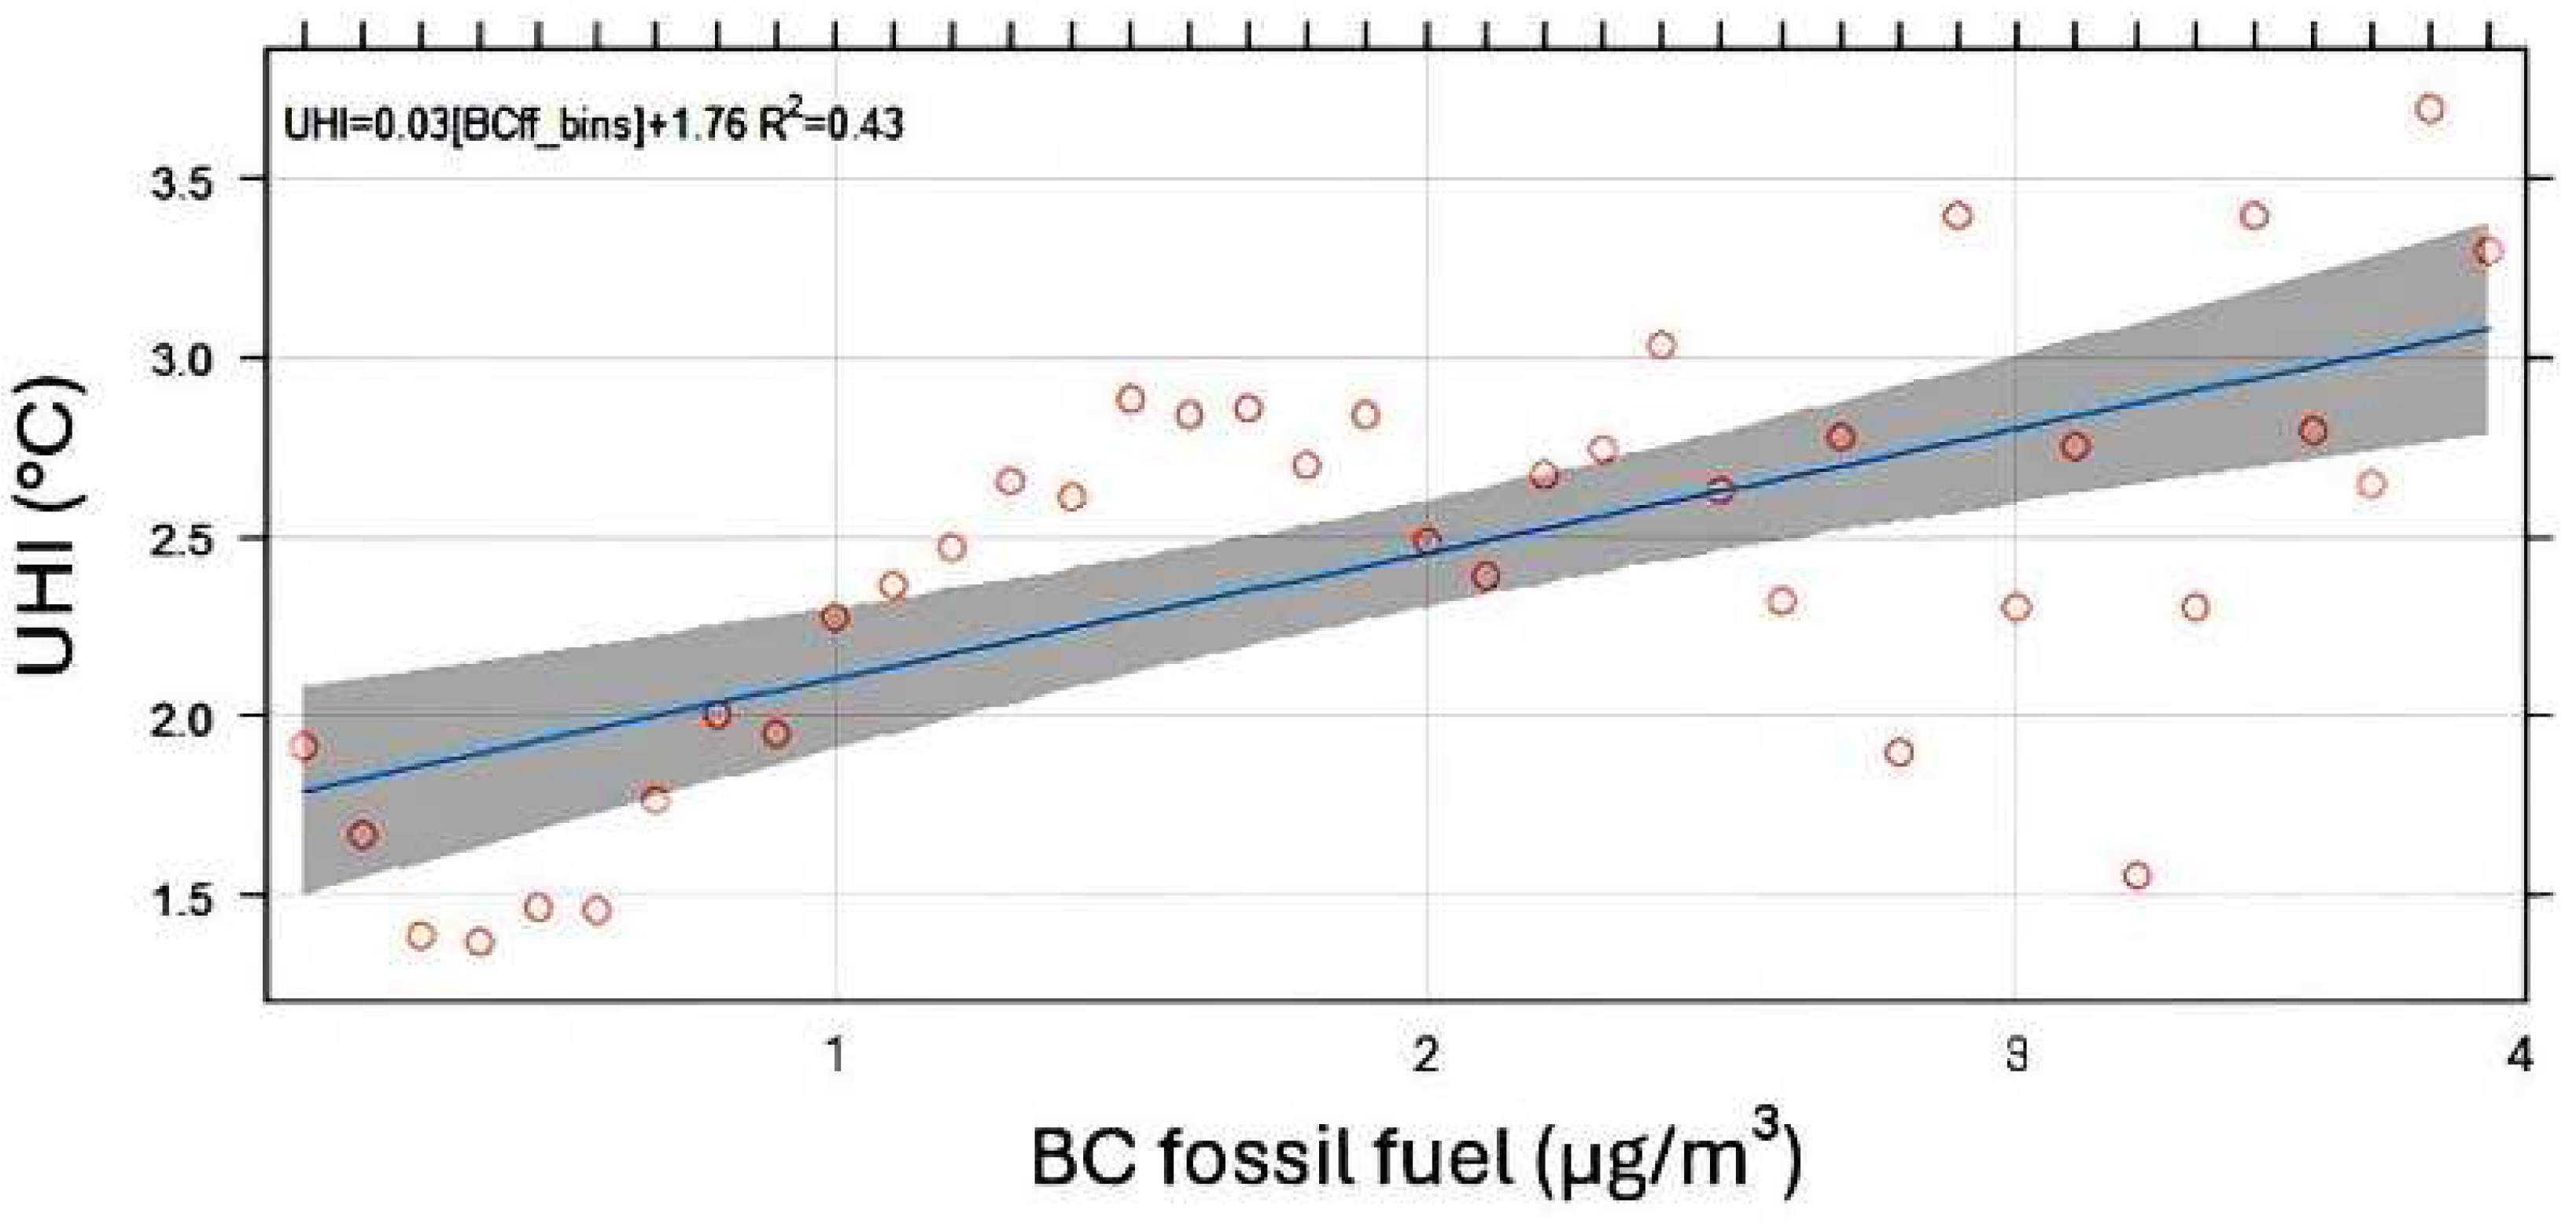
The possible relationship between the UHI effect and traffic-related air pollution, for which we utilized eBCff as a proxy, is illustrated in Figure 10. The scatter plot of UHI versus eBCff (BC fossil fuel), observed during the morning rush hour (6:00–10:00) at the urban forest site, Villa Ada, shows a positive correlation, with a coefficient of determination R2 = 0.43 and a correlation coefficient R = 0.66. These results agree with findings from other very recent studies, see, for example, Santinami at al. (2025, in preparation) [60], and suggest that the traffic-related component of black carbon may contribute to the modulation of the UHI during the early morning hours, as the nocturnal UHI phenomenon dissipates. This supports the idea that BC, particularly its traffic-related fraction, may exert positive radiative forcing due to its capacity to absorb radiation in the visible spectrum and re-emit it in the infrared spectrum, thereby playing a role in elevating temperatures in urbanized areas.

3.5. Total Particle Number Concentration

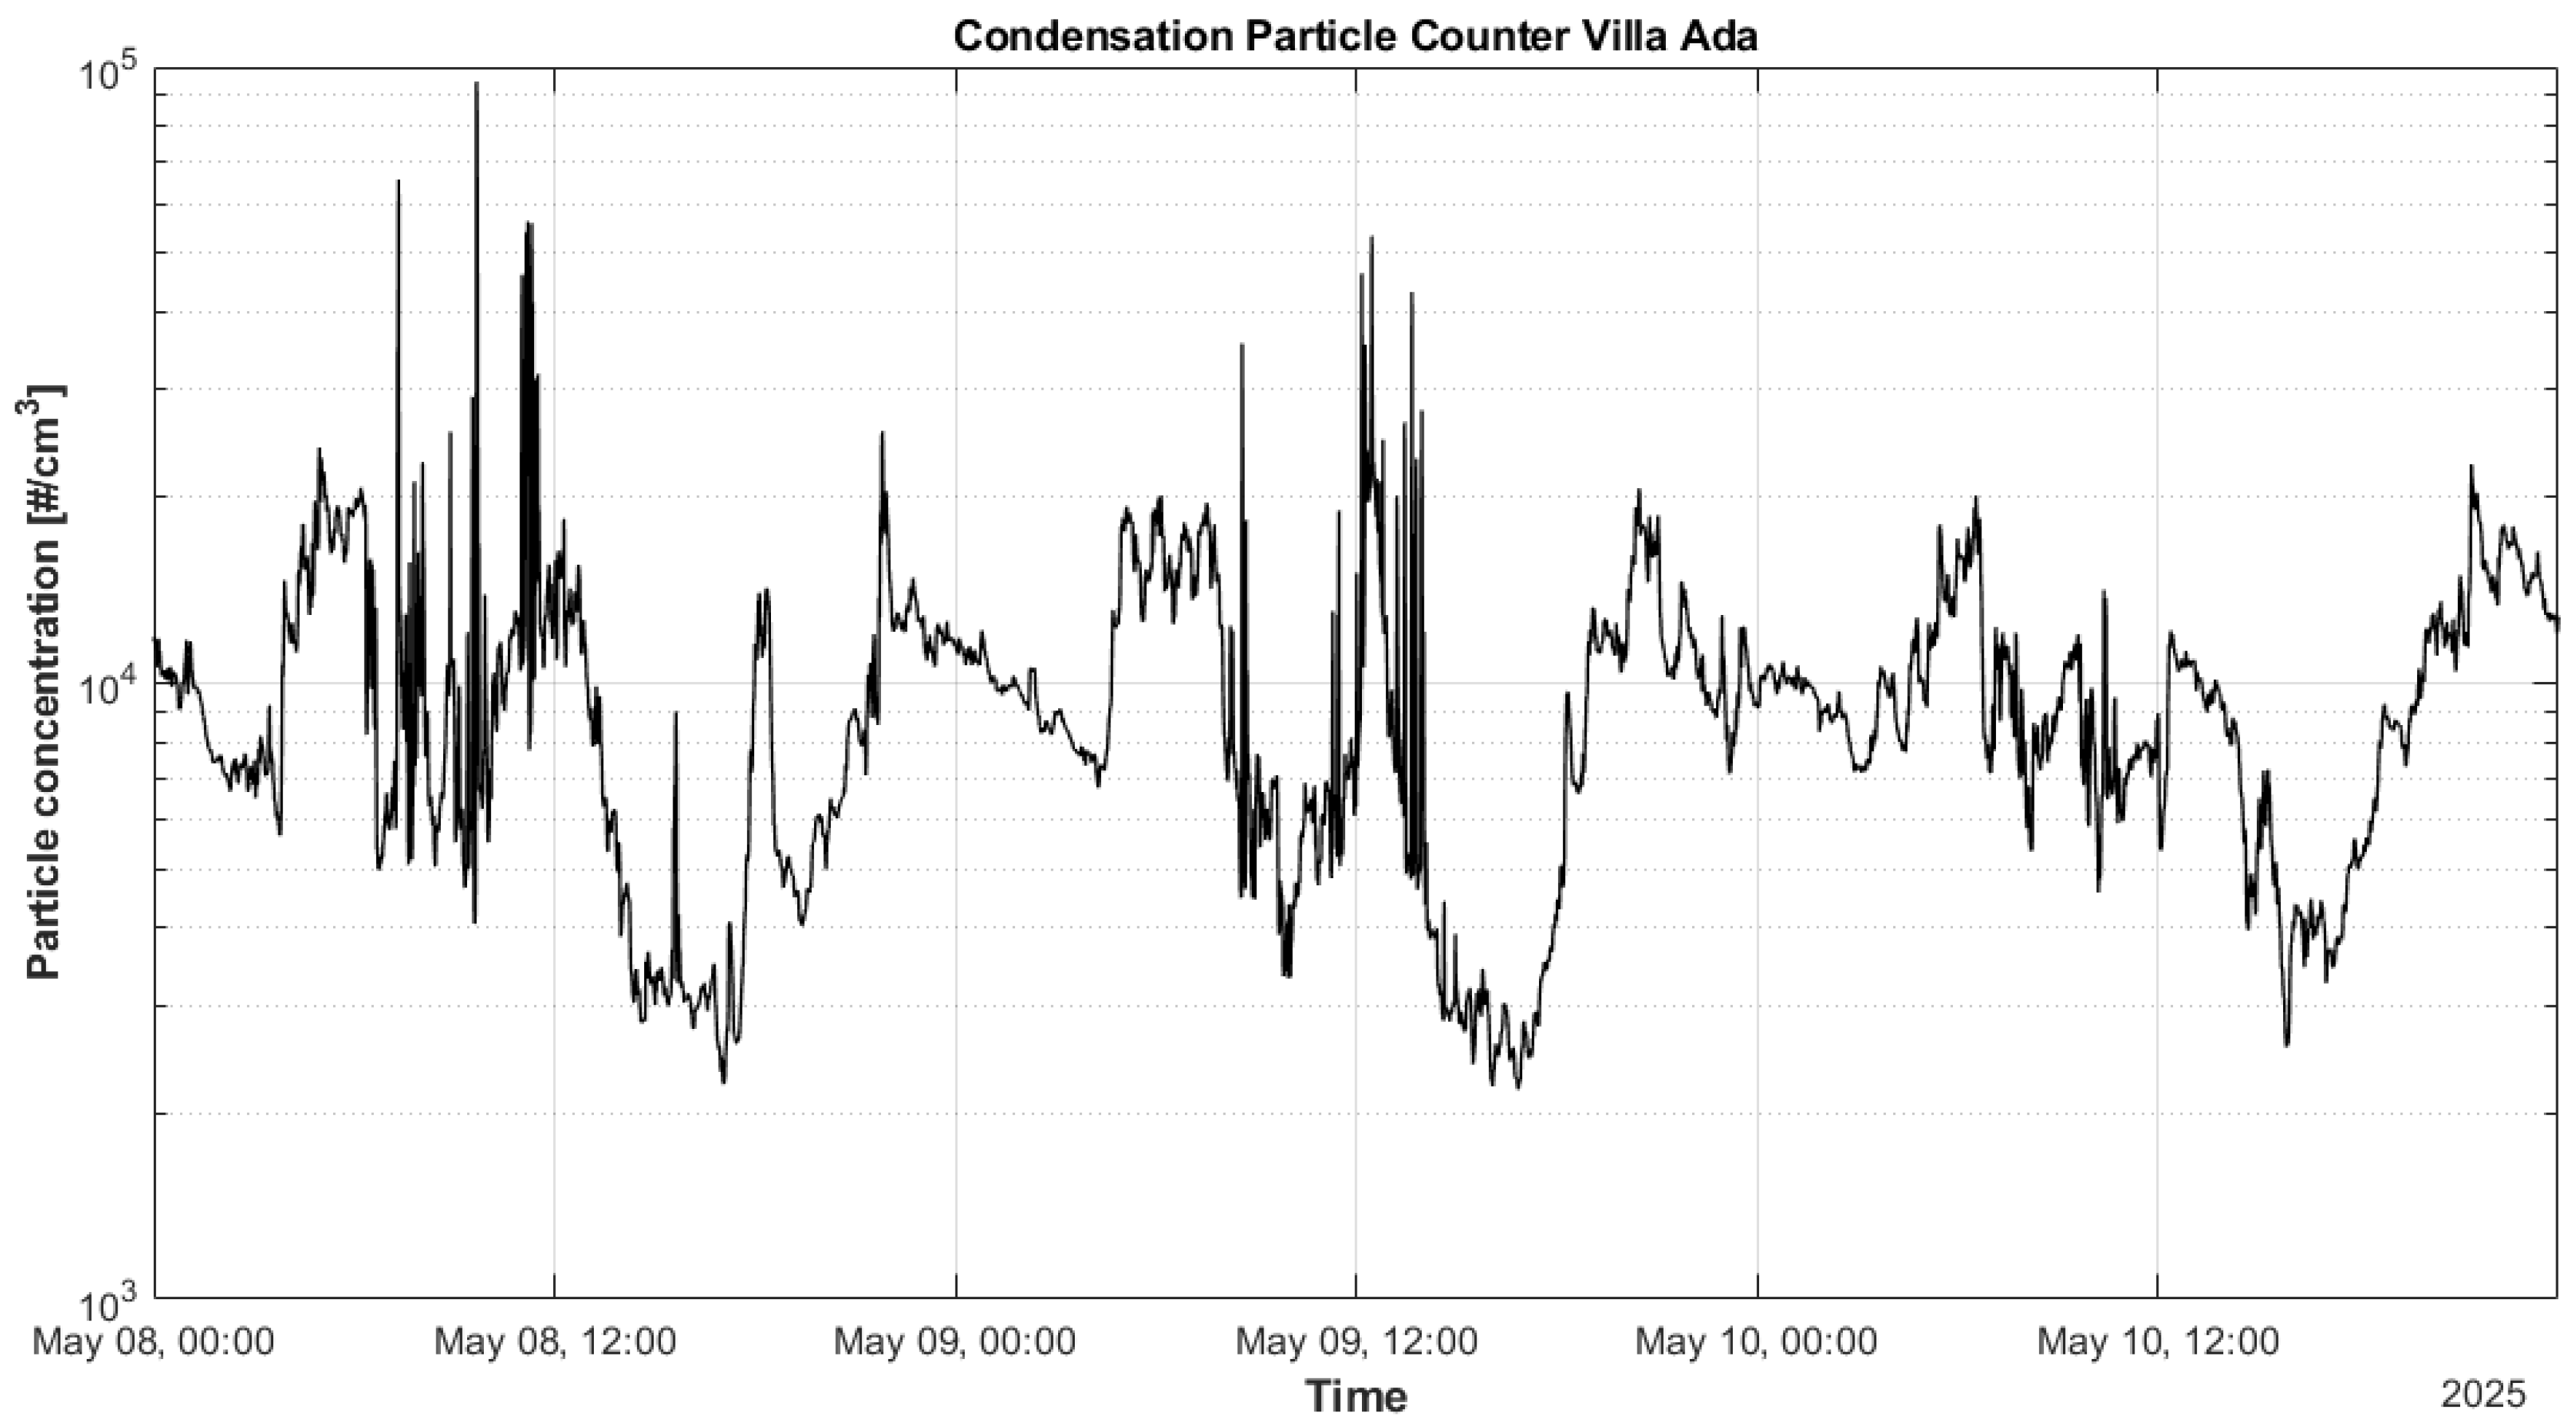
Figure 11 shows the total particle number concentration from 8 to 10 May 2025. Concentrations varied from ~103 particles/cm3 to ~105 particles/cm3. The temporal variability in particle number concentration during the observed period reveals the coupling of emission patterns, boundary layer dynamics and wind patterns, photochemistry, and atmospheric aerosol processing.
As a general feature, the total particle number concentration exhibits higher values at the morning and evening traffic rush hours, as well as at midday. The midday peak is generally linked to photochemical atmospheric aerosol processing, while the morning and evening peaks are more linked to the coupling of traffic rush hours’ emissions and boundary layer height.

3.6. Acellular PB-ROS

Figure 12 shows the temporal trend of PB-ROS during two representative winter days (January 2025), with a time resolution of 2 h. The date 23 January was a sunny day following rainfall, with low PM2.5 mass concentrations (10 µg/m3). In contrast, 24 January was a sunny accumulation day, with higher PM2.5 concentrations (19 µg/m3).
On the low PM2.5 day, PB-ROS exhibited two distinct peaks: one during traffic rush hours and one around midday. On the accumulation day, a midday peak was also observed, along with elevated nighttime values, particularly in the volume-normalized data.

3.7. Cell Viability and Morphology

3.7.1. Extraction of Particulate Matter from Quartz Fiber Filters

To assess the potential effects of freshly emitted traffic-related air pollution on human cell lines, particulate matter was collected on quartz fiber filters exposed in an urban environment. The crucial passage was represented by the translation of particulate matter on the filter into a liquid suspension that could be used in cell culture experiments. This process is essential to maximize extraction efficiency while maintaining compositional integrity so that the final extraction solution remains representative of ambient particulate matter. A variety of extraction techniques have been implemented, mainly involving aggressive methods such as sonication or agitation, with the real risk of disrupting some of the collected materials or altering the particulate composition. To overcome this potential bias, we set up a gentle extraction method that would allow the release of filter-bound particulate matter in solution without compromising their unique characteristics. To this end, filter portions of variable diameters were incubated in RPMI medium without FBS for 30 min with gentle shaking to allow particulate matter to reach the medium. BEAS-2B cells were incubated with media that had been previously incubated with 1–4 BF or EF portions (as described in Section 2.5.1, Cell Viability and Morphology) and analyzed to assess cell vitality and cell morphology, as described below (Figure 13A).

3.7.2. Impact of Traffic-Related Aerosol Exposure on BEAS-2B Cell Viability

To investigate the effects of TRAPs on BEAS-2B viability, cells were treated with BF/EF media for 4 h. Cell viability was not significantly affected in cells treated with BF1 or EF1 media, as well as with BF2 or EF2 media, with respect to untreated cells. Conversely, treatment with media exposed to three and four filter portions was able to induce a significant reduction in cell viability (p < 0.0005) (Figure 13B). However, the observation that cell viability is affected by both BF and EF samples prompted us to hypothesize that the toxicity of treatment might be due to the release of filter fibers in the medium rather than to particulate matter, as shown in BF3- and EF3-treated cells (Figure 13B).
On the basis of these results, we decided to perform the following experiments using BF1 and EF1 media, to prevent reductions in cell vitality and to limit the amount of fibers released by the filters.

3.7.3. Assessment of Traffic-Related Aerosol Impact on Cell Morphology

To identify cellular morphological changes upon traffic-related aerosol exposure, we observed cells treated with BF1 or EF1 under the inverted microscope. We found that BEAS-2B cells incubated with BF1 media did not show significant alterations with respect to untreated cells (Figure 13C). Nonetheless, EF1-treated cells displayed an increased number of detaching cells (characterized by a rounded shape) (arrows in Figure 13C), and some cells changed configuration from polygonal to shrunken and elongated shape (arrowheads in Figure 13C).
Since these morphological signs could be suggestive of oxidative stress [61,62], such observation prompted us to further investigate this aspect by future experiments aimed to assess intracellular ROS activity.

3.8. Epigenetic Markers of Oxidative Stress

BEAS-2B cells exposed to six different fresh, traffic-related urban fine particulate matter exhibited a significant molecular response characterized by biphasic response kinetics (Figure 14A,B). The acute molecular responses, occurring within 10 min, were marked by the upregulation of genes associated with oxidative stress and hypoxia, including NF-κB, NRF2, CAT1, HIF1α, and HMOX. The late response, observed at the 60 min mark, involved the activation of inflammatory and antioxidant genes such as TNFα and GPX4. Notably, the levels of GPX4 and TNFα positively correlated with the BCff-to-BC ratio [51]. The intensity of oxidative stress and inflammatory responses was influenced more by aerosol type and composition than by particulate matter mass.
The idea of two waves of activation suggested immediate defensive signaling, followed by a more complex inflammatory adaptation. Additionally, exposure to PM1 showed a time-dependent effect, with a rapid change also in the air pollution miRNA expression (10–60 min) (Figure 14C). It was observed that miRNAs usually upregulated in response to PM2.5 exposure, such as miR-923, miR-513b, miR-513c, and miR-338, mirror gene expression trends on the same days of fresh traffic-related urban areas.
Our in vitro experiments using BEAS-2B human bronchial epithelial cells exposed to freshly emitted urban fine particulate matter revealed a rapid and biphasic cellular response, highlighting the acute sensitivity of airway epithelial cells to real-world traffic-related air pollution. Within just 10 min of exposure, we observed a marked upregulation of genes involved in oxidative stress and hypoxia signaling, including NF-κB, NRF2, CAT1, HIF1α, and HMOX. This immediate activation suggests that lung epithelial cells are capable of sensing and responding to pollutant-induced stress within very early minutes of exposure. After 60 min, cells shifted toward a pro-inflammatory state, underlined by TNFα and GPX4 modulation. Notably, their expression levels positively correlated with the BCff-to-BC ratio, indicating that the biological effects of particulate matter are strongly linked to fossil fuel combustion sources.
Furthermore, we observed changes in specific miRNAs expression under particulate matter exposure, supporting a role for epigenetic regulation in cellular responses to urban pollution. The expression of miR-923, miR-513b, miR-513c, and miR-338 mirrored gene patterns, suggesting these miRNAs may act as upstream regulators of stress-related pathways, and can serve as potential sensitive biomarkers of acute cellular responses to air pollution.
Together, these findings provide mechanistic evidence that fresh urban particulate triggers rapid genetic and epigenetic multi-phase oxidative and inflammatory responses in human bronchial epithelial cells. This underlines the complexity of cellular reactions to UFPs and underscores the need for integrated and multidimensional approaches to fully investigate the health risks of urban air pollution.

3.9. Microbiota and Urban Air Pollution Exposure

The biodiversity of the gut microbiota was investigated via Faith’s PD index, a measure of alpha-diversity, between the different groups (Figure 15). Regardless of the pathology they suffer, Faith’s PD index showed significantly greater diversity in the gut microbiota of individuals living in a rural environment as compared to those living in a suburban environment, who had a much less diverse microbial gut ecosystem. No significant difference in the diversity of gut microbiota could be observed between individuals living in an urban environment and those living in rural or suburban areas. This might be due to a higher inter-individual variability of the gut microbiota of individuals living in an urban environment, than those of the other two groups. This particularly high variability could potentially be correlated to differences in the exposure to varying concentrations of diverse pollutants, based on the proximity to a highly trafficked street rather than to a park or industrial area. Conversely, the higher biodiversity of the gut microbiota of individuals living in rural areas could be explained by the exposure to a lower concentration of air pollutants and by the daily contact with a highly biodiverse microbial environment.

3.10. Vegetation

Figure 16 shows the relative change of JIP-test parameters derived from fast fluorescent transients (a) and reflectance indices (b) measured at the leaf level of the studied species Q. ilex (Qi) and L. nobilis (Ln). The values are expressed as the ratio between trees located in the inner part of the urban park, considered as control under the assumption of higher air quality, and trees located in the vicinity of the road via Salaria (Rome, Italy). It is interesting to note that both species displayed a similar trend in changes in the constellation of parameters reflecting photosystem functionality (Figure 16a). Energy dissipation (DI0/RC) emerged as the first protective mechanism employed by plants to cope with oxidative stress [63]. The PITOT was affected by traffic exposure. Its higher values in roadside plants relative to the control plants were supported by increases in two key parameters, δR0 and ΔVIP, which indicate an enhanced capacity to reduce end acceptors beyond PSI, such as ferredoxin and NADP+ [64]. The relative increase in δR0 and ΔVIP, which contrasts with previous findings where these parameters decreased in Q. ilex in response to particulate matter [54], may indicate the activation of compensatory mechanisms that sustain photosystem functionality, rather than downregulation aimed at preventing leaf injury. Although we did not conduct gas exchange measurements, we hypothesize that alternative electron transport pathways, such as cyclic and/or pseudo-cyclic electron flow [65], may have been activated to mitigate and repair the effects of oxidative stress [66]. The rise in the K band indicates that trees exposed to traffic may be experiencing heat stress severe enough to alter photosystem II [67].

4. Discussion

In this paper, we present the methodology and preliminary results of an experiment conducted in Rome (Italy) within the framework of the NBFC–Spoke 6 project, with the aim of outlining the planetary health approach as a lens to assess urban health.
Following the diagram in Figure 17, we discuss here the results showing the role of the urban atmosphere in the real-life scenario on the urban external exposome and its influence on urban health. The multiple components of this study leading to the present results can be summarized as follows:
  • Defining the external urban exposome with a focus on the combination of atmospheric pollution and urban climate;
  • Applying measurement and modeling tools to assess the exposome and the potential feedback;
  • Investigating biological responses in humans by in vitro assays, gene and miRNA expression on cells (BEAS-2B cells), and gut microbiota diversity on human specimens (IBD/IBS cohort). Saliva biomarkers will be the focus of future work (EMERGE cohort);
  • Investigating biological responses in plants, assessed by functional traits in Quercus ilex and Laurus nobilis (e.g., chlorophyll fluorescence, reflectance indices) as indicators of oxidative stress.
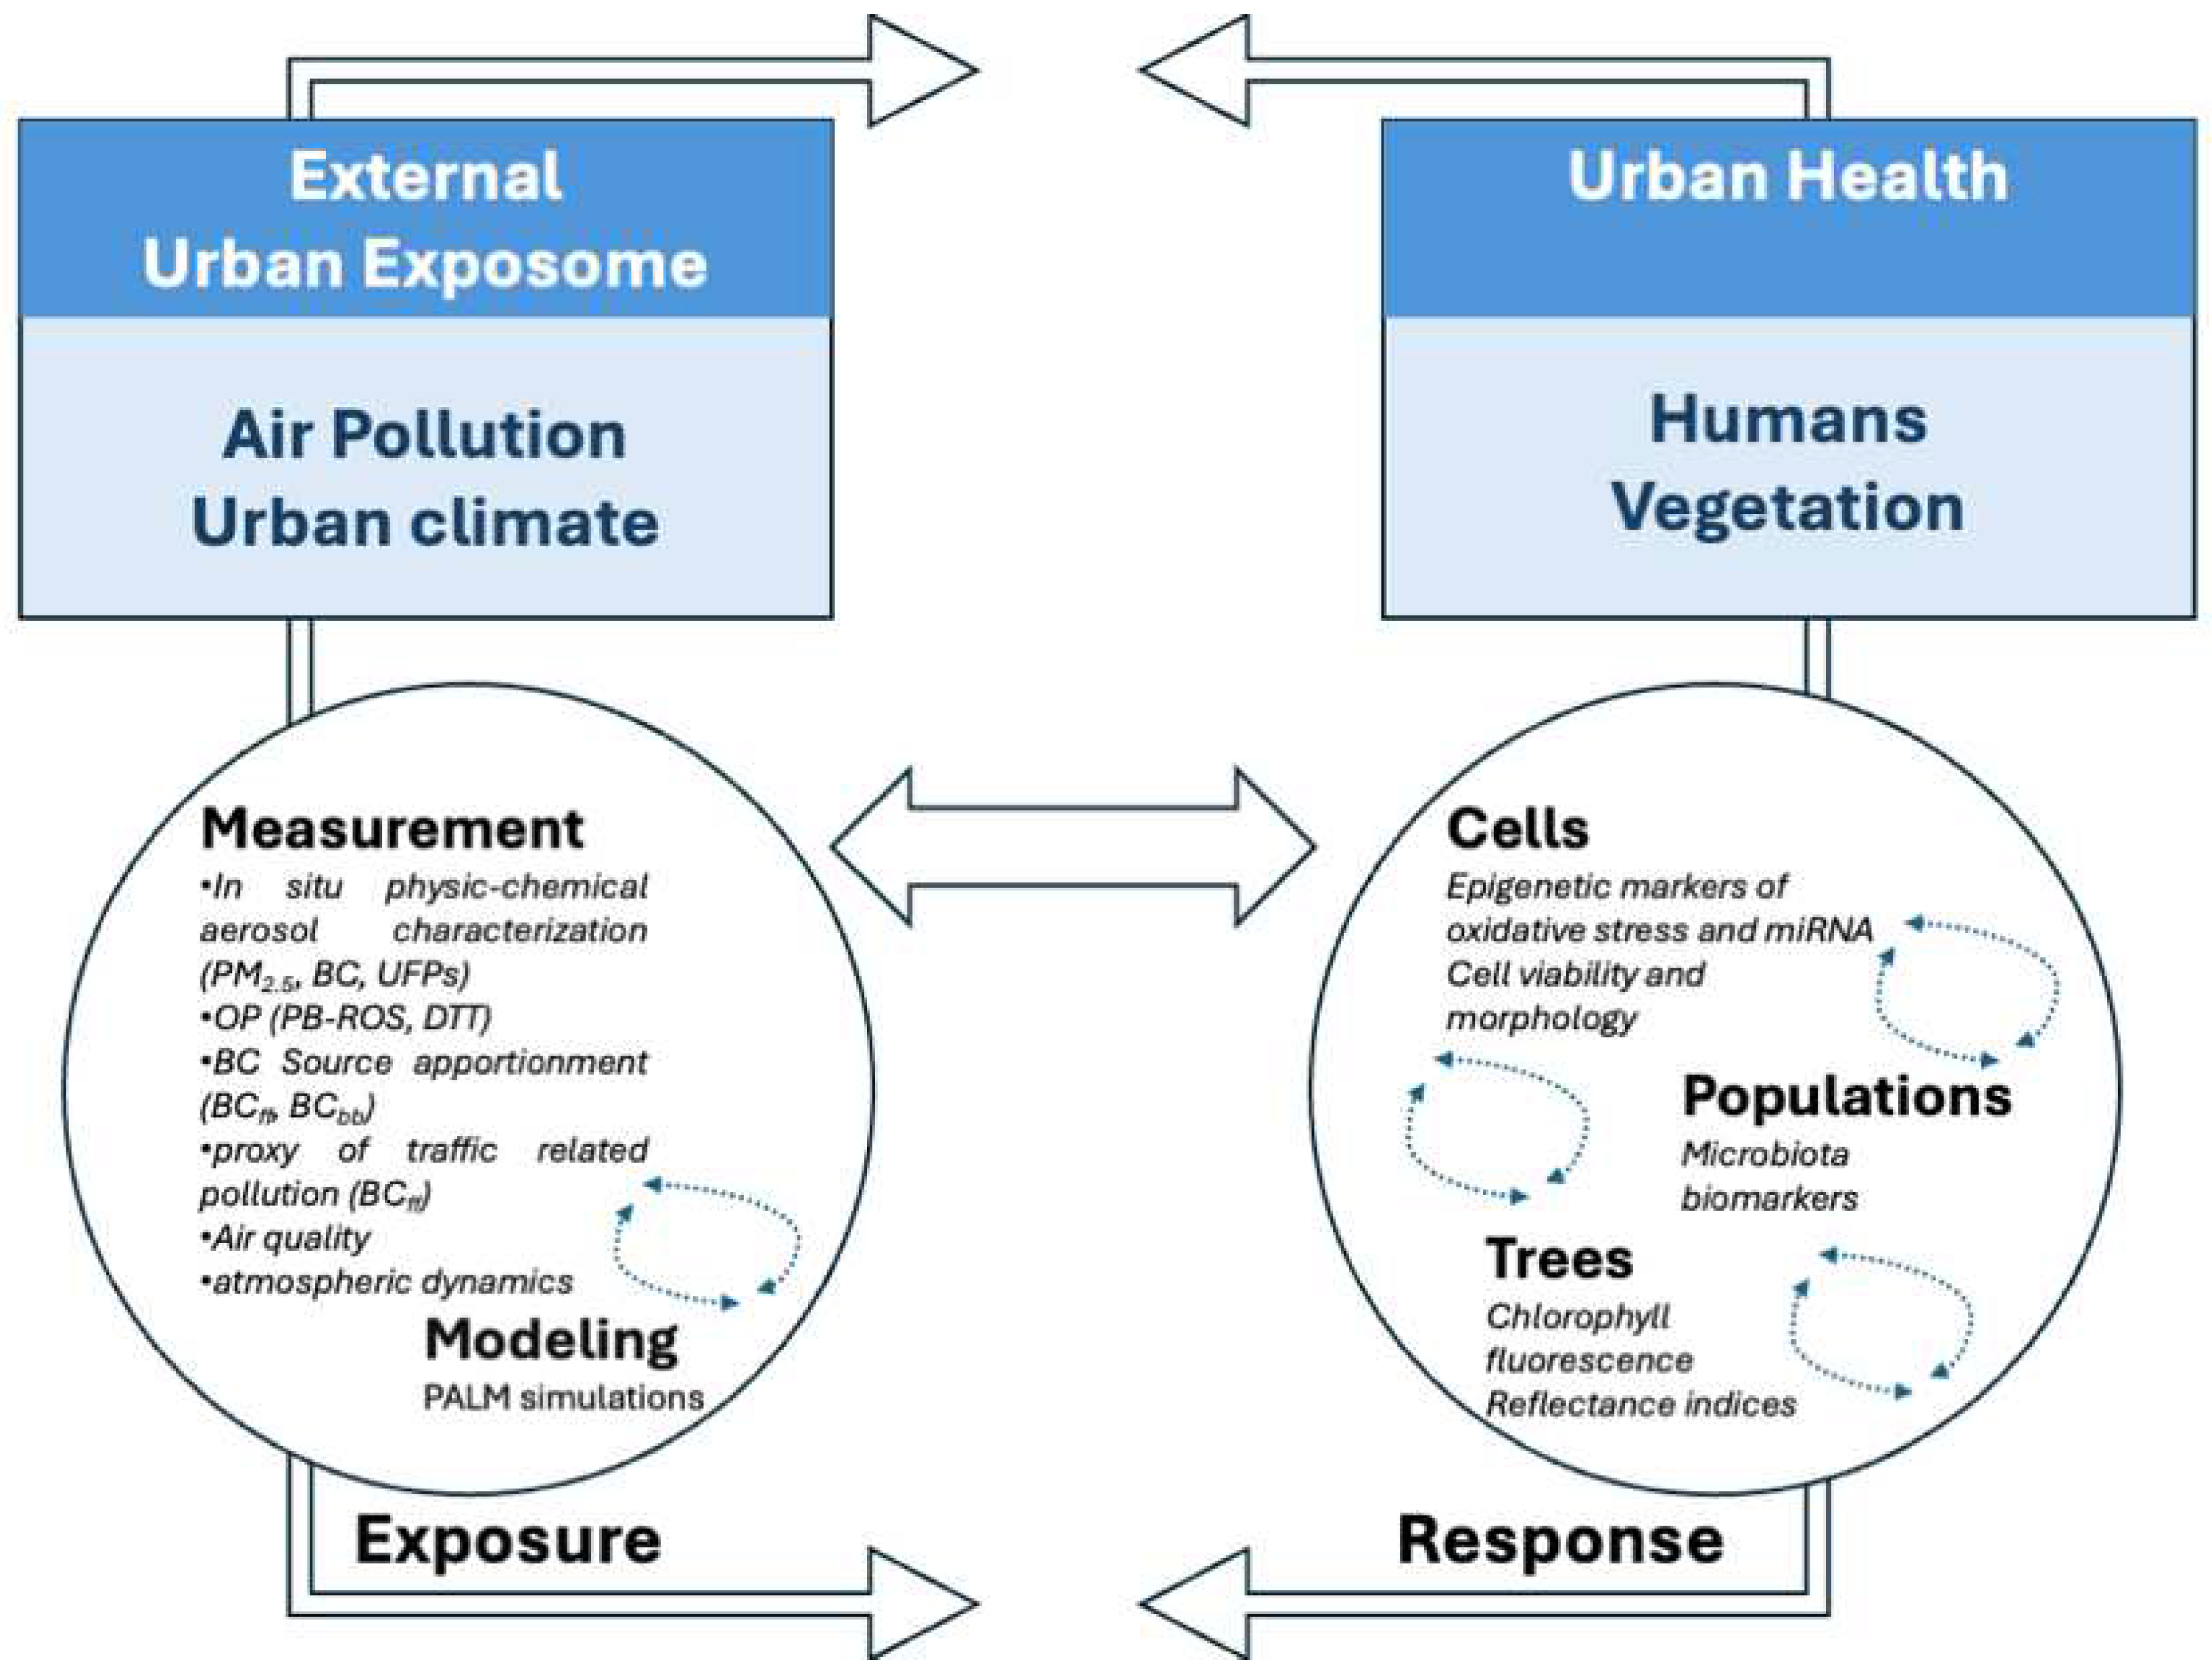
Figure 17 highlights also the feedback loops occurring in this process. For instance, vegetation influences air quality through particle deposition and microclimate regulation; atmospheric conditions modulate pollutant dispersion and exposure levels; and biological responses (e.g., inflammation, oxidative stress) inform health risk assessments on humans and guide urban greening strategies.
Figure 17. Diagram illustrating the integration of multiple components within this study.
Atmosphere 16 01144 g017
While integrating data from multiple disciplines introduces challenges—particularly regarding consistency in interpretation—we believe this interdisciplinary approach is crucial to comprehensively address the complexity of environmental exposures and their biological effects. To mitigate these challenges, we have adopted harmonization strategies aimed at aligning methodologies and interpretations across domains. As the research evolves and additional analyses and broader datasets become available, we intend to present these integrative efforts with greater clarity and specificity in future publications, thereby strengthening the robustness and reproducibility of our findings.
We identified atmospheric conditions characterized by high levels of fresh traffic-related aerosols (traffic-related nanoparticles, fossil fuel BC, and PB-ROS) and low levels of PM2.5 mass concentration. These conditions can occur in an urban environment following a precipitation event or upon ventilation of the boundary layer.
Our previous findings provide a new perspective demonstrating how the influence of aerosol sources (primarily urban vehicular traffic) on aerosol toxicity is modulated by climate and weather conditions. We previously used a methodology where lung epithelial cells were singly exposed at the air–liquid interface directly to real environmental concentrations of PM2.5 to assess conditions that translate into ultra-low doses of treatment [68,69]. Using this methodology, we found that single exposures to urban nanoparticles at low PM2.5 doses can be a source of both oxidative stress and inflammation [7], DNA damage [5], and epigenetic alterations in the expression of genes related to xenobiotic metabolism [6] after low-pressure weather conditions when rainfall and strong winds may favor low levels of PM2.5.
In the present study, we assessed how these atmospheric conditions are associated with epigenetic markers of inflammation and oxidative stress (miRNA) in in vitro cell lines and in human specimens in cohorts over sub-daily (6–12 h) to yearly periods. Giammona et al. (2024) [19] provided scientific evidence about the tight correlation between miRNA dysregulation, PM2.5 exposure, and gene pathways involved in cancer progression. In particular, the results highlighted the role of 12 miRNAs (6 UP: miR-513c/b/a-5p, miR-923, miR-494, miR-338-5p; DOWN miR-31, miR-26b, miR-96, miR-27a, miR-135b, miR-374a) altered in response to PM2.5 as controllers of cell proliferation and survival, epithelial-to-mesenchymal transition, inflammatory response, and oxidative stress. Our experimental approach established a novel exposure method to assess the biological responses in PM1 samples without altering the particulate composition and characteristics [51]. Preliminary data on cellular effects allowed us to identify a threshold of exposure below which we could appreciate the sublethal outcomes of air pollutants. The findings presented here suggest an induction of oxidative stress in human cells, a hypothesis that will be further investigated in future experiments by assessing specific hallmarks of free radical production, such as intracellular ROS activity and lipid peroxidation levels. Thus results highlight that fresh traffic-related urban fine particulate matter triggers a rapid and multi-phase oxidative and inflammatory response in BEAS-2B cells, with wide gene expression and miRNA modulation [51].
In addition, evidence emerged supporting a role of the external urban exposome in the composition of the intestinal microbiota. The preliminary findings, derived from a study population exposed to different environments, showed a statistically significant diversity in the gut microbiota of individuals living in a rural environment as compared to those living in suburban and urban environments, with a clear gradient from urban to rural areas. This preliminary result is consistent with previous outcomes, confirming an association between dietary habits and gut microbial biomarkers in individuals with chronic gastrointestinal disorders compared to healthy subjects [70]. Emerging studies are now exploring the potential of modulating the intestinal microbiota as a preventive approach for non-communicable chronic diseases [70,71]. The IBD/IBS subgroup (n = 33) is relatively small and may not be broadly representative. This subset was included to explore potential preliminary associations and generate hypotheses for future research, which will analyze the entire population (n = 140). Lifestyle, dietary, and socio-economic factors significantly influence microbiota composition and biomarker profiles. Although metadata related to these variables were collected, the scope of this preliminary study did not allow for comprehensive control or adjustment. This represents a limitation in interpreting the observed associations. However, these factors will be explored in greater depth in forthcoming dedicated studies, where their potential confounding effects can be more thoroughly assessed.
Finally, the role of vegetation in shaping the above-mentioned underlying mechanisms between exposure and biomarkers was assessed. Evergreen broadleaf species play a crucial role in improving air quality owing to their leaf morphology, which facilitates the removal of PM from the atmosphere [72] and complements the development and application of high-performance, eco-friendly filtration materials, equally critical for protecting human health and enhancing urban resilience [73,74,75]. Leaf traits can serve as early indicators of oxidative stress caused by PM accumulation [54]. In particular, traits related to photosynthesis are critical because they are vital for maintaining plant growth, which in turn affects the leaf surface area available for PM adsorption. It is interesting to notice an increase of K band, indicating that trees exposed to traffic may be experiencing heat stress severe enough to cause alteration to photosystem II [67]. This phenomenon may be influenced by site-specific environmental conditions, including the effects of surrounding buildings, wind speed, and air temperature on the thermal environment within the street canyon [76]. The PRI and ARI are the only changing reflectance indices. These reflectance indices are indicative of different protective processes, such as free radical scavenging and photoprotection, that are triggered by PM exposure [77]. Ln tends to activate the xanthophyll cycle to dissipate the excessive excitation energy at photosystems levels, showing more sensitivity to traffic exposure relative to Qi confirming that this species could be exposed to higher oxidative stress.
Traffic congestion has been linked to increased health risks through exposure to multiple pollutants [78] and recent studies have demonstrated that policy interventions, such as banning internal combustion engine vehicles, can yield significant environmental and health benefits [79]. Similarly, these findings support the relevance of integrated approaches, such as the planetary health framework adopted in our study, for assessing and mitigating urban exposome impacts.

5. Conclusions

Addressing climate change, biodiversity loss, global pollution, and planetary health requires novel and holistic approaches. Here, we present the preliminary findings and methodology of the Rome NBFC–Spoke 6 experiment. A new dataset of urban exposure, atmospheric metrics, and biomarkers in humans and vegetation was obtained. This was designed on pathways linking oxidative stress biomarkers in humans and photosynthesis-related traits in vegetation to co-exposure to urban environmental stressors, such as traffic-related atmospheric aerosols and an urban climate. The analysis of these new data has the potential to provide proof of a cause–effect relationship between short-term exposure to urban environmental stressors and oxidative stress in both humans and plants, with a view on chronic responses possibly shaping this relationship.
These findings lend support to the hypothesis that traffic-related pollution induces oxidative stress and inflammation in urban environments, even at low levels of exposure within a complex urban exposome scenario. Specifically, the results indicate the following:
  • Traffic-related pollution must be examined within the broader context of urban climate and ecosystem complexity.
  • Exposure to urban aerosols, characterized by traffic emissions, induces a rapid and multi-phase oxidative and inflammatory response in bronchial epithelial cells, accompanied by extensive modulation of gene expression and miRNA profiles.
  • Differences in gut microbiota diversity across urban, suburban, and rural settings suggest environmental influences on microbial composition.
  • Functional trait alterations observed in urban trees exposed to roadside pollution point to early signs of oxidative and thermal stress.
  • Through the application of measurements and modeling tools, this study highlights feedback mechanisms between vegetation and atmospheric conditions, where urban greenery not only mitigates pollution but also influences microclimate and exposure dynamics.
Despite inherent challenges in integrating multidisciplinary data, this approach remains essential to fully understand the complexity of environmental exposures and their biological effects. We have taken steps to harmonize interpretation across domains, and future work will present these efforts in greater detail as broader datasets and analyses become available. Future research will refine exposure–response relationships, expand cohort analyses, and explore long-term health outcomes. The methodology developed here can serve as a blueprint for similar assessments in other urban contexts, contributing to the advancement of sustainable and resilient cities.
In the highly urbanized world, this evidence could be pivotal in providing a new perspective for connecting the urban exposome and urban planetary health. We believe that new approaches are needed, and that these must incorporate novel exposure–response curves based on real atmospheric conditions, new metrics for exposure, measurable human biomarkers, and key functional traits associated with photosynthesis.

Supplementary Materials

The following supporting information can be downloaded at: https://www.mdpi.com/article/10.3390/atmos16101144/s1, Section S1. PalM. Section S2. Annual Statistics of Pollutants.

Author Contributions

Conceptualization: F.C., L.F., A.A. and G.B.; methodology: C.S., D.D.V.B., L.F., G.D.I., C.A., C.C., A.D.C., M.D.P., S.F., A.L., L.M. (Lorenzo Massimi), M.R., A.S., R.S., A.A., G.B. and F.C.; software: S.F. and L.M. (Luca Mortarini); validation: G.B. and F.C.; formal analysis: C.S., L.F., G.D.I., C.A., A.G. (Alessandro Giammona), L.R., E.R., A.S., A.A. and F.C.; investigation: C.S., D.D.V.B., L.F., G.D.I., A.B., S.C. (Simona Ceccarelli), A.D.C., L.D.L., M.D.P., S.F., A.G. (Alessandro Giammona), M.P.L.G., D.R., L.R., E.R., R.S., A.T., A.A. and F.C.; resources: F.C., S.A., S.C., G.C. (Giampietro Casasanta), G.C. (Giorgio Cattani), T.C.L., R.C., A.D.C., A.D.D.G., L.D.L., A.D.M.d.B., O.D., A.G. (Alessandra Gaeta), V.I., A.L., L.M. (Lorenzo Massimi), M.P., F.P. and M.R.; data curation: C.S., D.D.V.B., L.F., G.D.I., A.B., C.G., A.G. (Alessandro Giammona), M.P.L.G., L.D.G., S.L. (Stefano Listrani), A.L.D., L.M. (Lorenzo Marinelli), F.P., L.R., A.S., G.B., R.G., S.C. (Simona Ceccarelli), A.T. and F.C.; writing—original draft preparation: C.S., F.C., A.A., G.B. and L.F.; writing—review and editing: C.S., F.C., D.D.V.B., L.F., G.D.I., C.C., S.C. (Silvia Canepari), G.C. (Giampietro Casasanta), S.C. (Simona Ceccarelli), R.D.G., S.D., A.D.M.d.B., M.D.P., S.F., A.G. (Alessandro Giammona), M.P.L.G., L.M. (Luca Mortarini), M.C.M., F.P., D.R., M.R., A.S., R.S., A.T., A.A. and G.B.; visualization: C.S., D.D.V.B., G.D.I., A.B., A.G. (Alessandro Giammona), S.C. (Simona Ceccarelli), A.T. and L.M. (Luca Mortarini); supervision: M.C.F., S.C. (Silvia Canepari)., G.C., G.C. (Giorgio Cattani), H.C., S.D., L.D.G., A.A. and F.C.; project administration: G.B. and F.C.; funding acquisition: M.C.F., C.C., H.C., A.D.D.G., L.D.L., L.D.G., G.B. and F.C. All authors have read and agreed to the published version of the manuscript.

Funding

This work was supported by the grant agreement between ARPA Lazio and ISAC CNR and the project “National Biodiversity Future Center—NBFC”. Project funded under the National Recovery and Resilience Plan (NRRP), Mission 4 Component 2 Investment 1.4—Call for tender No. 3138 of 16 December 2021, rectified by Decree n. 3175 of 18 December 2021 of the Italian Ministry of University and Research funded by the European Union—NextGenerationEU. Project code CN_00000033, Concession Decree No. 1034 of 17 June 2022 adopted by the Italian Ministry of University and Research, CUP F87G22000290001.

Institutional Review Board Statement

The cohort study involving humans (Section 2.6 and Section 3.9) was conducted in accordance with the Declaration of Helsinki and approved by the local ethics committee of Campus Bio-Medico University Hospital (Prot. PAR: 001.23(109.22) OSS).

Informed Consent Statement

Informed consent was obtained from all subjects involved in the cohort study involving humans (Section 2.6 and Section 3.9).

Data Availability Statement

Data will be available upon request.

Acknowledgments

The authors express their gratitude to the Italian non-profit organization Legambiente, particularly the personnel at Direzione Nazionale, Via Salaria 403, 00199—Rome, for their hospitality in hosting AEROLAB during the Rome NBFC experiment and for the generous support extended to the staff and researchers on site. Alessandro Bracci and Ferdinando Pasqualini were supported by the project IR0000032—ITINERIS, Italian Integrated Environmental Research Infrastructures System (D.D. no. 130/2022—CUP B53C22002150006) funded by the EU (Next Generation EU PNRR Mission 4 “Education and Research”, Component 2 “From research to business”, Investment 3.1 “Fund for the realization of an integrated system of research and innovation infrastructures”).

Conflicts of Interest

The authors declare no conflicts of interest.

References

  1. HEI. State of Global Air 2024; Special Report; HEI: Boston, MA, USA, 2024. [Google Scholar]
  2. Lelieveld, J.; Haines, A.; Burnett, R.; Tonne, C.; Klingmüller, K.; Münzel, T.; Pozzer, A. Air Pollution Deaths Attributable to Fossil Fuels: Observational and Modelling Study. BMJ 2023, 383, e077784. [Google Scholar] [CrossRef]
  3. EEA Trends in EU Emissions of NH3, NMVOCs, NOx, SO2, Primary PM2.5, Primary PM10, BC and CO, Between 2005 and 2023. Available online: https://www.eea.europa.eu/en/analysis/publications/air-pollution-in-europe-2025-reporting-status-under-the-national-emission-reduction-commitments-directive/trends-in-eu-emissions-of-nh3-nmvocs-nox-so2-primary-pm2-5-primary-pm10-bc-and-co-between-2005-and-2023?activeTab=265e2bee-7de3-46e8-b6ee-76005f3f434f (accessed on 2 July 2025).
  4. Chen, J.; Hoek, G. Long-Term Exposure to PM and All-Cause and Cause-Specific Mortality: A Systematic Review and Meta-Analysis. Environ. Int. 2020, 143, 105974. [Google Scholar] [CrossRef]
  5. Gualtieri, M.; Melzi, G.; Costabile, F.; Stracquadanio, M.; La Torretta, T.; Di Iulio, G.; Petralia, E.; Rinaldi, M.; Paglione, M.; Decesari, S.; et al. On the Dose-Response Association of Fine and Ultrafine Particles in an Urban Atmosphere: Toxicological Outcomes on Bronchial Cells at Realistic Doses of Exposure at the Air Liquid Interface. Chemosphere 2024, 366, 143417. [Google Scholar] [CrossRef]
  6. Santoro, M.; Costabile, F.; Gualtieri, M.; Rinaldi, M.; Paglione, M.; Busetto, M.; Di Iulio, G.; Di Liberto, L.; Gherardi, M.; Pelliccioni, A.; et al. Associations between Fine Particulate Matter, Gene Expression, and Promoter Methylation in Human Bronchial Epithelial Cells Exposed within a Classroom under Air-Liquid Interface. Environ. Pollut. 2024, 358, 124471. [Google Scholar] [CrossRef] [PubMed]
  7. Costabile, F.; Gualtieri, M.; Rinaldi, M.; Canepari, S.; Vecchi, R.; Massimi, L.; Di Iulio, G.; Paglione, M.; Di Liberto, L.; Corsini, E.; et al. Exposure to Urban Nanoparticles at Low PM 1 Concentrations as a Source of Oxidative Stress and Inflammation. Sci. Rep. 2023, 13, 18616. [Google Scholar] [CrossRef] [PubMed]
  8. Weichenthal, S.; Christidis, T.; Olaniyan, T.; van Donkelaar, A.; Martin, R.; Tjepkema, M.; Burnett, R.T.; Brauer, M. Epidemiological Studies Likely Need to Consider PM2.5 Composition Even If Total Outdoor PM2.5 Mass Concentration Is the Exposure of Interest. Environ. Epidemiol. 2024, 8, e317. [Google Scholar] [CrossRef]
  9. Boogaard, H.; Crouse, D.L.; Tanner, E.; Mantus, E.; van Erp, A.M.; Vedal, S.; Samet, J. Assessing Adverse Health Effects of Long-Term Exposure to Low Levels of Ambient Air Pollution: The HEI Experience and What’s Next? Environ. Sci. Technol. 2024, 58, 12767–12783. [Google Scholar] [CrossRef]
  10. Cop28. Available online: https://www.cop28.com/en/ (accessed on 2 July 2025).
  11. Pöschl, U. Atmospheric Aerosols: Composition, Transformation, Climate and Health Effects. Angew. Chem. Int. Ed. 2005, 44, 7520–7540. [Google Scholar] [CrossRef]
  12. Rockström, J.; Gupta, J.; Qin, D.; Lade, S.J.; Abrams, J.F.; Andersen, L.S.; Armstrong McKay, D.I.; Bai, X.; Bala, G.; Bunn, S.E.; et al. Safe and Just Earth System Boundaries. Nature 2023, 619, 102–111. [Google Scholar] [CrossRef] [PubMed]
  13. Pörtner, H.O.; Scholes, R.J.; Arneth, A.; Barnes, D.K.A.; Burrows, M.T.; Diamond, S.E.; Duarte, C.M.; Kiessling, W.; Leadley, P.; Managi, S.; et al. Overcoming the Coupled Climate and Biodiversity Crises and Their Societal Impacts. Science 2023, 380, eabl4881. [Google Scholar] [CrossRef]
  14. Cena, H.; Labra, M. Biodiversity and Planetary Health: A Call for Integrated Action. The Lancet 2024, 403, 1985–1986. [Google Scholar] [CrossRef] [PubMed]
  15. Bai, X.; Bjørn, A.; Kılkış, Ş.; Sabag Muñoz, O.; Whiteman, G.; Hoff, H.; Seaby Andersen, L.; Rockström, J. How to Stop Cities and Companies Causing Planetary Harm. Nature 2022, 609, 463–466. [Google Scholar] [CrossRef]
  16. Münzel, T.; Sørensen, M.; Hahad, O.; Nieuwenhuijsen, M.; Daiber, A. The Contribution of the Exposome to the Burden of Cardiovascular Disease. Nat. Rev. Cardiol. 2023, 20, 651–669. [Google Scholar] [CrossRef] [PubMed]
  17. Vermeulen, R.; Schymanski, E.L.; Barabási, A.-L.; Miller, G.W. The Exposome and Health: Where Chemistry Meets Biology. Science 2020, 367, 392–396. [Google Scholar] [CrossRef]
  18. Hong, S.; Hui, E.C.M.; Lin, Y. Relationship between Urban Spatial Structure and Carbon Emissions: A Literature Review. Ecol. Indic. 2022, 144, 109456. [Google Scholar] [CrossRef]
  19. Giammona, A.; Remedia, S.; Porro, D.; Lo Dico, A.; Bertoli, G. The Biological Interplay between Air Pollutants and MiRNAs Regulation in Cancer. Front. Cell Dev. Biol. 2024, 12, 1343385. [Google Scholar] [CrossRef]
  20. Vriens, A.; Nawrot, T.S.; Saenen, N.D.; Provost, E.B.; Kicinski, M.; Lefebvre, W.; Vanpoucke, C.; Van Deun, J.; De Wever, O.; Vrijens, K.; et al. Recent Exposure to Ultrafine Particles in School Children Alters MIR-222 Expression in the Extracellular Fraction of Saliva. Environ. Health 2016, 15, 80. [Google Scholar] [CrossRef]
  21. Dennis, K.K.; Marder, E.; Balshaw, D.M.; Cui, Y.; Lynes, M.A.; Patti, G.J.; Rappaport, S.M.; Shaughnessy, D.T.; Vrijheid, M.; Barr, D.B. Biomonitoring in the Era of the Exposome. Environ. Health Perspect. 2017, 125, 502–510. [Google Scholar] [CrossRef]
  22. Demetriou, C.; Vineis, P. Biomarkers and Omics of Health Effects Associated with Traffic-Related Air Pollution. In Traffic-Related Air Pollution; Elsevier: Amsterdam, The Netherlands, 2020; pp. 281–309. ISBN 9780128181225. [Google Scholar]
  23. Lloyd-Price, J.; Arze, C.; Ananthakrishnan, A.N.; Schirmer, M.; Avila-Pacheco, J.; Poon, T.W.; Andrews, E.; Ajami, N.J.; Bonham, K.S.; Brislawn, C.J.; et al. Multi-Omics of the Gut Microbial Ecosystem in Inflammatory Bowel Diseases. Nature 2019, 569, 655–662. [Google Scholar] [CrossRef]
  24. Hajiagha, M.N.; Taghizadeh, S.; Asgharzadeh, M.; Dao, S.; Ganbarov, K.; Köse, Ş.; Kafil, H.S. Gut Microbiota and Human Body Interactions; Its Impact on Health: A Review. Curr. Pharm. Biotechnol. 2022, 23, 4–14. [Google Scholar] [CrossRef] [PubMed]
  25. Corada, K.; Woodward, H.; Alaraj, H.; Collins, C.M.; de Nazelle, A. A Systematic Review of the Leaf Traits Considered to Contribute to Removal of Airborne Particulate Matter Pollution in Urban Areas. Environ. Pollut. 2021, 269, 116104. [Google Scholar] [CrossRef]
  26. Fusaro, L.; Nardella, L.; Manes, F.; Sebastiani, A.; Fares, S. Supply and Demand Mismatch Analysis to Improve Regulating Ecosystem Services in Mediterranean Urban Areas: Insights from Four Italian Municipalities. Ecol. Indic. 2023, 155, 110928. [Google Scholar] [CrossRef]
  27. Sharma, P.; Saxena, P. Impacts and Responses of Particulate Matter Pollution on Vegetation. In Airborne Particulate Matter: Source, Chemistry and Health; Sonwani, S., Shukla, A., Eds.; Springer Nature Singapore: Singapore, 2022; pp. 229–264. ISBN 978-981-16-5387-2. [Google Scholar]
  28. Popek, R.; Przybysz, A.; Gawrońska, H.; Klamkowski, K.; Gawroński, S.W. Impact of Particulate Matter Accumulation on the Photosynthetic Apparatus of Roadside Woody Plants Growing in the Urban Conditions. Ecotoxicol. Environ. Saf. 2018, 163, 56–62. [Google Scholar] [CrossRef]
  29. Maronga, B.; Banzhaf, S.; Burmeister, C.; Esch, T.; Forkel, R.; Fröhlich, D.; Fuka, V.; Gehrke, K.F.; Geletič, J.; Giersch, S.; et al. Overview of the PALM Model System 6.0. Geosci. Model Dev. 2020, 13, 1335–1372. [Google Scholar] [CrossRef]
  30. Davolio, S.; Malguzzi, P.; Drofa, O.; Mastrangelo, D.; Buzzi, A. The Piedmont Flood of November 1994: A Testbed of Forecasting Capabilities of the CNR-ISAC Meteorological Model Suite. Bull. Atmos. Sci. Technol. 2020, 1, 263–282. [Google Scholar] [CrossRef]
  31. Wiedensohler, A.; Wiesner, A.; Weinhold, K.; Birmili, W.; Hermann, M.; Merkel, M.; Müller, T.; Pfeifer, S.; Schmidt, A.; Tuch, T.; et al. Mobility Particle Size Spectrometers: Calibration Procedures and Measurement Uncertainties. Aerosol Sci. Technol. 2018, 52, 146–164. [Google Scholar] [CrossRef]
  32. Hinds, W.C. Aerosol Tecnology, 2nd ed.; John Wiley & Sons: Hoboken, NJ, USA, 1999; ISBN 0-471-19410-7. [Google Scholar]
  33. Ng, N.L.; Herndon, S.C.; Trimborn, A.; Canagaratna, M.R.; Croteau, P.L.; Onasch, T.B.; Sueper, D.; Worsnop, D.R.; Zhang, Q.; Sun, Y.L.; et al. An Aerosol Chemical Speciation Monitor (ACSM) for Routine Monitoring of the Composition and Mass Concentrations of Ambient Aerosol. Aerosol Sci. Technol. 2011, 45, 780–794. [Google Scholar] [CrossRef]
  34. Freney, E.; Zhang, Y.; Croteau, P.; Amodeo, T.; Williams, L.; Truong, F.; Petit, J.-E.; Sciare, J.; Sarda-Esteve, R.; Bonnaire, N.; et al. The Second ACTRIS Inter-Comparison (2016) for Aerosol Chemical Speciation Monitors (ACSM): Calibration Protocols and Instrument Performance Evaluations. Aerosol Sci. Technol. 2019, 53, 830–842. [Google Scholar] [CrossRef]
  35. Petzold, A.; Ogren, J.A.; Fiebig, M.; Laj, P.; Li, S.-M.; Baltensperger, U.; Holzer-Popp, T.; Kinne, S.; Pappalardo, G.; Sugimoto, N.; et al. Recommendations for Reporting “Black Carbon” Measurements. Atmos. Chem. Phys. 2013, 13, 8365–8379. [Google Scholar] [CrossRef]
  36. Sandradewi, J.; Prévôt, A.S.H.; Weingartner, E.; Schmidhauser, R.; Gysel, M.; Baltensperger, U. A Study of Wood Burning and Traffic Aerosols in an Alpine Valley Using a Multi-Wavelength Aethalometer. Atmos. Environ. 2008, 42, 101–112. [Google Scholar] [CrossRef]
  37. Peng, J.; Hu, M.; Guo, S.; Du, Z.; Zheng, J.; Shang, D.; Zamora, M.L.; Zeng, L.; Shao, M.; Wu, Y.S.; et al. Markedly Enhanced Absorption and Direct Radiative Forcing of Black Carbon under Polluted Urban Environments. Proc. Natl. Acad. Sci. USA 2016, 113, 4266–4271. [Google Scholar] [CrossRef]
  38. Wang, F.; Carmichael, G.R.; Wang, J.; Chen, B.; Huang, B.; Li, Y.; Yang, Y.; Gao, M. Circulation-Regulated Impacts of Aerosol Pollution on Urban Heat Island in Beijing. Atmos. Chem. Phys. 2022, 22, 13341–13353. [Google Scholar] [CrossRef]
  39. Schatz, J.; Kucharik, C.J. Urban Climate Effects on Extreme Temperatures in Madison, Wisconsin, USA. Environ. Res. Lett. 2015, 10, 094024. [Google Scholar] [CrossRef]
  40. Cecilia, A.; Casasanta, G.; Petenko, I.; Conidi, A.; Argentini, S. Measuring the Urban Heat Island of Rome through a Dense Weather Station Network and Remote Sensing Imperviousness Data. Urban Clim. 2023, 47, 101355. [Google Scholar] [CrossRef]
  41. Manninen, A.J.; Marke, T.; Tuononen, M.; O’Connor, E.J. Atmospheric Boundary Layer Classification With Doppler Lidar. J. Geophys. Res. Atmos. 2018, 123, 8172–8189. [Google Scholar] [CrossRef]
  42. Massimi, L.; Ristorini, M.; Simonetti, G.; Frezzini, M.A.; Astolfi, M.L.; Canepari, S. Spatial Mapping and Size Distribution of Oxidative Potential of Particulate Matter Released by Spatially Disaggregated Sources. Environ. Pollut. 2020, 266, 115271. [Google Scholar] [CrossRef]
  43. Canepari, S.; Pietrodangelo, A.; Perrino, C.; Astolfi, M.L.; Marzo, M.L. Enhancement of Source Traceability of Atmospheric PM by Elemental Chemical Fractionation. Atmos. Environ. 2009, 43, 4754–4765. [Google Scholar] [CrossRef]
  44. Heavens, D.; Chooneea, D.; Giolai, M.; Cuber, P.; Aanstad, P.; Martin, S.; Alston, M.; Misra, R.; Clark, M.D.; Leggett, R.M. How Low Can You Go? Driving down the DNA Input Requirements for Nanopore Sequencing. bioRxiv 2021. [Google Scholar] [CrossRef]
  45. Leggett, R.M.; Alcon-Giner, C.; Heavens, D.; Caim, S.; Brook, T.C.; Kujawska, M.; Martin, S.; Peel, N.; Acford-Palmer, H.; Hoyles, L.; et al. Rapid MinION Profiling of Preterm Microbiota and Antimicrobial-Resistant Pathogens. Nat. Microbiol. 2020, 5, 430–442. [Google Scholar] [CrossRef]
  46. Peel, N.; Martin, S.; Heavens, D.; Yu, D.W.; Clark, M.D.; Leggett, R.M. MARTi: A Real-Time Analysis and Visualisation Tool for Nanopore Metagenomics. bioRxiv 2025. [Google Scholar] [CrossRef]
  47. Orsini, D.A.; Ma, Y.; Sullivan, A.; Sierau, B.; Baumann, K.; Weber, R.J. Refinements to the Particle-into-Liquid Sampler (PILS) for Ground and Airborne Measurements of Water Soluble Aerosol Composition. Atmos. Environ. 2003, 37, 1243–1259. [Google Scholar] [CrossRef]
  48. Di Iulio, G.; Gualtieri, M.; Rinaldi, M.; Paglione, M.; Canepari, S.; Massimi, L.; Frezzini, M.A.; Pasqualini, F.; Sirignano, C.; Costabile, F. Association of PILS-Based and Filter-Based Particle-Bound Reactive Oxygen Species with Urban Nanoparticles, Secondary Organic Aerosols, and in-Vitro Oxidative Responses. Environ. Pollut. 2025, 385, 126874. [Google Scholar] [CrossRef]
  49. Sorooshian, A.; Brechtel, F.J.; Ma, Y.; Weber, R.J.; Corless, A.; Flagan, R.C.; Seinfeld, J.H. Modeling and Characterization of a Particle-into-Liquid Sampler (PILS). Aerosol Sci. Technol. 2006, 40, 396–409. [Google Scholar] [CrossRef]
  50. Gao, D.; Fang, T.; Verma, V.; Zeng, L.; Weber, R.J. A Method for Measuring Total Aerosol Oxidative Potential (OP) with the Dithiothreitol (DTT) Assay and Comparisons between an Urban and Roadside Site of Water-Soluble and Total OP. Atmos. Meas. Tech. 2017, 10, 2821–2835. [Google Scholar] [CrossRef]
  51. Giammona, A.; Gervasoni, C.; Di Iulio, G.; Sirignano, C.; Listrani, S.; Rinaldi, M.; Canepari, S.; Lo Dico, A.; Costabile, F.; Bertoli, G. Short-Term Exposure of Human Bronchial Epithelial Cell Lines to the “Oxidant” Urban Air Pollution. Environ. Toxicol. Pharmacol. 2025. under review. [Google Scholar]
  52. Filardo, S.; Scalese, G.; Virili, C.; Pontone, S.; Di Pietro, M.; Covelli, A.; Bedetti, G.; Marinelli, P.; Bruno, G.; Stramazzo, I.; et al. The Potential Role of Hypochlorhydria in the Development of Duodenal Dysbiosis: A Preliminary Report. Front. Cell. Infect. Microbiol. 2022, 12, 854904. [Google Scholar] [CrossRef]
  53. Alessio, M.; Anselmi, S.; Conforto, L.; Improta, S.; Manes, F.; Manfra, L. Radiocarbon as a Biomarker of Urban Pollution in Leaves of Evergreen Species Sampled in Rome and in Rural Areas (Lazio—Central Italy). Atmos. Environ. 2002, 36, 5405–5416. [Google Scholar] [CrossRef]
  54. Fusaro, L.; Salvatori, E.; Winkler, A.; Frezzini, M.A.; De Santis, E.; Sagnotti, L.; Canepari, S.; Manes, F. Urban Trees for Biomonitoring Atmospheric Particulate Matter: An Integrated Approach Combining Plant Functional Traits, Magnetic and Chemical Properties. Ecol. Indic. 2021, 126, 107707. [Google Scholar] [CrossRef]
  55. Strasser, R.J.; Tsimilli-Michael, M.; Qiang, S.; Goltsev, V. Simultaneous in Vivo Recording of Prompt and Delayed Fluorescence and 820-Nm Reflection Changes during Drying and after Rehydration of the Resurrection Plant Haberlea Rhodopensis. Biochim. Biophys. Acta (BBA) Bioenerg. 2010, 1797, 1313–1326. [Google Scholar] [CrossRef]
  56. Struckmeier, C.; Drewnick, F.; Fachinger, F.; Paolo Gobbi, G.; Borrmann, S. Atmospheric aerosols in Rome, Italy: Sources, dynamics and spatial variations during two seasons. Atmos. Chem. Phys. 2016, 16, 15277–15299. [Google Scholar] [CrossRef]
  57. EEA Air Quality Statistics. Available online: https://www.eea.europa.eu/en/analysis/maps-and-charts/air-quality-statistics-dashboards (accessed on 19 February 2025).
  58. Kotthaus, S.; Bravo-Aranda, J.A.; Collaud Coen, M.; Guerrero-Rascado, J.L.; Costa, M.J.; Cimini, D.; O’Connor, E.J.; Hervo, M.; Alados-Arboledas, L.; Jiménez-Portaz, M.; et al. Atmospheric Boundary Layer Height from Ground-Based Remote Sensing: A Review of Capabilities and Limitations. Atmos. Meas. Tech. 2023, 16, 433–479. [Google Scholar] [CrossRef]
  59. Shrestha, B.; Brotzge, J.A.; Wang, J. Observations and Impacts of Long-Range Transported Wildfire Smoke on Air Quality Across New York State During July 2021. Geophys. Res. Lett. 2022, 49, e2022GL100216. [Google Scholar] [CrossRef]
  60. Santinami, E.; Alberti, T.; Casasanta, G.; Costabile, F.; Di Iulio, G.; Reda, R.; Giovannelli, L. A Novel Methodological Approach Using EMD for a Multi-Scale Analysis on Black Carbon Aerosols and Urban Heat Island. Atmos. Meas. Tech. 2025. submitted. [Google Scholar]
  61. Xin, X.; Gong, T.; Hong, Y. Hydrogen Peroxide Initiates Oxidative Stress and Proteomic Alterations in Meningothelial Cells. Sci Rep 2022, 12, 14519. [Google Scholar] [CrossRef] [PubMed]
  62. Shokolenko, I.N.; Wilson, G.L.; Alexeyev, M.F. The “Fast” and the “Slow” Modes of Mitochondrial DNA Degradation. Mitochondrial DNA Part A 2016, 27, 490–498. [Google Scholar] [CrossRef] [PubMed]
  63. Pollastrini, M.; Salvatori, E.; Fusaro, L.; Manes, F.; Marzuoli, R.; Gerosa, G.; Brüggemann, W.; Strasser, R.J.; Bussotti, F. Selection of Tree Species for Forests under Climate Change: Is PSI Functioning a Better Predictor for Net Photosynthesis and Growth than PSII? Tree Physiol. 2020, 40, 1561–1571. [Google Scholar] [CrossRef]
  64. Salvatori, E.; Fusaro, L.; Mereu, S.; Bernardini, A.; Puppi, G.; Manes, F. Different O3 Response of Sensitive and Resistant Snap Bean Genotypes (Phaseolus vulgaris L.): The Key Role of Growth Stage, Stomatal Conductance, and PSI Activity. Environ. Exp. Bot. 2013, 87, 79–91. [Google Scholar] [CrossRef]
  65. Joliot, P.; Johnson, G.N. Regulation of Cyclic and Linear Electron Flow in Higher Plants. Proc. Natl. Acad. Sci. USA 2011, 108, 13317–13322. [Google Scholar] [CrossRef]
  66. García-Caparrós, P.; De Filippis, L.; Gul, A.; Hasanuzzaman, M.; Ozturk, M.; Altay, V.; Lao, M.T. Oxidative Stress and Antioxidant Metabolism under Adverse Environmental Conditions: A Review. Bot. Rev. 2021, 87, 421–466. [Google Scholar] [CrossRef]
  67. Húdoková, H.; Petrik, P.; Petek-Petrik, A.; Konôpková, A.; Leštianska, A.; Střelcová, K.; Kmeť, J.; Kurjak, D. Heat-Stress Response of Photosystem II in Five Ecologically Important Tree Species of European Temperate Forests. Biologia 2022, 77, 671–680. [Google Scholar] [CrossRef]
  68. Costabile, F.; Gualtieri, M.; Canepari, S.; Tranfo, G.; Consales, C.; Grollino, M.G.; Paci, E.; Petralia, E.; Pigini, D.; Simonetti, G. Evidence of Association between Aerosol Properties and In-Vitro Cellular Oxidative Response to PM1, Oxidative Potential of PM2.5, a Biomarker of RNA Oxidation, and Its Dependency on Combustion Sources. Atmos. Environ. 2019, 213, 444–455. [Google Scholar] [CrossRef]
  69. Costabile, F.; Alas, H.; Aufderheide, M.; Avino, P.; Amato, F.; Argentini, S.; Barnaba, F.; Berico, M.; Bernardoni, V.; Biondi, R.; et al. First Results of the “Carbonaceous Aerosol in Rome and Environs (CARE)” Experiment: Beyond Current Standards for PM10. Atmosphere 2017, 8, 249. [Google Scholar] [CrossRef]
  70. Altomare, A.; Del Chierico, F.; Rocchi, G.; Emerenziani, S.; Nuglio, C.; Putignani, L.; Angeletti, S.; Presti, A.L.; Ciccozzi, M.; Russo, A.; et al. Association between Dietary Habits and Fecal Microbiota Composition in Irritable Bowel Syndrome Patients: A Pilot Study. Nutrients 2021, 13, 1479. [Google Scholar] [CrossRef] [PubMed]
  71. Liu, C.X.; Liu, Y.B.; Peng, Y.; Peng, J.; Ma, Q.L. Causal Effect of Air Pollution on the Risk of Cardiovascular and Metabolic Diseases and Potential Mediation by Gut Microbiota. Sci. Total Environ. 2024, 912, 169418. [Google Scholar] [CrossRef]
  72. Sgrigna, G.; Sæbø, A.; Gawronski, S.; Popek, R.; Calfapietra, C. Particulate Matter Deposition on Quercus Ilex Leaves in an Industrial City of Central Italy. Environ. Pollut. 2015, 197, 187–194. [Google Scholar] [CrossRef] [PubMed]
  73. Zhang, S.; Liu, H.; Tang, N.; Zhou, S.; Yu, J.; Ding, B. Spider-Web-Inspired PM0.3 Filters Based on Self-Sustained Electrostatic Nanostructured Networks. Adv. Mater. 2020, 32, e2002361. [Google Scholar] [CrossRef]
  74. Kim, H.; Oh, J.; Lee, H.; Jeong, S.; Ko, S.H. Next-Generation Air Filtration Nanotechnology for Improved Indoor Air Quality. Chem. Commun. 2025, 61, 1322–1341. [Google Scholar] [CrossRef] [PubMed]
  75. Bai, M.; Wang, J.; Zhou, R.; Lu, Z.; Wang, L.; Ning, X. Polyphenylene Sulfide Fabric with Enhanced Oxidation Resistance and Hydrophobicity through Polybenzoxazine Surface Coating for Emission Control in Harsh Environment. J. Hazard. Mater. 2022, 432, 128735. [Google Scholar] [CrossRef]
  76. Memon, R.A.; Leung, D.Y.C. On the Heating Environment in Street Canyon. Environ. Fluid Mech. 2011, 11, 465–480. [Google Scholar] [CrossRef]
  77. Rai, P.K. Impacts of Particulate Matter Pollution on Plants: Implications for Environmental Biomonitoring. Ecotoxicol. Environ. Saf. 2016, 129, 120–136. [Google Scholar] [CrossRef]
  78. Levy, J.I.; Buonocore, J.J.; von Stackelberg, K. Evaluation of the Public Health Impacts of Traffic Congestion: A Health Risk Assessment. Environ. Health 2010, 9, 65. [Google Scholar] [CrossRef] [PubMed]
  79. Liu, Y.; Chen, H.; Jiang, L.; Li, T.; Guo, J.; Wei, T.; Crowther, R. Environmental and Health Impacts of Banning Passenger Cars with Internal Combustion Engines: A Case Study of Leeds, UK. Transp. Res. D Transp. Environ. 2024, 134, 104343. [Google Scholar] [CrossRef]
Figure 1. A conceptual model for assessing urban health, the Rome NBFC experiment.
Atmosphere 16 01144 g001
Figure 2. Measurement sites. (a) The study area is in Rome, Italy, and encompasses three main locations: the urban forest site, Villa Ada; the urban background site, Sapienza; and the suburban background site, located at Campus Bio-Medico. A subset of the 140 participants from the IBD/IBS cohort is represented as human icons on the map, serving as an example. (b) View centered on Villa Ada site, inside a 2 × 2 km cell grid.
Atmosphere 16 01144 g002
Figure 3. Schematic representations of the three simulation scenarios: (a) Scenario 1, with current tree cover under heatwave conditions and stagnant air flow; (b) Scenario 2, same meteorological forcing as (a), but with trees replaced by short grass; (c) Scenario 3, same vegetation as (a), but under enhanced ventilation conditions following a rainfall episode. White arrows represent idealized wind circulation over the park.
Atmosphere 16 01144 g003
Figure 4. Seasonal wind roses for the Villa Ada Park site (Rome), based on hourly wind direction and speed data from July 2020 to July 2024. The roses display the percentage frequency of winds by direction and speed class (colors), with concentric circles at 5% intervals up to 20%. Seasonal mean wind speeds are indicated in green within each panel. In all seasons, the percentage of calm conditions was zero.
Atmosphere 16 01144 g004
Figure 5. Spatial distribution of normalized PM2.5 concentration (left column), zonal wind component u (center column), and meridional wind component v (right column) at 13:00 UTC and 75 m above sea level, for the three simulated scenarios: (first row: (ac)) Scenario 1; (second row: (df)) Scenario 2; (third row: (gi)) Scenario 3. For a better comparison, PM2.5 concentrations are normalized by their respective maximum.
Atmosphere 16 01144 g005
Figure 6. Vertical profiles of attenuated backscatter coefficient (top) and vertical Doppler velocity (bottom) measured by the Doppler Wind Lidar at Villa Ada Park from 8 to 10 May 2025.
Atmosphere 16 01144 g006
Figure 7. Time–height plots of horizontal wind speed (top) and wind direction (bottom) from the Doppler Wind Lidar at Villa Ada Park (Rome), from 8 to 10 May 2025.
Atmosphere 16 01144 g007
Figure 8. Seasonal polar plots of mean eBCff and eBCbb concentrations (µg/m3). Top row: eBCff; bottom row: eBCbb. Each subplot represents a typical working day (weekday) or weekend for every season, with wind direction indicated radially and the mean concentration per hour of the day. The color scale denotes the mean concentration levels from low (blue) to high (red), highlighting seasonal, directional, and weekly variability in BC sources.
Atmosphere 16 01144 g008
Figure 9. The diurnal cycle (separately for weekdays and weekends) of the eBC measured in spring 2022: (A) at the urban forest site, Villa Ada; (B) at the urban site, Sapienza, both outdoors (BCout) and indoors (BCin).
Atmosphere 16 01144 g009
Figure 10. Scatter plot of the eBCff (BC fossil fuel) versus the urban heat island (UHI) observed during the morning rush hour (h 6:00–10:00) at the urban forest site, Villa Ada.
Atmosphere 16 01144 g010
Figure 11. Time series of total particle number concentration measured by the condensation particle counter (CPC) at Villa Ada Park from 8 to 10 May 2025.
Atmosphere 16 01144 g011
Figure 12. Temporal trend of PB-ROS for two winter days (23 and 24 January 2025). The blue line represents volume-normalized data, and the red line represents mass-normalized data.
Atmosphere 16 01144 g012
Figure 13. Evaluation of the effects of particulate matter exposure on human bronchial epithelial BEAS-2B cells. (A) Experimental design: exposed filter (EF) portions (6 mm diameter) were incubated in culture medium without FBS for 30 min with gentle shaking to allow soluble traffic-related air pollutants (TRAPs) to reach the medium. Blank (unexposed) filters (BF) were used as controls. BEAS-2B were treated with BF or EF media and checked for cell viability (by MTT assay) as well as for cell morphology (by phase contrast microscopy). (B) Evaluation of TRAPs exposure effects on BEAS-2B cell viability. Cells treated with media obtained from 1, 2, 3, or 4 BF/EF filter portions (indicated as BF/EF1, BF/EF2, BF/EF3, and BF/EF4) were subjected to MTT assay, and cell viability was expressed as relative cell survival with respect to untreated cells. The mean value ± standard deviation (SD) was obtained from three independent experiments, each performed in triplicate. ***, p < 0.0005 vs. UNTR. (C) Representative phase contrast images of BEAS-2B cells untreated (UNTR) or treated for 4 h with BF1/EF1 or BF3/EF3. (D) Evaluation of TRAPs exposure effects on morphological characteristics in BEAS-2B cells. Representative phase contrast images of cells untreated (UNTR) or treated with BF1 or EF1. Arrows indicate detaching, round-shaped cells; arrowheads indicate shrunken, elongated cells.
Atmosphere 16 01144 g013
Figure 14. AG/CG: Inflammatory and oxidative gene expression related to exposure days on the BEAS cell model. (A) Model for exposure of BEAS-2B cell lines to PM filters. Representative images of the filter in the upper chamber (left panel) and of live BEAS cell lines in the lower chamber of the Transwell system (right panel). (B) The expression of inflammation genes (NF-kB, HIF1a, TNFa) and oxidative genes (CAT1, SOD1, NRF2, GPX4, and HMOX) related to the six cell exposure days along two early (5–10 min) and 1 late (60 min) soaking time points. (C) Air pollution miRNA expression related to exposure days.
Atmosphere 16 01144 g014
Figure 15. Alpha-diversity of microbial communities in the gut microbiota of adult individuals living in rural, suburban, and urban environments. Faith’s phylogenetic diversity index was used as a measure of alpha-diversity within groups. The circles out of the range represent the outliers.
Atmosphere 16 01144 g015
Figure 16. Relative change of (a) JIP-test parameters derived from fast fluorescent transients and (b) reflectance indices measured at leaf level of the studied species Q. ilex (Qi) and L. nobilis (Ln). The values are expressed as the ratio between trees located in the inner part of the urban park, considered as control under the assumption of higher air quality, and trees located in the vicinity of the road via Salaria (Rome, Italy), characterized by heavy car traffic. The red symbols identify the functional traits that changed significantly (p < 0.05) for Qi (°) and Ln (*).
Atmosphere 16 01144 g016
Table 1. The mass concentration of fine particulate matter species (PM2.5, PM1, BC) and gaseous phase (NO2, CO, O3) measured during the last 4 years, in the urban forest. Descriptive statistics include mean, standard deviation (SD), 75th percentile (p75) and 25th percentile (p25).
PollutantSeasonMeanSDp25p75
PM1
(μg/m3)
Spring
(n = 329)
7348
Summer
(n = 353)
5246
Fall
(n = 345)
7258
Winter
(n = 326)
84511
PM2.5
(μg/m3)
Spring
(n = 333)
115714
Summer
(n = 351)
105712
Fall
(n = 348)
114813
Winter
(n = 331)
169923
NO2
(μg/m3)
Spring
(n = 7841)
24151332
Summer
(n = 6259)
19111126
Fall
(n = 7298)
1712823
Winter
(n = 7265)
26141534
CO
(mg/m3)
Spring
(n = 8331)
0.50.20.30.6
Summer
(n = 6528)
0.50.20.40.7
Fall
(n = 7624)
0.40.20.20.5
Winter
(n = 7686)
0.60.30.40.7
O3
(μg/m3)
Spring
(n = 8206)
3432459
Summer
(n = 6568)
42291565
Fall
(n = 7546)
59372487
Winter
(n = 7694)
2121238
Disclaimer/Publisher’s Note: The statements, opinions and data contained in all publications are solely those of the individual author(s) and contributor(s) and not of MDPI and/or the editor(s). MDPI and/or the editor(s) disclaim responsibility for any injury to people or property resulting from any ideas, methods, instructions or products referred to in the content.