Article

Emission Characteristics and Health Risk Assessment of Volatile Organic Compounds in Key Industries: A Case Study in the Central Plains of China

1
Zhejiang Provincial Top Discipline of Biological Engineering (Level A), College of Biological and Environmental Sciences, Zhejiang Wanli University, Ningbo 315100, China
2
Center for Excellence in Regional Atmospheric Environment, Fujian Key Laboratory of Atmospheric Ozone Pollution Prevention, Key Laboratory of Urban Environment and Health, Institute of Urban Environment, Chinese Academy of Sciences, Xiamen 361021, China
3
Zhejiang Key Laboratory of Pollution Control for Port-Petrochemical Industry, Ningbo Key Laboratory of Urban Environmental Pollution and Control, CAS Haixi Industrial Technology Innovation Center in Beilun, Ningbo 315830, China
4
Yindu Branch of the Environmental Protection Bureau of Anyang City, Anyang 455004, China
5
Inner Mongolia Environmental Monitoring Station, Hohhot 010090, China
6
Ningbo Xinrui Zhice Technology Co., Ltd., Ningbo 315800, China
7
Ningxia Huayu Environmental Protection Technology Co., Ltd., Yinchuan 750004, China
*
Authors to whom correspondence should be addressed.
Atmosphere 2025, 16(1), 74; https://doi.org/10.3390/atmos16010074
Submission received: 22 December 2024 / Revised: 6 January 2025 / Accepted: 9 January 2025 / Published: 10 January 2025
(This article belongs to the Section Air Quality and Health)

Abstract

:
Volatile organic compounds (VOCs), the precursors of ozone and fine particulate matter, are one of the atmospheric pollutants harmful to human health. The emission characteristics of VOCs in Anyang, a typical industrial city in the Central Plains of China, are unclear. To determine the emission level and composition of local VOCs, this study conducted on-site sampling of 20 factories in eight key industries. A total of 105 VOC species in seven categories were observed. The concentration of total VOCs emitted from the eight industries in order from large to small was as follows: packaging and printing > pharmaceutical > paint manufacturing > industrial coating > chemical industry > metal smelting > furniture manufacturing > textile printing and dyeing. In addition to industrial coating, the total VOCs and their corresponding ozone formation potential of organized emissions in seven industries (1.44–87.64, 1.52–181.61 mg/m3) were higher than those of unorganized emissions (0.38–24.17, 0.38–125.55 mg/m3). The VOC emissions were concentrated in the central, south-central, and south-eastern parts of the city, mainly from the factories in the packaging and printing, pharmaceutical, paint, and coating industries. The furniture manufacturing (4.55 × 10⁻³) and pharmaceutical (1.66 × 10⁻³) industries in organized emissions were at high risk of carcinogenesis, while the pharmaceutical industry in unorganized emissions (3.61 × 10⁻⁴) was at moderate risk of carcinogenesis. Naphthalene was the main high-risk compound. In terms of non-carcinogenic risk, the packaging and printing industry in organized emissions (228.51) and the metal smelting industry in unorganized emissions (16.16) had the highest risk, and the main high-risk compound was ethyl acetate.

1. Introduction

The northern cities in the Central Plains of China have a number of industrial clusters such as chemical industry, coatings manufacturing, and pharmaceuticals. The expansion of industry fostered local economic growth, but it also resulted in the production of significant industrial pollutants, which severely impacted the local ecological environment. Volatile organic compounds (VOCs) are typical air pollutants released during industrial production [1,2,3,4]. Since 2000, industrial emissions have contributed more than half of the anthropogenic sources of VOCs [5]. Industries like pharmaceuticals [6], packaging [7], and paint manufacturing [8] are the primary sources of VOC emissions. Most VOCs are biologically toxic and can enter the human body via the respiratory system, digestive tract, and skin [9,10]. Short-term exposure to low concentrations of VOCs can lead to symptoms like nausea and headaches, while prolonged exposure to high concentrations may result in serious health risks such as genetic mutations [11,12,13]. In addition, VOCs are prone to photochemical reactions with nitrogen oxides, sulfides, etc. In the atmosphere, VOCs contribute to secondary pollution, including ozone and fine particulate matter, and promote the formation of photochemical smog and haze, further threatening both the atmospheric environment and human health [14,15].
There are multiple kinds of industries in China, resulting in complex VOC components, which have great potential environmental hazards. Since the implementation of the “Air Pollution Prevention and Control Law” in 2015, VOC emission standards for a number of key industries have been issued one after another. However, the research on the in situ monitoring of VOC emissions in specific industries is still limited, particularly data on unorganized VOC emissions that do not pass through exhaust systems, which is even scarcer [16,17]. Therefore, it is necessary to conduct the in situ sampling and analysis of VOCs for local typical industry factories to fully understand their emission characteristics, and also provide scientific data for the precise control of ozone and fine particulate matter. In this study, in situ atmospheric samples were collected from 20 representative factories across eight key industries in Anyang City, located in the Central Plains of China. The emission characteristics of both organized and unorganized VOCs across different industries, as well as their contribution to ozone formation potential (OFP), were analyzed and discussed. To evaluate the impact of local VOCs on other regions, the Hybrid Single-Particle Lagrangian Integrated Trajectory (HYSPLIT) model was used to analyze the forward trajectory of local air masses in four seasons. Finally, the carcinogenic and non-carcinogenic health risks of VOCs were evaluated.

2. Materials and Methods
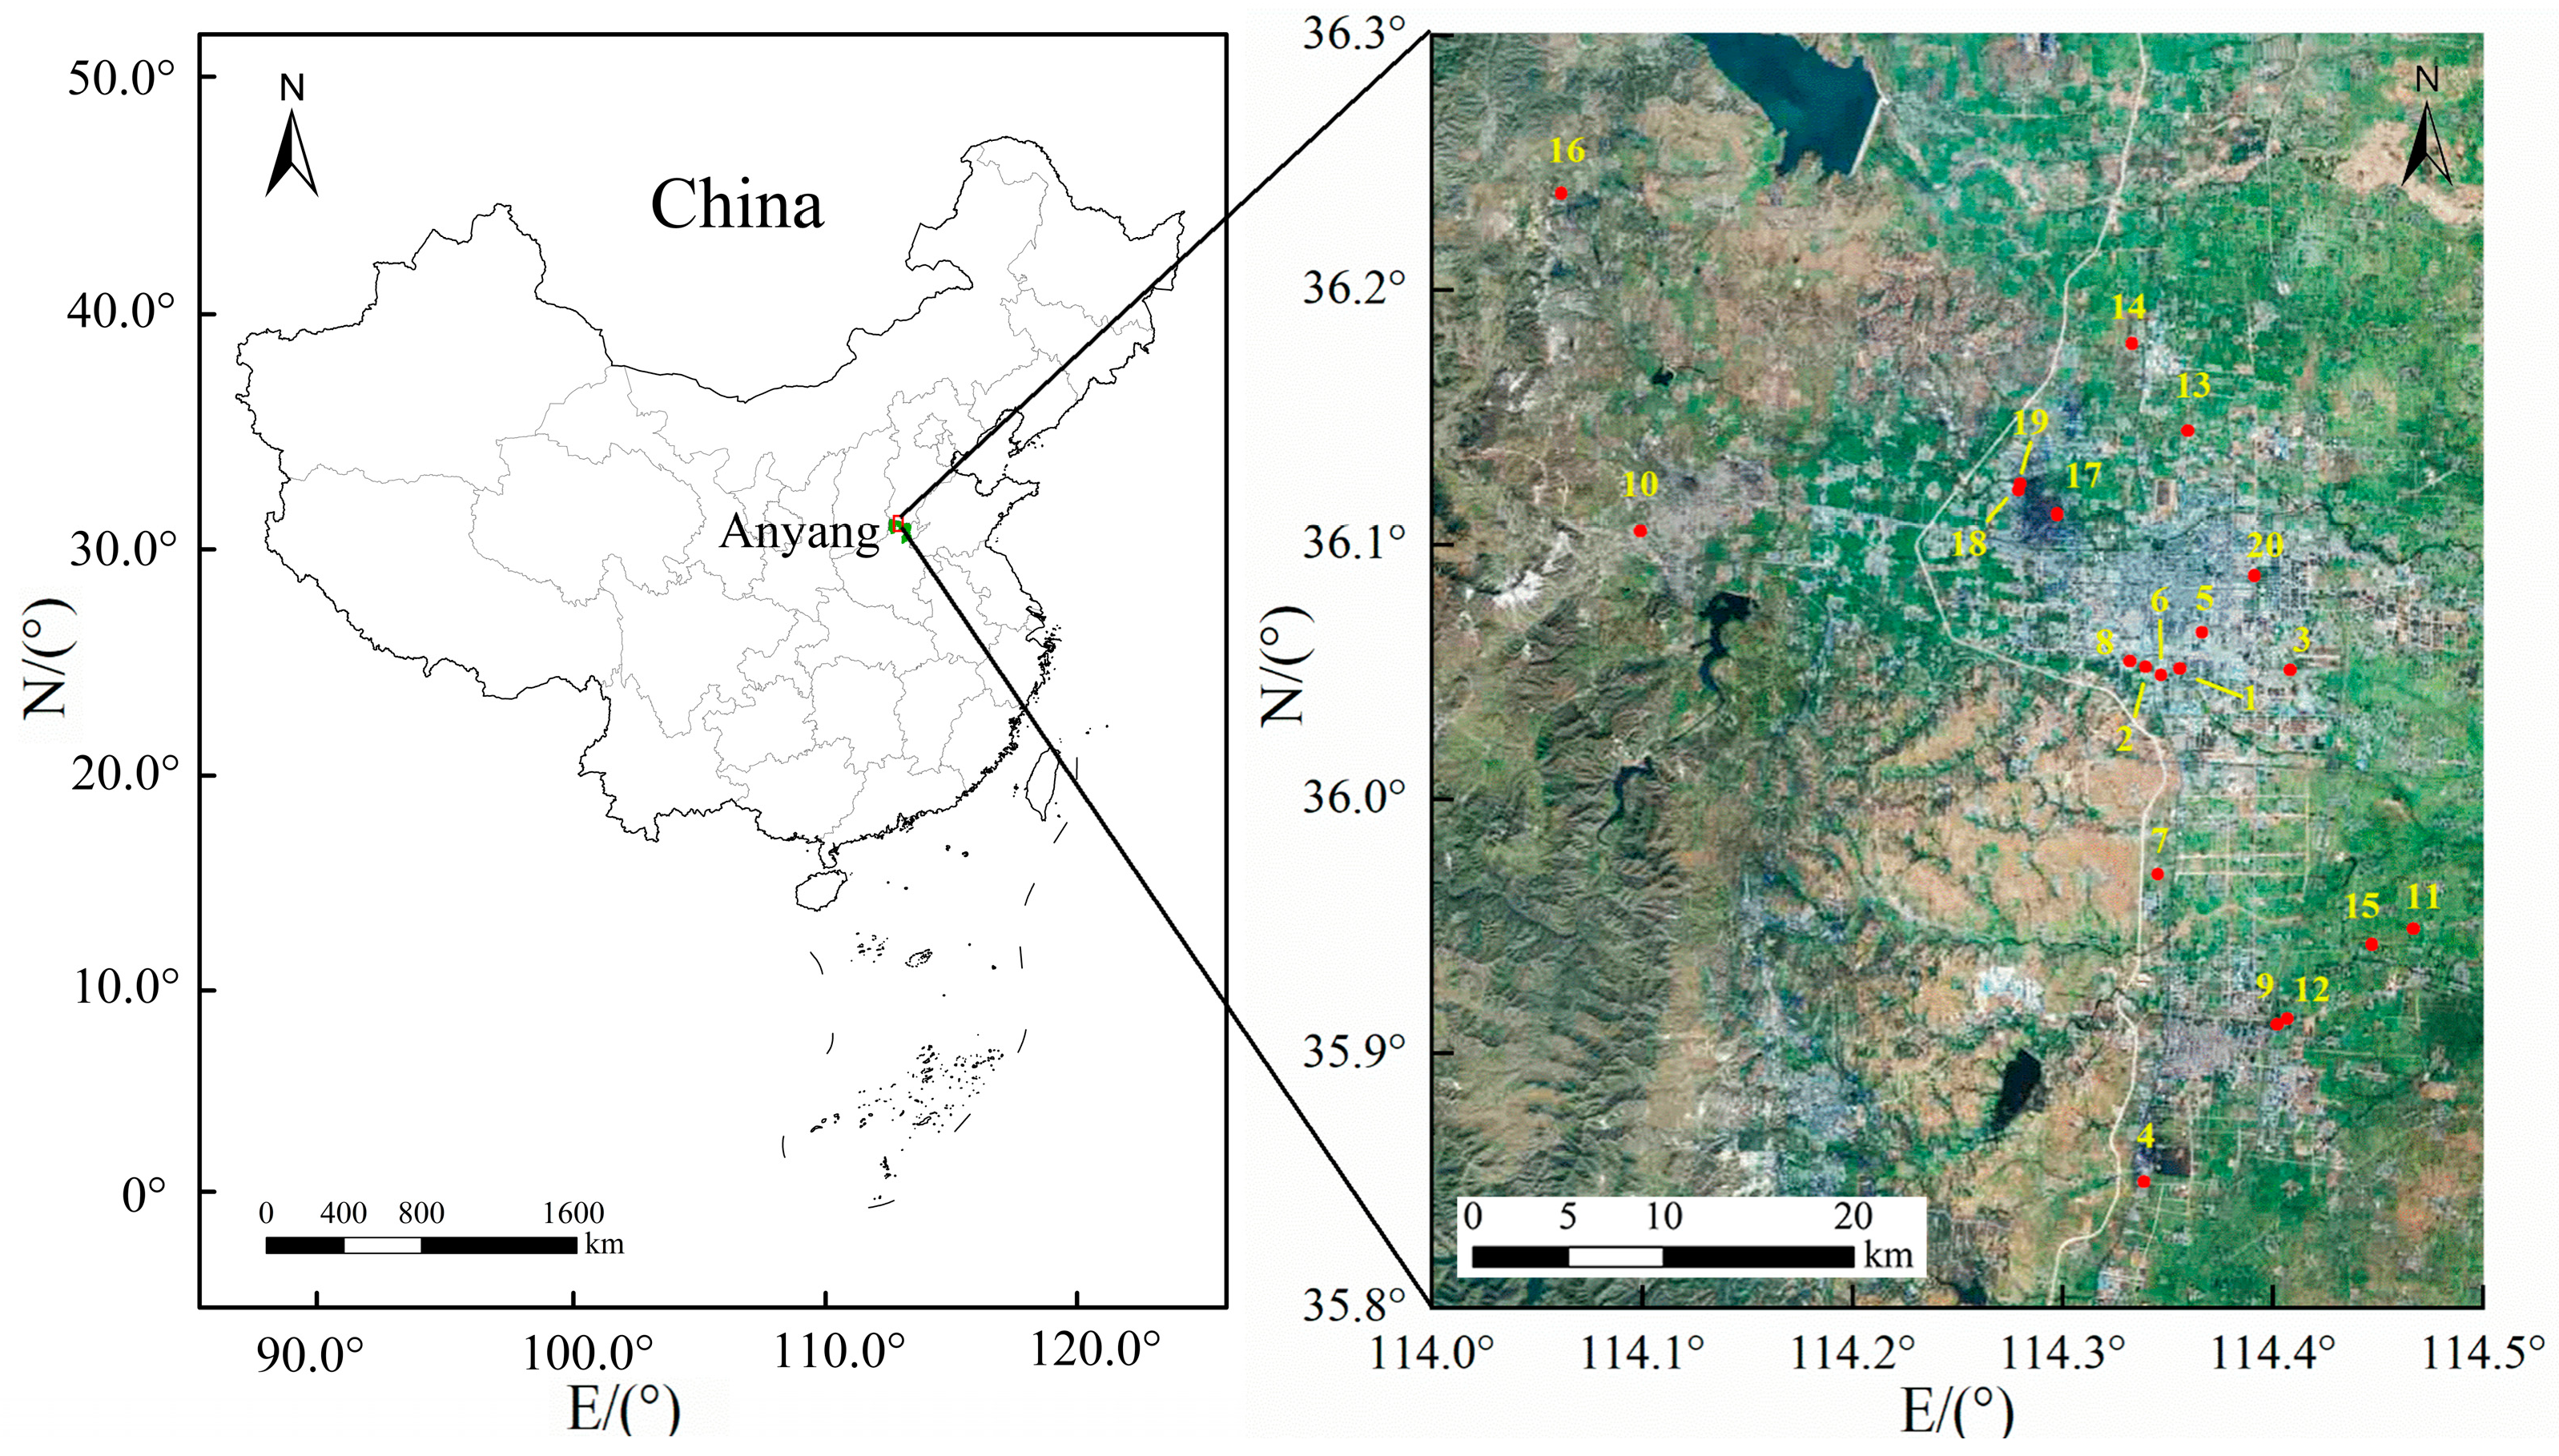
2.1. Study Sites

The study site is located in the northern part of Henan Province, characterized by a terrain that is higher in the west and lower in the east, with a stepped distribution and complex surface morphology. The Taihang Mountains lay in the west of the city, while the central and eastern areas are mainly plains. Situated in the northern warm zone, the region experiences a continental monsoon climate, with an annual average temperature of 14.3 °C. The prevailing winds in Anyang City are east and south winds in spring and summer, and west and north winds in autumn and winter, with an average annual wind speed of 2.2 m/s. The climate is generally favorable, with four distinct seasons, though it is prone to alternating periods of drought and flood, receiving an average of 55% sunshine throughout the year. The terrain makes it difficult for air pollutants to spread to the west, so the VOCs emitted by the industrial areas easily move eastward. At suitable temperatures in spring and summer, VOCs and other pollutants are prone to form photochemical pollution in the air over the central and eastern plains of the city.

2.2. Sample Collection

All the samples were collected at 57 sites (24 organized sites and 33 unorganized sites) of 20 representative factories in the eight industries of chemical industry (CI), metal smelting (MS), textile printing and dyeing (TPD), furniture manufacturing (FM), industrial coating (IC), paint manufacturing (PM), pharmaceutical industry (PI), and packaging and printing (PP) in Anyang City in May 2020 (Figure 1 and Table S1). Airbags made of Teflon material were used to collect air samples at the main exhaust outlet and production workshop of these factories. A total of 105 VOC components were observed, including seven categories: alkanes, alkenes, alkynes, aromatics, halohydrocarbons, oxygenated VOCs (OVOCs), and other VOCs (Table S2).

2.3. VOCs Analysis

This study primarily followed the Technical Requirements for Manual Monitoring of Ozone Precursor Organic Compounds in Ambient Air (Environmental Monitoring Guideline 2018 No. 240) issued by the Ministry of Ecology and Environment of China [18]. The VOC samples were analyzed in the laboratory using pre-concentration–gas chromatography–mass spectrometry/flame ionization (Thermo Fisher Scientific, Waltham, MA, USA). Pre-concentration system: the first-stage cold trap capture temperature was −150 °C, the desorption temperature was 10 °C, the valve temperature was 100 °C, the baking temperature was 150 °C, and the baking time was 15 min; the second-stage cold trap capture temperature was −30 °C, the desorption temperature was 180 °C, the baking temperature was 190 °C, and the baking time was 15 min; and the third-stage focusing temperature was −160 °C, and the desorption time was 2.5 min. Gas chromatography conditions: The injection temperature was set to 140 °C, with a split ratio of 1:10. Chromatography was conducted using a capillary column (DB-5MS, 60 m × 0.25 mm × 1.0 μm), and the carrier gas flow rate was 1.0 mL/min. The heating program started at −50 °C for 7 min, followed by a ramp to 180 °C at 49 °C/min, and then to 220 °C at 15 °C/min for 3 min. Mass spectrometry conditions: The interface temperature was 250 °C, and the ion source temperature was 230 °C. Scanning was performed in the EI mode (segmental scanning), starting at 2 min with a scanning range of 20–42 amu, and from 8.5 min with a scanning range of 35–270 amu [19]. To ensure data quality, a mixture of three different standard gases was used, with calibration performed weekly. The detection limit of VOCs was between 0.008 ppbv and 0.049 ppbv.

2.4. OFP Analysis

OFP was used to characterize the potential of each VOC component to generate ozone [20,21]. The OFP was calculated by multiplying the atmospheric concentration of a VOC by its maximum incremental reactivity (MIR):
O F P i = V O C i × M I R i
where OFPi represents the ozone formation contribution of compound i, mg/m3; VOCi represents the observed concentration of compound i, mg/m3; and MIRi represents the maximum ozone concentration that can be generated by increasing the concentration of VOC compound i per unit [22].

2.5. HYSPLIT Model

The HYSPLIT model is a comprehensive system used to calculate air mass trajectories, atmospheric transport, diffusion, chemical transformation, and deposition. Widely used in atmospheric science, it helps determine the origin of air masses and establish source–receptor relationships through back-trajectory analysis. Additionally, it simulates the transport, diffusion, and deposition of pollutants and hazardous substances. In this study, the model was used to calculate the 24 h forward trajectory of air masses at an altitude of 500 m to study the transmission path of the VOCs emitted from the local industrial factories and their environmental impact on the surrounding areas [23,24].

2.6. Health Risk Analysis

The health risk assessment includes carcinogenic risk (CR) and non-carcinogenic risk (NCR) assessment [25,26]. The calculation methods for the two risk assessments are as follows:
C R i = V O C i × E T × E F × E D × I U R i × 90 % 365 × A T c a × 24
H I i = V O C i × E T × E F × E D × 90 % R f C i × 365 × A T n c a × 24
where CRi is the carcinogenic risk of compound i; HIi is the hazard index of non-carcinogenic risk of compound i; IURi is the unit risk inhalation dose of compound i, m3/μg; RfCi is the chronic risk reference concentration of compound i, μg/m3 (Table S3); ET is the exposure time, 8 h/d; EF is the exposure frequency, 350 d/y; ED is the exposure duration, 24 y; 90% is the absorption rate of air pollutants by the human body; and ATca and ATnca are the carcinogenic and non-carcinogenic risk impact times, 70 y and 24 y, respectively [27]. According to the CR values, the carcinogenic risk can be divided into four levels: high risk (≥10−3), medium risk (10−4–10−3), low risk (10−6–10−4), and negligible risk (<10−6). HI < 1 represents an acceptable non-carcinogenic risk, while HI > 1 represents a high non-carcinogenic risk [28,29].

3. Results and Discussion

3.1. Emission Characteristics of VOCs

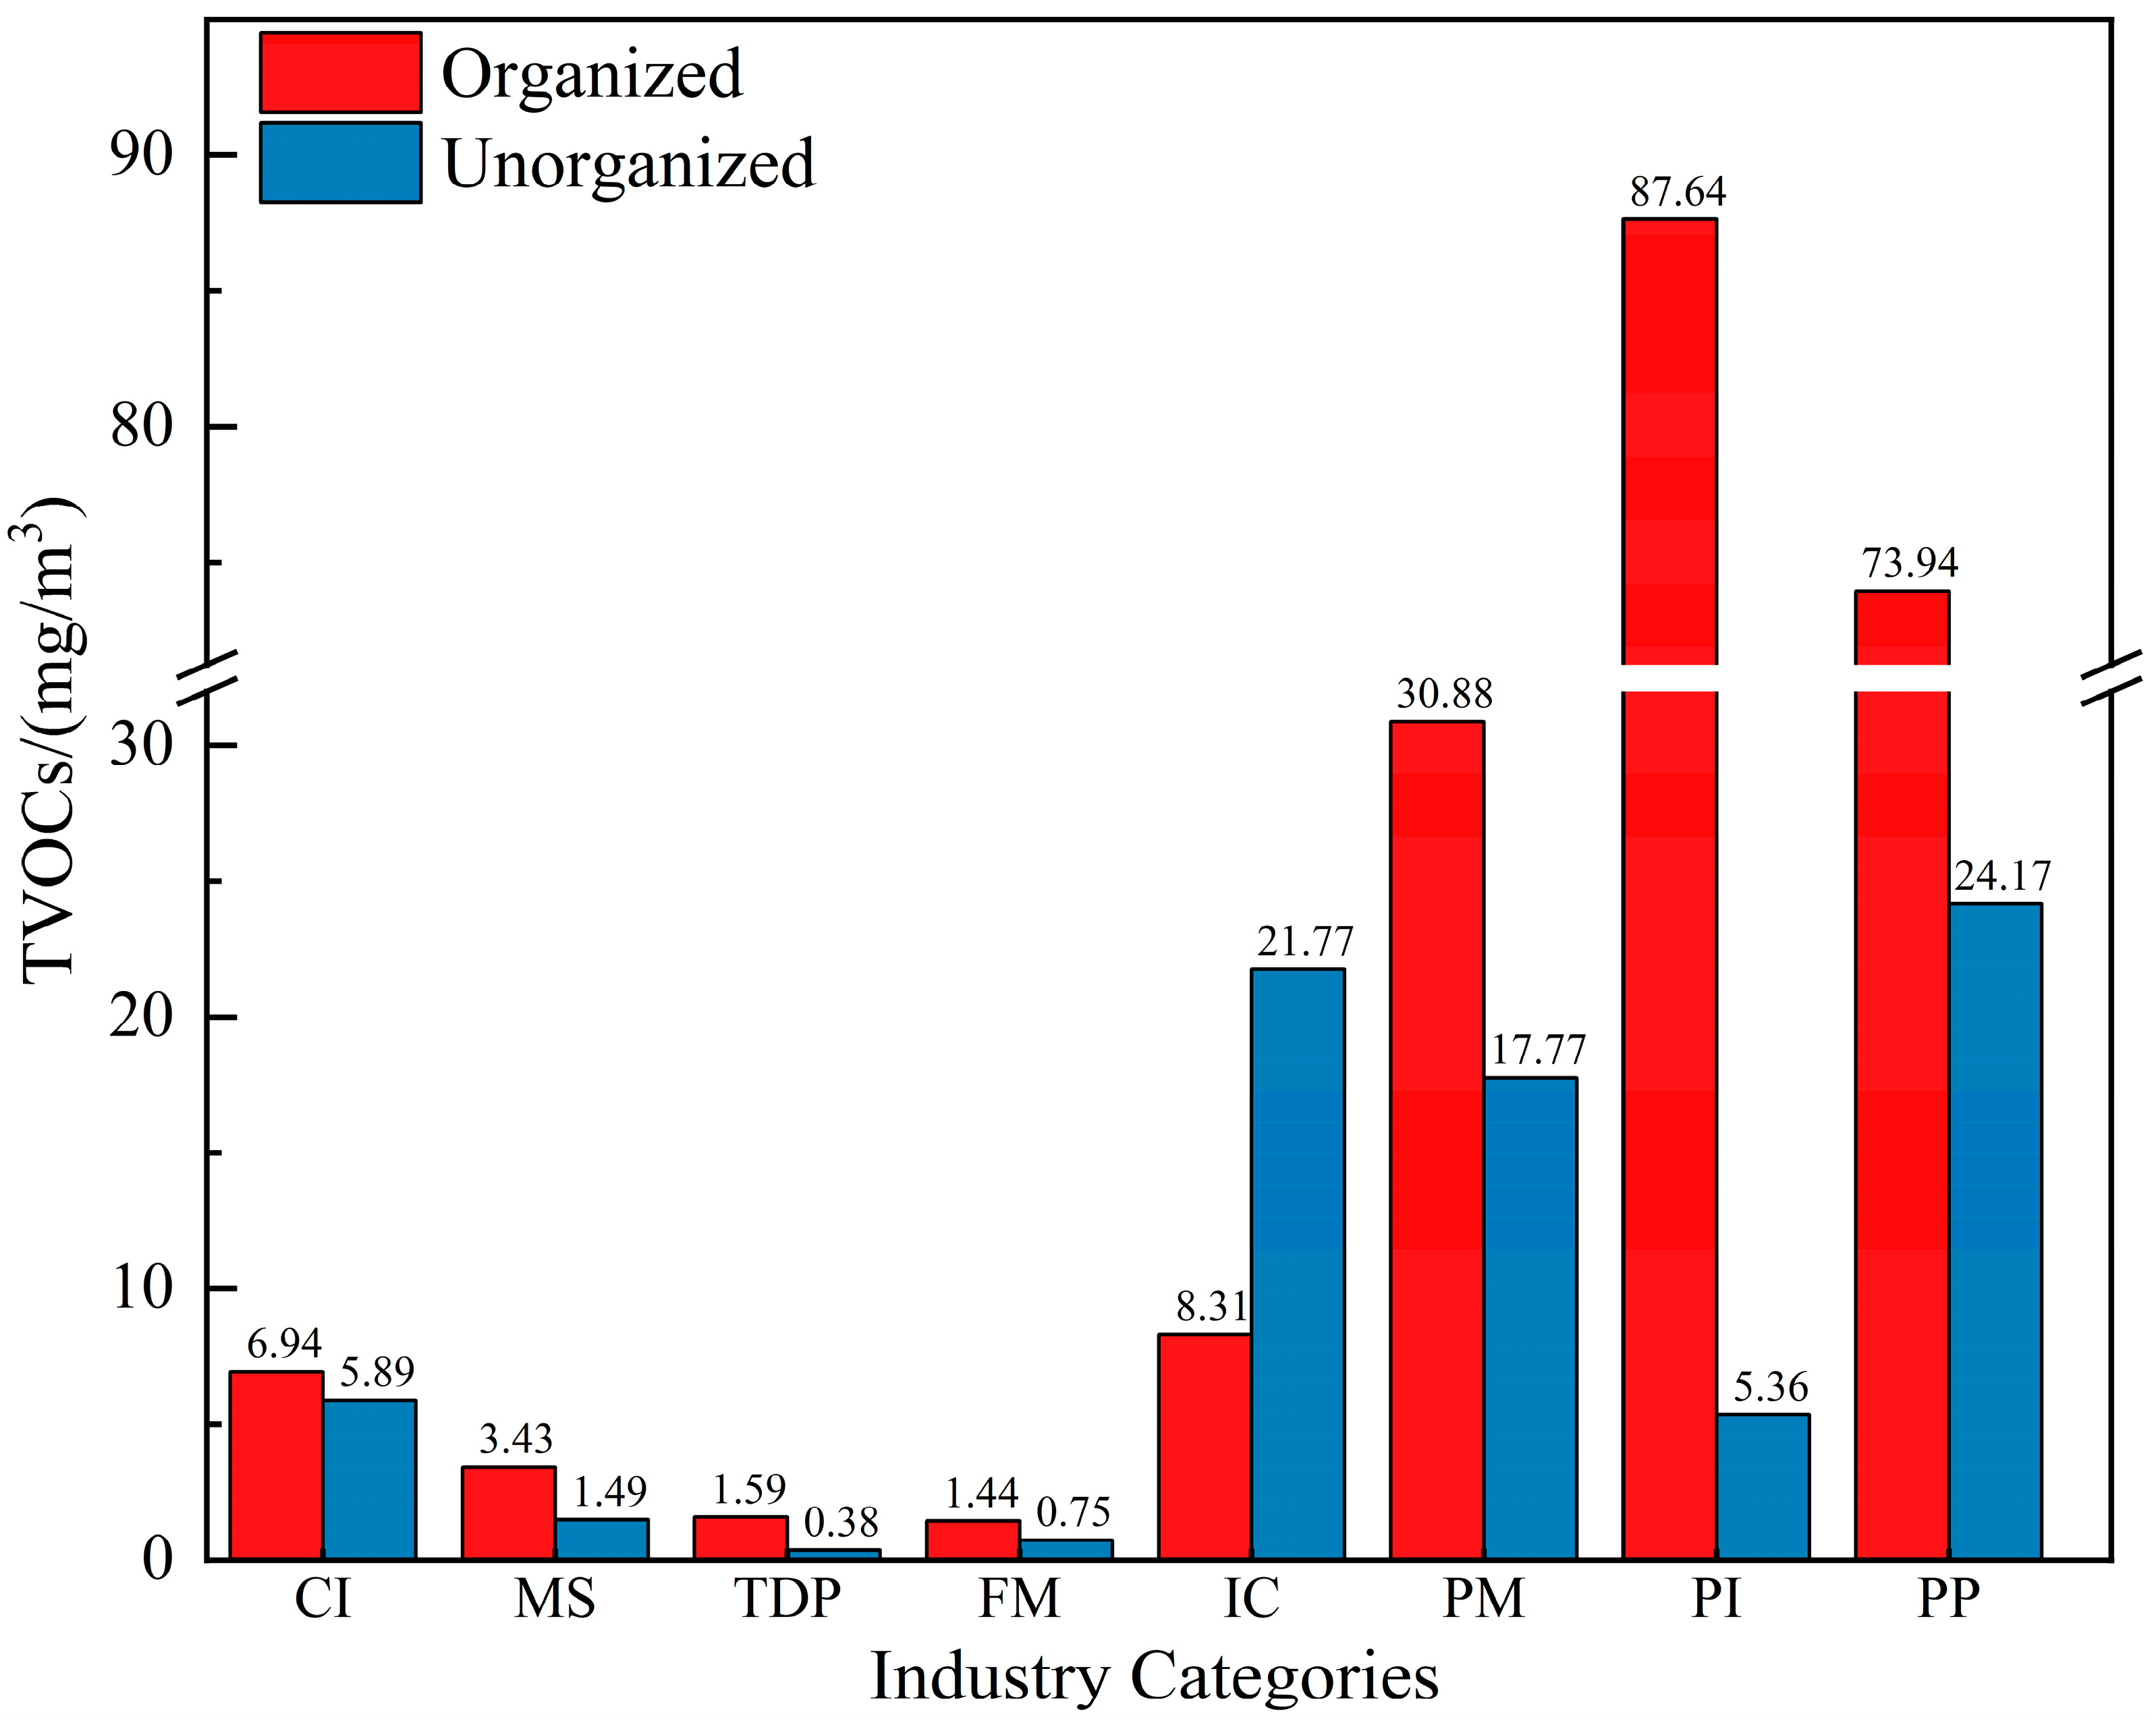
3.1.1. Concentration Level of VOC Emissions

The concentration of the total volatile organic compounds (TVOCs) in organized and unorganized emissions from the eight industries is shown in Figure 2. The results showed that the TVOC concentrations emitted by the eight industries ranged from 0.38 to 87.64 mg/m3. Their concentrations from large to small were as follows: PP > PI > PM > IC > CI > MS > FM > TPD. Overall, the TVOC concentrations in organized emissions (1.44–87.64 mg/m3) were significantly higher than those in unorganized emissions (0.38–24.17 mg/m3). The ratio of TVOCs between the organized and unorganized emissions in PI was the highest (16.35:1), and CI was the closest (1.17:1). It is worth noting that the TVOCs emitted in organized emissions in IC were significantly lower than those in unorganized emissions with a ratio of 1:1.74. PI (40.92%), PP (34.53%), and PM (14.42%) contributed the main TVOCs in organized emissions, while PP (31.16%), IC (28.06%), and PM (22.91%) had higher TVOC concentrations in unorganized emissions.

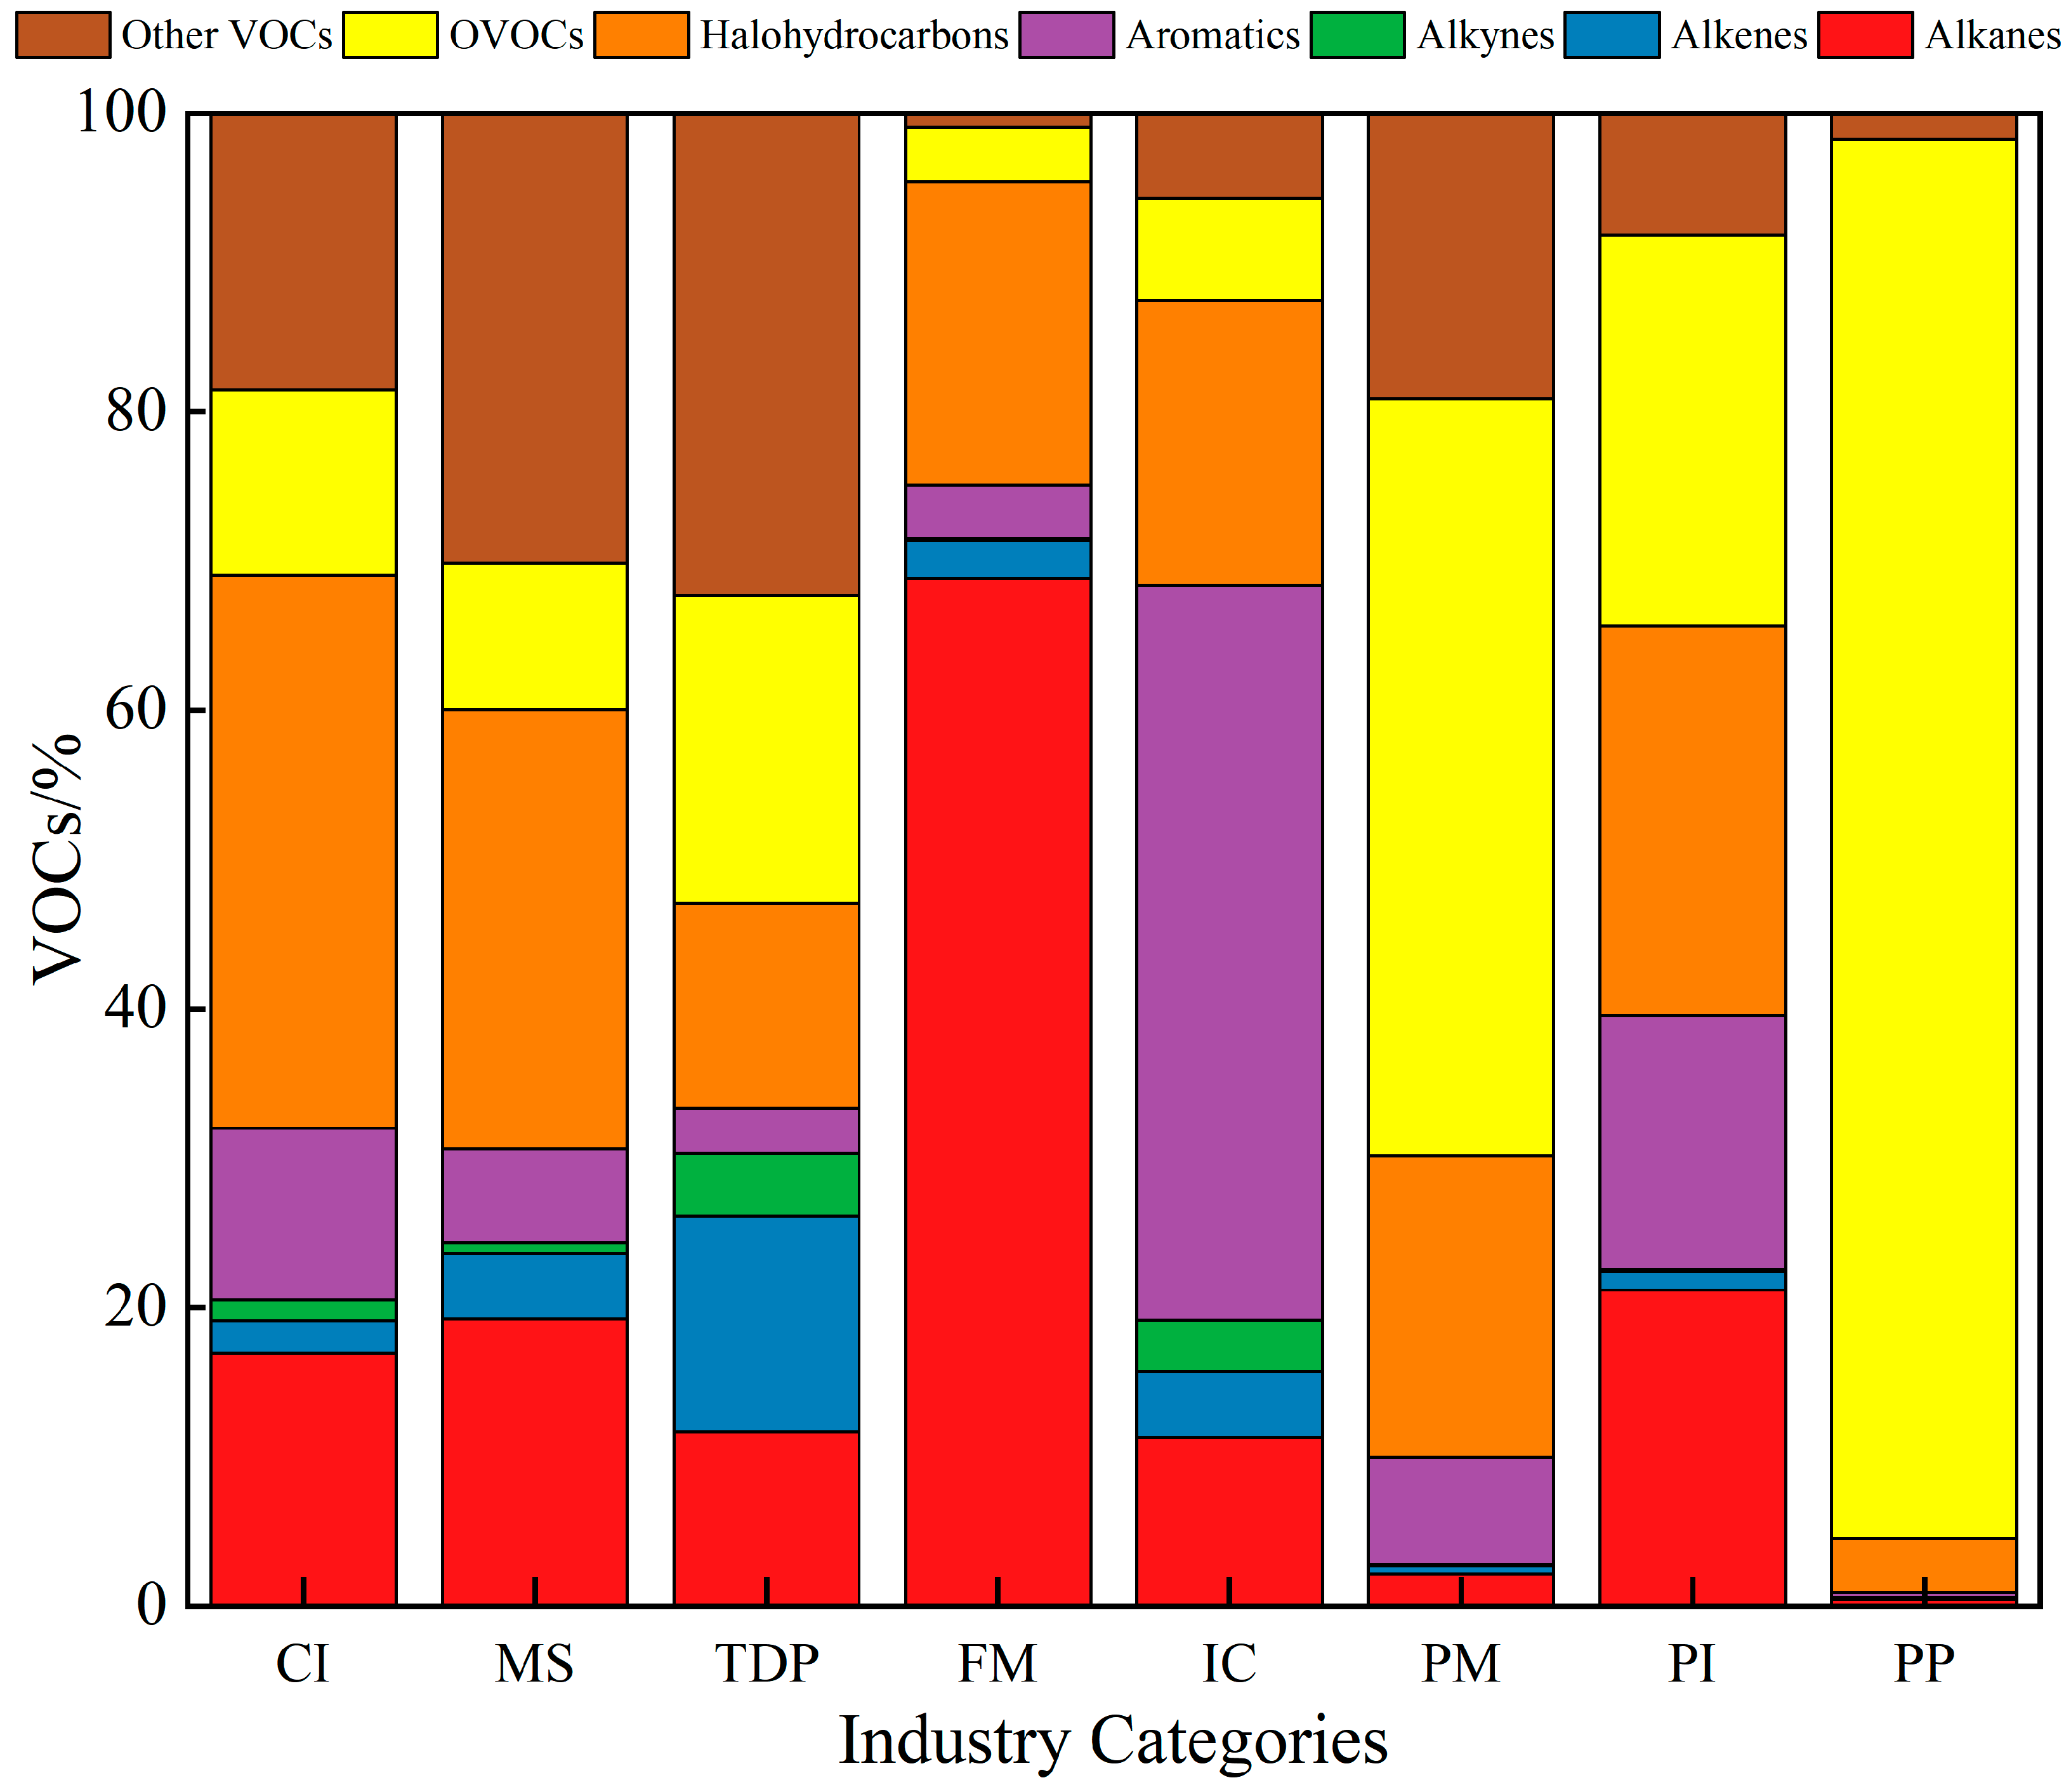
3.1.2. Composition Characteristics of VOCs

The proportion of the different types of VOCs emitted by the eight industries is shown in Figure 3. Halohydrocarbons in CI accounted for the highest proportion (37.06%), followed by alkanes and other VOCs. Halohydrocarbons and alkanes contributed nearly 2/3 of the TVOCs, which was consistent with the results by He et al. (2022) [30]. The halohydrocarbons and alkanes were represented by chloroform and n-heptane, respectively, which were mainly detected in the exhaust outlet of the production workshop. The proportion of VOCs in MS was very close to that in CI, mainly for carbon disulfide (30.13%), followed by halohydrocarbons and alkanes. In TDP, carbon disulfide (32.29%) and OVOCs (20.64%) were the main VOCs. The VOCs in FM were mainly alkanes (68.88%) and halohydrocarbons (20.30%). The main alkanes were n-butane, isobutane, and propane, which came from the exhaust outlet of the paint spraying and drying workshop. IC was dominated by aromatics which was the same as the conclusions by Liu et al. (2023) [31]. The largest proportion of aromatics in coatings was represented by benzene homologs such as xylene and ethylbenzene, which was around half of the TVOC emissions (49.22%), followed by halohydrocarbons and alkanes. All of these compounds were detected from the paint shop. The PM was dominated by OVOCs represented by ethyl acetate and isopropanol, which contributed half of the TVOC emissions in the industry (50.70%), followed by halohydrocarbons and other VOCs. These VOCs were mainly sampled at the outlet of the color mixing workshop. PP had the highest OVOCs (93.76%), and the main components were also ethyl acetate and isopropanol, both of which came from the printing workshop. The proportion of OVOCs in PP was very high because OVOCs were most abundant in the field of plastic and fabric surface coatings [32]. The proportions of OVOCs (26.24%), halohydrocarbons (26.10%), alkanes (21.18%), and aromatics (17.03%) in PI were comparable. These four types of VOCs accounted for a relatively high proportion in all process units in PP [33].

3.1.3. Spatial Distribution of VOCs

The factories with high TVOC emissions in this study were primarily located in the central, south-central, and southeastern regions of the city, as shown in Figure S1. Among them, the factories in the central region had the highest TVOC concentrations, mainly in the PP, PI, and IC factories, such as HQ Packaging and Printing, LH Pharmaceutical, and SX Industrial Coating. The organized emissions of HQ Packaging and Printing (73.94 mg/m3) and LH Pharmaceutical (47.17 mg/m3) were much higher than their unorganized emissions (24.17 mg/m3 and 2.87 mg/m3). However, the unorganized emissions of SX Industrial Coating (15.01 mg/m3) were higher than its organized emissions (5.07 mg/m3). The TVOC concentrations in the central and southern regions were slightly lower, mainly concentrated in the PM and PI factories, such as DM Paint Manufacturing and DT Pharmaceutical factories, whose organized emissions (30.47 mg/m3 and 40.46 mg/m3) were higher than unorganized emissions (16.96 mg/m3 and 2.49 mg/m3). There were also high-emission factories in FM and CI in the southeast, namely ZZG Furniture Manufacturing and SH Chemical. The organized emissions of the two factories (1.44 mg/m3 and 3.31 mg/m3) were also higher than the unorganized emissions (0.75 mg/m3 and 0.40 mg/m3). In addition, the VOC emission levels were generally low in the northern and northwestern regions of the city.

3.2. Characteristic Analysis of OFP

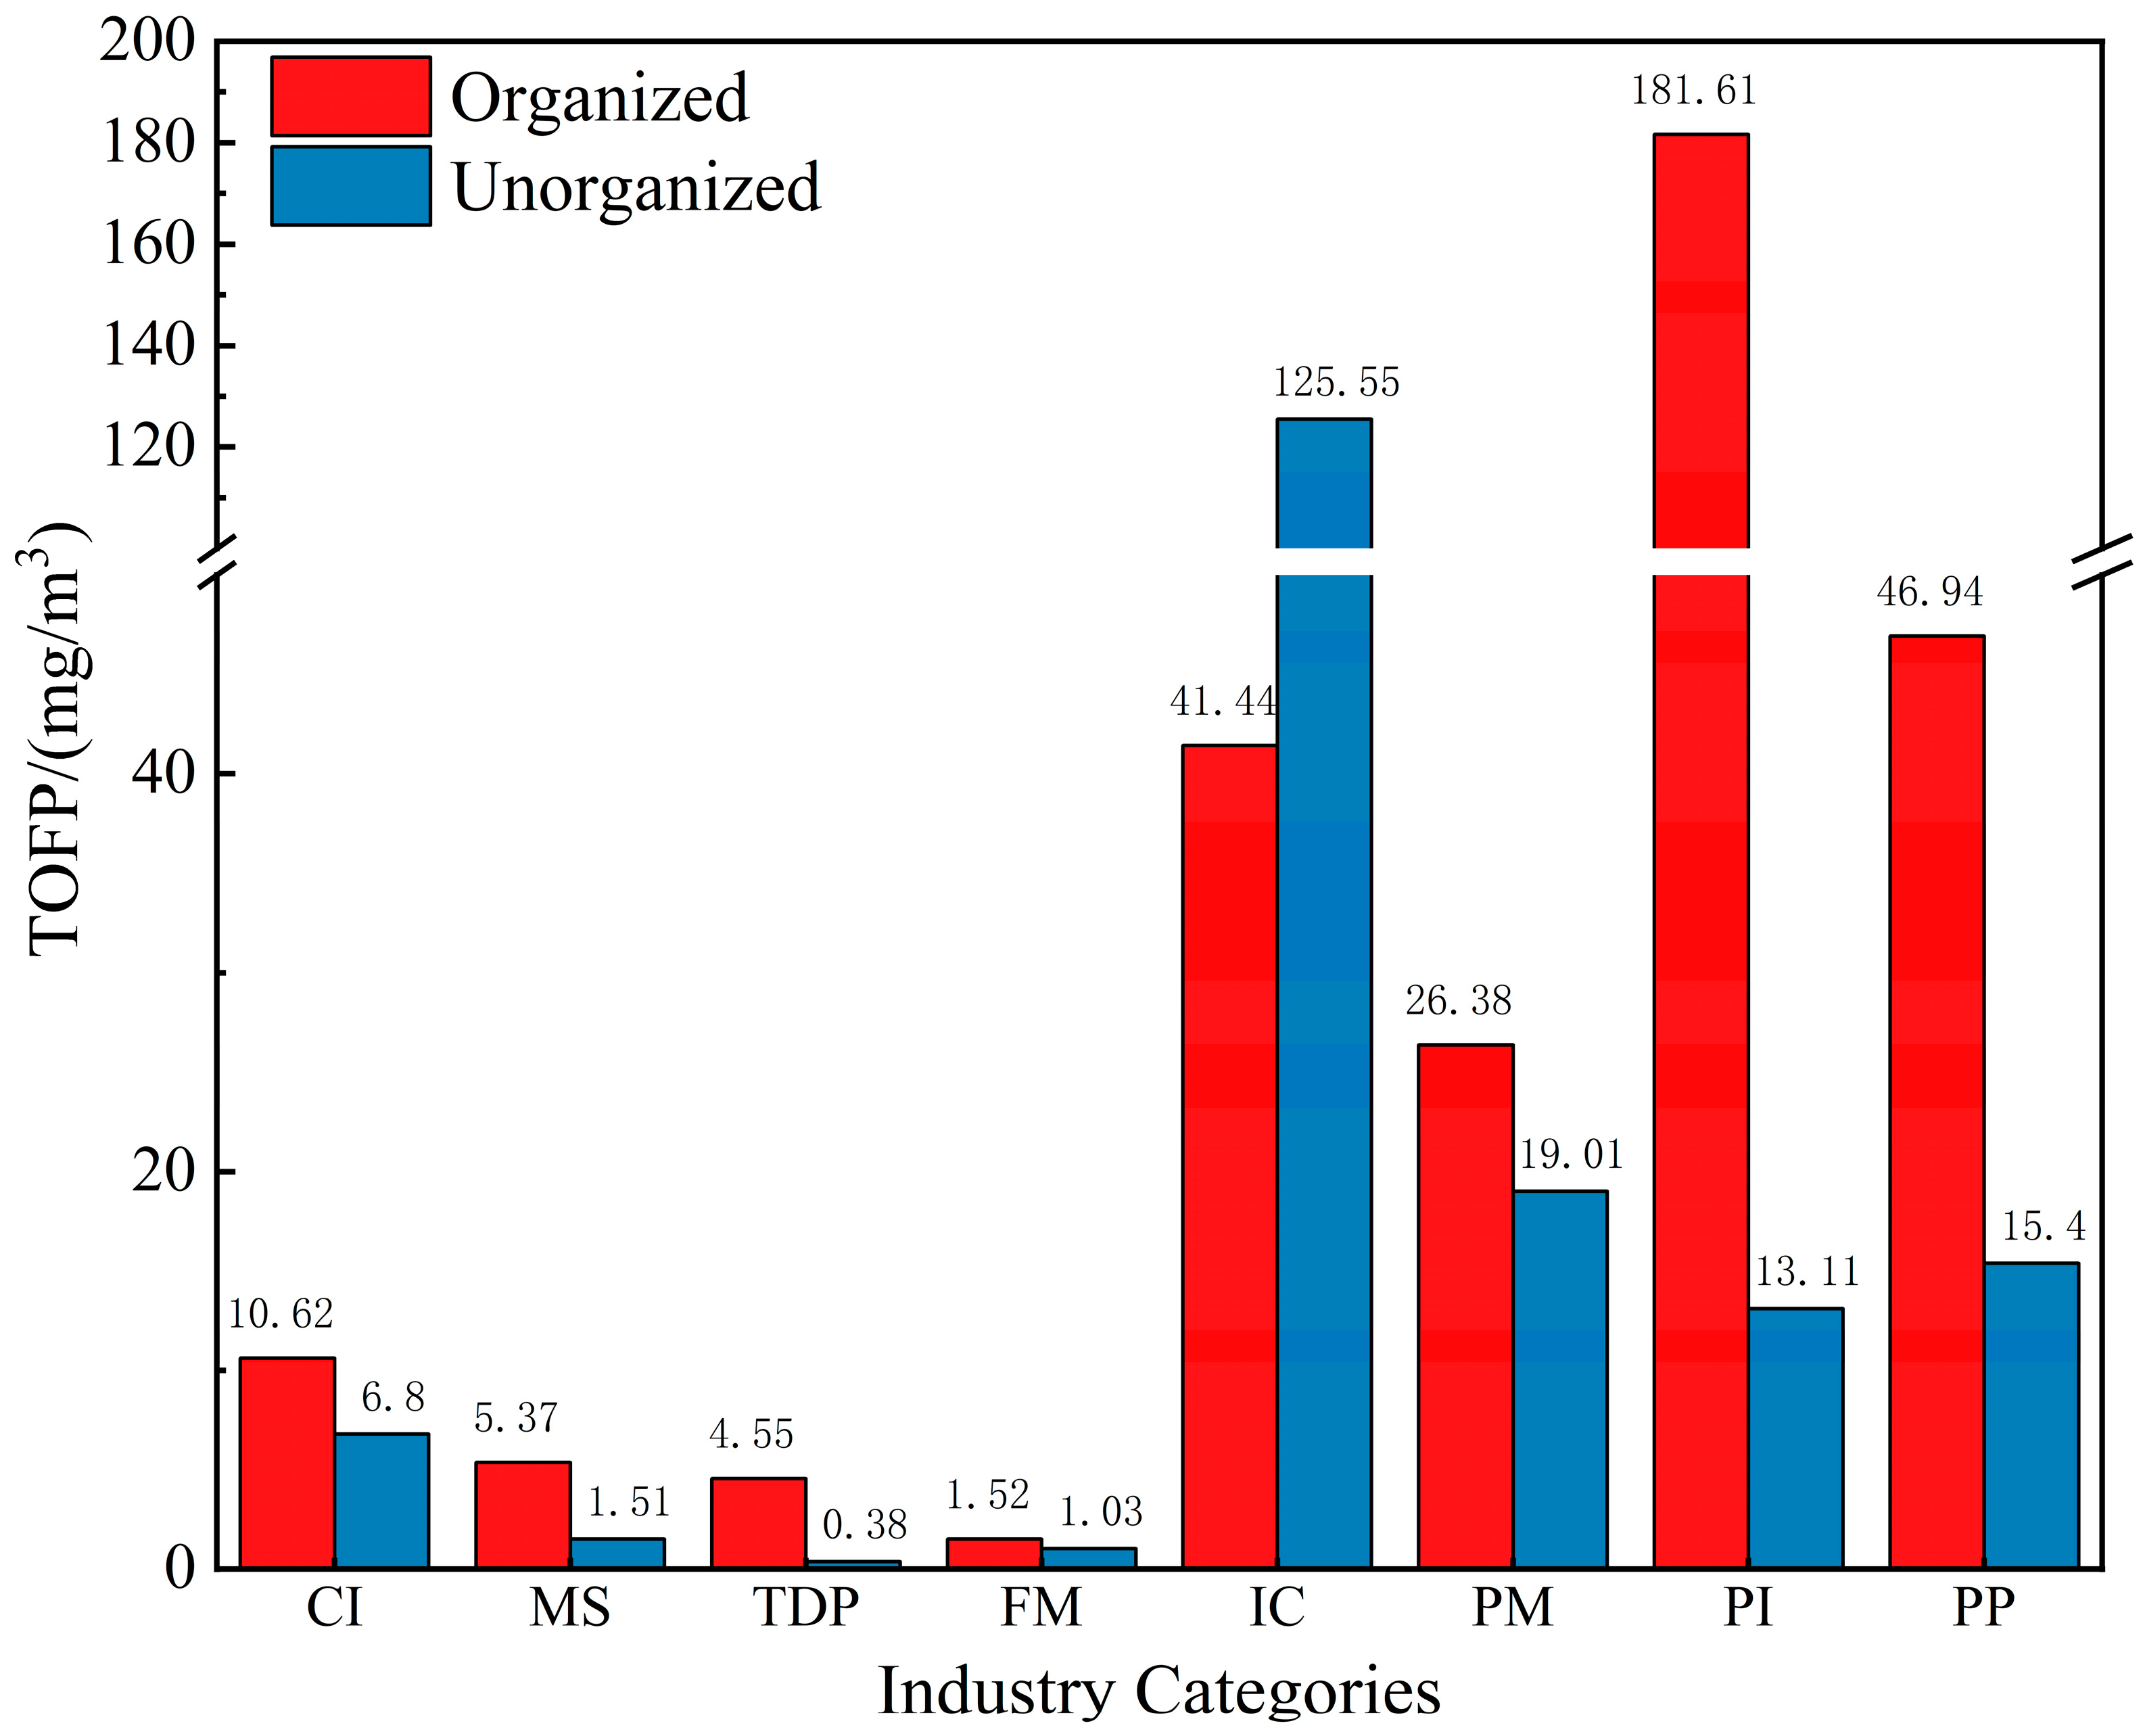
3.2.1. Industry Levels of OFP

The total ozone formation potential (TOFP) of the organized and unorganized VOC emissions from the eight industries is shown in Figure 4. The TOFP values of the eight industries were as follows: PI > IC > PP > PM > CI > MS > TDP > FM. Overall, the TOFP of organized emissions was higher than that of unorganized emissions. The TOFP of organized VOCs was in the range of 1.52 to 181.61 mg/m3, and the TOFP of unorganized VOCs was between 0.38 and 125.55 mg/m3. The TOFP ratio of the organized to unorganized emissions in PI was the highest (13.85:1), and the ratio of the two in FM was close (1.48:1). However, the organized emissions of IC were significantly lower than the unorganized emissions (1:3.03), which was the same as its characteristics of TVOC emissions. PI (57.03%), PP (14.74%), and IC (13.01%) contributed the main TOFP in organized emissions, while IC (68.69%) had the highest TOFP values in unorganized emissions.

3.2.2. Composition Characteristics of OFP

The proportion of OFP from different types of VOCs in the eight industries is shown in Figure 5. Among them, OFPs in CI and MS mainly came from the contributions of aromatics (benzene homologs), alkenes (n-butene), and alkanes (n-heptane). OFPs in TDP comprised alkenes represented by ethylene, accounting for 60.26%, followed by aromatics and alkanes. OFPs in FM mainly included alkanes (60.79%) represented by n-butane and isobutane, followed by alkenes and aromatics. OFPs in IC mainly came from the contributions of aromatics, with the main compounds of xylene, toluene, and ethylbenzene, by a contribution rate of up to 74.74%. OFPs in PM comprised aromatics (benzene homologs) and OVOCs (ethyl acetate). OFPs in PP mainly come from the contributions of OVOCs represented by ethyl acetate and isopropanol, with a contribution rate of up to 93.81%. OFPs in PI mainly included aromatics (toluene) and OVOCs (tetrahydrofuran).

3.2.3. Spatial Distribution of TOFP

The factories with higher TOFP were mainly distributed in the central, south-central, and southeastern parts of the city (Figure S2), such as LH Pharmaceuticals, DT Pharmaceuticals, HQ Packaging and Printing, XS Industrial Coatings, and DM Paint Manufacturing. Except for XS Industrial Coatings, the OFP generated by the organized emissions of the other factories was higher than that of the unorganized emissions. In general, the spatial distribution of OFP of the factories was consistent with the spatial distribution of their VOC emissions. The factories which emitted high VOC emissions also had high OFP values. It is worth noting that compared with the VOC concentration level, the OFP generated by organized (32.21 mg/m3) and unorganized (93.38 mg/m3) emissions from XS Industrial Coatings increased significantly. Its exhaust gas contained high concentrations of VOCs with high MIR coefficients such as m,p-xylene, which was the main reason for the increase in its OFP.

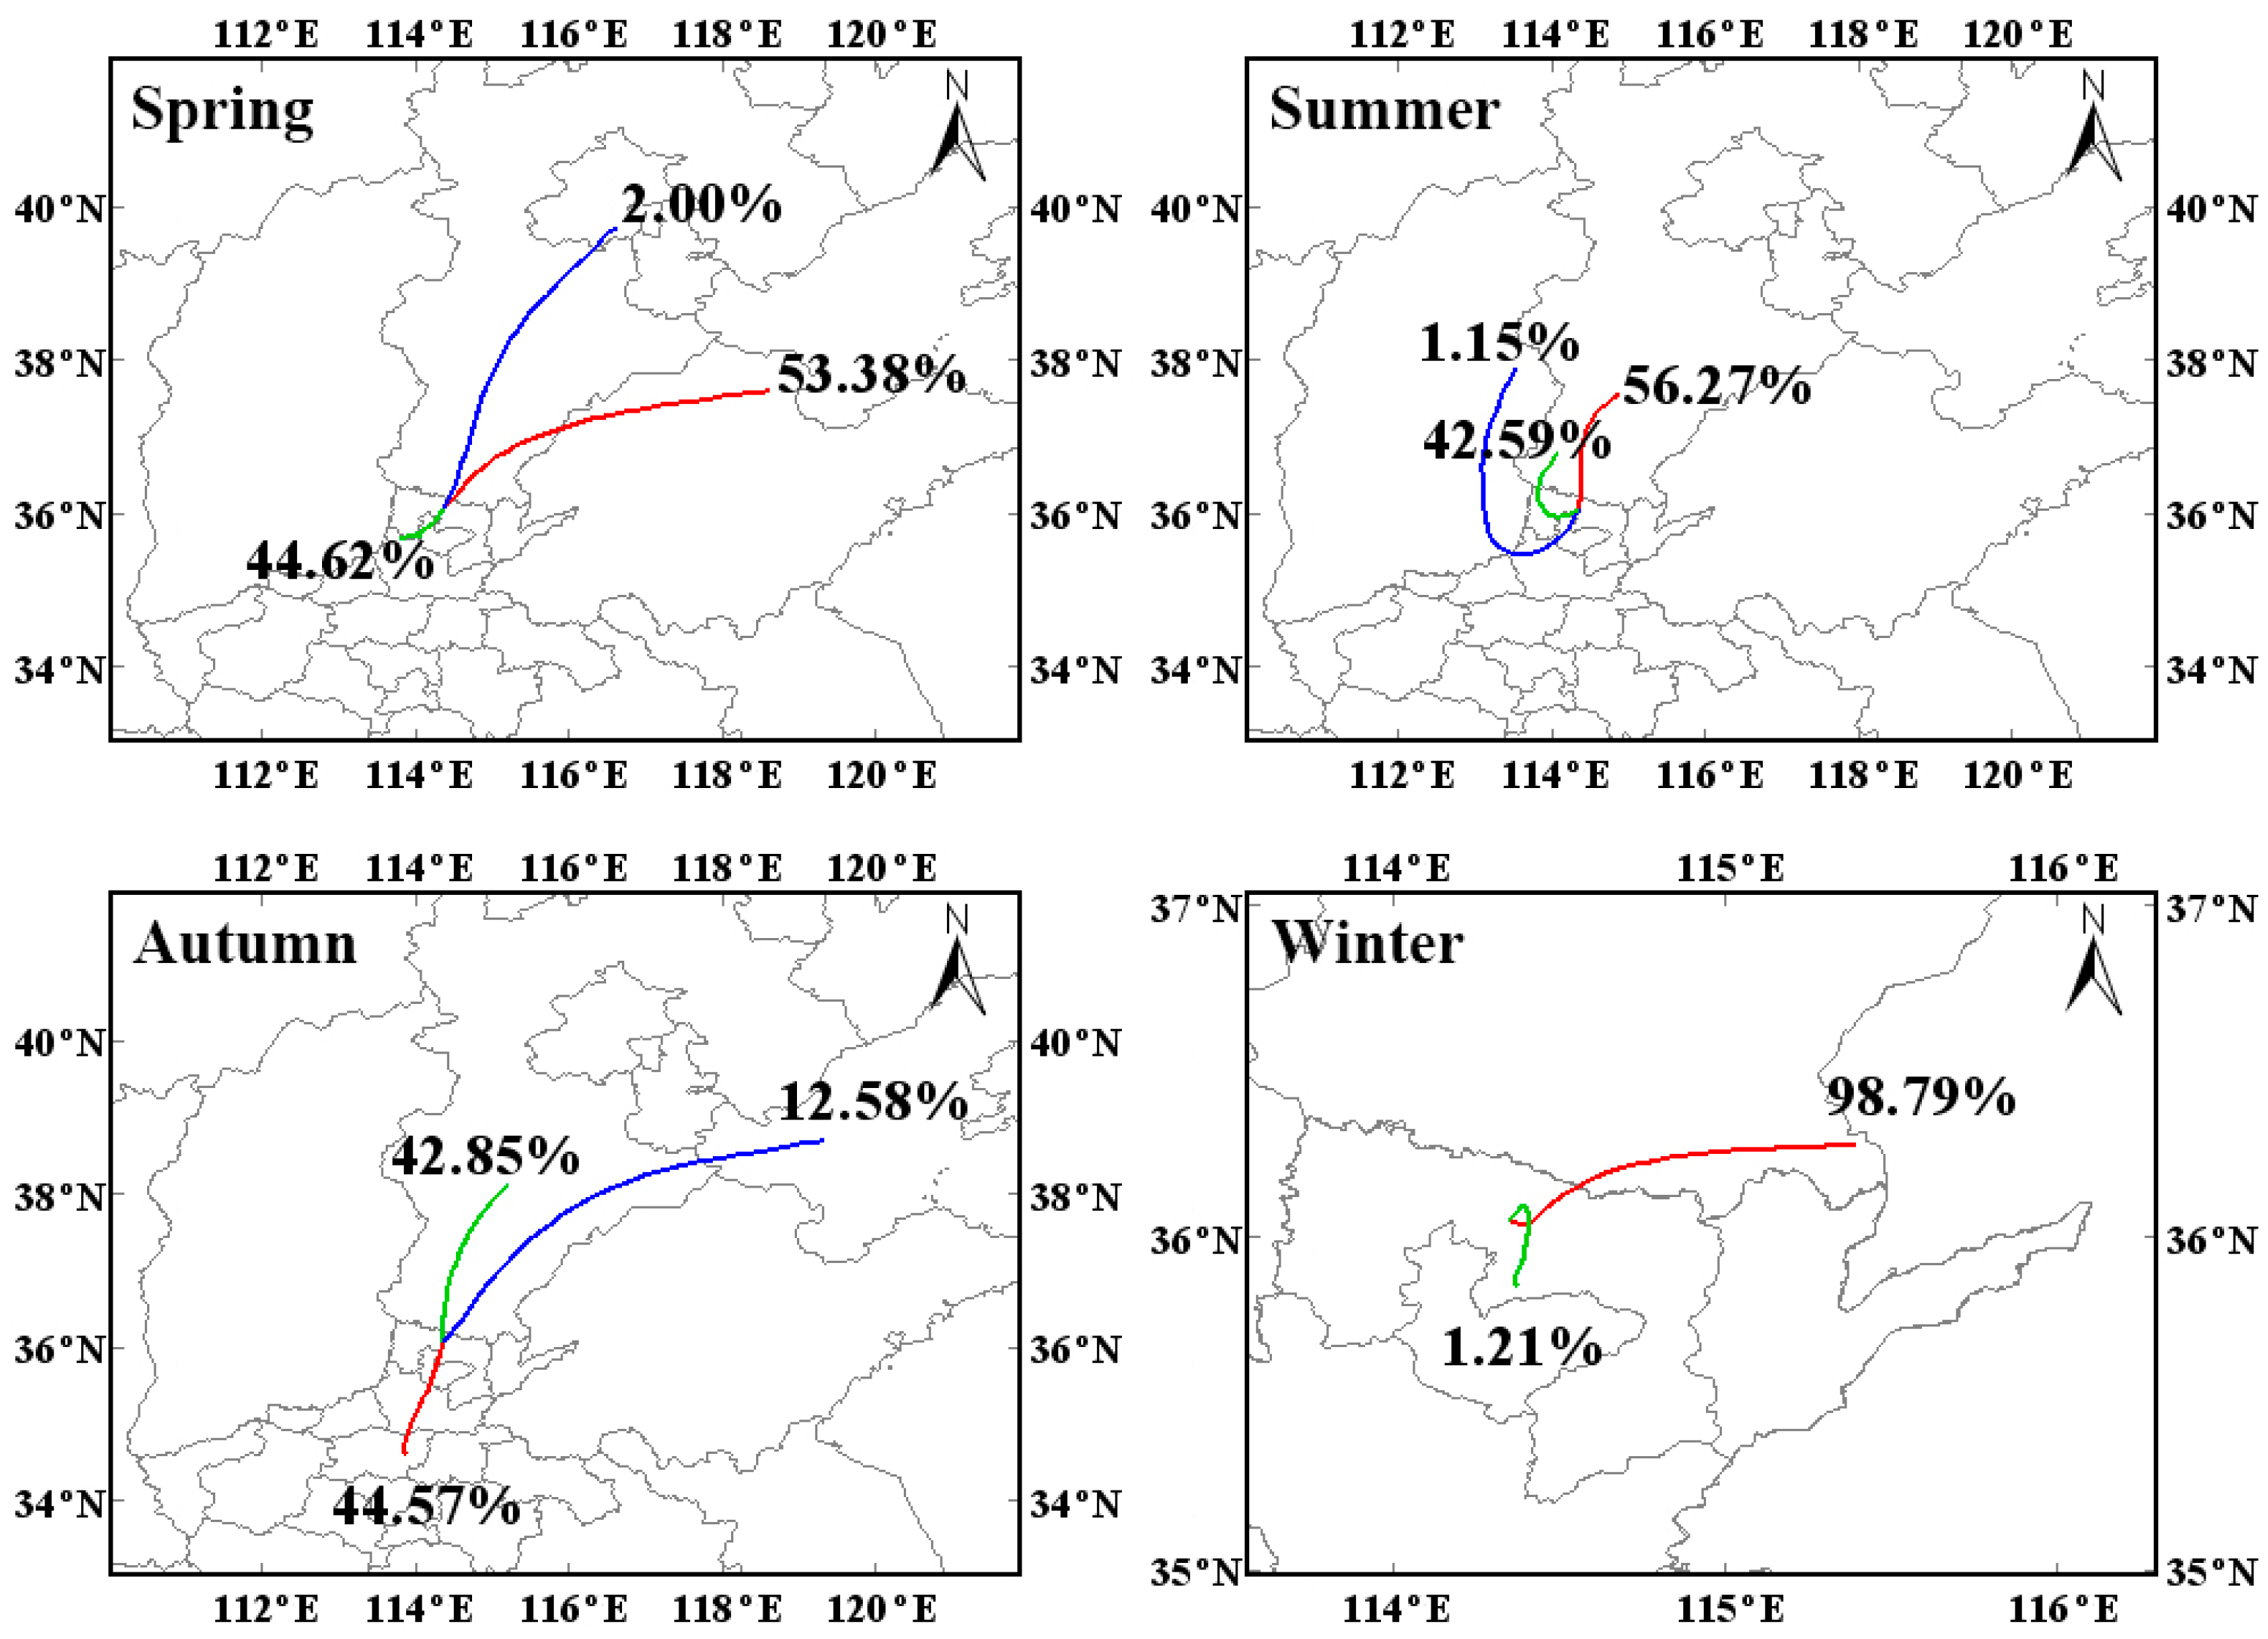
3.3. HYSPLIT Analysis

To assess the impact of the local VOCs on the surrounding regions, this study utilized the HYSPLIT model to analyze the forward trajectories of local air masses over different periods. Figure 6 shows the 24 h forward clustered trajectories of air masses at an altitude of 500 m across four seasons. In spring, 53.38% of the air masses were transported eastward over long distances, passing through Hebei to Shandong Province; 44.62% of the air masses moved southwestward and stayed in Henan Province; and another 2.00% of the air masses moved northward to the border between Hebei and Beijing. In summer, 56.27% of the air masses were transported northeastward over long distances to central Hebei Province; 42.59% of the air masses first moved westward and then northward to southern Hebei Province; and 1.15% of the air masses were first transported southwestward and then northward over long distances to Shanxi Province. The transmission paths in autumn and spring were similar, with 12.58% of the air masses moving northeastward through Hebei to Bohai Sea; 44.57% of the air masses moving southwestward to central Henan; and 42.85% of the air masses moving northeastward to central Hebei Province. In winter, 98.79% of the air masses moved eastward to the border between Hebei and Shandong Provinces; and 1.21% of the air masses migrated a short distance to the south. In general, the local air masses had a greater impact on the eastern and northern regions with long-distance transmissions, which were particularly strong in winter. The local impacts were mainly concentrated in the spring season.

3.4. Health Risk Assessment

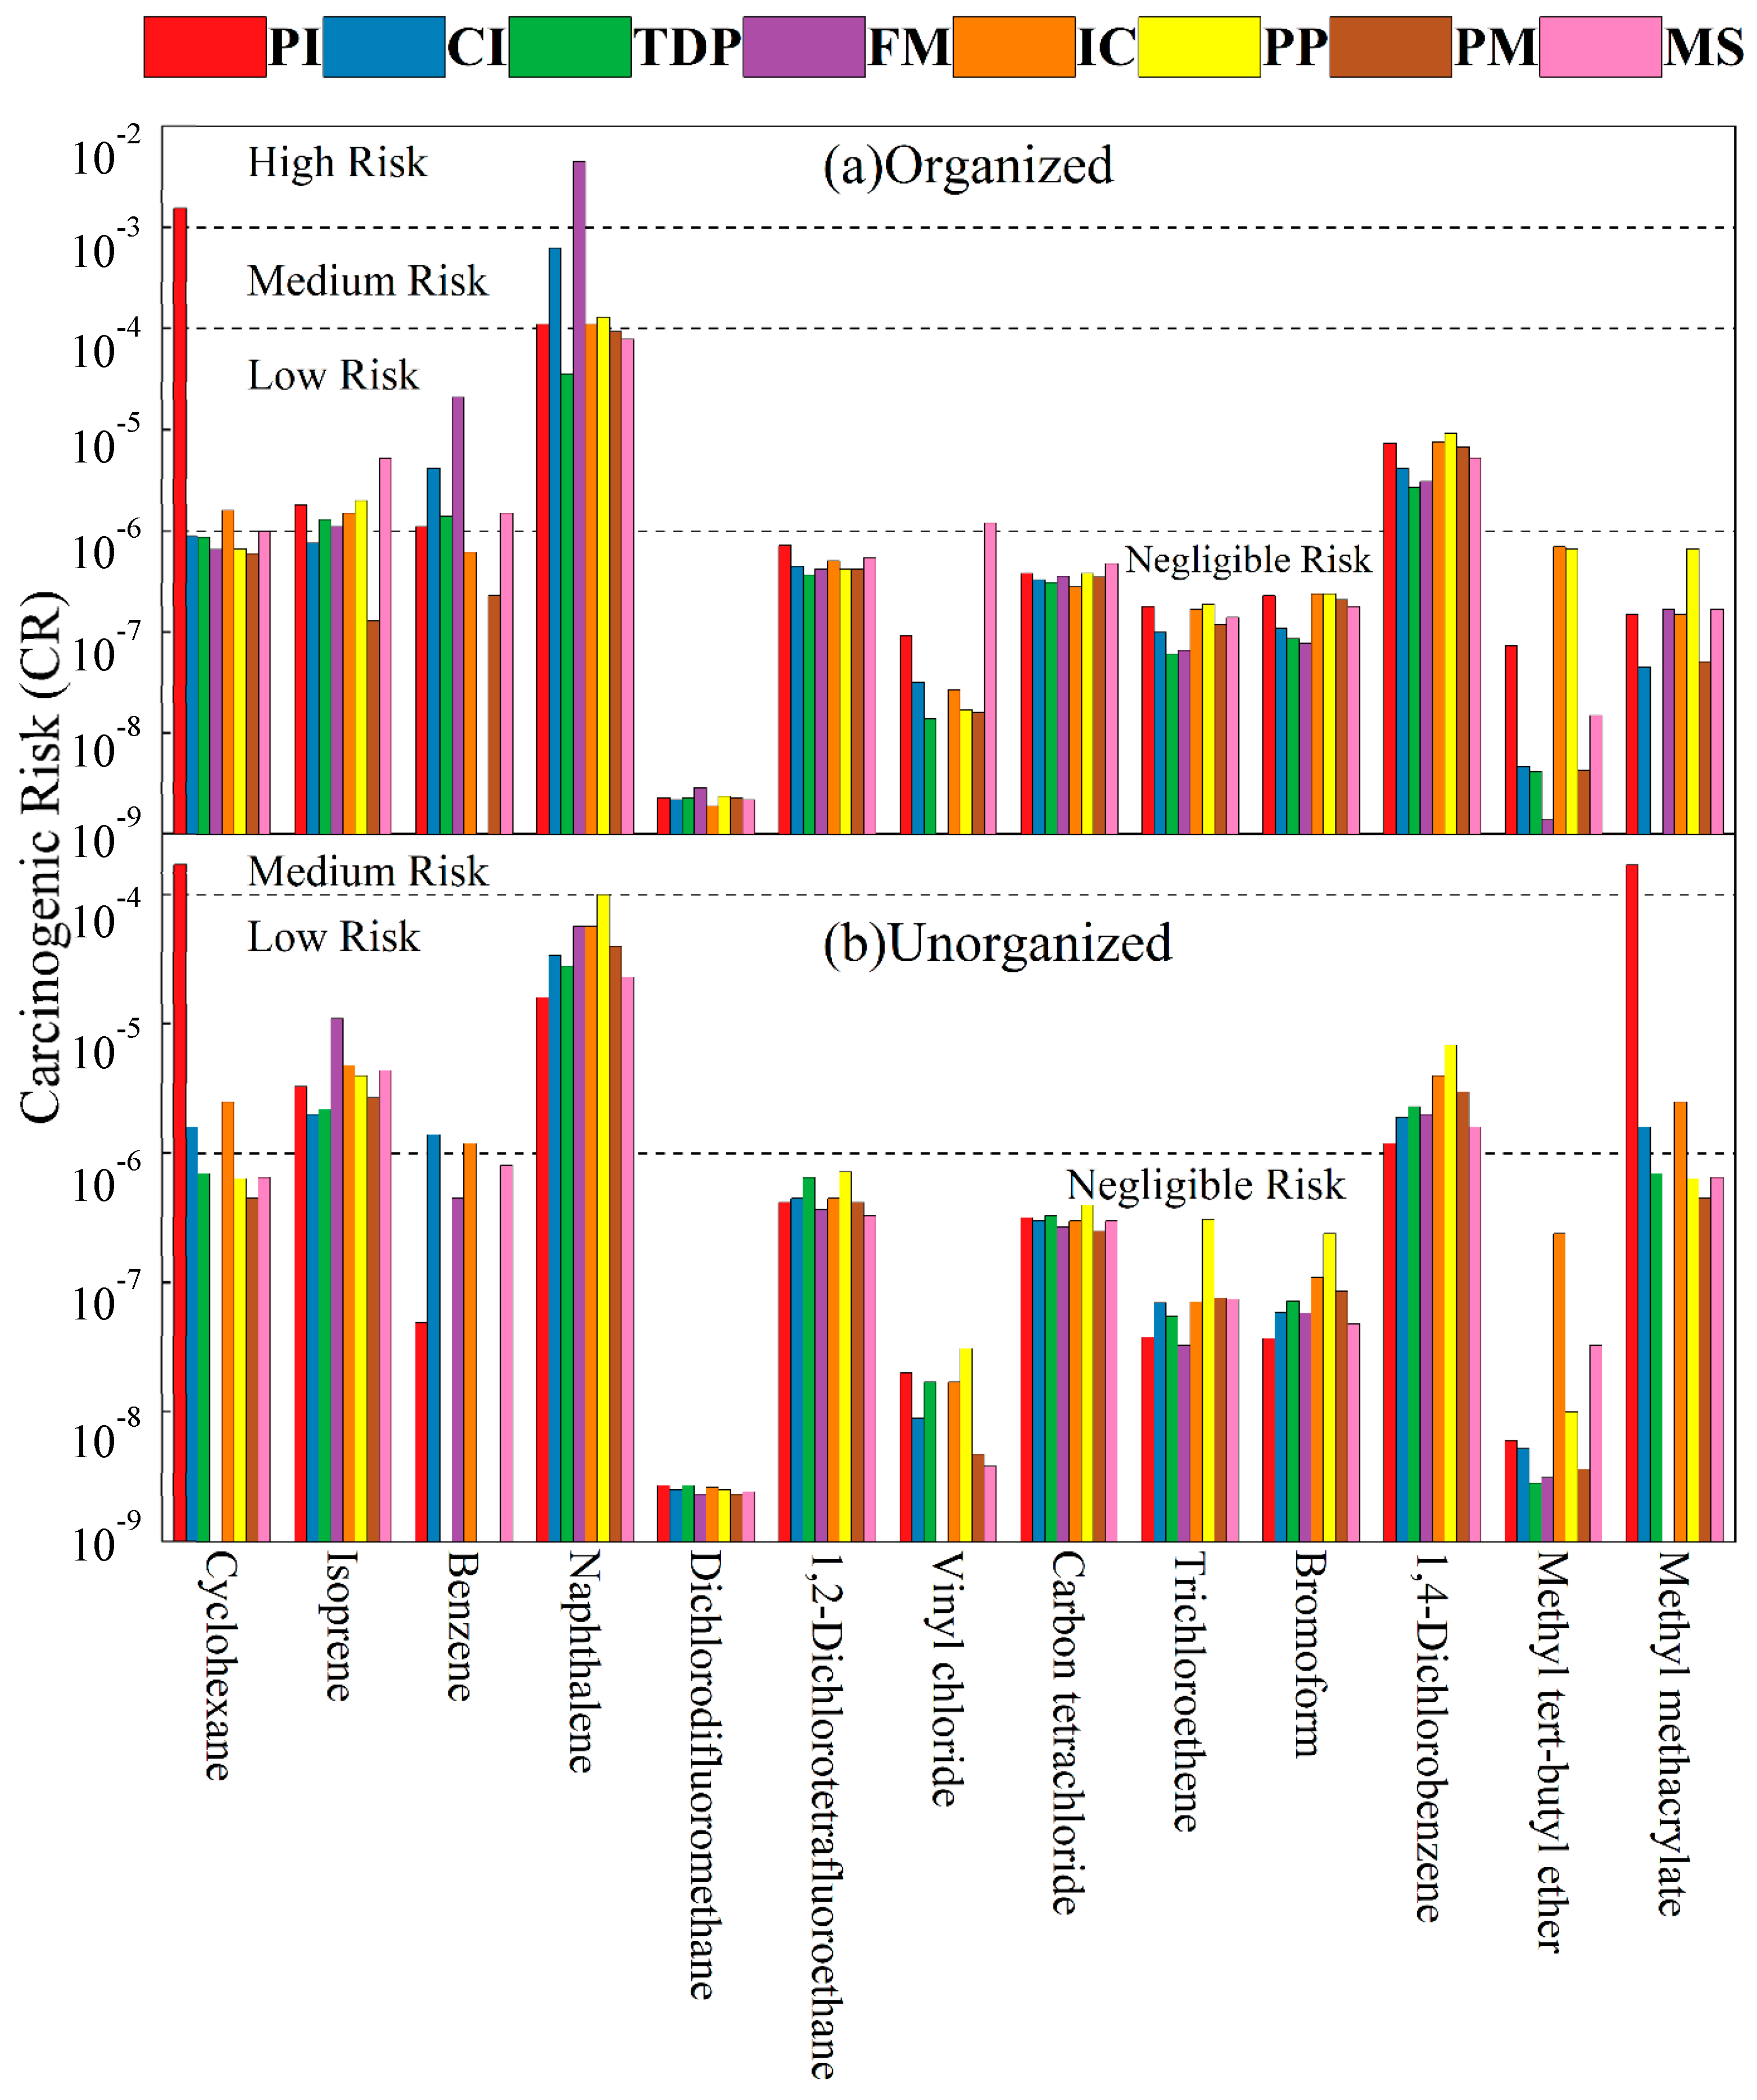
3.4.1. Carcinogenic Risk Assessment

According to the health risk assessment method in Section 2.6, this study calculated the total carcinogenic risks (∑CR) (Table 1) and the carcinogenic risk (CR) of individual VOC components (Figure 7) generated by the organized and unorganized VOC emissions in the eight industries. For organized emissions, the carcinogenic risks of FM (4.55 × 10⁻³) and PI (1.66 × 10⁻³) were both at high risk, and the other industries were at medium and low risks. Among them, the high-risk compounds were cyclohexane in PI and naphthalene in FM; the medium-risk compound was naphthalene produced by CI, PP, and IC; and p-dichlorobenzene in the eight industries was a low-risk compound. For unorganized emissions, the carcinogenic risk of PI (3.61 × 10⁻⁴) was at medium risk, and the rest of the industries were at low risk. Among them, the medium-risk compounds were cyclohexane and methyl methacrylate in PI. 2-methyl-1,3-butadiene, naphthalene, and p-dichlorobenzene in the eight industries were all low-risk compounds. In general, the total carcinogenic risks and the types of compounds with high carcinogenic risk detected from organized emissions were all more than those from unorganized emissions.

3.4.2. Non-Carcinogenic Risk Assessment

In addition, the non-carcinogenic risk (∑HI) of VOCs emitted in the organized and unorganized emissions of the eight industries (Figure 8) and the non-carcinogenic risk (HI) of individual VOC components (Tables S4 and S5) were calculated. Except for TDP, the ∑HI of the organized emissions of the other seven industries was greater than one, indicating a high non-carcinogenic risk in these factories, among which PP was particularly worthy of attention. The compounds with HI > 1 in organized emissions included ethyl acetate in PP (227.00), PM (46.80), and PI (34.60); naphthalene in FM (12.90) and CI (1.79); cyclohexane (7.50) in PI; and 1,2-dichloropropane (1.13) in IC. In unorganized emissions, the ∑HI of the industries were greater than one except for CI and TDP. MS and PM had higher non-carcinogenic risks in the eight industries. The compounds with HI > 1 in unorganized emissions included ethyl acetate in MS (15.40) and PM (14.00). In summary, ethyl acetate, naphthalene, and cyclohexane had relatively high HI in organized emissions, particularly for ethyl acetate. Except for TDP, the ∑HI of organized emissions from the industries was significantly higher than that of unorganized emissions, and the types of compounds with non-carcinogenic risks in organized emissions were also more than those in unorganized emissions.

4. Conclusions

This study mainly analyzed the VOC emission characteristics of eight typical industries in Anyang City in the Central Plains of China, and the conclusions are as follows: (1) The concentration of TVOCs emitted by the eight industries from large to small was as follows: PP > PI > PM > IC > CI > MS > FM > TPD. The concentration of TVOCs in organized emissions from the industries (1.44–87.64 mg/m3) was higher than that of unorganized emissions (0.38–24.17 mg/m3) except for IC. (2) In organized emissions, the most significant industry was the OVOCs emitted by the printing workshop, which contributed the highest proportion (93.76%) in PP. The aromatics emitted from the spray paint workshop in unorganized emissions were 49.22% of the TVOC emissions in IC, represented by benzene homologs. (3) VOC emissions were concentrated in the central, south-central, and southeastern parts of the city. The local air masses had a greater impact on the eastern and northern regions in winter, while the local impact was mainly concentrated in spring. (4) The TOFP of the eight industries in descending order was as follows: PI > IC > PP > PM > CI > MS > TDP > FM. The TOFP of the industries (1.52–181.61 mg/m3) was higher than the unorganized emissions (0.38–125.55 mg/m3) except for IC. (5) The FM (4.55 × 10⁻³) and PI (1.66 × 10⁻³) with organized emissions were at a high carcinogenic risk, with the high-risk compound of naphthalene. In terms of non-carcinogenic risks, PP with organized emissions (228.51) and MS (16.16) with unorganized emissions had the highest risks, and the main high-risk compound was ethyl acetate. Based on the conclusions of this study, our recommendations are as follows: (1) PP, PI, and PM are the main industries of VOC emissions in Anyang City that need to be focused on for control. (2) There are obvious differences and characteristics in the composition of VOCs in different industries, so a one-factory-one-policy treatment method should be adopted for the priority control of VOC species in each factory. (3) It should be noted that high-emission factories located around the city center have more impacts on residents’ health. Therefore, these factories should be treated as the top priority of emission control.

Supplementary Materials

The following supporting information can be downloaded at https://www.mdpi.com/article/10.3390/atmos16010074/s1, Figure S1: Spatial distribution of organized and unorganized VOC emissions from 20 factories; Figure S2: Spatial distribution of organized and unorganized TOFP emissions from 20 factories; Table S1: VOC sampling factory information; Table S2: The chemical composition and types of VOCs; Table S3: Specific parameters of health risks; Table S4: Organized non-carcinogenic risk (HI); Table S5: Unorganized non-carcinogenic risk (HI).

Author Contributions

Conceptualization, L.T. and C.H.; software, Y.L. (Yufei Ling); investigation and data curation, H.G., Y.L. (Yangchao Lv), A.S. and H.L.; resources and funding acquisition, L.T., H.X. and C.H.; methodology and writing—original draft preparation, F.L., Q.L. and L.T.; writing—review and editing, C.H. All authors have read and agreed to the published version of the manuscript.

Funding

This research was funded by the Open Project of Zhejiang Provincial Top Discipline of Biological Engineering (Level A), Zhejiang Wanli University (No. ZS2023005); National Natural Science Foundation of China (No. 41905115); and Ningbo Natural Science Foundation (No. 2023J059, No. 2023J303).

Institutional Review Board Statement

Not applicable.

Informed Consent Statement

Not applicable.

Data Availability Statement

The original contributions presented in this study are included in the article and the Supplementary Material. Further inquiries can be directed to the corresponding authors.

Acknowledgments

We would like to thank the editor and reviewers for their advice on this work.

Conflicts of Interest

Author Anwei Shi was employed by the company Ningbo Xinrui Zhice Technology Co., Ltd. Author Hui Liu was employed by the company Ningxia Huayu Environmental Protection Technology Co., Ltd. The remaining authors declare that the research was conducted in the absence of any commercial or financial relationships that could be construed as a potential conflict of interest.

References

  1. Li, Y.; Yin, S.; Yu, S.; Yuan, M.; Dong, Z.; Zhang, D.; Yang, L.; Zhang, R. Characteristics, source apportionment and health risks of ambient VOCs during high ozone period at an urban site in central plain, China. Chemosphere 2020, 250, 126283. [Google Scholar] [CrossRef] [PubMed]
  2. Jia, J.; Wang, J.; Jin, W.; Yu, N.; Gong, S.; Ni, J.; Zhang, X.; Zhou, L. Inter-annual variability and health risk assessment of summer VOCs in a Plain City of China. Atmos. Environ. 2024, 337, 120790. [Google Scholar] [CrossRef]
  3. Wang, R.; Wang, X.; Cheng, S.; Wang, K.; Cheng, L.; Zhu, J.; Zheng, H.; Duan, W. Emission characteristics and reactivity of volatile organic compounds from typical high-energy-consuming industries in North China. Sci. Total Environ. 2022, 809, 151134. [Google Scholar] [CrossRef] [PubMed]
  4. Yang, Y.; Liu, B.; Hua, J.; Yang, T.; Dai, Q.; Wu, J.; Feng, Y.; Hopke, P.K. Global review of source apportionment of volatile organic compounds based on highly time-resolved data from 2015 to 2021. Environ. Int. 2022, 165, 107330. [Google Scholar] [CrossRef] [PubMed]
  5. Li, L.; Zhang, D.; Hu, W.; Yang, Y.; Zhang, S.; Yuan, R.; Lv, P.; Zhang, W.; Zhang, Y.; Zhang, Y. Improving VOC control strategies in industrial parks based on emission behavior, environmental effects, and health risks: A case study through atmospheric measurement and emission inventory. Sci. Total Environ. 2023, 865, 161235. [Google Scholar] [CrossRef] [PubMed]
  6. Zhao, H.; Cheng, Y.; Liu, Y.; Wang, X.; Wang, Y.; Wang, S.; Jin, T. Characteristics of Volatile Organic Compounds Emissions and Odor Impact in the Pharmaceutical Industry. Atmosphere 2024, 15, 1338. [Google Scholar] [CrossRef]
  7. Wang, H.; Xue, S.; Hao, R.; Fang, L.; Nie, L. Emission Characteristics and Ozone Formation Potential Assessment of VOCs from Typical Metal Packaging Plants. Atmosphere 2021, 13, 57. [Google Scholar] [CrossRef]
  8. Kim, K.C.; Oh, B.H.; Baek, J.D.; Lee, C.S.; Lim, Y.J.; Joo, H.S.; Han, J.S. Characteristics and Source Profiles of Volatile Organic Compounds (VOCs) by Several Business Types in an Industrial Complex Using a Proton-Transfer-Reaction Time-of-Flight Mass Spectrometry (PTR-ToF-MS). Atmosphere 2024, 15, 1156. [Google Scholar] [CrossRef]
  9. Li, L.; Wang, F.; Hu, W.; Zhang, D.; Li, Z.; Lv, P.; Xu, Q.; Yuan, R.; Zhang, Y.; Zhang, Y.; et al. Risk-oriented source apportionment and implications for mitigation strategies of VOCs in industrial parks: Insights from odor pollution and health risks. Environ. Int. 2024, 193, 109137. [Google Scholar] [CrossRef] [PubMed]
  10. Gabriel, M.F.; Felgueiras, F.; Feliciano, M. Children’s Exposure to Volatile Organic Compounds: A Comparative Analysis of Assessments in Households, Schools, and Indoor Swimming Pools. Atmosphere 2024, 15, 1471. [Google Scholar] [CrossRef]
  11. You, G.; Liu, H.; Sun, R.; Jin, Z.; Li, J.; Zhou, X.; Lu, S.; Xie, S. Characterizing VOCs emissions of five packaging and printing enterprises in China and the emission reduction potential of this industry. J. Clean. Prod. 2023, 420, 138445. [Google Scholar] [CrossRef]
  12. Hussain, M.S.; Gupta, G.; Mishra, R.; Patel, N.; Gupta, S.; Alzarea, S.I.; Kazmi, I.; Kumbhar, P.; Disouza, J.; Dureja, H.; et al. Unlocking the secrets: Volatile Organic Compounds (VOCs) and their devastating effects on lung cancer. Pathol. Res. Pract. 2024, 255, 155157. [Google Scholar] [CrossRef]
  13. Lin, Q.; Gao, Z.; Zhu, W.; Chen, J.; An, T. Underestimated contribution of fugitive emission to VOCs in pharmaceutical industry based on pollution characteristics, odorous activity and health risk assessment. J. Environ. Sci. 2023, 126, 722–733. [Google Scholar] [CrossRef]
  14. Yang, Y.; Ji, D.; Sun, J.; Wang, Y.; Yao, D.; Zhao, S.; Yu, X.; Zeng, L.; Zhang, R.; Zhang, H.; et al. Ambient volatile organic compounds in a suburban site between Beijing and Tianjin: Concentration levels, source apportionment and health risk assessment. Sci. Total Environ. 2019, 695, 133889. [Google Scholar] [CrossRef]
  15. Guan, Y.; Xiao, Y.; Wang, F.; Qiu, X.; Zhang, N. Health impacts attributable to ambient PM2.5 and ozone pollution in major Chinese cities at seasonal-level. J. Clean. Prod. 2021, 311, 127510. [Google Scholar] [CrossRef]
  16. Zhang, X.; Xue, Z.; Li, H.; Yan, L.; Yang, Y.; Wang, Y.; Duan, J.; Li, L.; Chai, F.; Cheng, M.; et al. Ambient volatile organic compounds pollution in China. J. Environ. Sci. 2017, 55, 69–75. [Google Scholar] [CrossRef]
  17. Chen, Y.; Ling, Y.; Liu, F.; Tong, L.; Yang, M.; Shi, Y.; Xue, Y.; Ye, H.; Xu, Y.; Huang, C.; et al. Characteristics and Source Apportionment of Volatile Organic Compounds in a Coastal Industrial Area: A Case Study in the Yangtze River Delta of China. Bull. Environ. Contam. Toxicol. 2024, 113, 16. [Google Scholar] [CrossRef]
  18. Technical Requirements for Manual Monitoring of Ozone Precursor Organic Compounds in Ambient Air (Environmental Monitoring Guideline 2018 No. 240). 2018. Available online: https://www.mee.gov.cn/gkml/hbb/bgth/201802/t20180228_431887.htm (accessed on 2 February 2018).
  19. Liu, Y.; Kong, L.; Liu, X.; Zhang, Y.; Li, C.; Zhang, Y.; Zhang, C.; Qu, Y.; An, J.; Ma, D.; et al. Characteristics, secondary transformation, and health risk assessment of ambient volatile organic compounds (VOCs) in urban Beijing, China. Atmos. Pollut. Res. 2021, 12, 33–46. [Google Scholar] [CrossRef]
  20. Zhang, Y.; Li, C.; Yan, Q.; Han, S.; Zhao, Q.; Yang, L.; Liu, Y.; Zhang, R. Typical industrial sector-based volatile organic compounds source profiles and ozone formation potentials in Zhengzhou, China. Atmos. Pollut. Res. 2020, 11, 841–850. [Google Scholar] [CrossRef]
  21. Guan, Y.; Liu, X.; Zheng, Z.; Dai, Y.; Du, G.; Han, J.; Hou, L.; Duan, E. Summer O(3) pollution cycle characteristics and VOCs sources in a central city of Beijing-Tianjin-Hebei area, China. Environ. Pollut. 2023, 323, 121293. [Google Scholar] [CrossRef]
  22. Carter, W.P.L. Development of an Improved Chemical Speciation Database for Processing Emissions of Volatile Organic Compounds for Air Quality Models. 2023. Available online: https://intra.engr.ucr.edu/~carter/emitdb/ (accessed on 9 March 2023).
  23. Shi, Y.; Huang, C.; Huang, C.; Zhang, H.; Tong, L.; Cai, Q.; He, J.; Xu, H.; Yu, H.; Xiao, H. The impact of emission reduction policies on the results of PM2.5 emission sources during the 2016 G20 summit: Insights from carbon and nitrogen isotopic signatures. Atmos. Pollut Res. 2023, 14, 101784. [Google Scholar] [CrossRef]
  24. Shi, Y.; Hu, Y.; Jin, Z.; Li, J.; Zhang, J.; Li, F. Nitrate sources and its formation in precipitation during typhoons (In-fa and Chanthu) in multiple cities, East China. Sci. Total Environ. 2022, 838, 155949. [Google Scholar] [CrossRef]
  25. Li, Q.; Su, G.; Li, C.; Wang, M.; Tan, L.; Gao, L.; Mingge, W.; Wang, Q. Emission profiles, ozone formation potential and health-risk assessment of volatile organic compounds in rubber footwear industries in China. J. Hazard. Mater. 2019, 375, 52–60. [Google Scholar] [CrossRef] [PubMed]
  26. Wang, H.; Hao, R.; Xie, X.; Li, G.; Wang, X.; Wu, W.; Zhao, H.; Zhang, Z.; Fang, L.; Hao, Z. Emission characteristics, risk assessment and scale effective control of VOCs from automobile repair industry in Beijing. Sci. Total Environ. 2023, 860, 160115. [Google Scholar] [CrossRef]
  27. Huang, C.; Shi, Y.; Yang, M.; Tong, L.; Dai, X.; Liu, F.; Huang, C.; Zheng, J.; Li, J.; Xiao, H. Spatiotemporal distribution, source apportionment and health risk assessment of atmospheric volatile organic compounds using passive air samplers in a typical coastal area, China. J. Clean. Prod. 2023, 423, 138741. [Google Scholar] [CrossRef]
  28. Li, R.; Yuan, J.; Li, X.; Zhao, S.; Lu, W.; Wang, H.; Zhao, Y. Health risk assessment of volatile organic compounds (VOCs) emitted from landfill working surface via dispersion simulation enhanced by probability analysis. Environ. Pollut. 2023, 316, 120535. [Google Scholar] [CrossRef]
  29. Pinthong, N.; Thepanondh, S.; Kondo, A. Source Identification of VOCs and their Environmental Health Risk in a Petrochemical Industrial Area. Aerosol Air Qual. Res. 2022, 22, 210064. [Google Scholar] [CrossRef]
  30. He, X.; Che, X.; Gao, S.; Chen, X.; Pan, M.; Jiang, M.; Zhang, S.; Jia, H.; Duan, Y. Volatile organic compounds emission inventory of organic chemical raw material industry. Atmos. Pollut. Res. 2022, 13, 101276. [Google Scholar] [CrossRef]
  31. Liu, Y.; Zeng, C.; Wang, M.; Shao, X.; Yao, Y.; Wang, G.; Li, Y.; Hou, M.; Fan, L.; Ye, D. Characteristics and environmental and health impacts of volatile organic compounds in furniture manufacturing with different coating types in the Pearl River Delta. J. Clean. Prod. 2023, 397, 136599. [Google Scholar] [CrossRef]
  32. Zhong, Z.; Sha, Q.; Zheng, J.; Yuan, Z.; Gao, Z.; Ou, J.; Zheng, Z.; Li, C.; Huang, Z. Sector-based VOCs emission factors and source profiles for the surface coating industry in the Pearl River Delta region of China. Sci. Total Environ. 2017, 583, 19–28. [Google Scholar] [CrossRef]
  33. Cheng, N.; Jing, D.; Zhang, C.; Chen, Z.; Li, W.; Li, S.; Wang, Q. Process-based VOCs source profiles and contributions to ozone formation and carcinogenic risk in a typical chemical synthesis pharmaceutical industry in China. Sci. Total Environ. 2021, 752, 141899. [Google Scholar] [CrossRef]
Figure 1. The location of the sampling sites (the 20 factories are listed in Table S1).
Atmosphere 16 00074 g001
Figure 2. The TVOC concentrations in organized and unorganized emissions from the eight industries.
Atmosphere 16 00074 g002
Figure 3. The proportion of different types of VOCs from the eight industries.
Atmosphere 16 00074 g003
Figure 4. The TOFP in organized and unorganized emissions from the eight industries.
Atmosphere 16 00074 g004
Figure 5. The proportion of OFP from different types of VOCs from the eight industries.
Atmosphere 16 00074 g005
Figure 6. The clusters of air mass forward trajectories of the local industrial areas during the four seasons.
Atmosphere 16 00074 g006
Figure 7. CR in organized and unorganized emissions from the eight industries.
Atmosphere 16 00074 g007
Figure 8. HI in organized and unorganized emissions from the eight industries.
Atmosphere 16 00074 g008
Table 1. ∑CR in organized and unorganized emissions from the eight industries.
Industry Categories∑CR in Organized Emissions ∑CR in Unorganized Emissions
Pharmaceutical industry1.66 × 10−33.61 × 10⁻⁴
Chemical industry6.41 × 10−44.34 × 10⁻⁵
Textile printing and dyeing4.31 × 10−53.50 × 10⁻⁵
Furniture manufacturing4.55 × 10−37.12 × 10⁻⁵
Industrial coating1.23 × 10−47.32 × 10⁻⁵
Packaging and printing1.45 × 10−41.14 × 10⁻⁴
Paint manufacturing1.02 × 10−44.74 × 10⁻⁵
Metal smelting9.37 × 10−53.19 × 10⁻⁵
Disclaimer/Publisher’s Note: The statements, opinions and data contained in all publications are solely those of the individual author(s) and contributor(s) and not of MDPI and/or the editor(s). MDPI and/or the editor(s) disclaim responsibility for any injury to people or property resulting from any ideas, methods, instructions or products referred to in the content.

