Article

Numerical Simulation of Tornado-like Vortices Induced by Small-Scale Cyclostrophic Wind Perturbations

1
College of Meteorology and Oceanography, National University of Defense Technology, Changsha 410073, China
2
College of Advanced Interdisciplinary Studies, National University of Defense Technology, Changsha 410073, China
*
Authors to whom correspondence should be addressed.
Atmosphere 2025, 16(1), 108; https://doi.org/10.3390/atmos16010108
Submission received: 27 November 2024 / Revised: 3 January 2025 / Accepted: 17 January 2025 / Published: 19 January 2025
(This article belongs to the Section Meteorology)

Abstract

:
This study introduces a tornado perturbation model utilizing the cyclostrophic wind model, implemented through a shallow-water equation framework. Four numerical experiments were conducted: a single cyclonic wind perturbation (EXP1), a single low-geopotential height perturbation (EXP2), a cyclonic wind perturbation with a 0 Coriolis parameter (EXP3), and a single anticyclonic wind perturbation (EXP4). The outputs showed that in a static atmosphere setting, a small-scale cyclonic wind perturbation generated a tornado-like pressure structure. The centrifugal force in the central area exceeded the pressure gradient force, causing air particles to flow outward, leading to a pressure drop and strong pressure gradient. The effect of the Coriolis force is negligible for meso-γ-scale and smaller systems, while for meso-β-scale and larger systems, it begins to have a significant impact. The results indicate that a robust cyclonic and an anticyclonic wind field can potentially generate a pair of cyclonic and anticyclonic tornadoes when the horizontal vortex tubes in an atmosphere with strong vertical wind shear tilt, forming a pair of positive and negative vorticities. These tornadoes are similar but have different rotation directions.

1. Introduction

A tornado is a violently rotating column of air that is funnel-shaped and extends from a cumulonimbus cloud, typically less than 2 km in diameter [1]. It is a small-scale weather system with immense destructive power. Due to its unpredictable occurrence in terms of time and location, direct observation is challenging, making numerical simulation a vital tool for studying tornadoes.
Most of the research studies about tornadoes use complex 3D models, which are most close to reality; however, the uncertainties in the initial conditions, microphysical parameterizations schemes, and a sub-grid scale convection scheme can lead to inaccurate simulations of precipitation location and intensity [2]. Therefore, the dynamic and synoptic mechanism of tornado formation is still unclear. So, we simplified the complex real flow field through the ideal simulation, only the dynamic disturbance is retained to study the dynamics of the tornado-like low.
Research has identified that tornado formation requires significant vertical vorticity in the low-level atmosphere [3,4,5,6,7], often associated with low-level strong horizontal wind shear [8]. The environmental vorticity contributes to stronger upward pressure gradient accelerations [9,10]. Two primary mechanisms have been proposed to explain how air parcels near the surface gain substantial vertical vorticity. The first, known as the downdraft mechanism, involves horizontal vorticity tilting upward or downward through downward flow [3,11], a concept supported by several numerical simulations [12,13]. This mechanism may explain the generation of the initial vorticity. The second mechanism, termed “in-and-up mechanism,” occurs when the horizontal vorticity vector tilts upward due to a strong ascending motion gradient on the ground, leading to the formation of vertical vorticity [6,14,15,16]. Both mechanisms involve the tilting of horizontal vortex tubes. When a horizontal vortex tube tilts into a vertical vortex, a strong horizontal rotating wind field forms. However, the intense pressure characteristic of tornadoes does not emerge immediately. Key questions arise: How are the extremely low pressure and strong horizontal pressure gradient inside a tornado generated? Are these phenomena related to the quasi-equilibrium relationship between the pressure field and wind field, as proposed by [17]? What is the time scale of such adaptive process? These questions merit further investigation.
In large-scale weather systems such as cyclones and anticyclones, the Coriolis force plays a crucial role. For instance, the dynamics of a tropical cyclone can be viewed as a balance among the Coriolis force, pressure gradient force, and centrifugal force. The impact of the Coriolis force on smaller-scale weather systems, like tornadoes, has been a subject of debate. Some researchers believe that tornadoes, often occurring within supercell systems, are influenced by the Coriolis force, so its effect should not be disregarded [18,19,20]. For instance, a weak Coriolis force could alter the vortex’s rotation direction, as indicated by modifications in the minimum value of the Ginzburg–Landau equation [21]. Conversely, other studies suggest that the Coriolis force is frequently overlooked in dimensional analyses of supercells and tornadoes [22]. In the realm of numerical tornado simulation, approaches vary. Some studies exclude the Coriolis force entirely, e.g., [9,16], while others incorporate it, focusing primarily on wind perturbations, e.g., [6,7,10,23,24]. Certain simulations aim to maintain a balance among pressure gradient, Coriolis force, and friction force to keep the ambient wind profile constant [25]. Although the Coriolis force is often considered in the context of supercell and tornado-like vortex scales, its influence on smaller tornadoes and their parent bodies remains unclear. This area warrants further investigation to understand the full extent of the Coriolis force’s impact on tornado genesis.
In atmospheric studies, most observed tornadoes exhibit cyclonic rotation, with anticyclonic tornadoes being relatively rare [20]. For instance, Snider [26] found only one anticyclonically rotating tornado among 100 cases. Similarly, Fujita [27] reported 29 anticyclonic tornadoes in the USA over a span of 27 years. In Japan, a study by Niino et al. [28] covering 1961 to 1993 indicated that approximately 15% of tornadoes were anticyclonic. Additionally, Chernokulsky et al. [29] presented a database of Northern Eurasian tornadoes from the 10th century to 2016, revealing that only five out of 203 tornadoes with known rotation directions were anticyclonic. The rotation direction of tornadoes may be linked to middle-level mesoscale vortices. Most middle-level vortices in supercells are mesocyclones, spreading toward the right side of the weighted average wind of the troposphere [30]. In rarer instances, they manifest as mesoanticyclones, resembling the mirror image of cyclonic supercells [31,32]. These mesoanticyclones can produce anticyclonic tornadoes [33,34]. Anticyclonic tornadoes can also form in cyclonic supercells, typically at the end of rear-flank gust front, and may coexist with strong mesocyclones or cyclonic tornadoes [1,35,36,37,38,39]. Complex terrain also influences tornado rotation direction. Carbajal et al. [20] found that in Mexico’s volcanic belt region, the proportion of anticyclones reached 50%. On a larger scale, cyclones in the northern hemisphere generate low pressure, and anticyclones produce high pressure. When rotation is weak, the centrifugal force is weak, primarily between the pressure gradient force and the Coriolis force. However, in small-scale tornadoes, both cyclonic and anticyclonic tornadoes form depressions. The formation of depressions within strong vertical negative vorticity in anticyclone wind fields is particularly noteworthy.
This study aims to delve deeper into the formation process of anticyclonic tornadoes. Utilizing the shallow-water equation model, we constructed an ideal cyclostrophic wind field for small-scale tornadoes. We simulated the tornado pressure field formation process and investigated the role of the Coriolis force in the rotational airflow equilibrium of tornadoes through comparative experiments.

2. Model and Methods

2.1. Introduction of the Shallow-Water Equation Model

The shallow-water equation model employed in this study was developed by Erbes at Stockholm University, Sweden [40]. This model represents a high-resolution, non-oscillatory staggered method. It is grounded in hyperbolic conservation laws and utilizes the Lax–Friedrichs scheme. The accuracy of this model surpasses that of traditional finite difference schemes.
This model operates in a 2D flux form. It omits the impacts of factors such as viscosity and stratification, ensuring adherence to the principles of mass conservation and momentum conservation. It is designed to handle discontinuous phenomena effectively. Spatial differences are calculated using a centered difference scheme, while temporal differences are addressed with the leap-frog scheme, complemented by Asselin smoothing. Radiation boundary conditions are incorporated. This mode provides a robust approximation of actual atmospheric and oceanic motions. The underlying equation for the model is as follows:
u h t + u 2 h + g h 2 2 x + v u h y = s u h ,
v h t + u v h x + v 2 h + g h 2 2 y = s v h ,
h t + u h x + v h y = s h .
where
s u h = g h h T x + f v h + K 2 u h ,
s v h = g h h T y + f u h + K 2 v h ,
s h = K 2 h .
where u and v represent the horizontal wind speeds in the x- and y-directions, respectively; h denotes the fluid depth; and hT stands for the terrain height. The diffusion coefficient is represented by K, g indicates the gravitational acceleration, and f is the Coriolis parameter. The symbol 2 denotes the Laplace operator. The model’s horizontal resolution is set at 40 m. The average fluid depth is assumed to be 1000 m. The grid consists of 501 × 501 lattice points, covering an area of 20 × 20 km2. The time step for the simulation is 0.1 s, with the output of results at every 1 s interval, and the total integration time is 2 min.

2.2. Initial Field of Tornado

The tornado wind model in this study was derived from the equilibrium between the pressure gradient force and the inertial centrifugal force in an ideal perturbation geopotential height field. Given that a tornado is characterized by a depression system with an extremely steep pressure gradient, the geopotential height field perturbation is configured to decay exponentially from the center outward. The mathematical expression for this configuration is as follows:
ϕ = ϕ 0 e c r 3 ,
where c represents the attenuation coefficient, and ϕ 0 denotes the perturbation geopotential height at the tornado’s center. The variable r is used to indicate the distance of an air particle from the tornado’s center. Considering the extremely strong pressure gradient force typically found in tornadoes, this model uses r3 for more accurate representation. Once the perturbation geopotential height field is established, the wind field in a rectangular coordinate system can be determined. In the context of a cyclostrophic wind condition, where the pressure gradient force and the inertial centrifugal force are in equilibrium, the relationship between the velocity of the cyclostrophic wind and the geopotential height in a polar coordinate system is expressed follows:
V c 2 = ϕ n r ,
where V c refers to the speed of cyclostrophic wind; ϕ n refers to the geopotential height gradient of the polar coordinate system; and in the rectangular coordinate system, r = x 2 + y 2 .
The relationship between the geopotential height gradient in the polar coordinate system and that in the rectangular coordinate system:
ϕ = ϕ n r = ϕ x i + ϕ y j ,
Hence, the conversion relation between the geopotential height gradient in the polar coordinate system and that in the rectangular coordinate system is
ϕ n 2 = ϕ x 2 + ϕ y 2 ,
and
V c 2 = u 2 + v 2 ,
u 2 + v 2 = ϕ x 2 + ϕ y 2 x 2 + y 2 ,
Equations (10) and (11) are substituted into Equation (8) to obtain Equation (12).
As illustrated in Figure 1, consider the position coordinates of an air particle in the rectangular coordinate system to be (x,y). Let θ represent the angle between the line connecting these coordinates to the origin and the x-axis. Using these definitions, we can establish the relationship x, y, u, and v as follows:
tan θ = y x = u v .
Substitute Equation (13) into Equation (12) and derive the expression of u and v as follows:
u = y ϕ x 2 + ϕ y 2 x 2 + y 2 1 4 ,
v = x ϕ x 2 + ϕ y 2 x 2 + y 2 1 4 .
Utilizing Equations (7), (14) and (15), we can determine the perturbation geopotential height field and the perturbation wind field at the initial moment of the simulation. Setting ϕ 0 as −800 gpm, we obtain an idealized perturbation geopotential height and perturbation wind, as illustrated in Figure 2. Figure 2a depicts the initial perturbation, which has a diameter of approximately 700 m. This dimension aligns closely with the typical scale of actual tornadoes. Figure 2b,c show the corresponding wind field, with a maximum wind speed of approximately 100 m s−1. This speed also mirrors real-world tornado scenarios, reflecting the model’s accuracy in simulating tornado-like conditions. The initial background field of the model is a static atmosphere. This is represented by setting the background geopotential height uniformly to 1000 gpm across the entire field and assuming an initial wind speed of 0 m s−1.
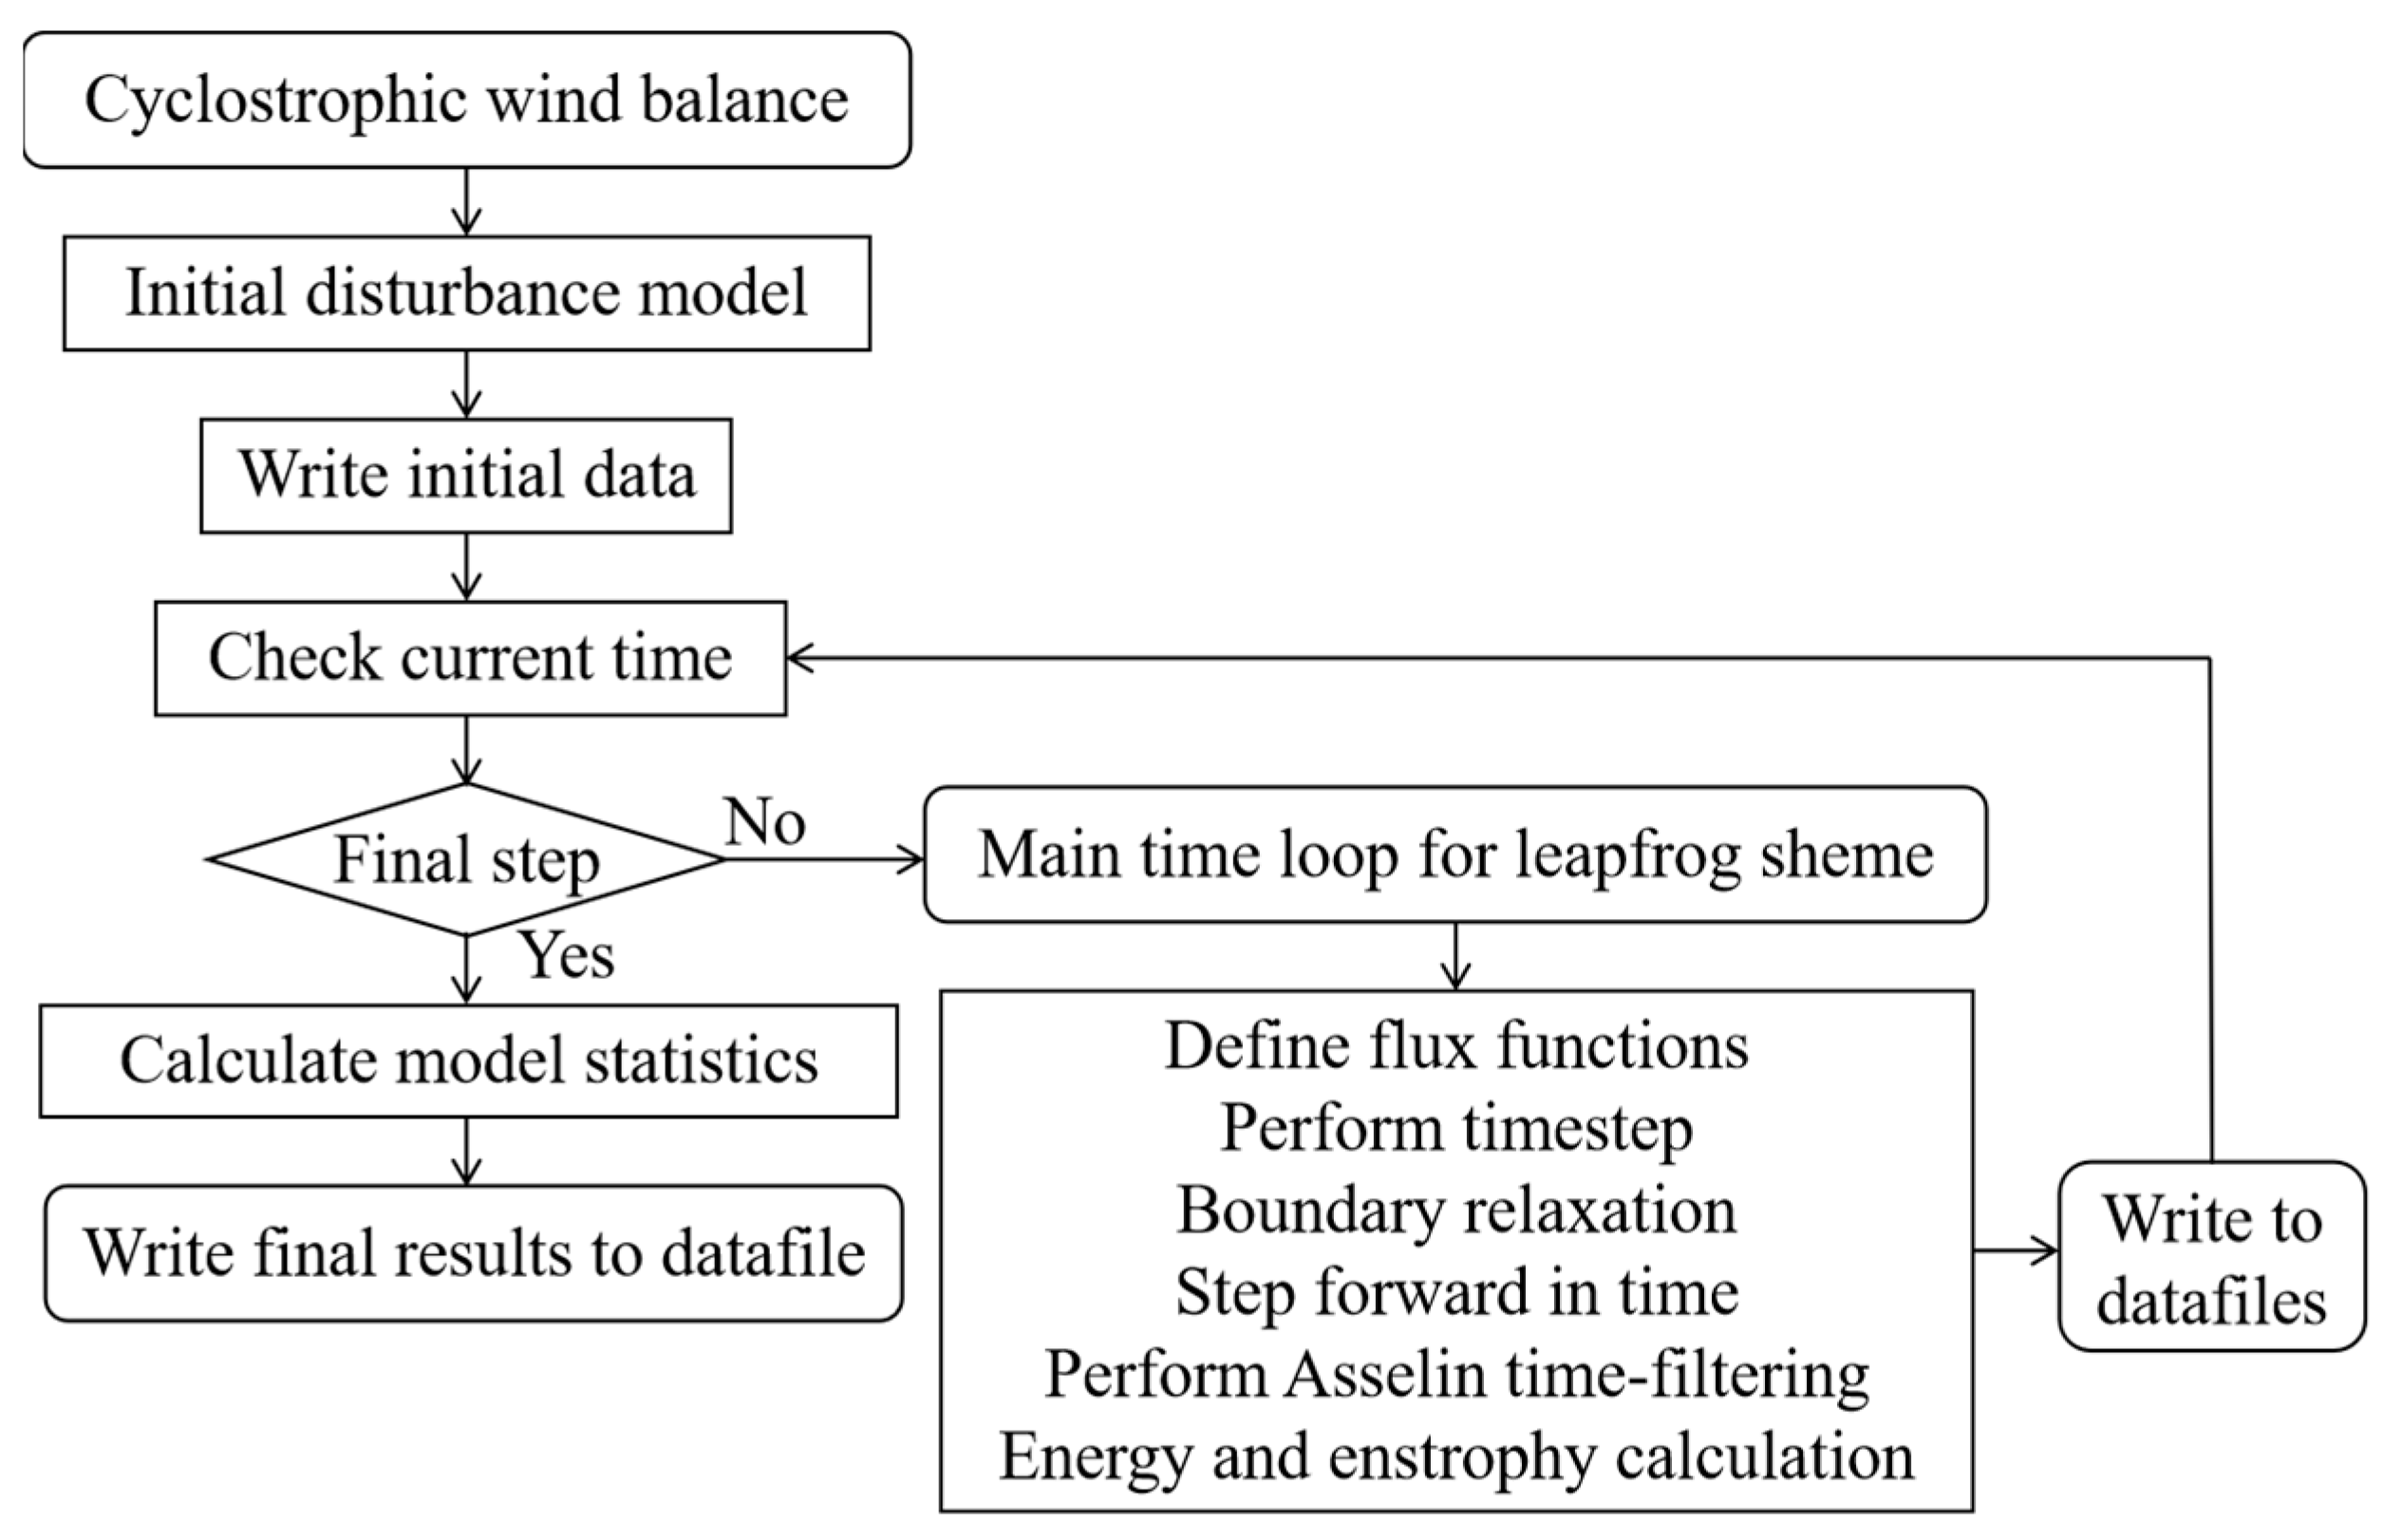
Based on Section 2.1 and Section 2.2, the technical route of this paper is shown as Figure 3:

2.3. Experiment Protocol

In this study, we designed four idealized experiments to study the formation and development of tornadoes. The specifics of each experiment protocol are summarized in Table 1. These experiments involved varying the initial field and the Coriolis parameter to create three sets of comparative tests. In EXP1, we used a cyclonic wind field as the initial condition without an equilibrium geopotential height field. The Coriolis parameter, f, was set as 7.292 × 10⁻⁵ s−1. The results from EXP1 serve as a basis for comparison with the other three experiments. The EXP2 setup involved a geopotential height field without an equilibrium wind field, also with f set at 7.292 × 10⁻⁵ s−1. This allowed for the analysis of the evolution of a single pressure field in comparison to EXP1. Similar to EXP1, in EXP3, we used a cyclonic wind field as the initial condition without an equilibrium geopotential height field, but with f set to 0. This design helps analyze the influence of the Coriolis force on tornado development in comparison to EXP1. In EXP4, we used an anticyclonic wind field as the initial condition without an equilibrium geopotential height field, with f again at 7.292 × 10⁻⁵ s−1. This helped analyze the evolution process of anticyclonic wind perturbation in comparison to EXP1. All experiments were conducted against a backdrop of a static atmospheric field.

3. Numerical Simulation

3.1. EXP1

3.1.1. Geopotential Height

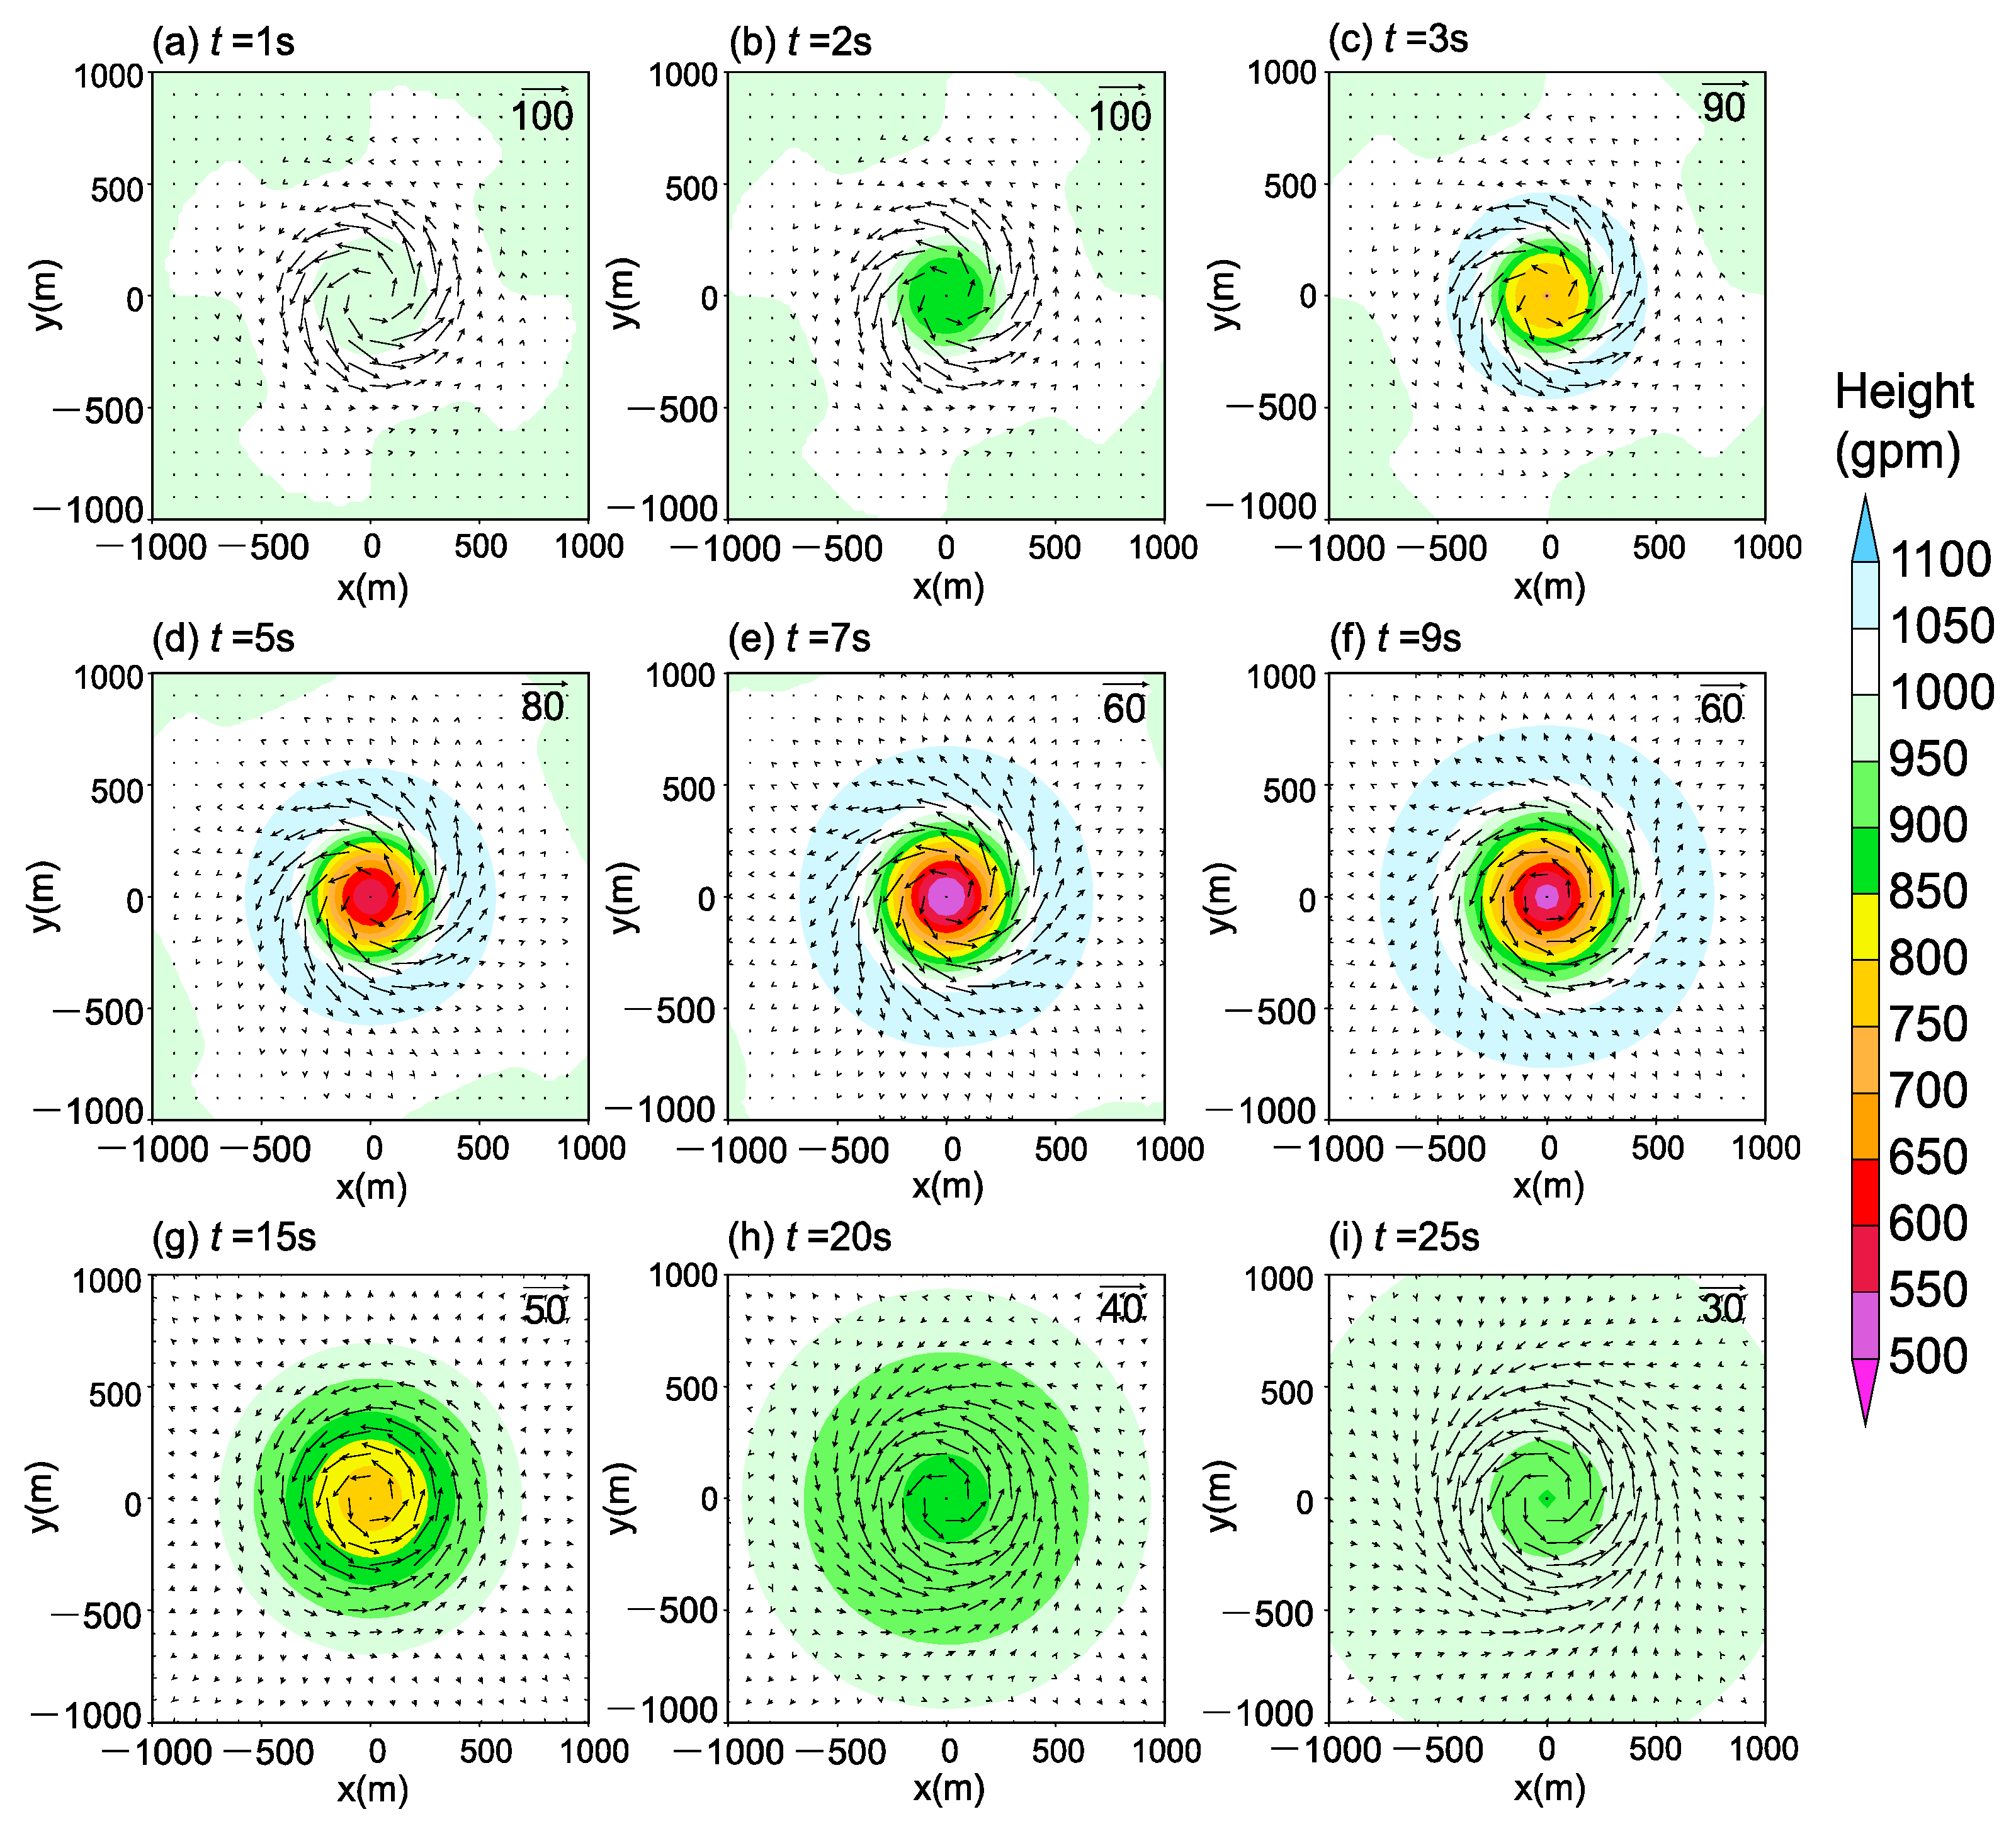
Figure 4 illustrates the evolution of the geopotential height and wind during the EXP1 simulation. This experiment demonstrates the effects of a strong cyclostrophic wind field on the central geopotential height of a cyclone. At t = 1 s, there was a slight decrease in the central geopotential height. At t = 2 s, the central geopotential height had dropped below 900 gpm. At t = 3 s, it further decreased to below 750 gpm. The minimum value was reached at t = 7 s, falling below 550 gpm, which resulted in a strong pressure gradient. Subsequently, the central geopotential height began to gradually increase, reaching above 850 gpm by t = 25 s. Throughout the simulation, the wind speed consistently decreased due to dissipative effects. The maximum wind speed in the field dropped from the initial 100 m s−1 to 60 m s−1 at t = 7 s and to 30 m s−1 when t = 25 s. The wind field transitioned from a non-divergent state to an outwardly divergent cyclonic rotation. During the intense depression development stage, specifically from t = 3 to 7 s (Figure 4c–e), the peripheral geopotential height of the system increased, exceeding the average fluid depth. EXP1 successfully simulated a tornado-like depression system characterized by extremely low central pressure and a strong pressure-gradient structure.
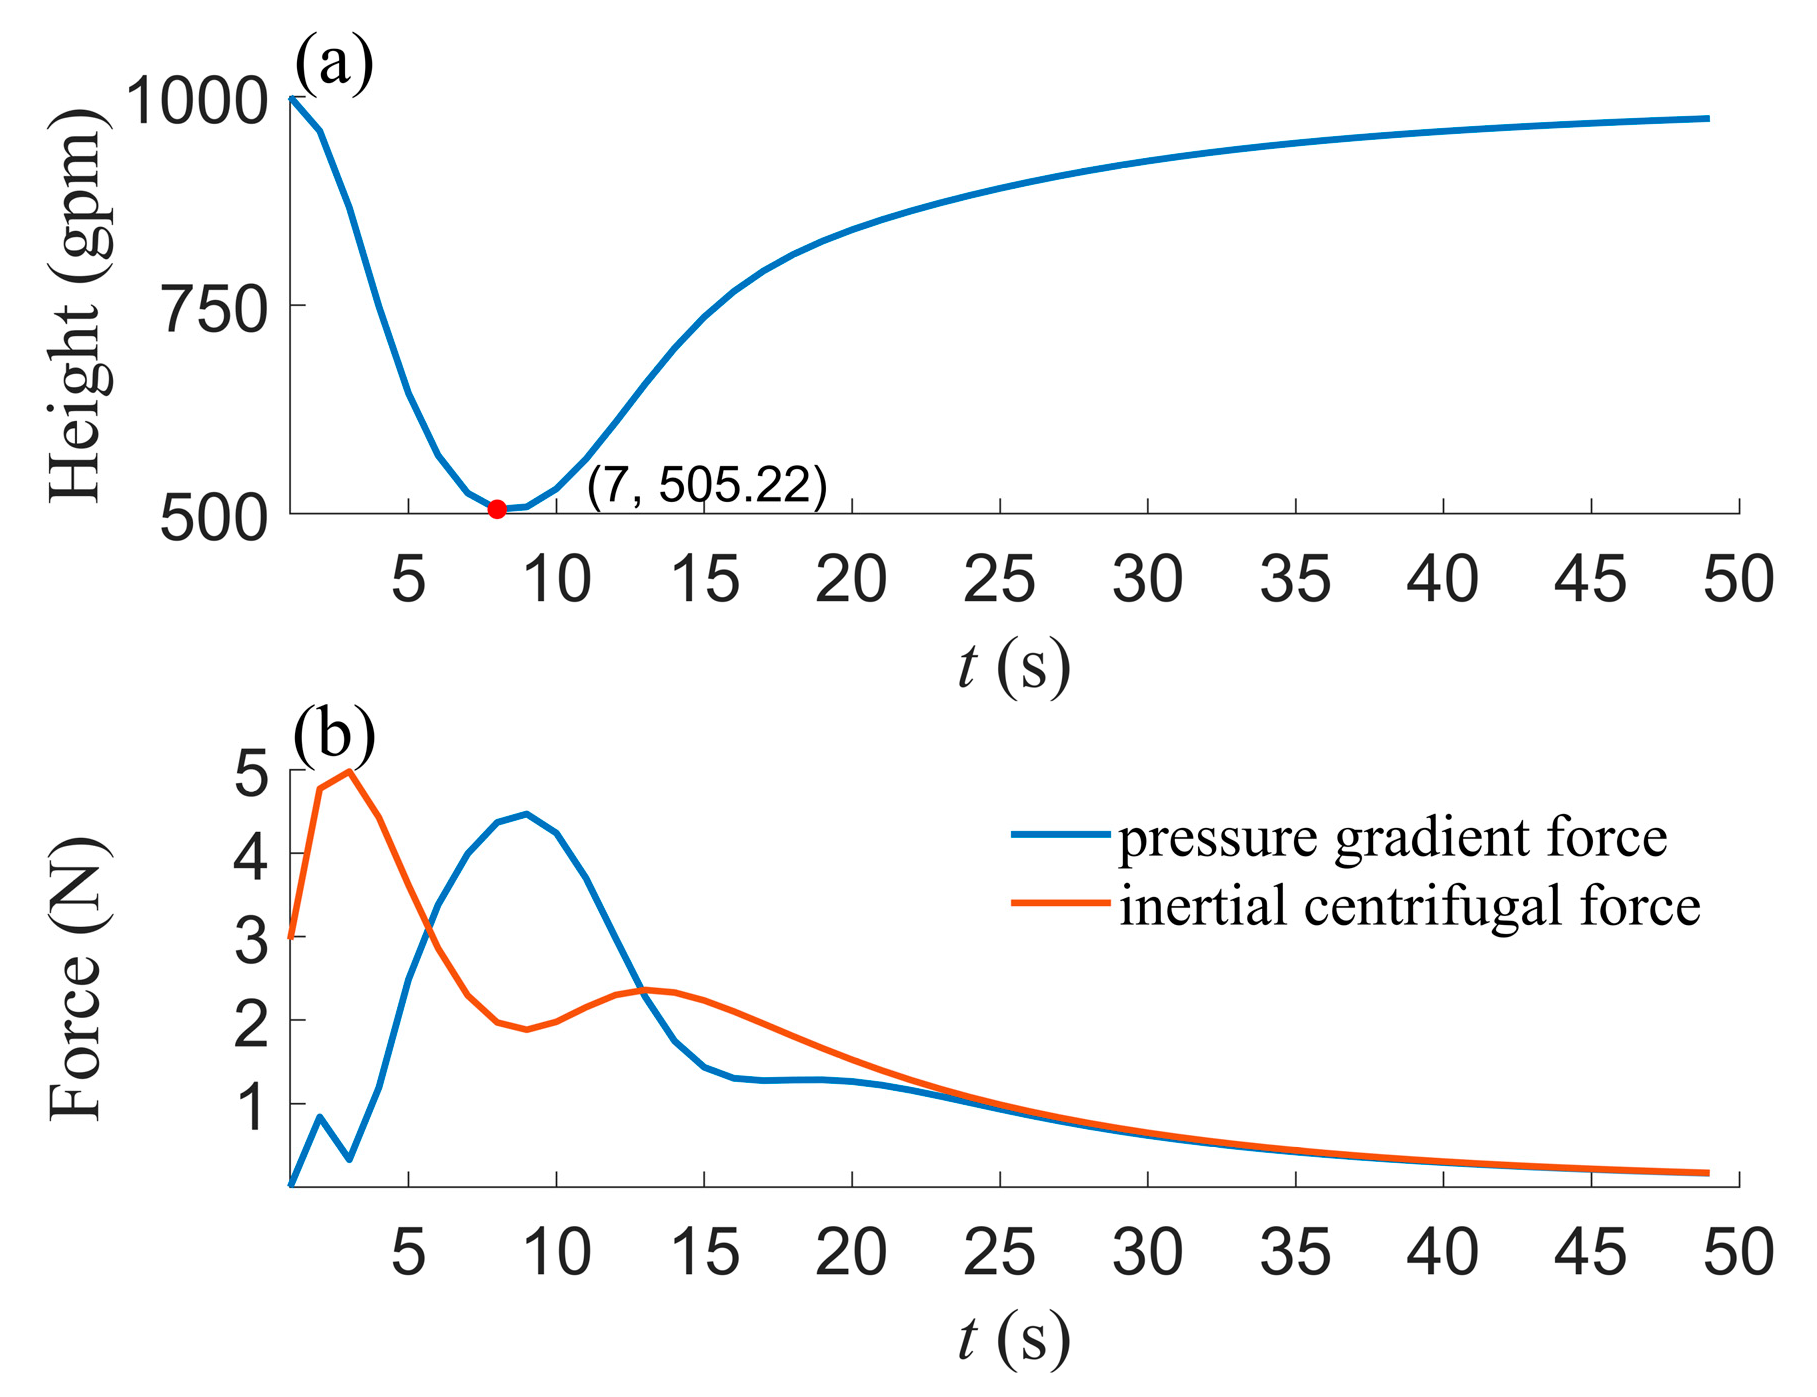
Figure 5a provides a detailed view of the temporal changes in the central geopotential height during the EXP1 simulation, illustrating the dynamics of the tornado-like system’s geopotential height. The variation in geopotential height over time is characterized by a parabolic shape. The geopotential height of the center rapidly decreased when the simulation began, reached its lowest value of 505.22 gpm a t = 7 s, and then rapidly increased to nearly 800 gpm before continuing to slowly increase. After t = 40 s, the geopotential height approached the average fluid depth, stabilizing around 1000 gpm.
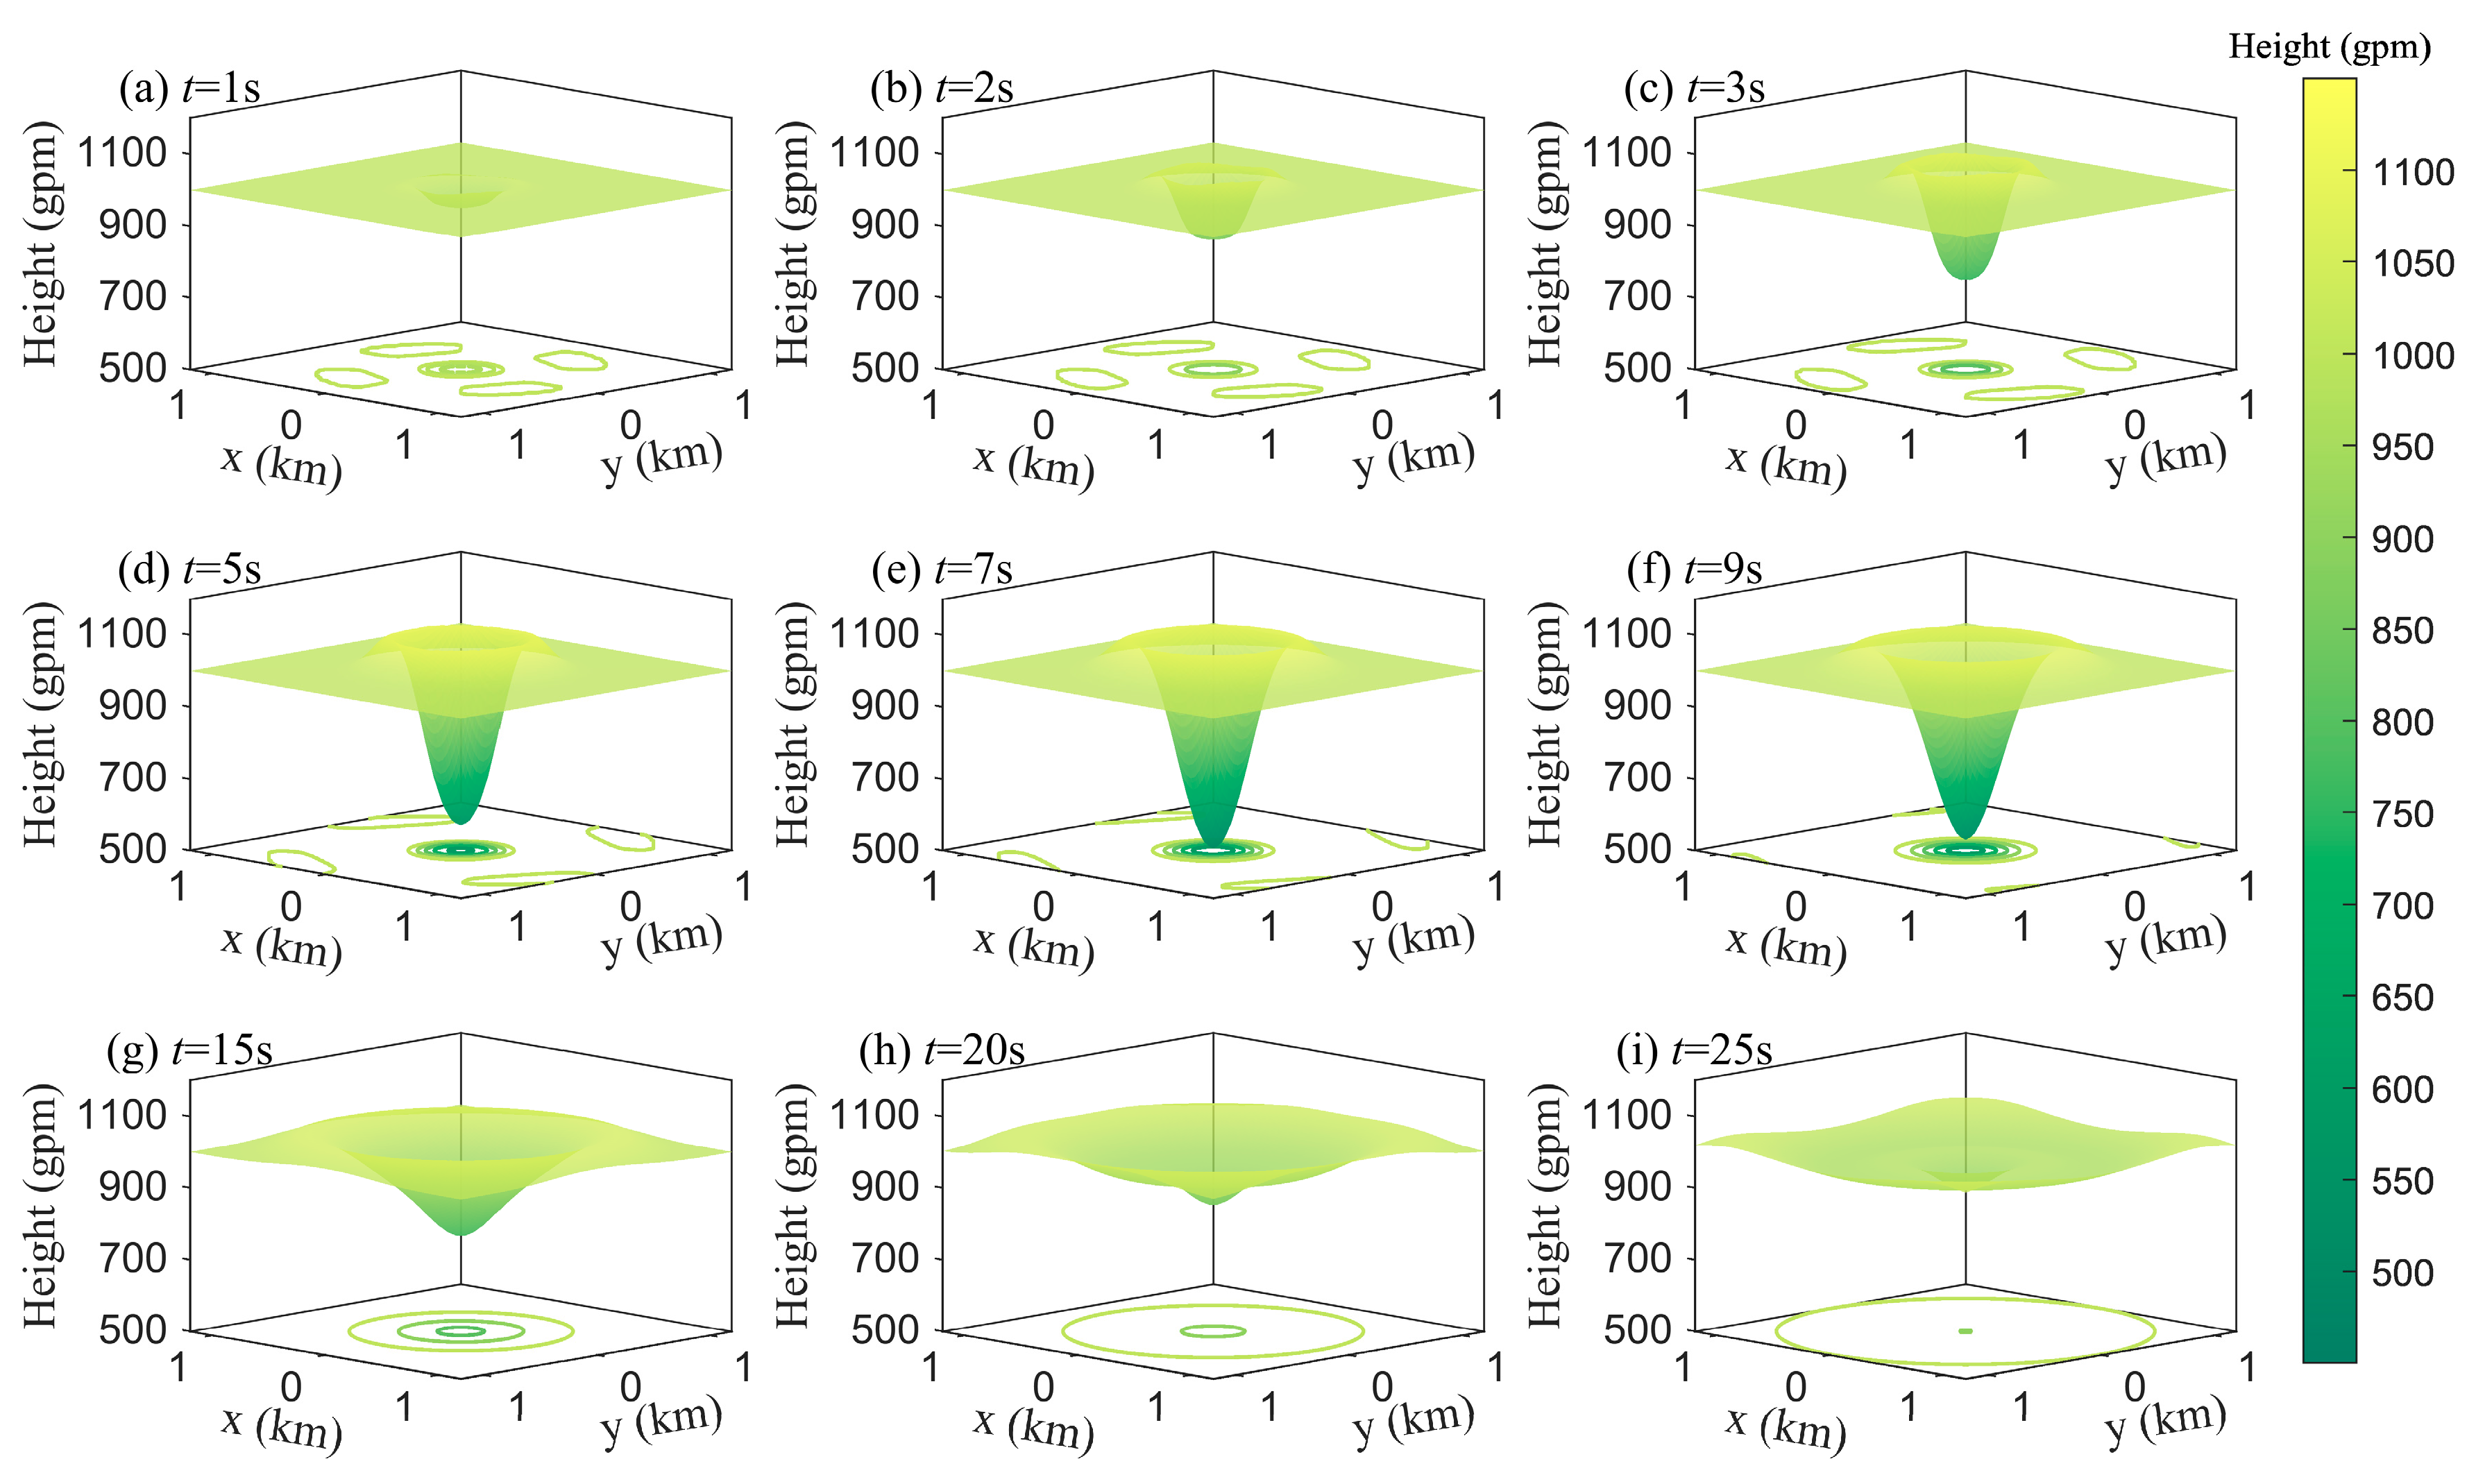
Figure 6 presents a 3D structure chart of the geopotential height, vividly illustrating the development of a tornado-like funnel-shaped structure from top to bottom. Initially, the surface geopotential height was set at 1000 gpm. As the simulation progressed, the surface geopotential height at the center of the perturbation rapidly decreased, leading to the formation of a funnel-like structure characteristic of a tornado. This formation can be attributed to the high-speed rotation of air, generating substantial centrifugal force. Initially, the pressure field failed to quickly develop an inward pressure gradient force to counterbalance this centrifugal force, resulting in the outward flow of air due to centrifugal action. This outward flow led to a decrease in the mass of the air column near the center, causing a drop in pressure (or a decrease in geopotential height), consequently forming a depression. This dynamic is clearly evidenced when comparing the centrifugal force and pressure gradient force, as shown in Figure 4b. Until approximately t = 6 s, the centrifugal force exceeded the pressure gradient force. After this point, at t = 13 s, the pressure gradient force became greater than the centrifugal force, leading to airflow convergence and the eventual filling of the depression. This phenomenon aligns with real atmospheric behaviors. In convective clouds, strong horizontal vortex tubes tilt, creating vertical vorticity. The resulting high-speed rotation of the air causes the pressure field to lag in balancing with the centrifugal force, leading to air flowing outward from the vortex center and forming a strong depression. Notably, the equilibrium process of the pressure field adapting to the wind field can be completed within a few seconds, as demonstrated under the influence of the wind field perturbation in our simulation.
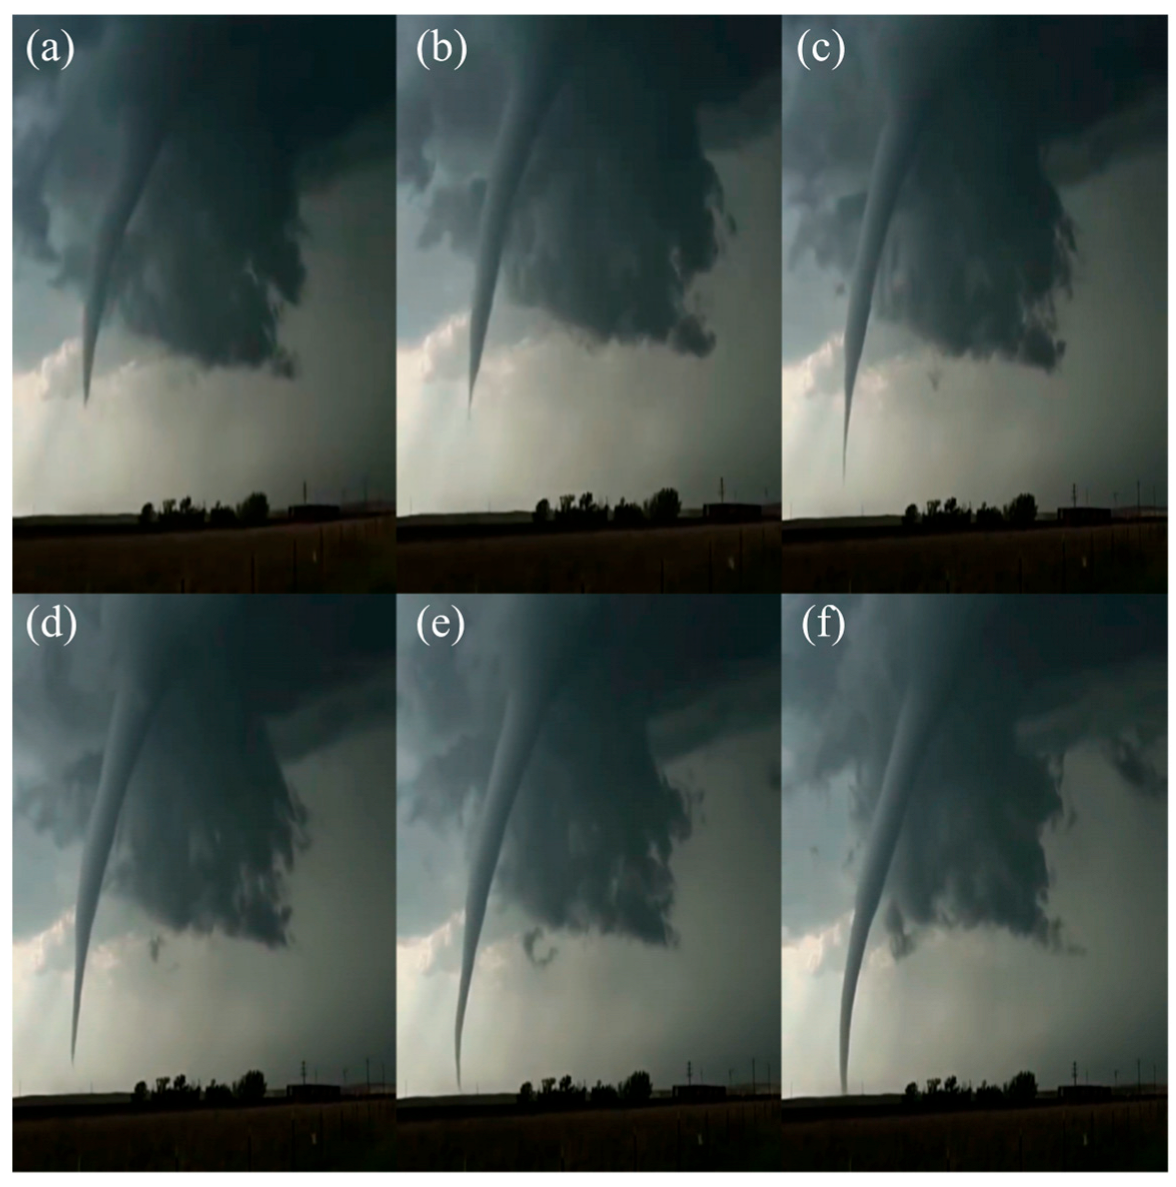
Figure 7 features a video snapshot captured during a tornado event in Dafeng District, Yancheng, Jiangsu Province of China, on 13 August 2023. The video commences with the funnel-shaped cloud already mid-air. Analysis of the footage reveals that the tornado’s funnel descended rapidly from mid-air to the ground, taking approximately 6 s from the start of the recording to touchdown. This observation suggests that the entire descent from the cloud base to the ground likely took more than 10 s. Comparatively, this real-world tornado’s development timeline closely aligns with our simulation results. In the simulation, the tornado-like structure developed its most intense stage within approximately 7 s following the initial perturbation.

3.1.2. Divergence and Vorticity

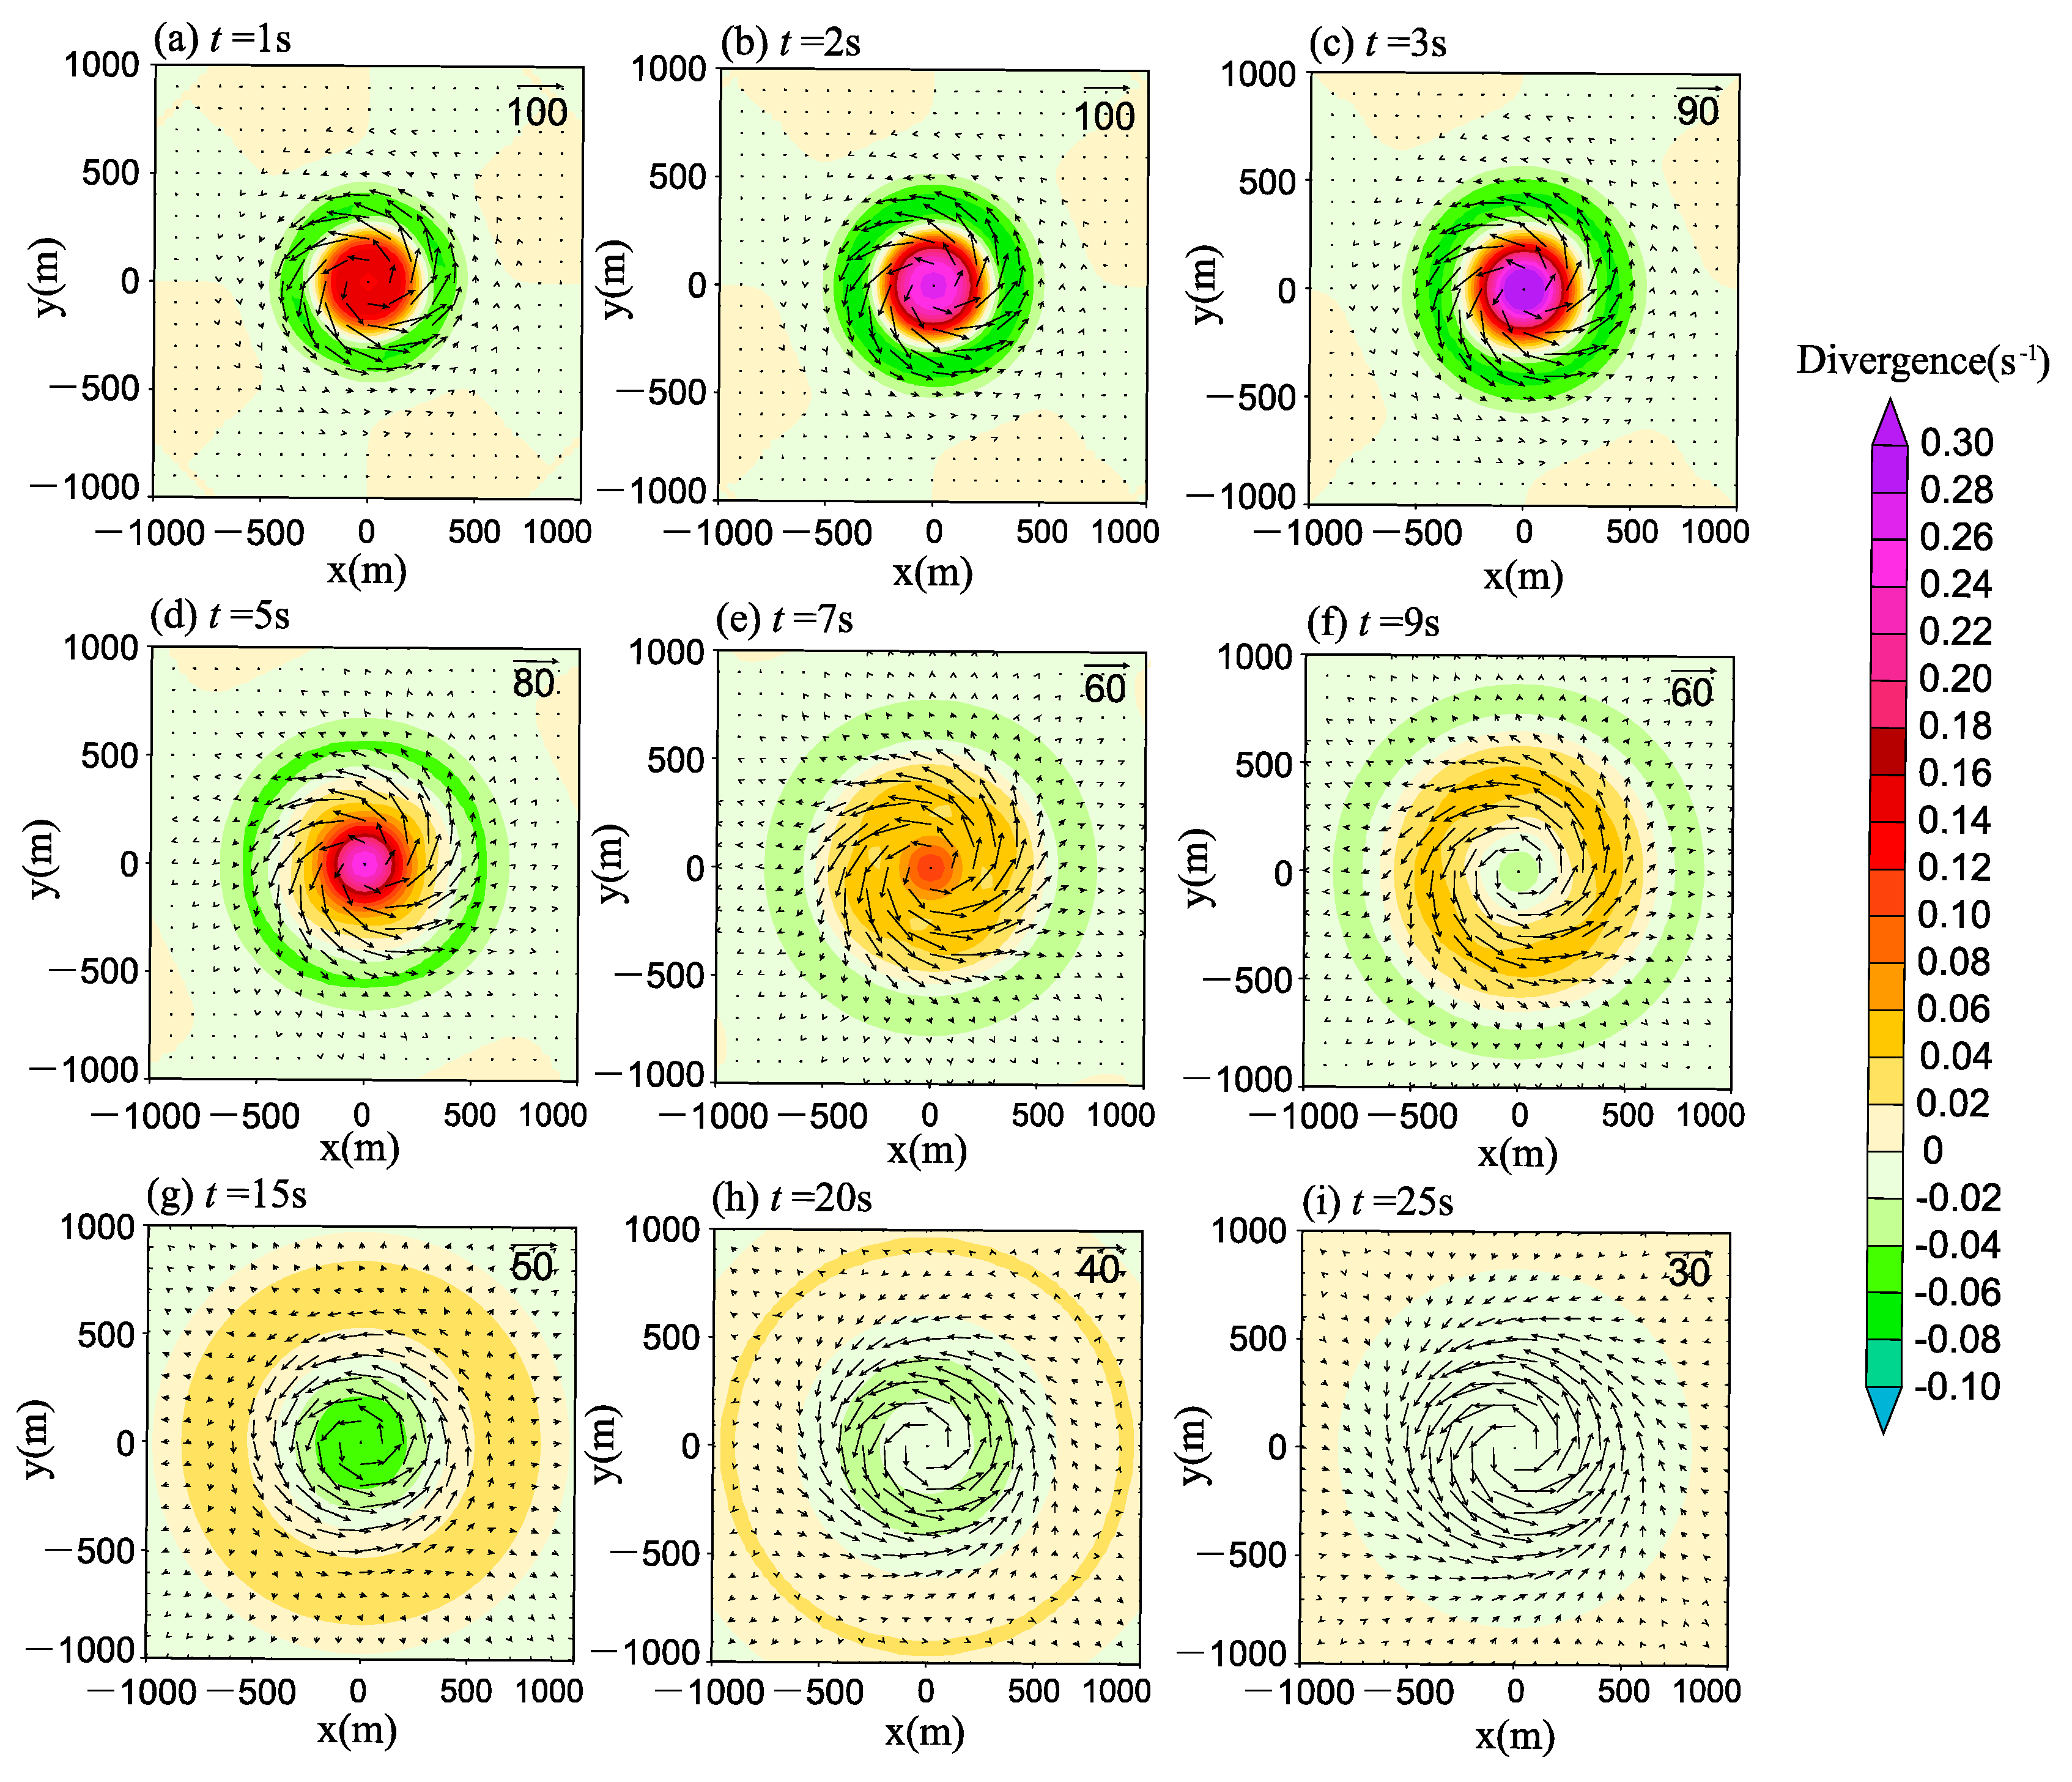
Figure 8 illustrates the evolution of the divergence field during the EXP1 simulation, shedding light on the airflow dynamics, particularly the outflow from the central region. Initially, the cyclostrophic wind field exhibited vorticity but no divergence. However, as the simulation progressed, the air began to diverge and flow outward. The tornado-like depression-intensification stage (t = 1–7 s, Figure 7a–e) is marked by increasing divergence at the tornado-like structure’s center. The divergence area’s radius gradually expanded, reaching approximately 250 m for regions with divergence greater than 0.1 s−1. The maximum divergence value recorded was 0.3 s−1 at t = 3 s, which was approximately 104 times higher than the magnitude of large-scale divergence of 10−5 s−1. A ring of convergence formed outside the divergence region, corresponding to the high geopotential height area seen in Figure 4. This convergence, along with the increase in geopotential height, indicates air accumulation and an increase in the mass of the air column.
At the peak of the tornado-like structure (t = 7 s, Figure 8e), the central divergence value was 0.12 s−1, with a radius of approximately 500 m for the divergence region. Post t = 7 s, the divergence region expanded rapidly outward while decreasing in intensity. By t = 9 s, the center began to show signs of convergence. As the divergence area expanded outward, the wind speed decreased, and the centrifugal force also decreased. Consequently, due to the inward pressure gradient force, air converged inward, filling the depression region and further diminishing the tornado-like activity. At t = 25 s (Figure 8i), the tornado-like activity tended to dissipate, and the divergence approached 0.
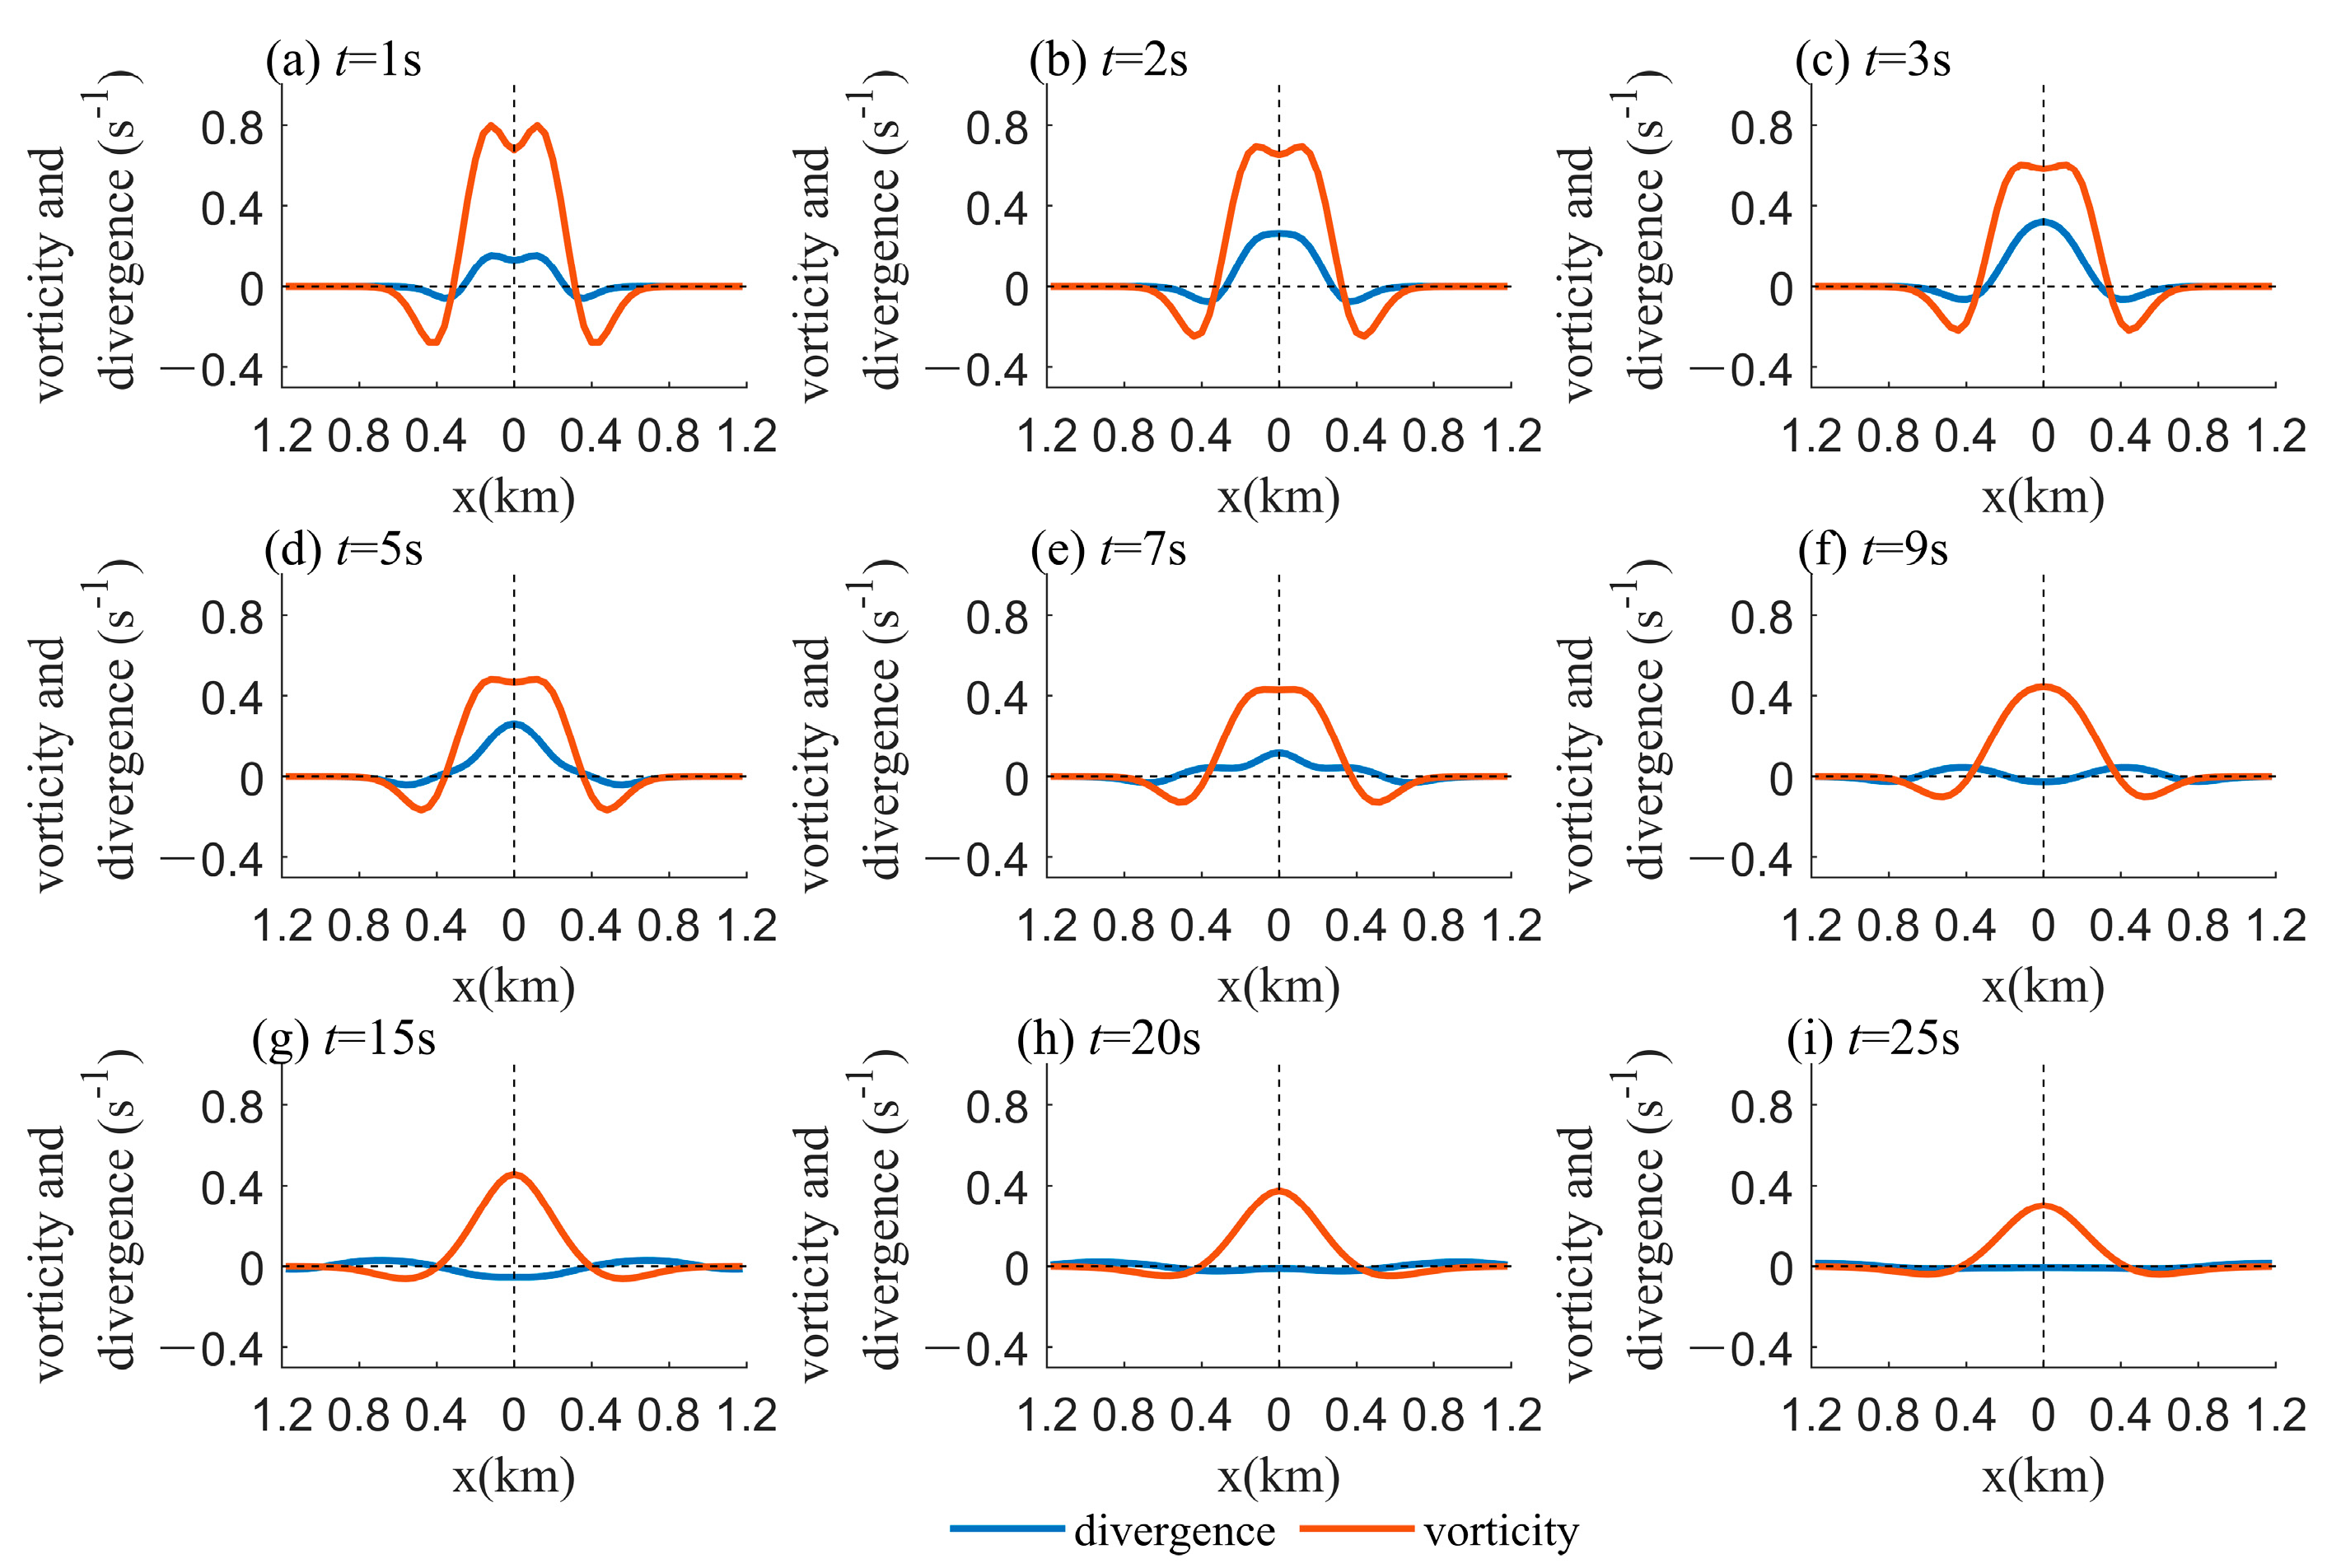
Figure 9 depicts the east–west distribution of divergence and vorticity through the center of the tornado-like structure at various stages of the simulation. At t = 1 s, the maximum divergence value was located approximately 100 m from the vortex center. It then rapidly moved toward the center. The central region exhibited positive vorticity, peaking at a distance of approximately 100 m from the vortex center. The vorticity value decreased from roughly 0.8 s−1 at t = 1 s to around 0.4 s−1 at t = 7 s. This maximum vorticity magnitude was nearly 104 times greater than the typical large-scale vorticity. Interestingly, a region of negative vorticity formed on the outer side of the positive vorticity area. This was primarily due to the negative shear created by the rapid decrease in wind speed along the radial direction, particularly near the 400 m mark outside the tornado-like vortex.

3.2. EXP2

After the equilibrium of atmospheric motion was disrupted, the wind field and pressure field adjusted to each other and reestablished a new equilibrium relationship. The wind field adapted to the pressure field in large-scale motion, while the pressure field adapted to the wind field in small-scale processes. EXP1 indicates that strong cyclonic wind field perturbations can excite the tornado-like depression structure. EXP2 was designed to investigate whether a tornado-like wind field structure could emerge solely from geopotential height perturbation in the absence of a strong cyclonic wind field. In this experiment, f = 7.292 × 10⁻⁵ s−1, the background geopotential height was 1000 gpm, and the geopotential height at the depression center after the perturbation was added was 200 gpm.
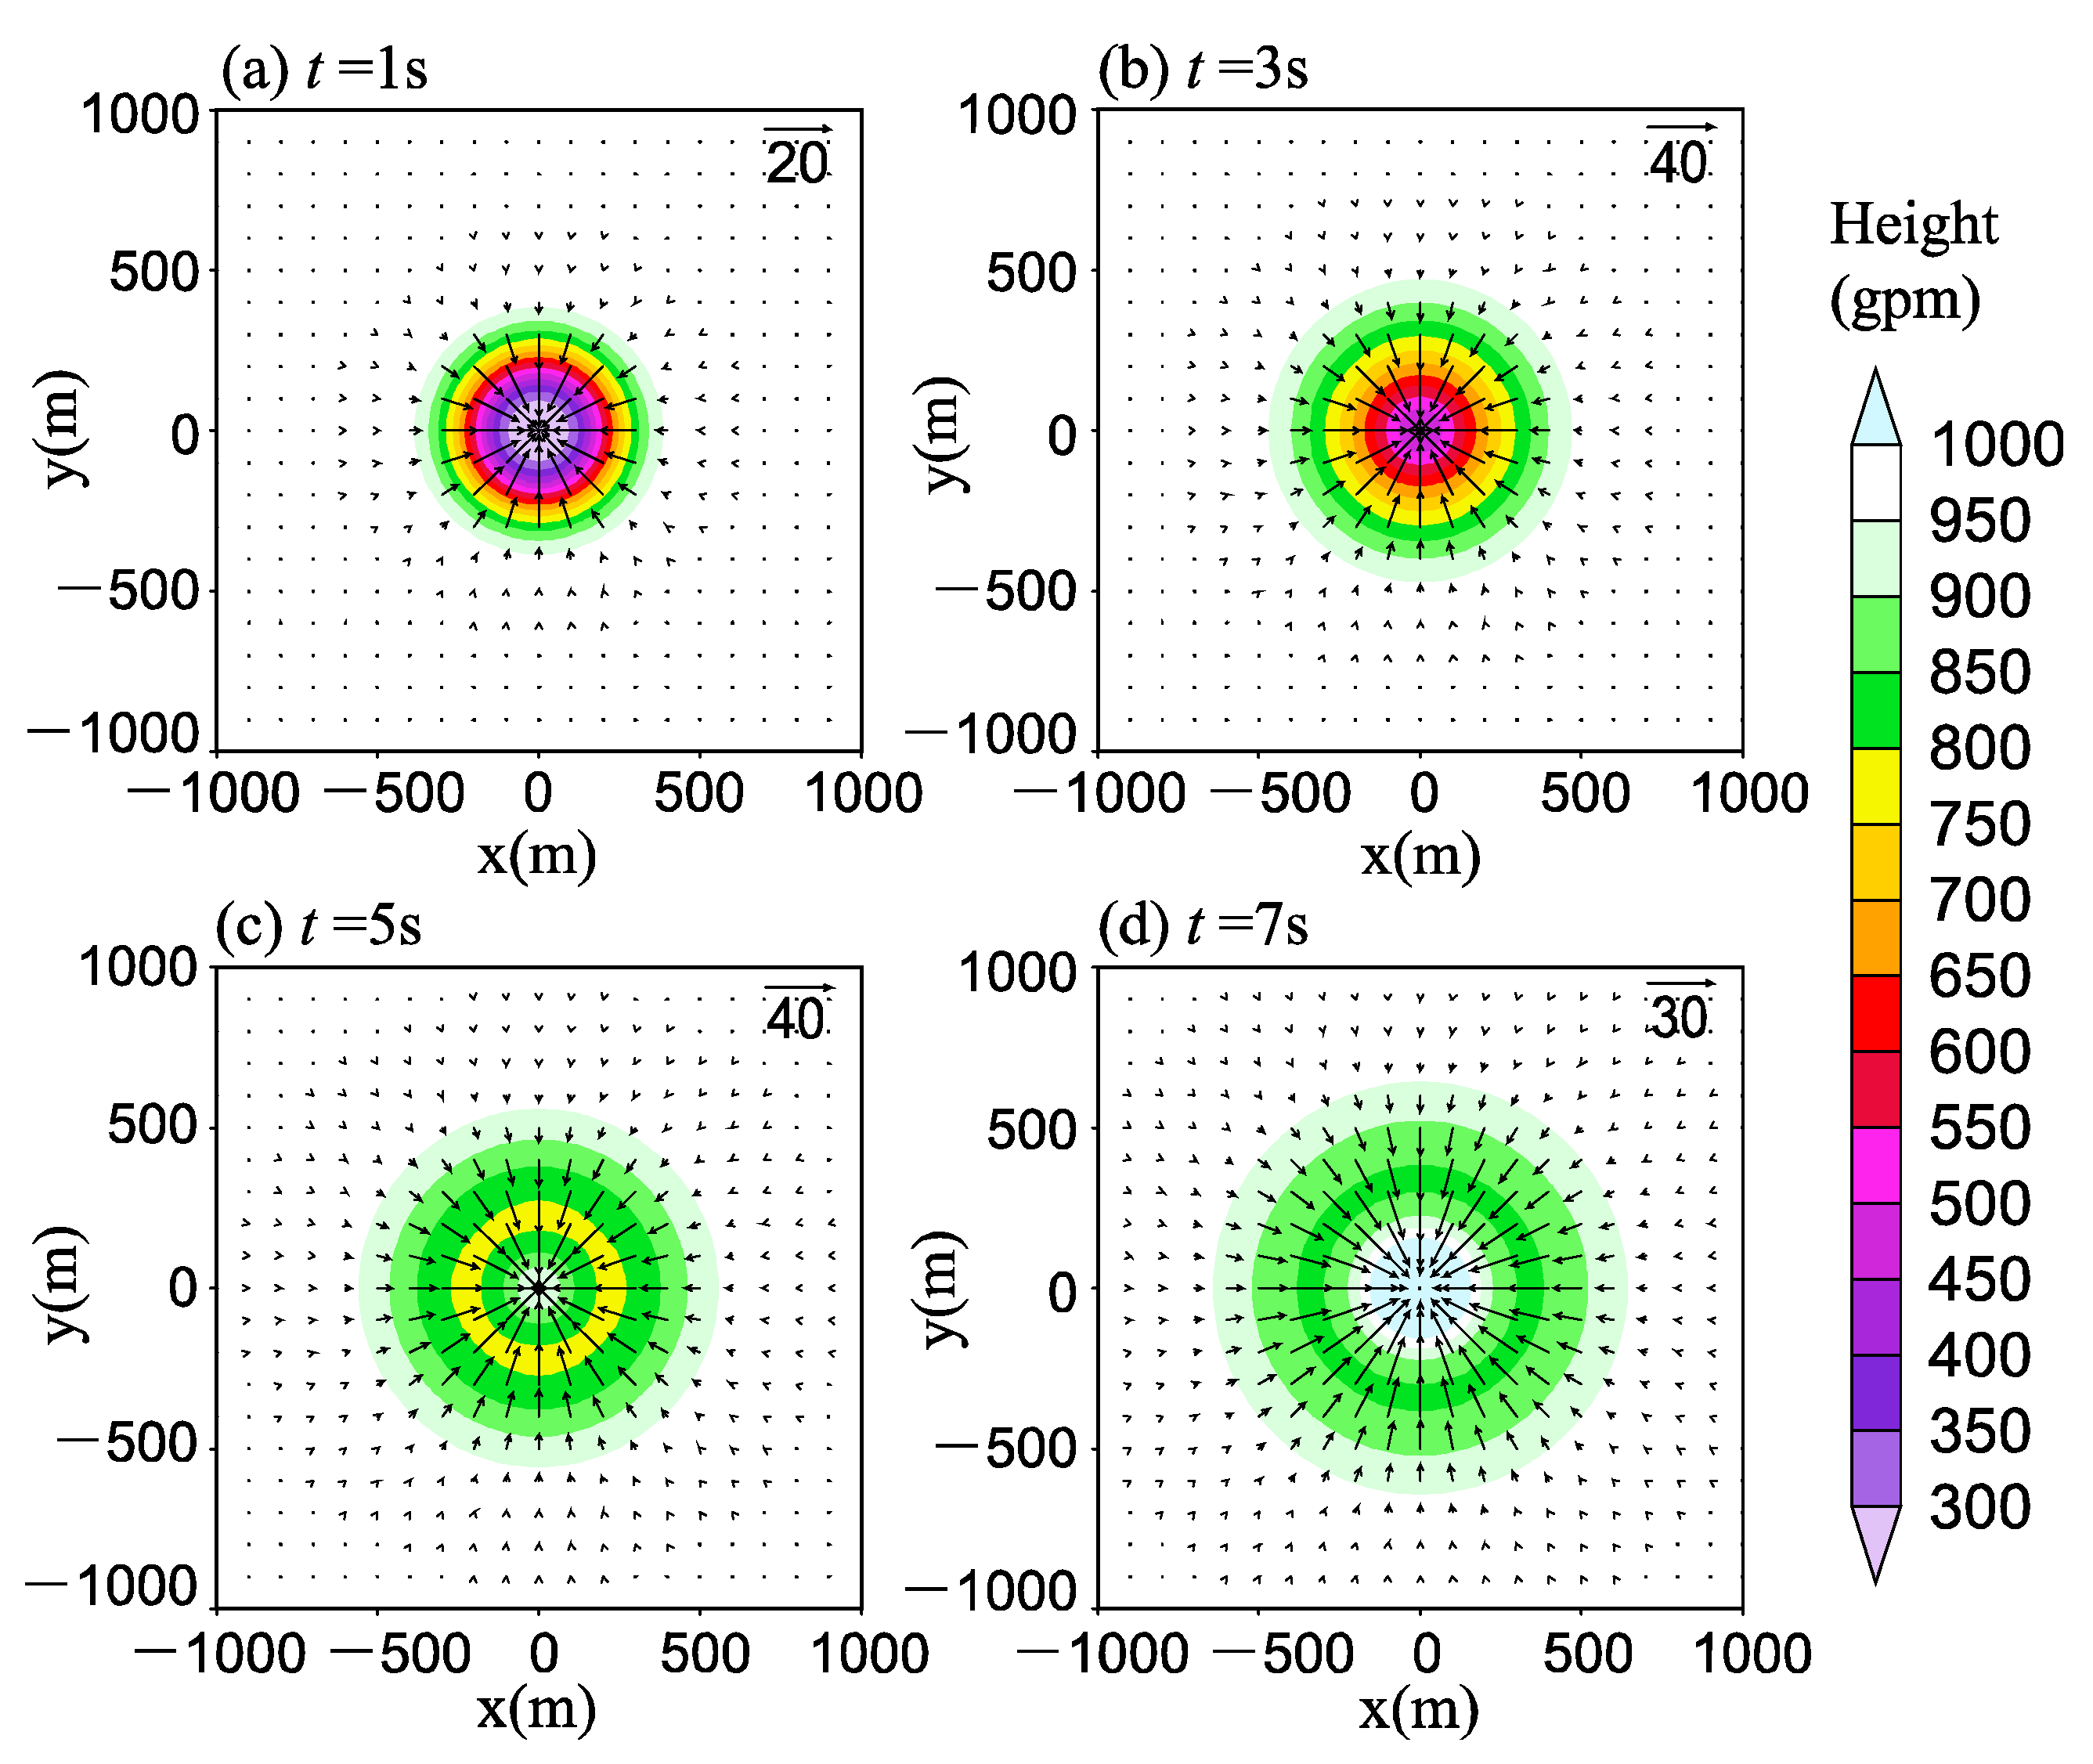
Figure 10 shows the geopotential height field and wind field in the EXP2 simulation. At the beginning of the integration, the geopotential height perturbation quickly excited a purely radial wind field without generating a rotating wind. The maximum wind speed initially increased, peaking at around 40 m s−1 at t = 3 s, before subsequently decreasing. The peak wind speed occurred several hundred meters from the center, leading to strong central convergence, and divergence outside the maximum radial wind speed zone. Due to air convergence, the central region’s geopotential height increased rapidly. By t = 3 s, it rose to above 450 gpm, eventually transforming into a high-pressure center by t = 5 s. The divergence outside the maximum radial wind speed resulted in a decrease in geopotential height, forming “high–low–high” patterns in the geopotential height structure. EXP2 failed to simulate the vortex flow field of the tornado, suggesting that under small-scale conditions, even with a large Coriolis parameter, simple atmospheric pressure perturbations cannot evolve into tornado vortices. This suggests that tornadoes likely develop in convective clouds only if a strong rotating wind field emerges, creating an extremely low-pressure field due to centrifugal force action. The Coriolis force, while not crucial in the formation of small-scale tornadoes, may play a role in the mesoscale system of the tornado’s parent environment.

3.3. EXP3

The effect of the Coriolis force decreases with the scale of the system, but at which scale can it be neglected? EXP3 designed 16 tests by increasing the diameter of the vortex. The specifics of each experiment protocol are summarized in Table 2. The vortex scales of EXP3.1 to EXP3.8 are gradually increased from 0.56 km to 112.8 km, and the Coriolis parameter of these eight sets of experiments is taken as 0. EXP3.9 to EXP3.16 are designed as the control group considering the effect of Coriolis force, for which the Coriolis parameter is taken as 7.292 × 10⁻⁵ s−1. Since the vortex maintenance time becomes longer as its scale increases, the integration time is extended accordingly. EXP3.1 to EXP3.4, and EXP3.9 to EXP3.12 were integrated for 240 s; EXP3.5 to EXP3.7, and EXP3.13 to EXP3.15 were integrated for 80 min; and EXP3.8 and EXP3.16 were integrated for 2 h.
EXP3.1 was designed to delve deeper into the influence of the Coriolis force on tornado formation. This was achieved by setting the Coriolis parameter to 0 in the same setup as EXP1.
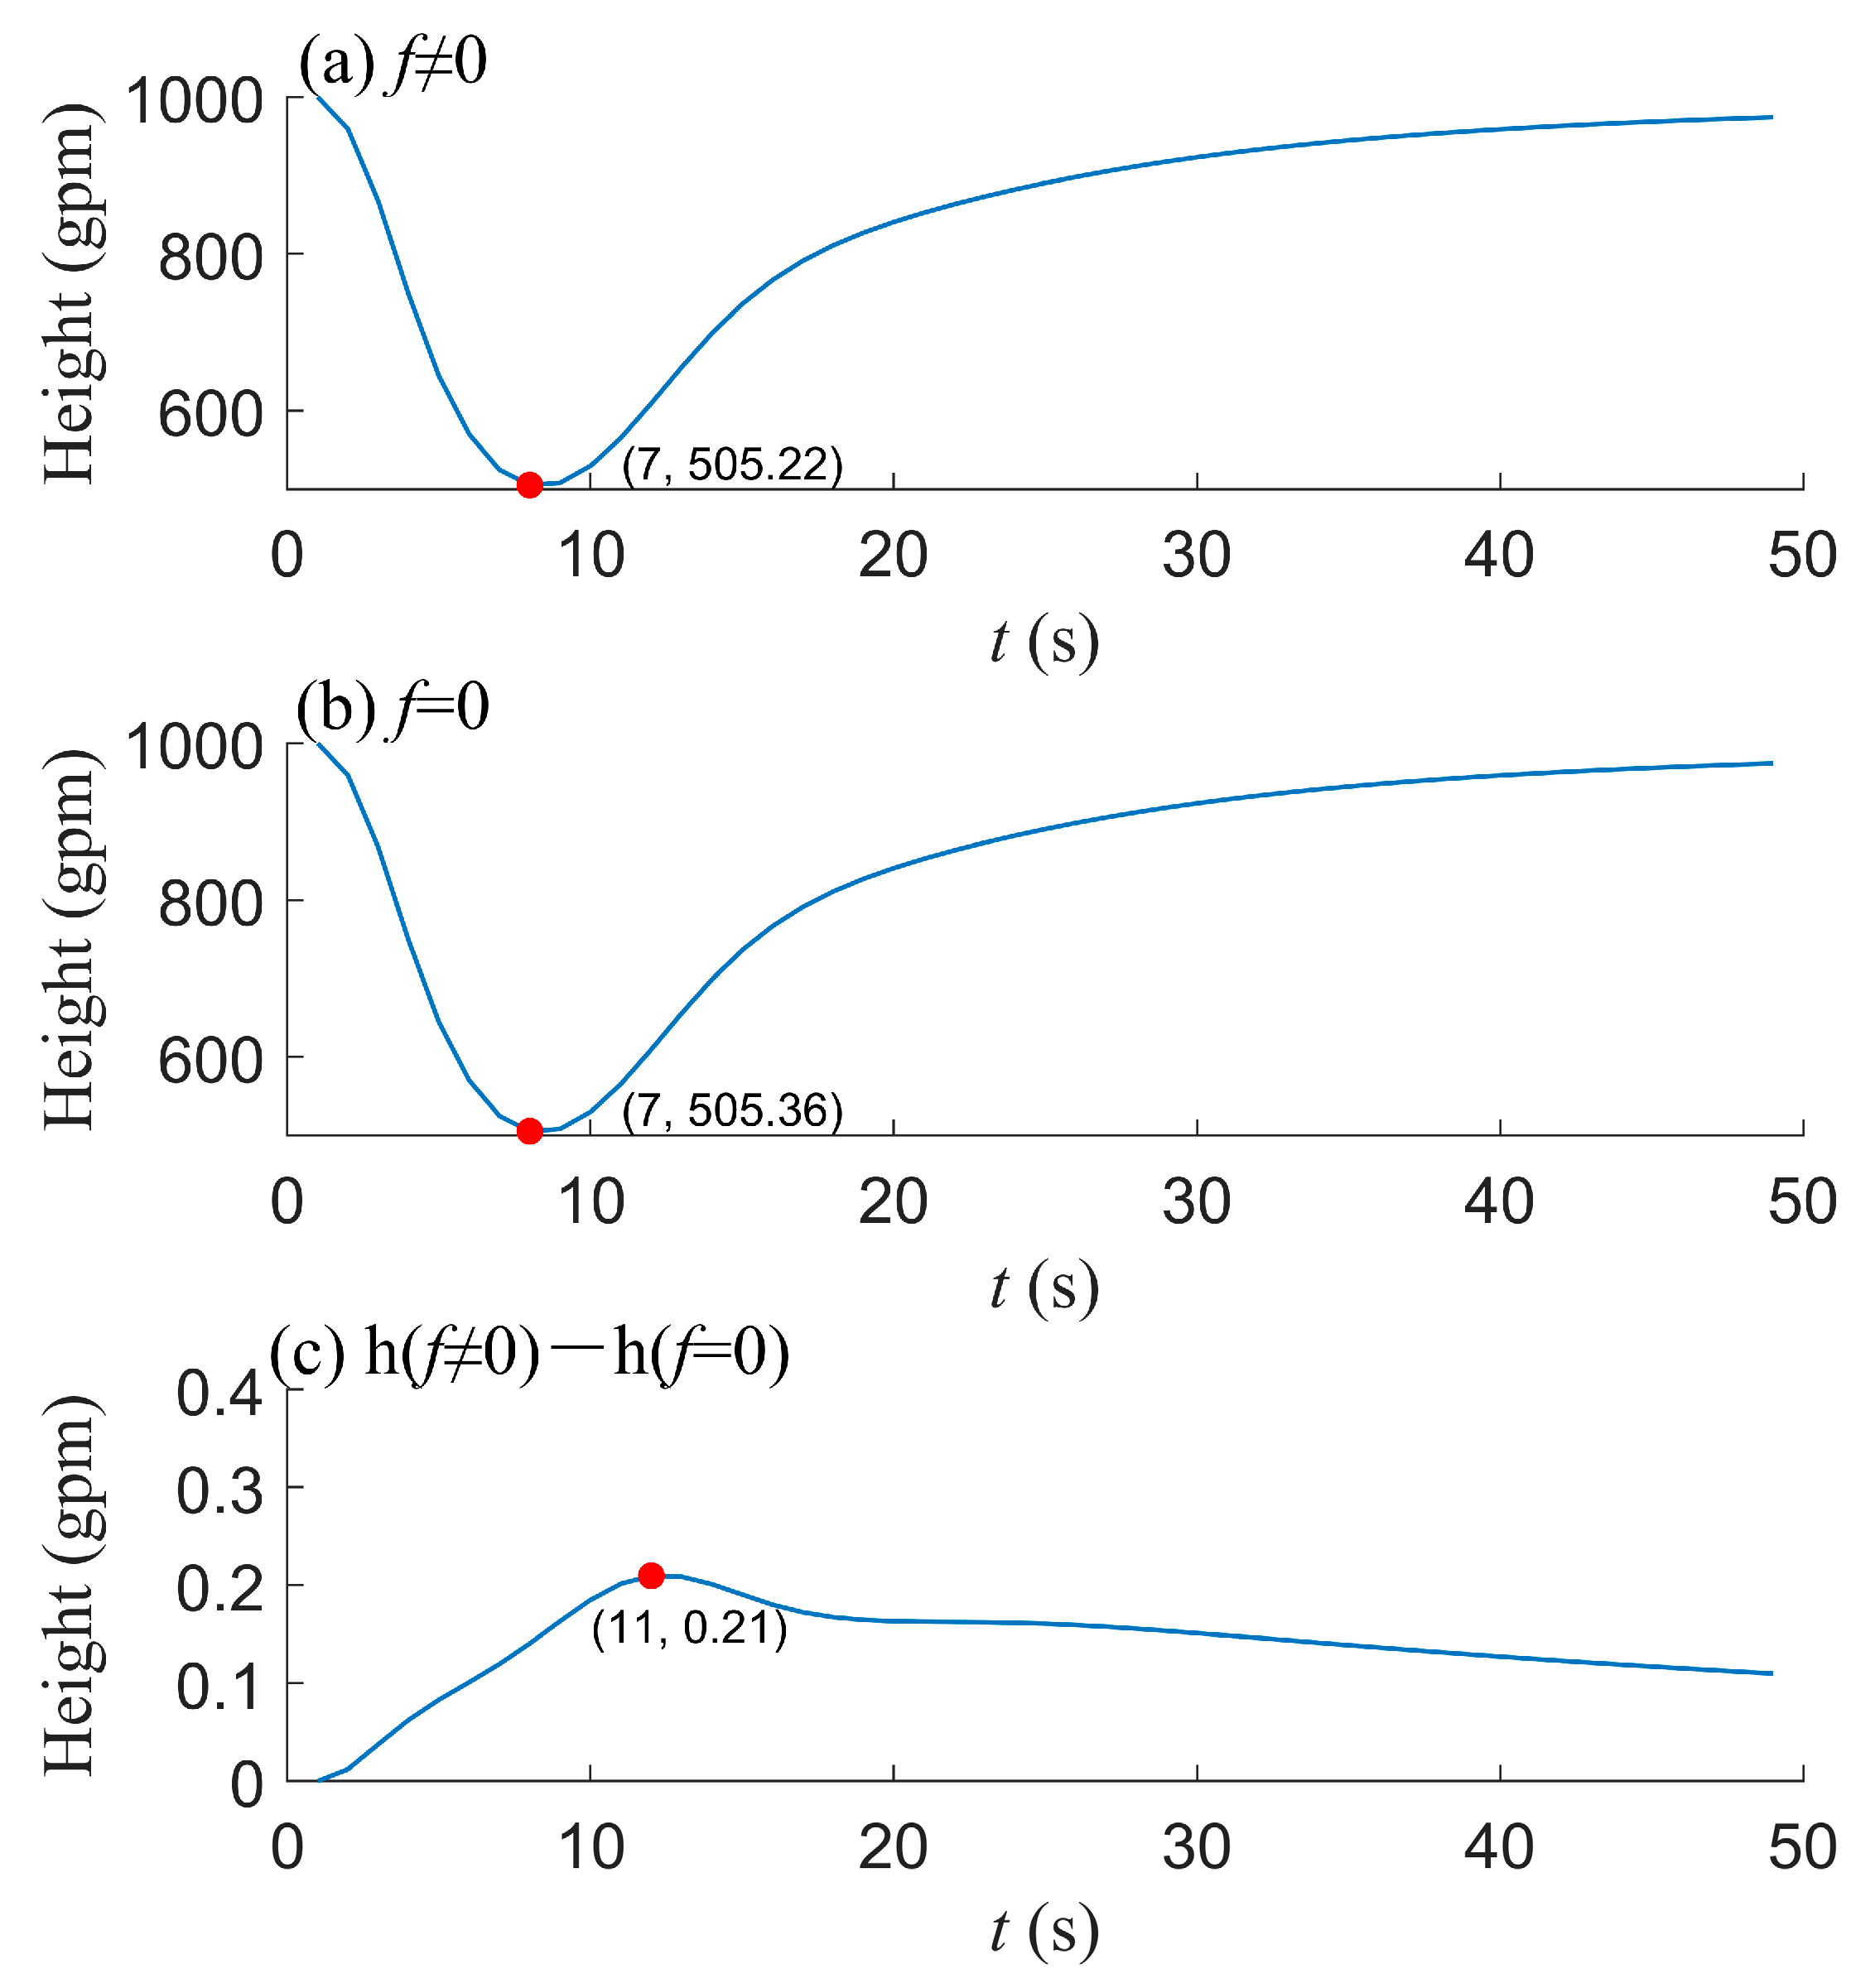
EXP3.1 yielded a tornado-like structure akin to that observed in EXP1. Figure 10a,b display the temporal trends of the vortex center’s geopotential height in EXP1 and EXP3.1, respectively. Figure 11c highlights the differences between the two simulations over time. In EXP3.1, under the influence of the rotating wind, the geopotential height at the vortex center rapidly declined, reaching its lowest point of 505.22 gpm at t = 7 s, before gradually recovering. Comparatively, the lowest geopotential height in EXP1 was 505.36 gpm, showing a negligible difference. The maximum geopotential height difference between the two experiments was 0.21 gpm at t = 11 s. This minor discrepancy underscores the limited impact of the Coriolis force on the formation of the tornado’s core structure.
Figure 12(a1–a16) show the potential height along the axis of the vortex when the potential height drops to its lowest, and Figure 12(b1–b16) show the potential height of the vortex center (hmin) over time. As the diameter of the vortex increased, hmin also decreased gradually from 505.36 gpm (Figure 12(b1)) to 251.98 gpm (Figure 12(b8)). In the northern hemisphere, the Coriolis force causes the wind to drift to the right, thus enhances the outward flow of air, so the cyclonic wind field has larger divergence, resulting in lower potential height. Therefore, all hmin in Figure 12(b9–b16) are lower than that in Figure 12(b1–b8).
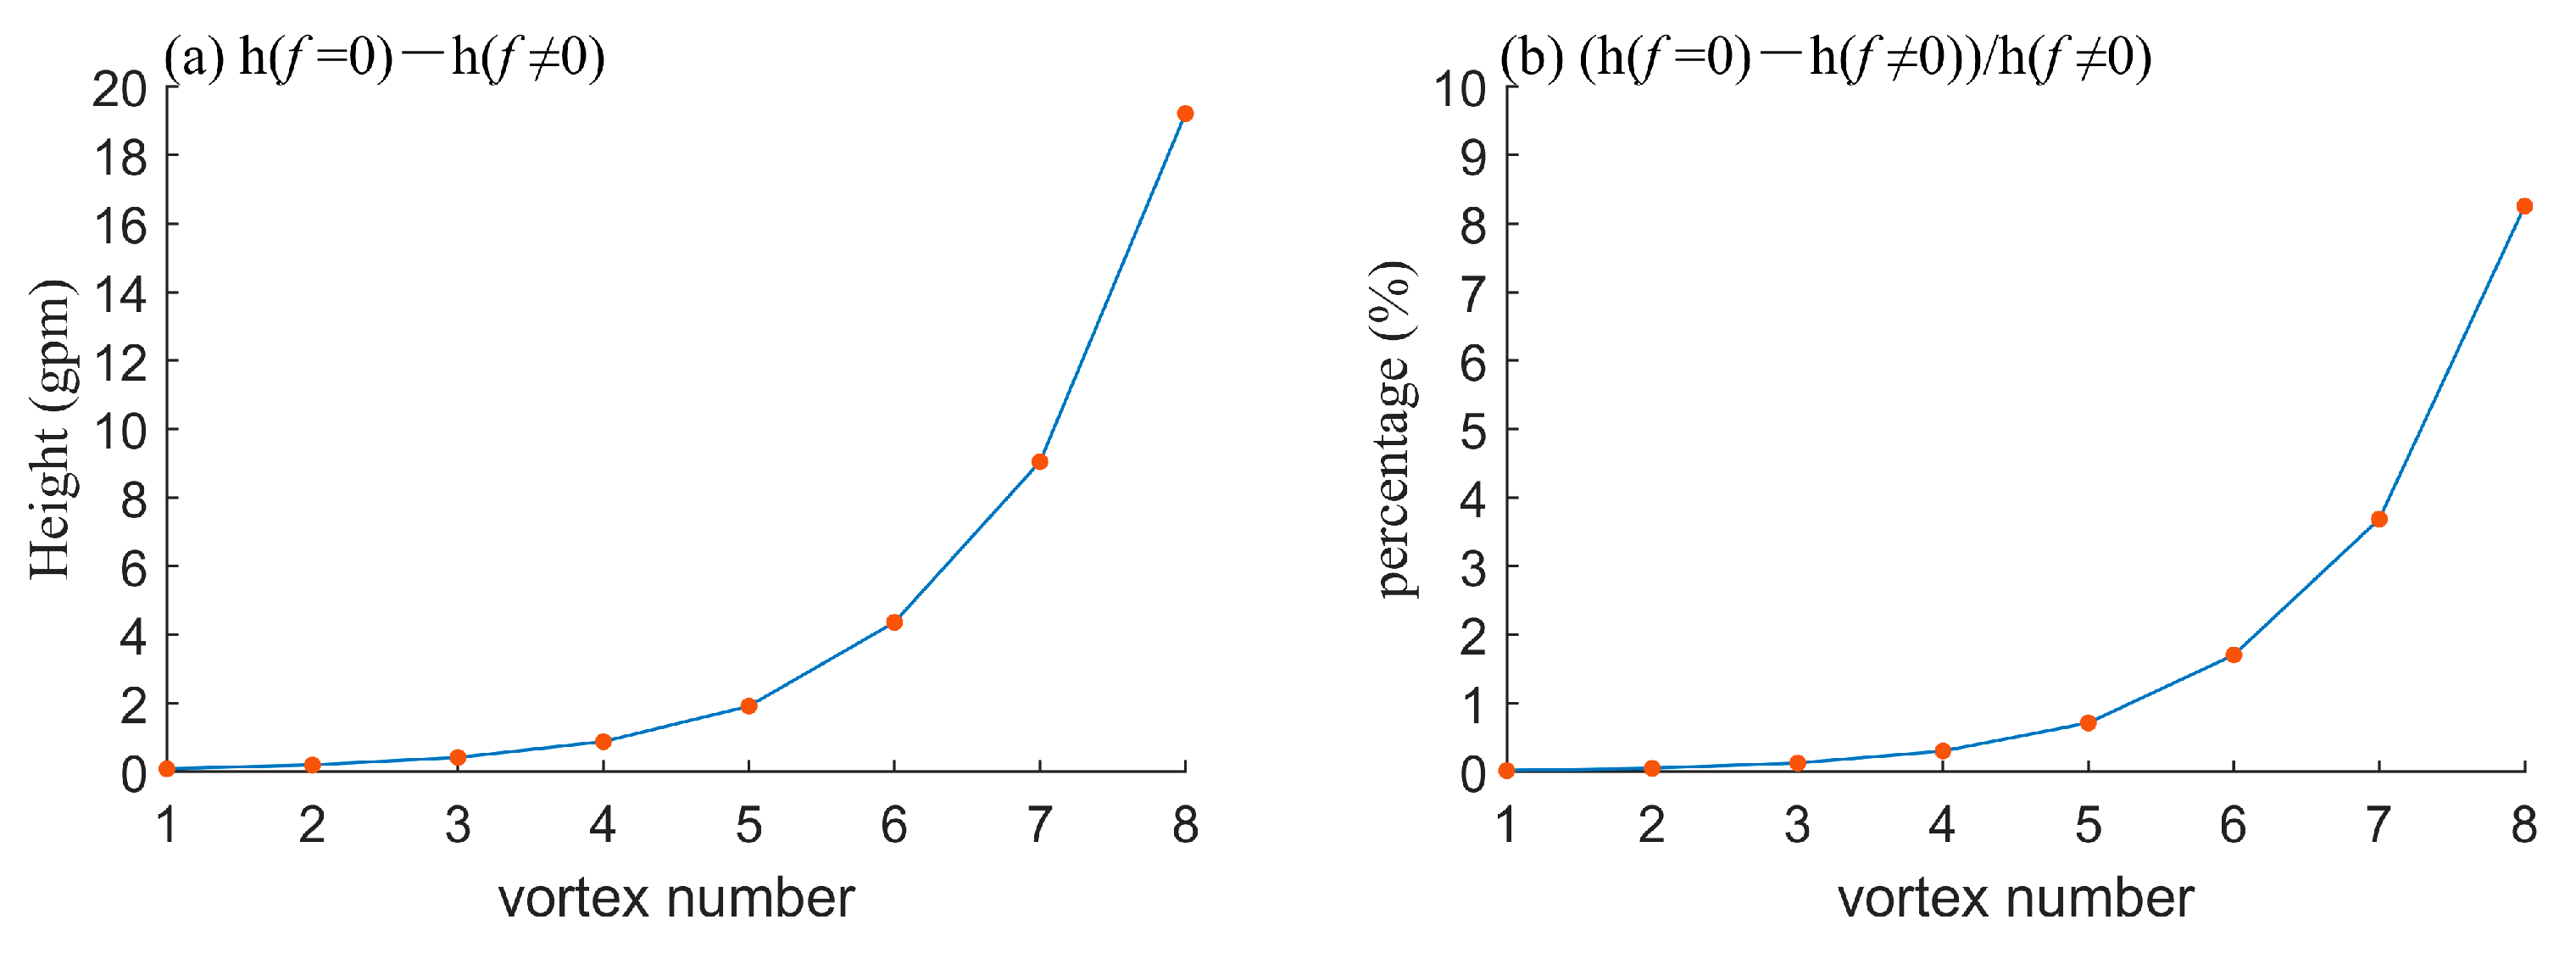
In order to better determine the scale at which the effect of the Coriolis force begins to be significant, the difference between the minimum of hmin for f = 0 and f ≠ 0 (DMH) over the integration time is shown in Figure 13a, and the proportion of DMH to the minimum of hmin (PDMH) is further obtained in Figure 13b. It is clear that DMH is always positive, which means that the hmin of vortices considered the Coriolis force is lower than that of vortices without the Coriolis force. Meanwhile, DMH increased from 0.08 gpm to 19.21 gpm as the scale of the vortex increased. For the first five vortices with diameters less than 20 km, DMH is less than 2 gpm and PDMH is less than 1%, but for the sixth vortex with a diameter of 24.6 km, DMH increases significantly. For the eighth vortex with a diameter of about 110 km, DMH reaches 20 gpm, with PDMH nearly 9%. Therefore, the effect of the Coriolis force is negligible for meso-γ-scale (horizontal scale between 2 km and 20 km) and smaller systems, while for meso-β-scale (horizontal scale between 20 km and 200 km) and larger systems, the Coriolis force has a significant effect.

3.4. EXP4

How anticyclonic tornadoes develop was interesting. The earlier experiments about the possibility of anticyclonic tornadoes were conducted by Ying and Change [41]. Snider [26] recorded a process in which cyclonic and anticyclonic tornadoes coexisted and briefly analyzed their relationship. Monteverdi et al. [33] documented a rare anticyclonic tornado event that occurred in Sunnyvale and Los Altos, San Francisco Bay Area, on 4 May 1998. This was the first time an anticyclonic tornado was recorded by the WSR-88D. Markowski and Richardson [9] indicated that relatively strong low-level vertical wind shear may be necessary for the formation of anticyclonic vortices. This mechanism is similar to the formation of cyclonic vortices, as it is related to the tilting of horizontal vortex tubes formed by vertical wind shear. Bluestein et al. [30] discussed four anticyclonic tornado processes recorded by a Doppler radar in Oklahoma and Kansas and analyzed some of their common characteristics. They believed that the occurrence of anticyclonic tornadoes might have multiple mechanisms like cyclonic tornadoes do. Two cases showed that anticyclones existed in the lower troposphere, and two other cases were not thoroughly analyzed in terms of the existence of anticyclones due to low data quality or the short duration of the tornadoes. The above study indicates that the presence of an anticyclone in the lower troposphere before the occurrence of an anticyclonic tornado may be crucial. For this purpose, an experiment was designed to create small-scale anticyclonic wind field perturbations in EXP4.
While a majority of tornadoes are characterized by cyclonic wind fields, there exist rare instances of anticyclonic tornadoes. These unique phenomena can emerge either from mesoscale anticyclones or occur in tandem with strong mesocyclones or cyclone tornadoes. Given the scarcity of anticyclonic tornadoes, there is a notable gap in data and research surrounding their dynamics. This study aims to address this gap by simulating the development process of anticyclonic tornadoes through an idealized model.
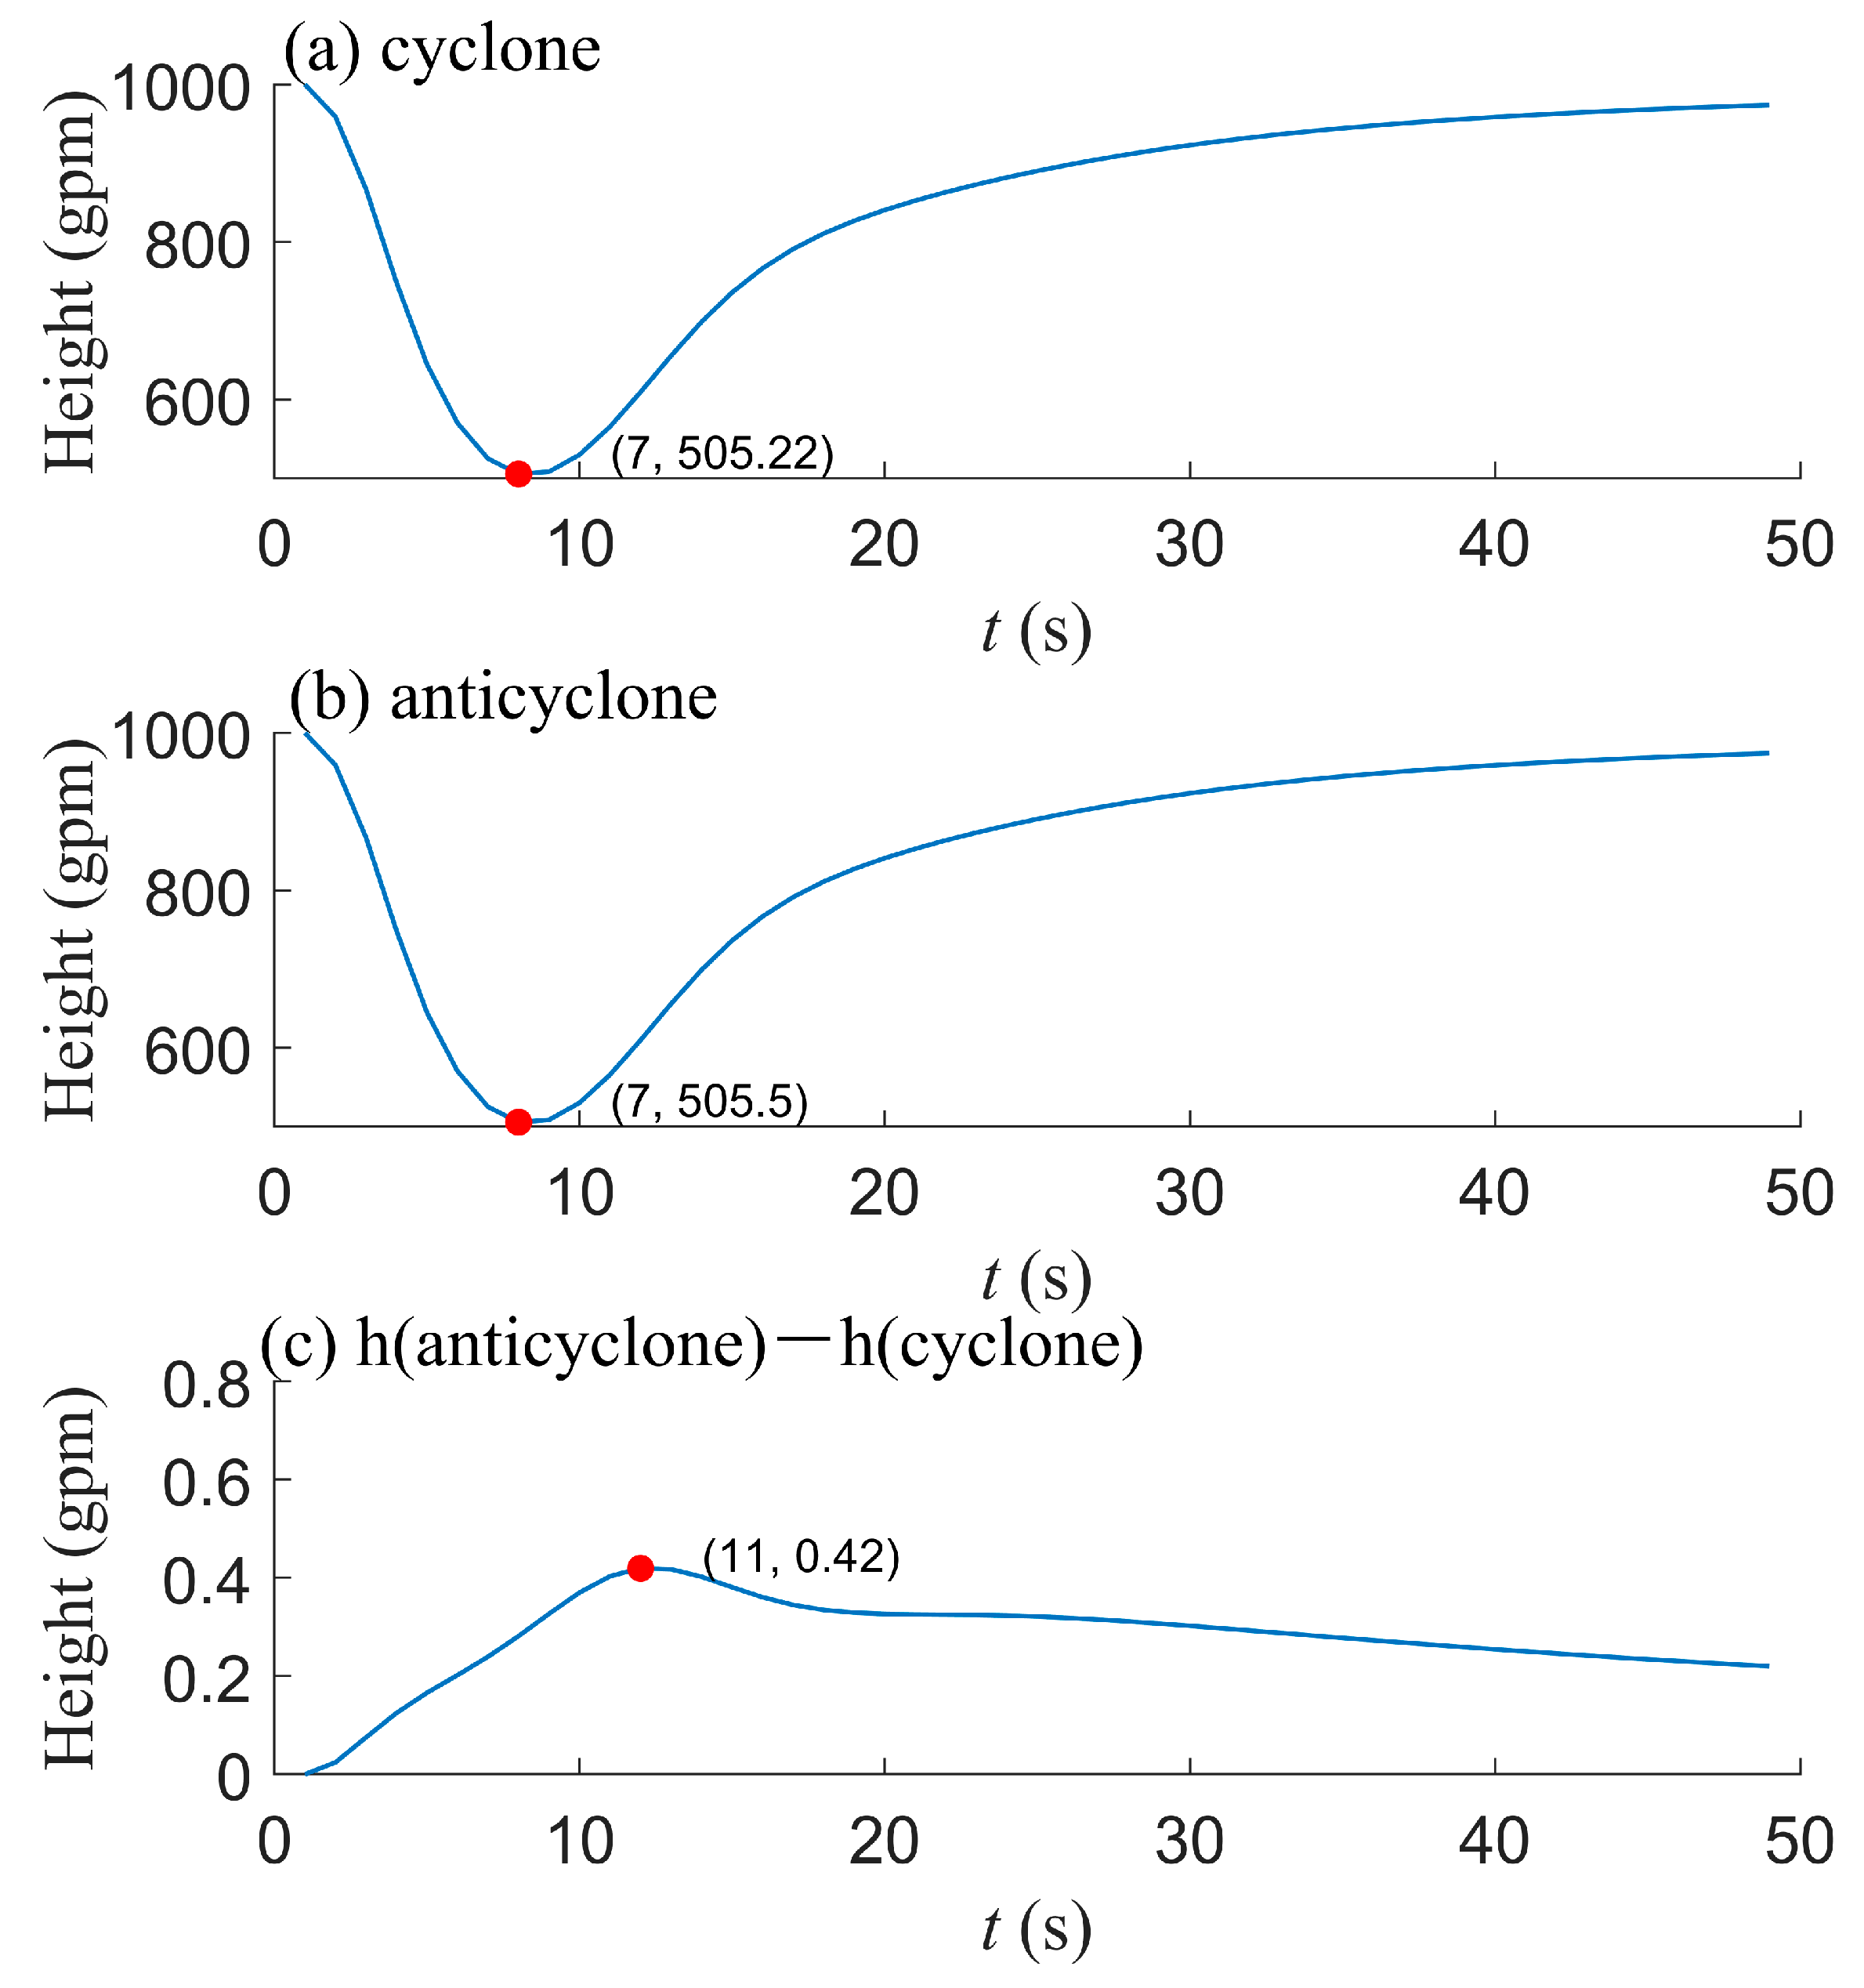
EXP4 introduces perturbations in an anticyclonic wind field against a static atmospheric background, as shown in Figure 2c. The geopotential height field observed in EXP4 showed striking similarity to the cyclonic tornado-like structure observed in EXP1, including the formation of a depression system. Figure 14 compares the changes in geopotential height at the vortex center over time for both EXP1 and EXP4. Both EXP1 and EXP4 reached their lowest geopotential height value at t = 7 s. For EXP4, this value was 505.5 gpm, marginally higher than the 505.22 gpm observed for EXP1. As shown in Figure 14c, the difference between the two experiments is minimal, peaking at a maximum difference of only 0.42 gpm at t = 11 s. These findings suggest that the strength and evolutionary process of both cyclonic and anticyclonic tornado-like structures are quite similar. This parallelism implies that in convective clouds, the centrifugal force generated by strong anticyclones can cause central air pressure to drop, leading to tornado formation. In environments with strong vertical wind shear, the uneven horizontal distribution of vertical speed can cause the horizontal vortex tube to tilt, potentially resulting in the formation of positive and negative vorticity pairs. Under appropriate conditions, this can give rise to both cyclonic and anticyclonic wind fields and, consequently, a pair of cyclonic and anticyclonic tornadoes.

3.5. Error Analysis of Difference Scheme

The error of the difference scheme is related to the wavelength and the horizontal resolution of the model. The error of the difference scheme will increase with the decrease in the wavelength under a certain horizontal resolution. However, the scale of the tornado is very small, and its wavelength is about 2 km (diameter about 1 km), so it is necessary to analyze the error of the difference scheme at such a small scale.
If an element field can be represented as f = e i k x , where k = 2 π L is the wavenumber and L is the wavelength, its first derivative is
f ( x ) = i k e i k x ,
and the derivative of the central difference approximation can be represented as
f D ( x ) = f ( m Δ x + Δ x ) f ( m Δ x Δ x ) 2 Δ x = e i k ( m + 1 ) Δ x e i k ( m 1 ) Δ x 2 Δ x = i sin k Δ x Δ x e i k m Δ x
Thus, the ratio of f D ( x ) to f ( x ) is
R R = f D ( m Δ x ) f ( m Δ x ) = sin k Δ x k Δ x = sin ( 2 π Δ x / L ) 2 π Δ x / L
When k Δ x 0 , R R 1 ; that is, the accuracy of the difference increases as Δ x decreases and the wavelength increases.
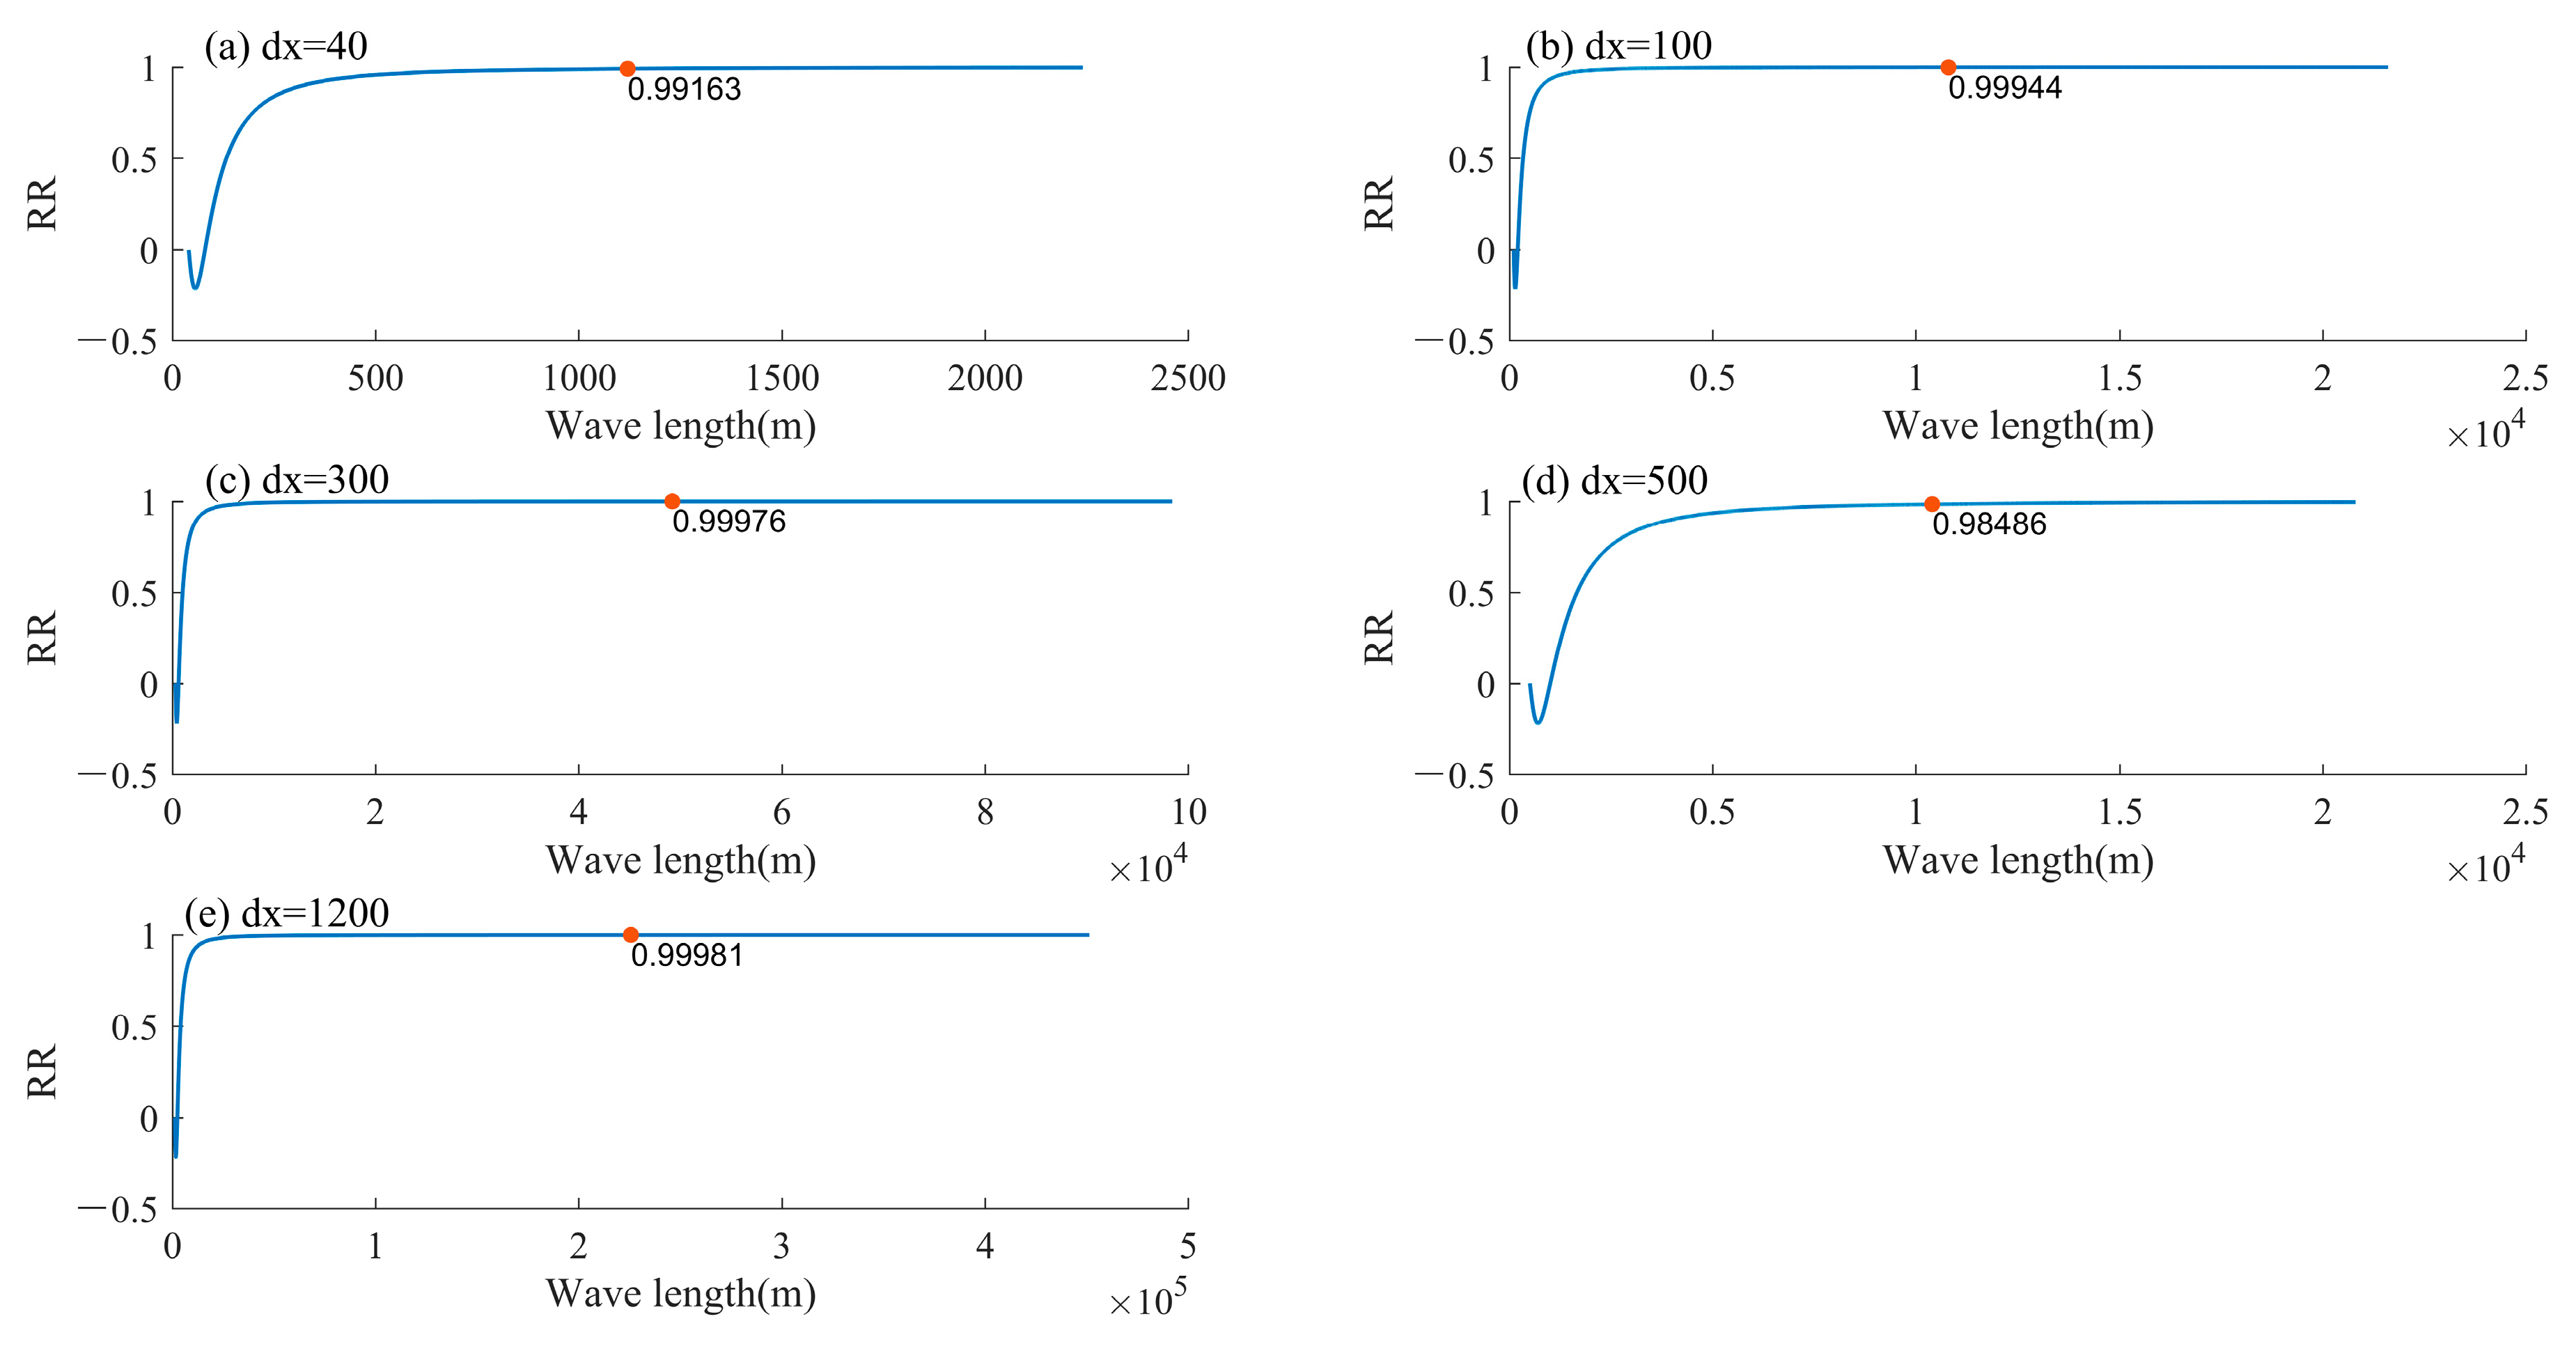
Accordingly, the variation curve of RR with L at different resolutions is drawn as shown in Figure 15, where Δ x = 40 m is the resolution of EXP1, EXP2, EXP4, EXP3.1-3.3, and EXP3.9-11; Δ x = 100 m is the resolution of EXP3.4, 3.5, 3.12, and 3.13; Δ x = 300 m is EXP3.6 and 3.14′s resolution; Δ x = 500 m is EXP3.7 and 3.15′s resolution; and Δ x = 1200 m is EXP3.8 and 3.16 resolution. The red dots and their values are the RR of the wavelength of the smallest vortex in the corresponding numerical test (e.g., for Δ x = 100 m, the red dot corresponds to the wavelength of EXP3.4). It can be seen that RR at all the dots is above 0.99, indicating that the error of the difference scheme is small.

4. Conclusions and Discussion

This study developed a tornado perturbation model using a cyclostrophic wind model based on the shallow-water equation model. Under a static atmospheric background, four numerical experiments were conducted to analyze the effects of individual wind field and geopotential height perturbations, variations in the Coriolis parameter, and wind field perturbations with different rotation directions.
Under the background of a static atmosphere, EXP1 successfully simulated a tornado-like pressure field structure under small-scale cyclonic wind perturbation. The geopotential height dropped from 1000 gpm to approximately 505 gpm in approximately 7 s, creating a strong pressure gradient and central divergence. The comparison between centrifugal force and pressure gradient force indicates that the centrifugal force in the central area is larger than the pressure gradient force, causing air particles to outflow from the central area and the pressure to drop. This can explain the phenomenon of strong vertical vorticity forming a tornado when it occurs in the actual atmosphere.
At the beginning of EXP2, there was only a geopotential height field without an equilibrium wind field. Although there was a large Coriolis parameter, the perturbation excited a purely radial wind field. When the integration began, the central area converged and the geopotential height rapidly increased. At t = 5 s, the depression center changed into a high-pressure center. Small-scale depressions could not simulate the vortex flow field of tornadoes, indicating that under small-scale conditions, even with a large Coriolis parameter, simple atmospheric pressure perturbations cannot develop into tornado vortices.
For small-scale vortices, the Coriolis force has negligible impact on the formation of small-scale tornadoes, as evidenced by the similarity in results with EXP1, where the Coriolis parameter was set to 0. In order to determine to what magnitude the vortex scale the Coriolis force begins to have an impact, EXP3.1 to EXP3.16 were designed, and the results showed that the potential height can drop lower with the influence of the Coriolis force; and for systems smaller than meso-γ scale, the effect of the Coriolis force is negligible, while for systems larger than meso-β scale, the Coriolis force has a significant effect.
Compared to EXP1, EXP4 showed that the anticyclonic wind field perturbation could excite the tornado-like phenomenon, whose geopotential height field is very similar to EXP1. This indicates that a pair of cyclonic and anticyclonic tornadoes may form in the atmosphere with strong vertical wind shear when the horizontal vortex tubes tilt to form a positive and negative vorticity pair. They are similar except for the different rotation directions.

Author Contributions

Conceptualization, Y.J.; methodology, Y.J. and Y.L.; validation, Y.L.; formal analysis, Y.J. and Y.L.; software, Y.L.; data curation, Y.L.; writing—original draft preparation, Y.J. and Y.L.; writing—review and editing, Y.J., Y.L. and R.Z.; visualization, Y.L.; supervision, Y.J., C.C., H.H. and X.C.; Y.Z.; project administration, Y.J. and C.C.; funding acquisition, Y.J. and C.C. All authors have read and agreed to the published version of the manuscript.

Funding

This research was funded by National Natural Science Foundation of China, grants 41975128, 42275169, 42075053, and 42205007.

Institutional Review Board Statement

Not applicable.

Informed Consent Statement

Not applicable.

Data Availability Statement

The original data presented in the study are openly available in zenodo at https://doi.org/10.5281/zenodo.14588601.

Conflicts of Interest

The authors declare no conflicts of interest. The funders had no role in the design of the study; in the collection, analyses, or interpretation of data; in the writing of the manuscript; or in the decision to publish the results.

References

  1. Wurman, J.; Kosiba, K. Finescale Radar Observations of Tornado and Mesocyclone Structures. Weather Forecast. 2013, 28, 1157–1174. [Google Scholar] [CrossRef]
  2. Spiridonov, V.; Baez, J.; Telenta, B.; Jakimovski, B. Prediction of extreme convective rainfall intensities using a free-running 3-D sub-km-scale cloud model initialized from WRF km-scale NWP forecasts. J. Atmos. Solar-Terr. Phys. 2020, 209, 105401. [Google Scholar] [CrossRef]
  3. Davies-Jones, R.; Brooks, H.E. Mesocyclone from a theoretical perspective. In The Tornado: Its Structure, Dynamics, Prediction, and Hazards; American Geophysical Union: Washington, DC, USA, 1993; Volume 79, pp. 105–114. [Google Scholar]
  4. Dahl, J.M.L.; Parker, M.D.; Wicker, L.J. Imported and stormgenerated near-ground vertical vorticity in a simulated supercell. J. Atmos. Sci. 2014, 71, 3027–3051. [Google Scholar] [CrossRef]
  5. Parker, M.D.; Dahl, J.M.L. Production of near-surface vertical vorticity by idealized downdrafts. Mon. Weather Rev. 2015, 143, 2795–2816. [Google Scholar] [CrossRef]
  6. Fischer, J.; Dahl, J.M.L. Transition of Near-Ground Vorticity Dynamics during Tornadogenesis. J. Atmos. Sci. 2022, 79, 467–483. [Google Scholar] [CrossRef]
  7. Dahl, J.M.L.; Fischer, J. On the Origins of Vorticity in a Simulated Tornado-Like Vortex. J. Atmos. Sci. 2023, 80, 1361–1380. [Google Scholar] [CrossRef]
  8. Rasmussen, E.N.; Blanchard, D.O. A baseline climatology of sounding-derived supercell and tornado forecast parameters. Weather Forecast. 1998, 13, 1148–1164. [Google Scholar] [CrossRef]
  9. Markowski, P.M.; Richardson, Y.P. The influence of environmental low-level shear and cold pools on tornadogenesis: Insights from idealized simulations. J. Atmos. Sci. 2014, 71, 243–275. [Google Scholar] [CrossRef]
  10. Coffer, B.E.; Parker, M.D. Simulated supercells in nontornadic and tornadic VORTEX2 environments. Mon. Weather Rev. 2017, 145, 149–180. [Google Scholar] [CrossRef]
  11. Trapp, R.J.; Weisman, M.L. Low-level mesovortices within squall lines and bow echoes. Part II: Their genesis and implications. Mon. Weather Rev. 2003, 131, 2804–2823. [Google Scholar] [CrossRef]
  12. Schenkman, A.D.; Xue, M.; Hu, M. Tornadogenesis in a high-resolution simulation of the 8 May 2003 Oklahoma City supercell. J. Atmos. Sci. 2014, 71, 130–154. [Google Scholar] [CrossRef]
  13. Fischer, J.; Dahl, J.M.L. The relative importance of updraft and cold pool characteristics in supercell tornadogenesis using highly idealized simulations. J. Atmos. Sci. 2020, 77, 4089–4107. [Google Scholar] [CrossRef]
  14. Flournoy, M.D.; Coniglio, M.C. Origins of vorticity in a simulated tornadic mesovortex observed during PECAN on 6 July 2015. Mon. Weather Rev. 2019, 147, 107–134. [Google Scholar] [CrossRef]
  15. Tao, T.; Tamura, T. Numerical study of the 6 May 2012 Tsukuba supercell tornado: Vorticity sources responsible for tornadogenesis. Mon. Weather Rev. 2020, 148, 1205–1228. [Google Scholar] [CrossRef]
  16. Boyer, C.H.; Dahl, J.M. The mechanisms responsible for large near-surface vertical vorticity within simulated supercells and quasi-linear storms. Mon. Weather Rev. 2020, 148, 4281–4297. [Google Scholar] [CrossRef]
  17. Ye, D.Z.; Li, M.T. The adaptation between the pressure and the wind field in the Meso- and Small-Scale motion. Acta Meteorol. Sin. 1964, 4, 409–423. (In Chinese) [Google Scholar]
  18. Zavolgenskiy, M.V.; Rutkevich, P.B. Tornado funnel-shaped cloud as convection in a cloudy layer. Adv. Sci. Res. 2009, 3, 17–21. [Google Scholar] [CrossRef]
  19. Pashitskii, É.A. Nonlinear vortex dynamics in open nonequilibrium systems with bulk mass loss and a generation mechanism for tornadoes and typhoons. J. Exp. Theor. Phys. 2010, 110, 1026–1041. [Google Scholar] [CrossRef]
  20. Carbajal, N.; León-Cruz, J.F.; Pineda-Martínez, L.F.; Tuxpan-Vargas, J.; Gaviño-Rodríguez, J.H. Occurrence of Anticyclonic Tornadoes in a Topographically Complex Region of Mexico. Adv. Meteorol. 2019, 2019, 2763153. [Google Scholar] [CrossRef]
  21. Fabrizio, M. Turbulence phenomena for viscous fluids: Vortices and instability. Appl. Math. Comput. 2020, 376, 125094. [Google Scholar] [CrossRef]
  22. Oliveira, M.I.; Xue, M.; Roberts, B. Trailing Horizontal Vortices in Observed and Numerically Simulated Tornadoes. Bull. Amer. Meteorol. Soc. 2022, 103, E2768–E2790. [Google Scholar] [CrossRef]
  23. Davies-Jones, R. Invented Forces in Supercell Models. J. Atmos. Sci. 2021, 78, 2927–2939. [Google Scholar] [CrossRef]
  24. Peters, J.M.; Coffer, B.E.; Parker, M.D.; Nowotarski, C.J.; Mulholland, J.P.; Nixon, C.J.; Allen, J.T. Disentangling the Influences of Storm-Relative Flow and Horizontal Streamwise Vorticity on Low-Level Mesocyclones in Supercells. J. Atmos. Sci. 2023, 80, 129–149. [Google Scholar] [CrossRef]
  25. Roberts, B.; Xue, M.; Dawson, D.T., II. The Effect of Surface Drag Strength on Mesocyclone Intensification and Tornadogenesis in Idealized Supercell Simulations. J. Atmos. Sci. 2020, 77, 1699–1721. [Google Scholar] [CrossRef]
  26. Snider, C.R. An Anticyclonic Tornado. Mon. Weather Rev. 1976, 104, 1186–1187. [Google Scholar] [CrossRef]
  27. Fujita, T.T. Anticyclonic tornadoes. Weatherwise 1977, 30, 51–64. [Google Scholar] [CrossRef]
  28. Niino, H.; Fujitani, T.; Watanabe, N. A Statistical Study of Tornadoes and Waterspouts in Japan from 1961 to 1993. J. Clim. 1997, 10, 1730–1752. [Google Scholar] [CrossRef]
  29. Chernokulsky, A.V.; Kurgansky, M.V.; Mokhov, I.I.; Shikhov, A.; Azhigov, I.; Selezneva, E.; Zakharchenko, D.; Antonescu, B.; Kühne, T. Tornadoes in Northern Eurasia: From the Middle Age to the Information Era. Mon. Weather Rev. 2020, 148, 3081–3110. [Google Scholar] [CrossRef]
  30. Bluestein, H.B.; French, M.M.; Snyder, J.C.; Houser, J.B. Doppler Radar Observations of Anticyclonic Tornadoes in Cyclonically Rotating, Right-Moving Supercells. Mon. Weather Rev. 2016, 144, 1591–1616. [Google Scholar] [CrossRef]
  31. Nielsen-Gammon, J.W.; Read, W.L. Detection and interpretation of left-moving severe thunderstorms using the WSR-88D: A case study. Weather Forecast. 1995, 10, 127–140. [Google Scholar] [CrossRef]
  32. Knupp, K.R.; Cotton, W.R. An intense, quasi-steady thunderstorm over mountainous terrain. Part II: Doppler radar observations of the storm morphological structure. J. Atmos. Sci. 1982, 39, 343–358. [Google Scholar] [CrossRef]
  33. Monteverdi, J.P.; Blier, W.; Stumpf, G.J.; Pi, W.; Anderson, K. First WSR-88D Documentation of an Anticyclonic Supercell with Anticyclonic Tornadoes: The SunnyvaleCLos Altos, California, Tornadoes of 4 May 1998. Mon. Weather Rev. 2001, 129, 2805–2814. [Google Scholar] [CrossRef]
  34. Bunkers, M.J.; Stoppkotte, J.W. Documentation of a rare tornadic left-moving supercell. J. Sev. Storms Meteorol. 2007, 2, 1559–5404. [Google Scholar] [CrossRef]
  35. Brown, J.M.; Knupp, K.R. The Iowa cyclonic-anticyclonic tornado pair and its parent thunderstorm. Mon. Weather Rev. 1980, 108, 1626–1646. [Google Scholar] [CrossRef]
  36. Fujita, T.T. Tornadoes and downbursts in the context of generalized planetary scales. J. Atmos. Sci. 1981, 38, 1511–1534. [Google Scholar] [CrossRef]
  37. Wurman, J.; Kosiba, K.; Robinson, P.; Marshall, T. The role of multiple-vortex tornado structure in causing storm researcher fatalities. Bull. Am. Meteorol. Soc. 2014, 95, 31–45. [Google Scholar] [CrossRef]
  38. Bluestein, H.B.; Snyder, J.C.; Houser, J.B. A multiscale overview of the El Reno, Oklahoma, tornadic supercell of 31 May 2013. Weather Forecast. 2015, 30, 525–552. [Google Scholar] [CrossRef]
  39. Snyder, J.C.; Bluestein, H.B.; Wienhoff, Z.B.; Kuster, C.M.; Reif, D.W. An Analysis of an Ostensible Anticyclonic Tornado from 9 May 2016 Using High-Resolution, Rapid-Scan Radar Data. Weather Forecast. 2020, 35, 1685–1712. [Google Scholar] [CrossRef]
  40. Erbes, G. A semi-Lagrangian method of characteristic for the shallow-water equations. Mon. Weather Rev. 1993, 121, 3443–3452. [Google Scholar] [CrossRef]
  41. Ying, S.J.; Chang, C.C. Exploratory model study of tornado-like vortex dynamics. J. Atmos. Sci. 1970, 27, 3–14. [Google Scholar] [CrossRef]
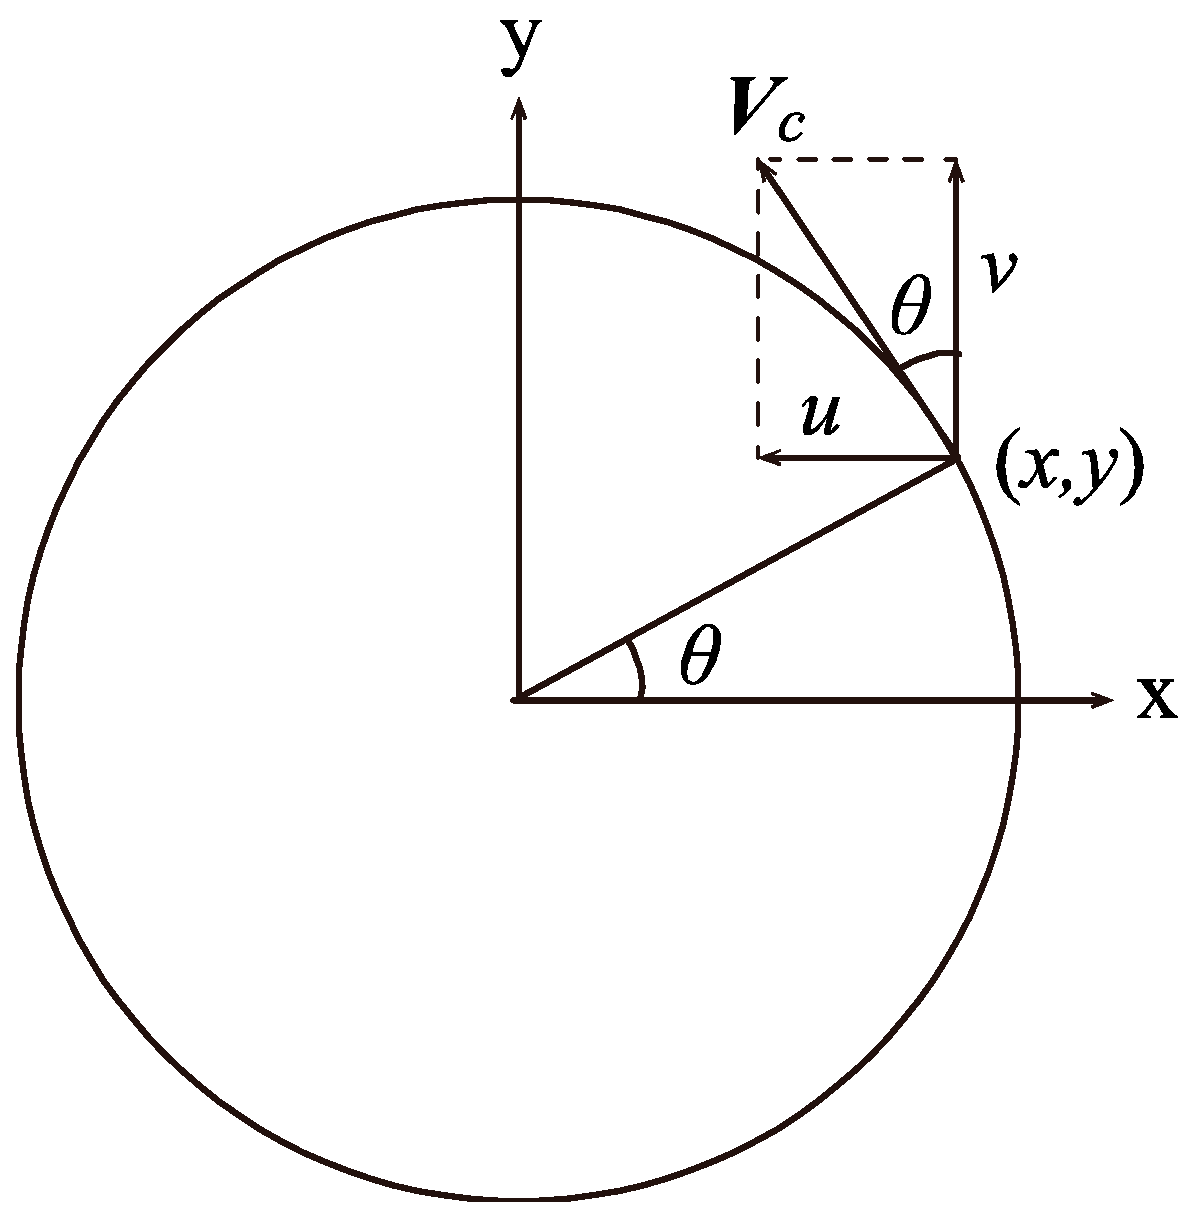
Figure 1. Schematic diagram of the relationship between polar coordinates and rectangular coordinates.
Atmosphere 16 00108 g001
Figure 2. Initial (a) perturbation geopotential height field (gpm) and (b,c) perturbation wind fields (m s−1).
Atmosphere 16 00108 g002
Figure 3. Technical route.
Atmosphere 16 00108 g003
Figure 4. Evolution of geopotential height field (color in, gpm) and wind field (vector, m s−1) in the EXP1 simulation.
Atmosphere 16 00108 g004
Figure 5. (a) Vortex center geopotential height (gpm), (b) changes in the centrifugal force (N), and pressure gradient force (N) of the unit mass air at a lattice point of 40 m from the eastern part of the vortex center in the EXP1 simulation. (The first place of the number in parentheses in the figure refers to the integral time (s), and the second place refers to the central geopotential height value (gpm); the same applies below).
Atmosphere 16 00108 g005
Figure 6. Three-dimensional structure chart of geopotential height in the EXP1 simulation (colored-in area, gpm) and its projection on a horizontal plane (contour line, gpm).
Atmosphere 16 00108 g006
Figure 7. Tornado in Dafeng District, Yancheng, on 13 August: (a) t = 0 s, (b) t = 1 s, (c) t = 2 s, (d) t = 3 s, (e) t = 4 s, and (f) t = 6 s.
Atmosphere 16 00108 g007
Figure 8. Evolution of the divergence field (colored-in area, s−1) and wind field (vector, m s−1) in the EXP1 simulation.
Atmosphere 16 00108 g008
Figure 9. Divergence (blue curve, s−1) and vorticity (red curve, s−1) along the axis of the tornado in the EXP1 simulation.
Atmosphere 16 00108 g009
Figure 10. Evolution of geopotential height field (colored-in area, gpm) and wind field (vector, m s−1) in the EXP2 simulation.
Atmosphere 16 00108 g010
Figure 11. Changes in the geopotential height (gpm) of the vortex center over time in the EXP1 and EXP3.1 simulations: (a) EXP1, (b) EXP3.1, and (c) EXP1-EXP3.1.
Atmosphere 16 00108 g011
Figure 12. The potential height (gpm) along the axis of the vortex when it drops to its lowest (a1a16) and hmin (gpm) over time (s, min or h) (b1b16). (a1a8,b1b8) Cases of f = 0; and (a9a16,b9b16) cases of f = 7.292 × 10⁻⁵ s−1.
Atmosphere 16 00108 g012
Figure 13. DMH (a) and PDMH (b) at different vortex scales.
Atmosphere 16 00108 g013
Figure 14. Changes in the central geopotential height (gpm) of tornadoes over time in the EXP1 and EXP4 simulations: (a) EXP1, (b) EXP4, and (c) EXP1-EXP4.
Atmosphere 16 00108 g014
Figure 15. The ratio of f’D(x) to f’(x), (a) dx = 40 m, (b) dx = 100 m, (c) dx = 300 m, (d) dx = 500 m, and (e) dx = 1200 m.
Atmosphere 16 00108 g015
Table 1. Numerical test protocols.
Test NameInitial Field Perturbation TypeCoriolis Parameter f (s−1)Purpose
EXP1Cyclonic wind field7.292 × 10−5Simulate the evolution process of a single given cyclonic wind field.
EXP2Geopotential height perturbation7.292 × 10−5Simulate the evolution process of a single given pressure field.
EXP3Cyclonic wind field7.292 × 10−5 or 0Simulate the evolution process of a single given cyclonic wind field considering or without considering the Coriolis force. Sixteen tests were designed to analyze the influence of the Coriolis force in vortices with different scales, as seen in Table 2.
EXP4Anticyclonic wind field7.292 × 10−5Simulate the evolution process of the perturbation of a single given anticyclonic wind field.
Table 2. Numerical test protocols of EXP3.
Test
Name
Diameter of Vortex (km)f (s−1)Test
Name
Diameter of Vortex (km)f (s−1)
EXP3.10.560EXP3.90.567.292 × 10−5
EXP3.21.20EXP3.101.27.292 × 10−5
EXP3.32.480EXP3.112.487.292 × 10−5
EXP3.45.40EXP3.125.47.292 × 10−5
EXP3.511.20EXP3.1311.27.292 × 10−5
EXP3.624.60EXP3.1424.67.292 × 10−5
EXP3.7520EXP3.15527.292 × 10−5
EXP3.8112.80EXP3.16112.87.292 × 10−5
Disclaimer/Publisher’s Note: The statements, opinions and data contained in all publications are solely those of the individual author(s) and contributor(s) and not of MDPI and/or the editor(s). MDPI and/or the editor(s) disclaim responsibility for any injury to people or property resulting from any ideas, methods, instructions or products referred to in the content.