Article

Study on Downscaling Correction of Near-Surface Wind Speed Grid Forecasts in Complex Terrain

1
Public Meteorological Service Center, China Meteorological Administration, Beijing 100081, China
2
Wind and Solar Energy Center, China Meteorological Administration, Beijing 100081, China
3
China Meteorological Administration Energy Meteorology Key Laboratory, Beijing 100081, China
4
CMA Key Open Laboratory of Transforming Climate Resources to Economy, Chongqing 401147, China
*
Author to whom correspondence should be addressed.
These authors contributed equally to this work.
Atmosphere 2024, 15(9), 1090; https://doi.org/10.3390/atmos15091090
Submission received: 30 July 2024 / Revised: 31 August 2024 / Accepted: 5 September 2024 / Published: 8 September 2024
(This article belongs to the Special Issue Solar Irradiance and Wind Forecasting)

Abstract

:
Accurate forecasting of wind speeds is a crucial aspect of providing fine-scale professional meteorological services (such as wind energy generation and transportation operations etc.). This article utilizes CMA-MESO model forecast data and CARAS-SUR_1 km ground truth grid data from January, April, July, and October 2022, employing the random forest algorithm to establish and evaluate a downscaling correction model for near-surface 1 km resolution wind-speed grid forecast in the complex terrain area of northwestern Hebei Province. The results indicate that after downscaling correction, the spatial distribution of grid forecast wind speeds in the entire complex terrain study area becomes more refined, with spatial resolution improving from 3 km to 1 km, reflecting fine-scale terrain effects. The accuracy of the corrected wind speed forecast significantly improves compared to the original model, with forecast errors showing stability in both time and space. The mean bias decreases from 2.25 m/s to 0.02 m/s, and the root mean square error (RMSE) decreases from 3.26 m/s to 0.52 m/s. Forecast errors caused by complex terrain, forecast lead time, and seasonal factors are significantly reduced. In terms of wind speed categories, the correction significantly improves forecasts for wind speeds below 8 m/s, with RMSE decreasing from 2.02 m/s to 0.59 m/s. For wind speeds above 8 m/s, there is also a good correction effect, with RMSE decreasing from 2.20 m/s to 1.65 m/s. Selecting the analysis of the Zhangjiakou strong wind process on 26 April 2022, it was found that the downscaled corrected forecast wind speed is very close to the observed wind speed at the station and the ground truth grid points. The correction effect is particularly significant in areas affected by strong winds, such as the Bashang Plateau and valleys, which has significant reference value.

1. Introduction

Improving the precision of wind speed forecasting is a critical requirement for fine-scale professional meteorological services. On one hand, wind energy, as a renewable resource, relies on accurate wind speed forecast as the foundation for wind energy predictions in wind farms [1,2], facilitating the efficient utilization of wind energy resources. On the other hand, strong winds can hinder traffic operations, damage buildings and infrastructure, and threaten the safety of lives and property [3]. Accurate wind speed forecasting aids in early disaster risk assessment and the implementation of preventive measures.
However, due to the fact that the results of near-surface wind field forecasting mainly come from numerical weather prediction (NWP) models, there are significant errors in near-surface wind speed forecasts because of the incomplete physical parameterization schemes of the models, initial assimilation data field errors, and insufficient resolution [4,5], especially in areas with complex terrain where forecasting errors are particularly noticeable [6]. These inaccuracies pose great challenges to wind power forecasting and disaster prevention and mitigation. In recent years, some researchers have attempted to use machine learning methods to correct NWP model outputs to achieve fine-scale wind speed forecasts. Traditional correction models mostly employ linear methods [7], which are insufficient to capture the hidden nonlinear characteristics of wind speed variations. In contrast, correction models based on machine learning methods can capture these nonlinear variations and have demonstrated excellent performance in wind speed forecasting. Examples include the use of artificial neural networks [8,9,10], support vector machines [11,12], and random forests [13,14,15] for wind speed forecast correction.
Meanwhile, existing studies on wind speed forecast correction predominantly focus on interpolating numerical model forecast products to observation sites and establishing relationships with simultaneous site observations for site-specific forecast correction [15,16,17,18,19,20]. With the development of grid-based forecasting operations and the emergence of high spatiotemporal resolution grid observation fusion products in China, grid-based correction of wind speed forecasts has become feasible. However, due to the limitations in the spatiotemporal resolution of ground truth grid data and numerical model forecast data, current regional wind speed grid forecast correction studies primarily focus on spatial resolutions greater than 5 km, with forecast intervals of 3 h or 24 h [14,21,22,23,24]. Although these corrections can improve wind speed forecast accuracy, significant errors persist in complex terrain areas, and these errors increase noticeably with forecast lead time. Additionally, wind speed gridded forecast downscaling is often based on statistical downscaling using station data or dynamical downscaling based on models [25,26,27,28], resulting in large forecast errors in complex terrain areas that fail to meet the requirements of professional meteorological services for fine-scale applications such as renewable energy and transportation.
Therefore, to enhance the spatiotemporal fineness, accuracy, and stability of regional wind speed gridded forecasts, this article utilizes the high spatiotemporal resolution ground truth grid dataset (1 km/1 h) and regional numerical model forecast products from the China Meteorological Administration, combined with detailed terrain elevation data, and employs machine learning algorithms to develop a 1 km hourly near-surface wind speed gridded forecast downscaling correction technique for complex terrain regions, with special attention given to evaluating the downscaling correction performance for strong wind events, aiming to improve the support capabilities of professional meteorological services.

2. Data and Methods

2.1. Study Area and Period

The study area covers the spatial range of 39.97° N to 41.50° N and 113.98° E to 115.51° E, encompassing Zhangjiakou City and its surrounding regions in the northwestern part of Hebei Province. The study area is characterized by a temperate continental monsoon climate with distinct four seasons, featuring cold and long winters, dry and windy springs with frequent sandstorms, hot and brief summers with concentrated precipitation, and clear autumns with moderate temperatures [29]. The seasonal variation in wind speed is pronounced, with the highest speeds occurring in winter and spring, followed by autumn, and the lowest speeds in summer. The elevation ranges from approximately 100 m to 2600 m, featuring complex and highly variable terrain predominantly consisting of the Bashang Plateau and mountainous areas (see Figure 1). The study period includes January, April, July, and October 2022, representing the four seasons.

2.2. Data

This article utilizes four types of data: numerical model forecast data, terrain data, ground truth grid data, and station observation data. The numerical model forecast data, terrain data, and ground truth grid data are used for modeling and testing the wind speed grid-based downscaling correction model, while the station observation data are used for the evaluation and validation of the wind speed forecast.
The numerical model forecast data are derived from the CMA-MESO 3 km numerical forecast products of the China Meteorological Administration (CMA), starting at 20:00. These data have a horizontal spatial resolution of 0.03° and a forecast interval of 1 h, covering the same spatial range and period as described in Section 2.1. The selected meteorological elements include 10 m wind speed, 2 m temperature, 2 m relative humidity, surface pressure, and the geopotential height, wind speed, temperature, and humidity at four isobaric levels (500 hPa, 700 hPa, 850 hPa, and 925 hPa). Considering the lag time of the model operation, the 6–29 h forecasts from the model are used as the 1–24 h forecast data for this study. The terrain data are obtained from the United States Geological Survey (USGS) with a spatial resolution of 30 s (approximately 90 m). The ground truth grid data are derived from the CARAS-SUR_1 km ground truth professional service product of the Public Meteorological Service Center of the CMA, with a spatial resolution of 0.01° and a temporal resolution of 1 h, covering the same spatial range and period as described in Section 2.1. The selected meteorological element is the 10 m wind speed data. The station observation data are obtained from 11 national meteorological stations within the study area, including Shangyi, Zhangbei, Tianzhen, Huai’an, Yangyuan, Xuanhua, Wanquan, Chongli, Qiaodong, Huailai, and Zhuolu (see Figure 1). These data cover the same period as described in Section 2.1. The national meteorological station data are reliable, well distributed across different terrain elevations, and highly representative.
In this study, the CARAS-SUR_1 km ground truth grid data during the study period are used as labels (ground truth in machine learning). The corresponding 20 meteorological elements from the CMA-MESO 3 km numerical forecasts at the labeled times, along with the latitude and longitude coordinates, terrain elevation, and forecast lead time, are used as inputs for the machine learning algorithm to construct the wind speed grid-based downscaling correction model.

2.3. Methods

2.3.1. Machine Learning Algorithm

The machine learning algorithm selected for this study is the random forest method, which has demonstrated superior performance in wind speed forecast correction and generally outperforms other machine learning methods [14,24,28]. Random forest [13] is an ensemble learning algorithm that integrates multiple decision trees. In the random forest method [14], the wind speed prediction training set is defined as X i Y i . Here, X i is the feature vector constructed from the influencing factors { I i 1 ,   I i 2 ,   , I i n } at time i during the model construction period, and Y i is the observed wind speed at time i during the model construction period. Using the bootstrap resampling technique, the classification model is constructed and a single regression decision tree is established. Based on the single decision tree, the entire random forest is constructed. The resulting random forest is a multivariate nonlinear regression analysis model, where the random forest prediction value is the average of all decision tree predictions. Compared to other algorithms, the random forest algorithm has significant advantages in handling high-dimensional data, resistance to overfitting, robustness, parallelization, ease of use, and feature importance evaluation, making it one of the most commonly used machine learning algorithms. The specific advantages are as follows:
(1)
High accuracy: Random forest improves prediction accuracy by integrating multiple decision trees. The prediction results of each tree are determined by voting or averaging, thereby reducing the bias and variance of a single model.
(2)
Handling high-dimensional data: Random forest can handle a large number of features (high-dimensional data) and has an inherent feature importance evaluation mechanism during feature selection, making it perform well on complex datasets.
(3)
Resistance to overfitting: Since random forest uses an ensemble of multiple trees and each tree is trained on a subset of the data and features, this “bagging” and “random feature selection” method effectively reduces the risk of overfitting.
(4)
Robustness: Random forest is robust to missing values and noisy data. It can provide stable prediction results even when there are some outliers or missing values in the data.
(5)
Parallelization: The training process of random forest can be parallelized because the training of each tree is independent. This makes it highly efficient in processing large-scale datasets.
(6)
Ease of use: The random forest algorithm is relatively simple and easy to use, often requiring minimal parameter tuning. A random forest model with default parameter settings usually provides good performance.

2.3.2. Model Construction and Evaluation

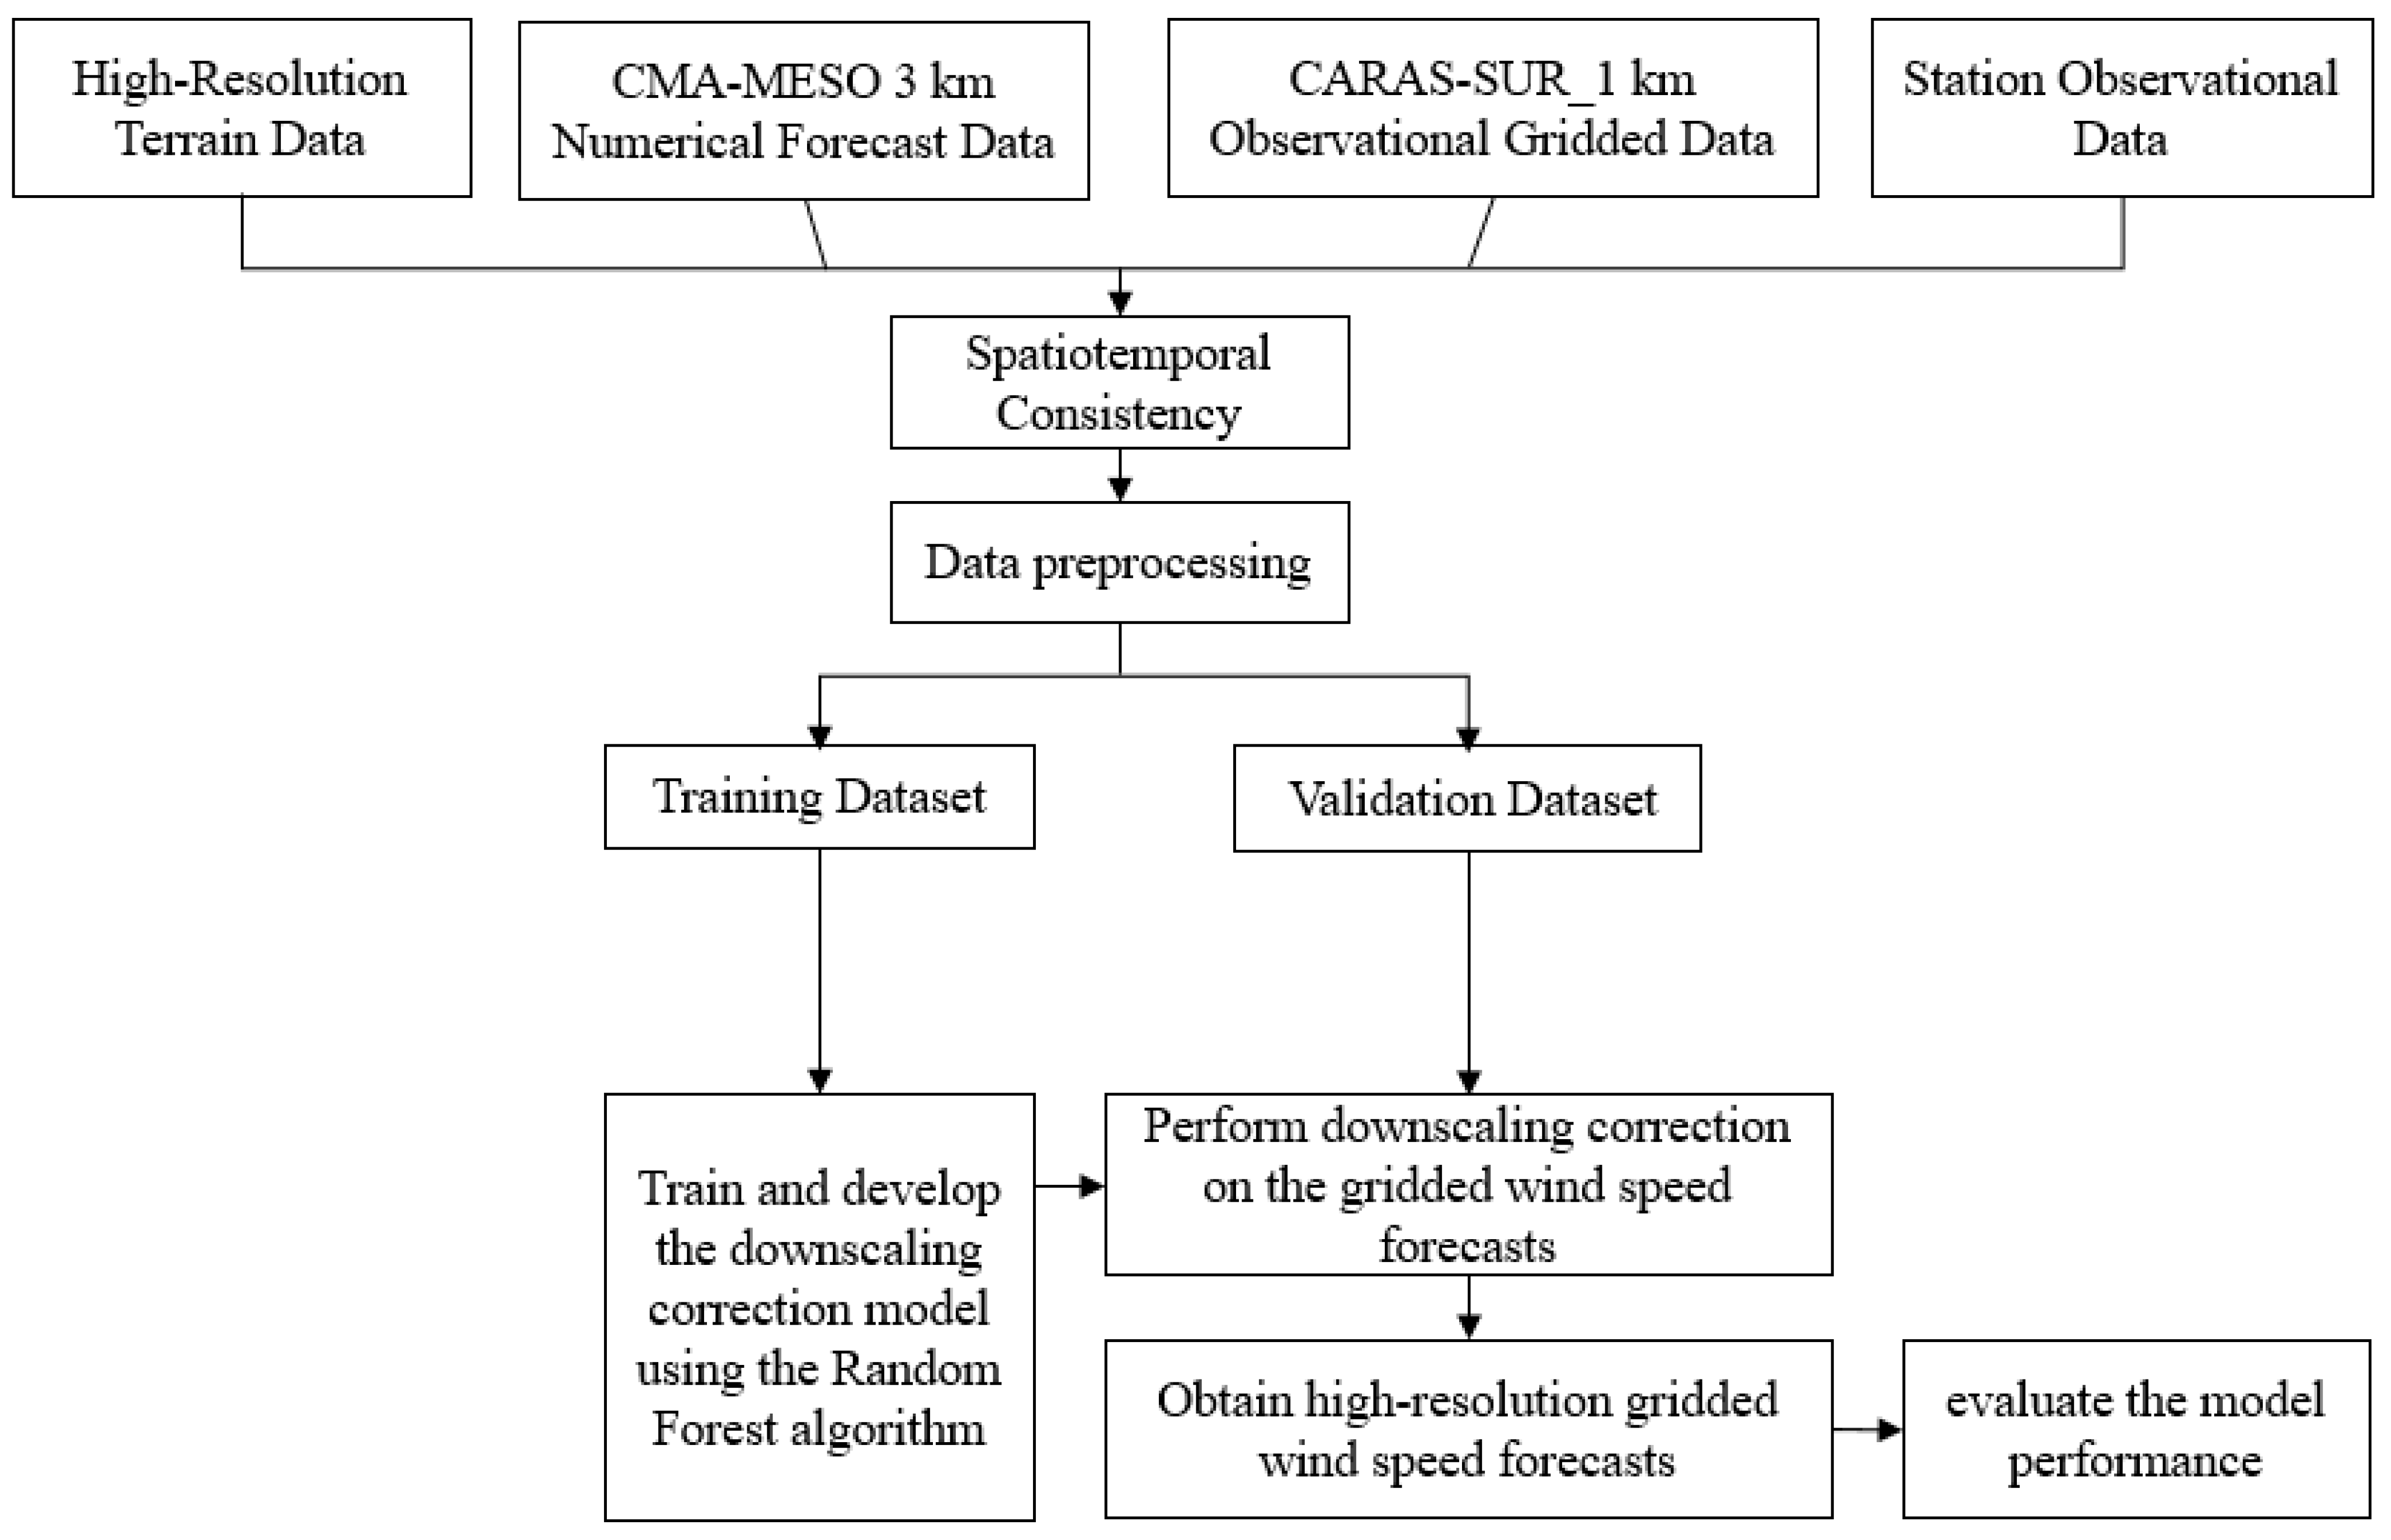
The data in this article are divided into two parts: the first 20 days of January, April, July, and October 2022 are used as the training dataset to determine the downscaling correction model, while the remaining 10 to 11 days of each month are used as the validation dataset to verify and evaluate the model’s performance. The flowchart of the wind speed gridded downscaling correction model based on the random forest algorithm is shown in Figure 2.
(1)
Spatiotemporal Consistency: Using the CARAS-SUR_1 km ground truth grid data as the spatiotemporal target, the CMA-MESO 3 km numerical forecast data are filled according to the principle of identical values for 1 km × 1 km grids inside each 3 km × 3 km grid, resulting in a dataset with a spatial resolution of 1 km and hourly intervals. The detailed terrain data are processed into a 1 km spatial resolution dataset by arithmetic averaging within each grid. Station observation data are matched to the 1 km grids in the study area based on the nearest distance principle and are temporally matched on an hourly basis.
(2)
Data Preprocessing: The 21 variables from the CMA-MESO 3 km data, along with the 10 m wind speed and the grid latitude and longitude from the CARAS-SUR_1 km ground truth grid data, are extracted. Data for all variables are standardized to avoid the issue of smaller numerical values contributing less during training and to improve computational speed [30]. Due to the good completeness of the dataset, there are no missing values during the study period. The study area has a spatial resolution of 1 km × 1 km, comprising a total of 154 × 154 grids. Therefore, the training dataset consist of 80 × 24 × 154 × 154 samples, and the validation dataset consist of 43 × 24 × 154 × 154 samples, with each sample having 24 feature variables and 1 target variable.
(3)
Model Training: The feature vector is constructed from 24 variables (see Table 1) selected from the CMA-MESO 3 km output, including 10 m wind speed, 2 m temperature, 2 m relative humidity, surface pressure, and the geopotential height, wind speed, temperature, and humidity at 500 hPa, 700 hPa, 850 hPa, and 925 hPa, forecast lead time, and static geographic information (grid point longitude, latitude, and terrain elevation). The target variable is the 10 m wind speed from the CARAS-SUR_1 km ground truth grid data. The random forest downscaling correction model is established to achieve the downscaled output of near-surface wind speed grid forecast. The grid search method is used to tune three key parameters of the random forest model (n_estimators, max_depth, min_samples_split), and the final selected parameter values are the default settings of the model.
(4)
Validation and Evaluation: The CARAS-SUR_1 km ground truth grid data are used as the observational ground truth for model construction and validation. The wind speed forecasts before and after downscaling correction are evaluated. To further assess the model’s effectiveness, this study selects wind speed observation data from national meteorological stations during the validation period to evaluate the model’s performance in terms of spatial, temporal, and various wind speed categories. Additionally, specific analyses of the model performance during strong wind events are selected to comprehensively evaluate the performance of the wind speed forecast downscaling correction model.

2.3.3. Validation Methods

In this article, the root mean square error (RMSE), mean bias (BIAS), correlation coefficient (R), and RMSE improvement rate (C) are used to evaluate the results before and after downscaling correction [15,20]. The calculation formulas are as follows:
RMSE = 1 N i = 1 N x f x o 2
BIAS = 1 N i = 1 N ( x f x o )
R = i = 1 N x f x f ¯ x o x o ¯ i = 1 N x f x f ¯ 2 i = 1 N x o x o ¯ 2
C = R M S E R M S E R M S E × 100 %
In the formulas:
x f and x o represent the forecasted wind speed and the observed (or ground truth grid) wind speed (in m/s), respectively.
x f ¯ and x o ¯ are the mean values of the forecasted wind speed and the observed (or ground truth grid) wind speed (in m/s), respectively.
N is the total number of samples within the statistical period.
i is the sample index within the statistical period.
R M S E is the root mean square error of the forecast after downscaling correction (in m/s).
R M S E is the root mean square error of the original forecast (in m/s).
These definitions provide the necessary context for understanding the evaluation metrics used to assess the performance of the wind speed forecast downscaling correction model.

3. Results and Discussion

3.1. Spatial Distribution Characteristics of Correction Effects

3.1.1. Grid Validation

Compared with the CARAS-SUR_1 km ground truth grid data, the original 1–24 h near-surface wind speed forecasts from the CMA-MESO numerical model in the study area have a root mean square error (RMSE) of 3.26 m/s, a mean bias (BIAS) of 2.25 m/s, and a correlation coefficient (R) of approximately 0.68. During the model training period in 2022, the downscaled corrected wind speed forecasts have an RMSE of 0.07 m/s, a BIAS of 0.00 m/s, and an R of approximately 1.00. During the model validation period in 2022, the downscaled corrected wind speed forecasts have an RMSE of 0.52 m/s, a BIAS of 0.02 m/s, and an R of approximately 0.96, which is better than the current 24 h wind speed correction forecast accuracy in the North China region (RMSE of 0.8 to 2.0 m/s) [14,22,23,24]. These results indicate that the near-surface wind speed grid-based downscaling correction model based on the random forest algorithm performs well overall. The RMSE improvement rate of the downscaled corrected wind speed grid forecasts during the validation period is approximately 83.97%, demonstrating significant correction effects.
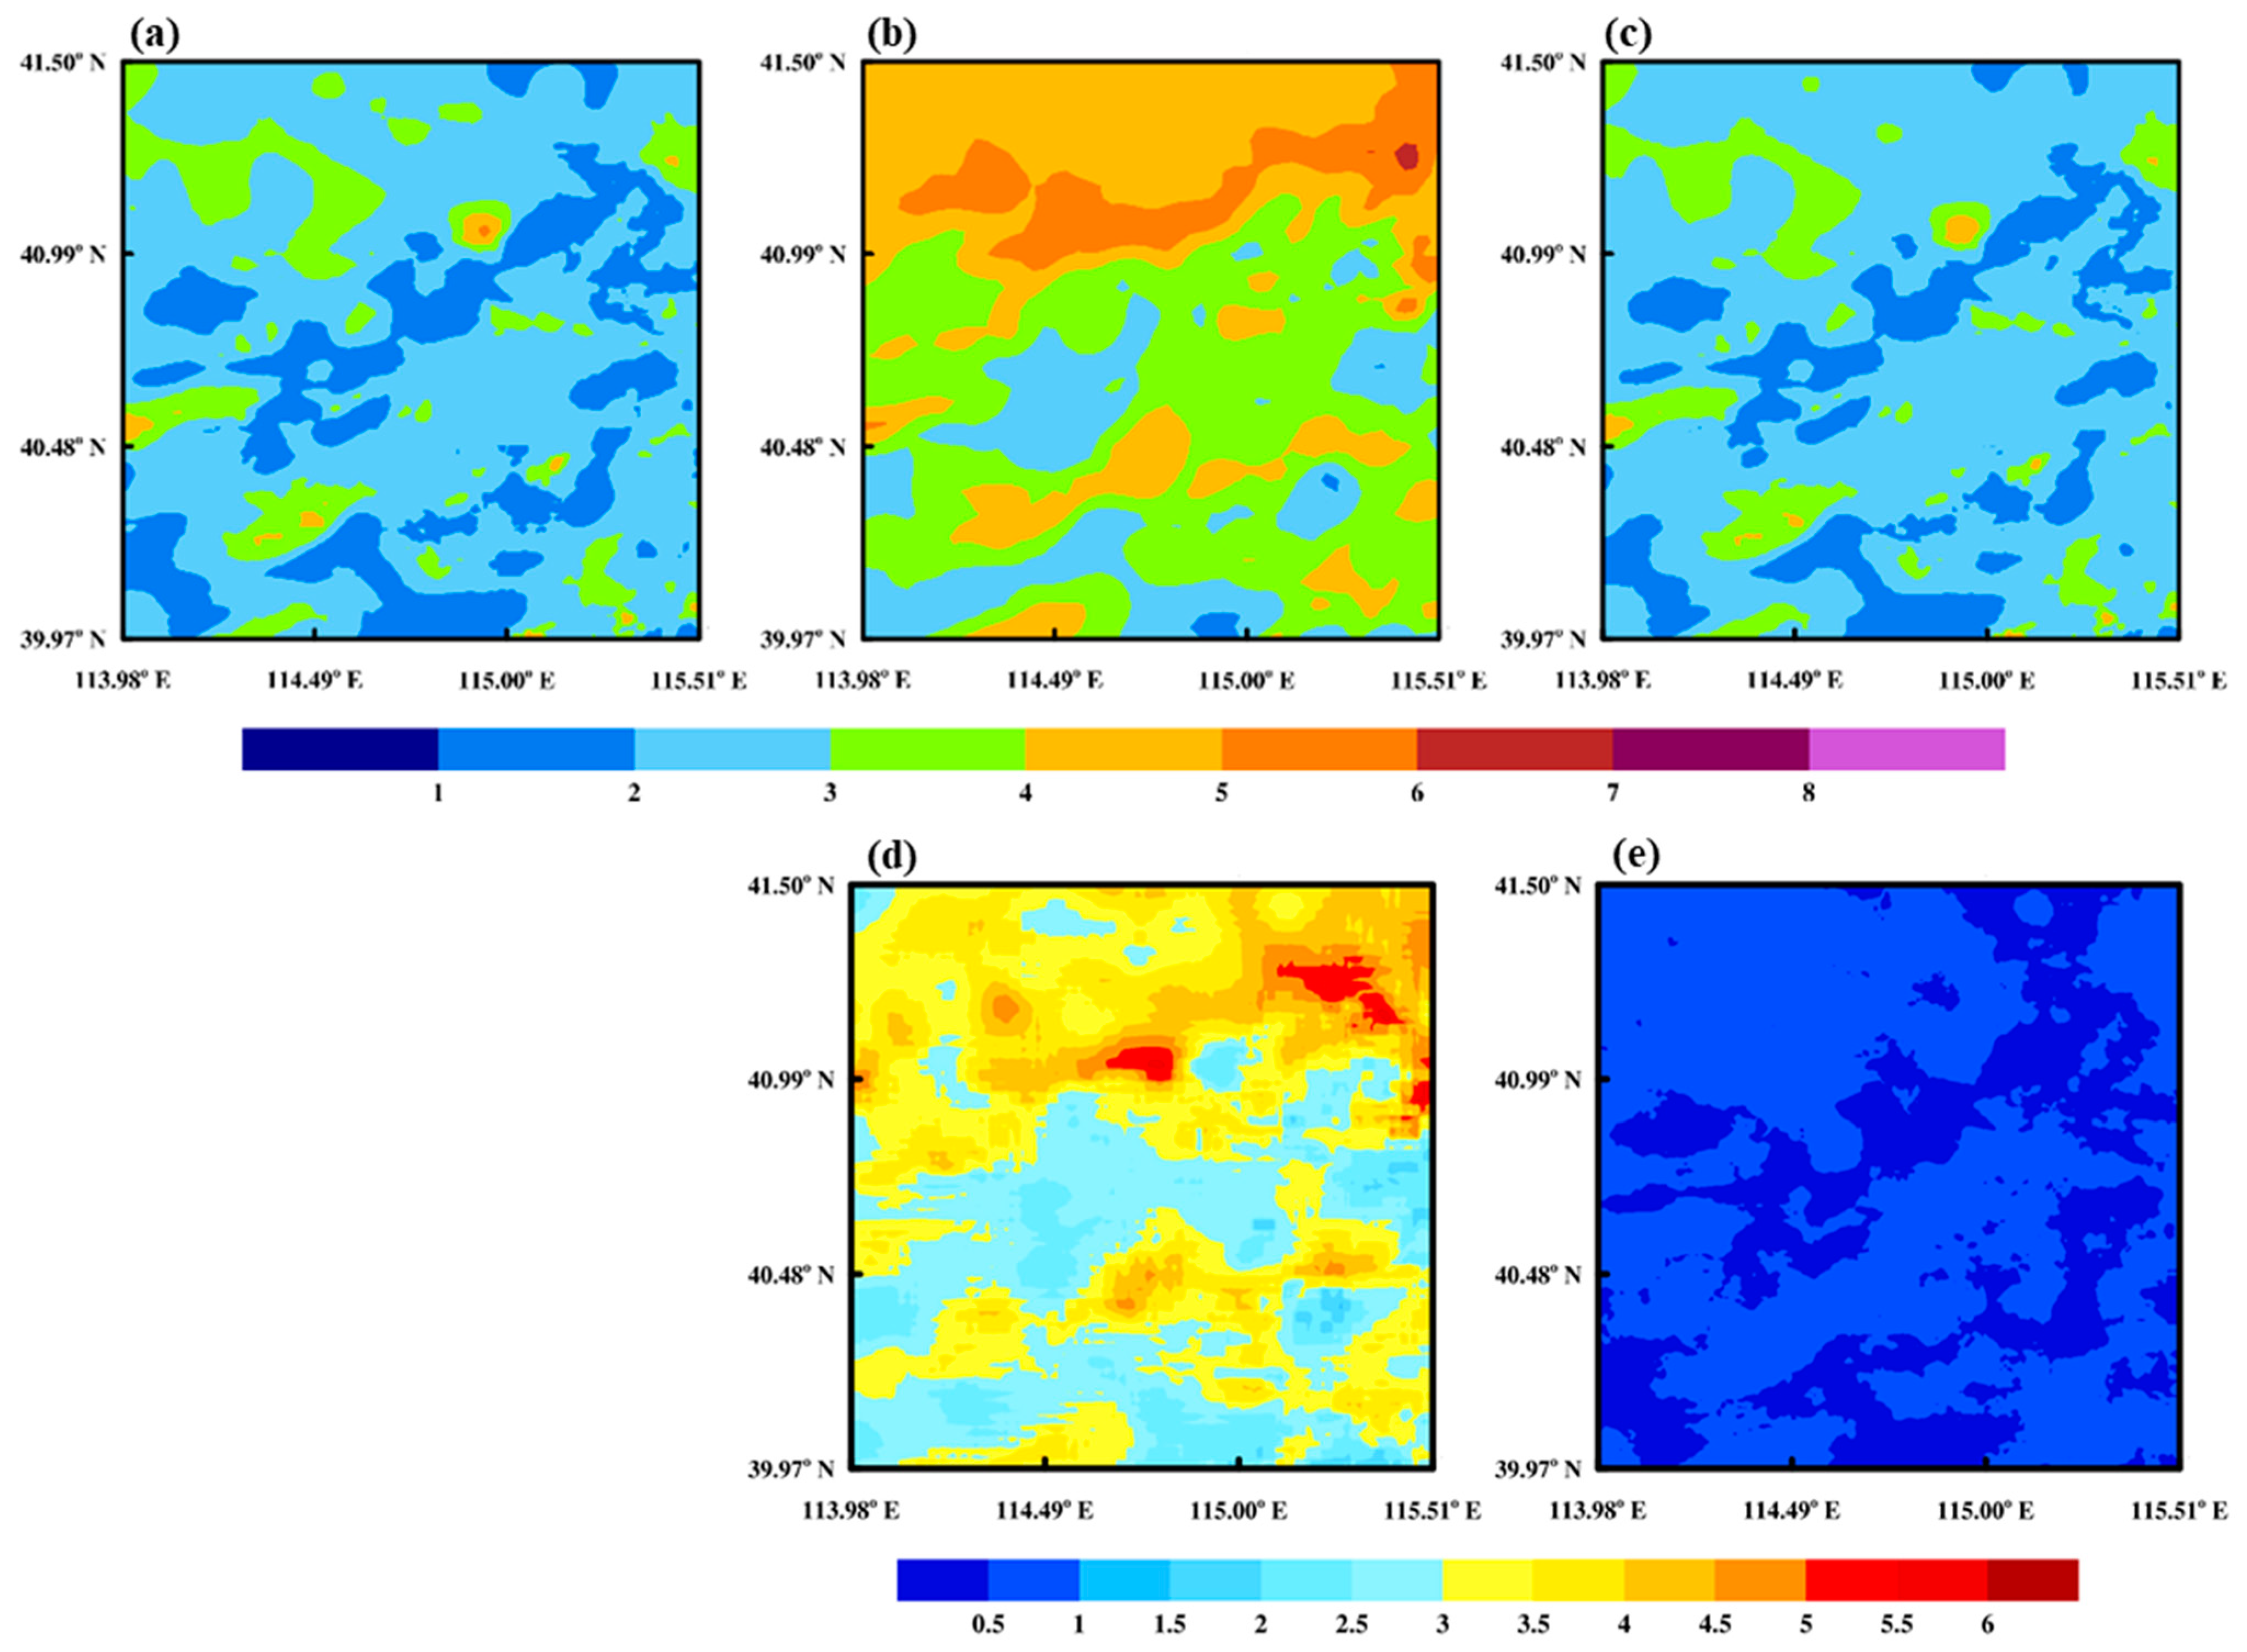
Figure 3a–c show the spatial distribution of the average wind speed during the 2022 validation period for the CARAS-SUR_1 km ground truth, the CMA-MESO 3 km model forecast, and the downscaled corrected forecast in the study area. The average wind speed in the ground truth data is generally around 2–3 m/s, while the CMA-MESO 3 km model forecast wind speed is generally 2–6 m/s, significantly higher than the observed wind speed. The downscaled corrected average wind speed is very close to the observed values and exhibits a finer spatial distribution compared to the original model forecast, with the spatial resolution improved from 3 km to 1 km. As shown in Figure 3d,e, the RMSE of the original model forecast wind speed is generally 2–5 m/s and is consistent with the terrain elevation distribution. In the northern part of the study area, where the elevation exceeds 1500 m and the terrain is complex, the RMSE can reach more than 5 m/s. After downscaling correction, the RMSE of the wind speed forecast in the study area is generally around 0.50 m/s, significantly lower than the original model forecast error, with an RMSE improvement rate of 70–90%. The grid-based corrected wind speed shows significant improvement, and at the same time, the RMSE spatial distribution is more balanced and stable, basically eliminating the impact of complex terrain on forecast errors and resembling the spatial distribution of the average wind speed.

3.1.2. Station Validation

Table 2 presents the wind speed downscaling correction forecast effects of 11 national meteorological stations in the study area. During the 2022 validation period, the average observed wind speed at these meteorological stations ranges from 1.54 to 2.89 m/s. The RMSE of the original model forecast wind speed ranges from 1.33 to 2.61 m/s, the mean bias (BIAS) ranges from 0.28 to 1.93 m/s, and the correlation coefficient (R) ranges from 0.62 to 0.74. The accuracy of the wind speed forecast is significantly improved after downscaling correction, with RMSE values ranging from 0.53 to 0.86 m/s, BIAS values ranging from −0.12 to 0.15 m/s, and average R values ranging from 0.88 to 0.96. The RMSE improvement rate ranges from 59.70% to 76.35%. The downscaled corrected wind speed forecast is close to the station observations, whereas the corrected ECMWF high-resolution model 5 km 3-hourly wind speed gridded forecast still shows some discrepancies with the station observations [21], indicating a clear advantage in the correction effect of this study. Specifically, Station M2, located on the Bashang Plateau, has the highest average wind speed and the highest RMSE improvement rate (76.35%), with the RMSE decreasing from 2.61 m/s to 0.62 m/s. Station M11, located in a valley, has the lowest average wind speed and the lowest RMSE improvement rate (59.70%); this is because the original numerical model forecast at this station has the lowest RMSE of 1.33 m/s, and after downscaling correction, the RMSE is reduced to 0.54 m/s, which is comparable to other stations, resulting in the lowest RMSE improvement rate. Consistent with the conclusions from the grid point validation, the wind speed forecast errors at the meteorological stations are similar after downscaling correction, and the influence of terrain on wind speed forecast errors is significantly reduced. Meanwhile, the mean bias values are close to 0, basically eliminating the systematic errors of the model, demonstrating significant correction effects. In addition, this also indirectly verifies the high quality of the ground truth grid products, as they closely match the station observations.

3.2. Temporal Variation Characteristics of Correction Effect

3.2.1. Wind Speed Correction Effects for Representative Months of Each Season

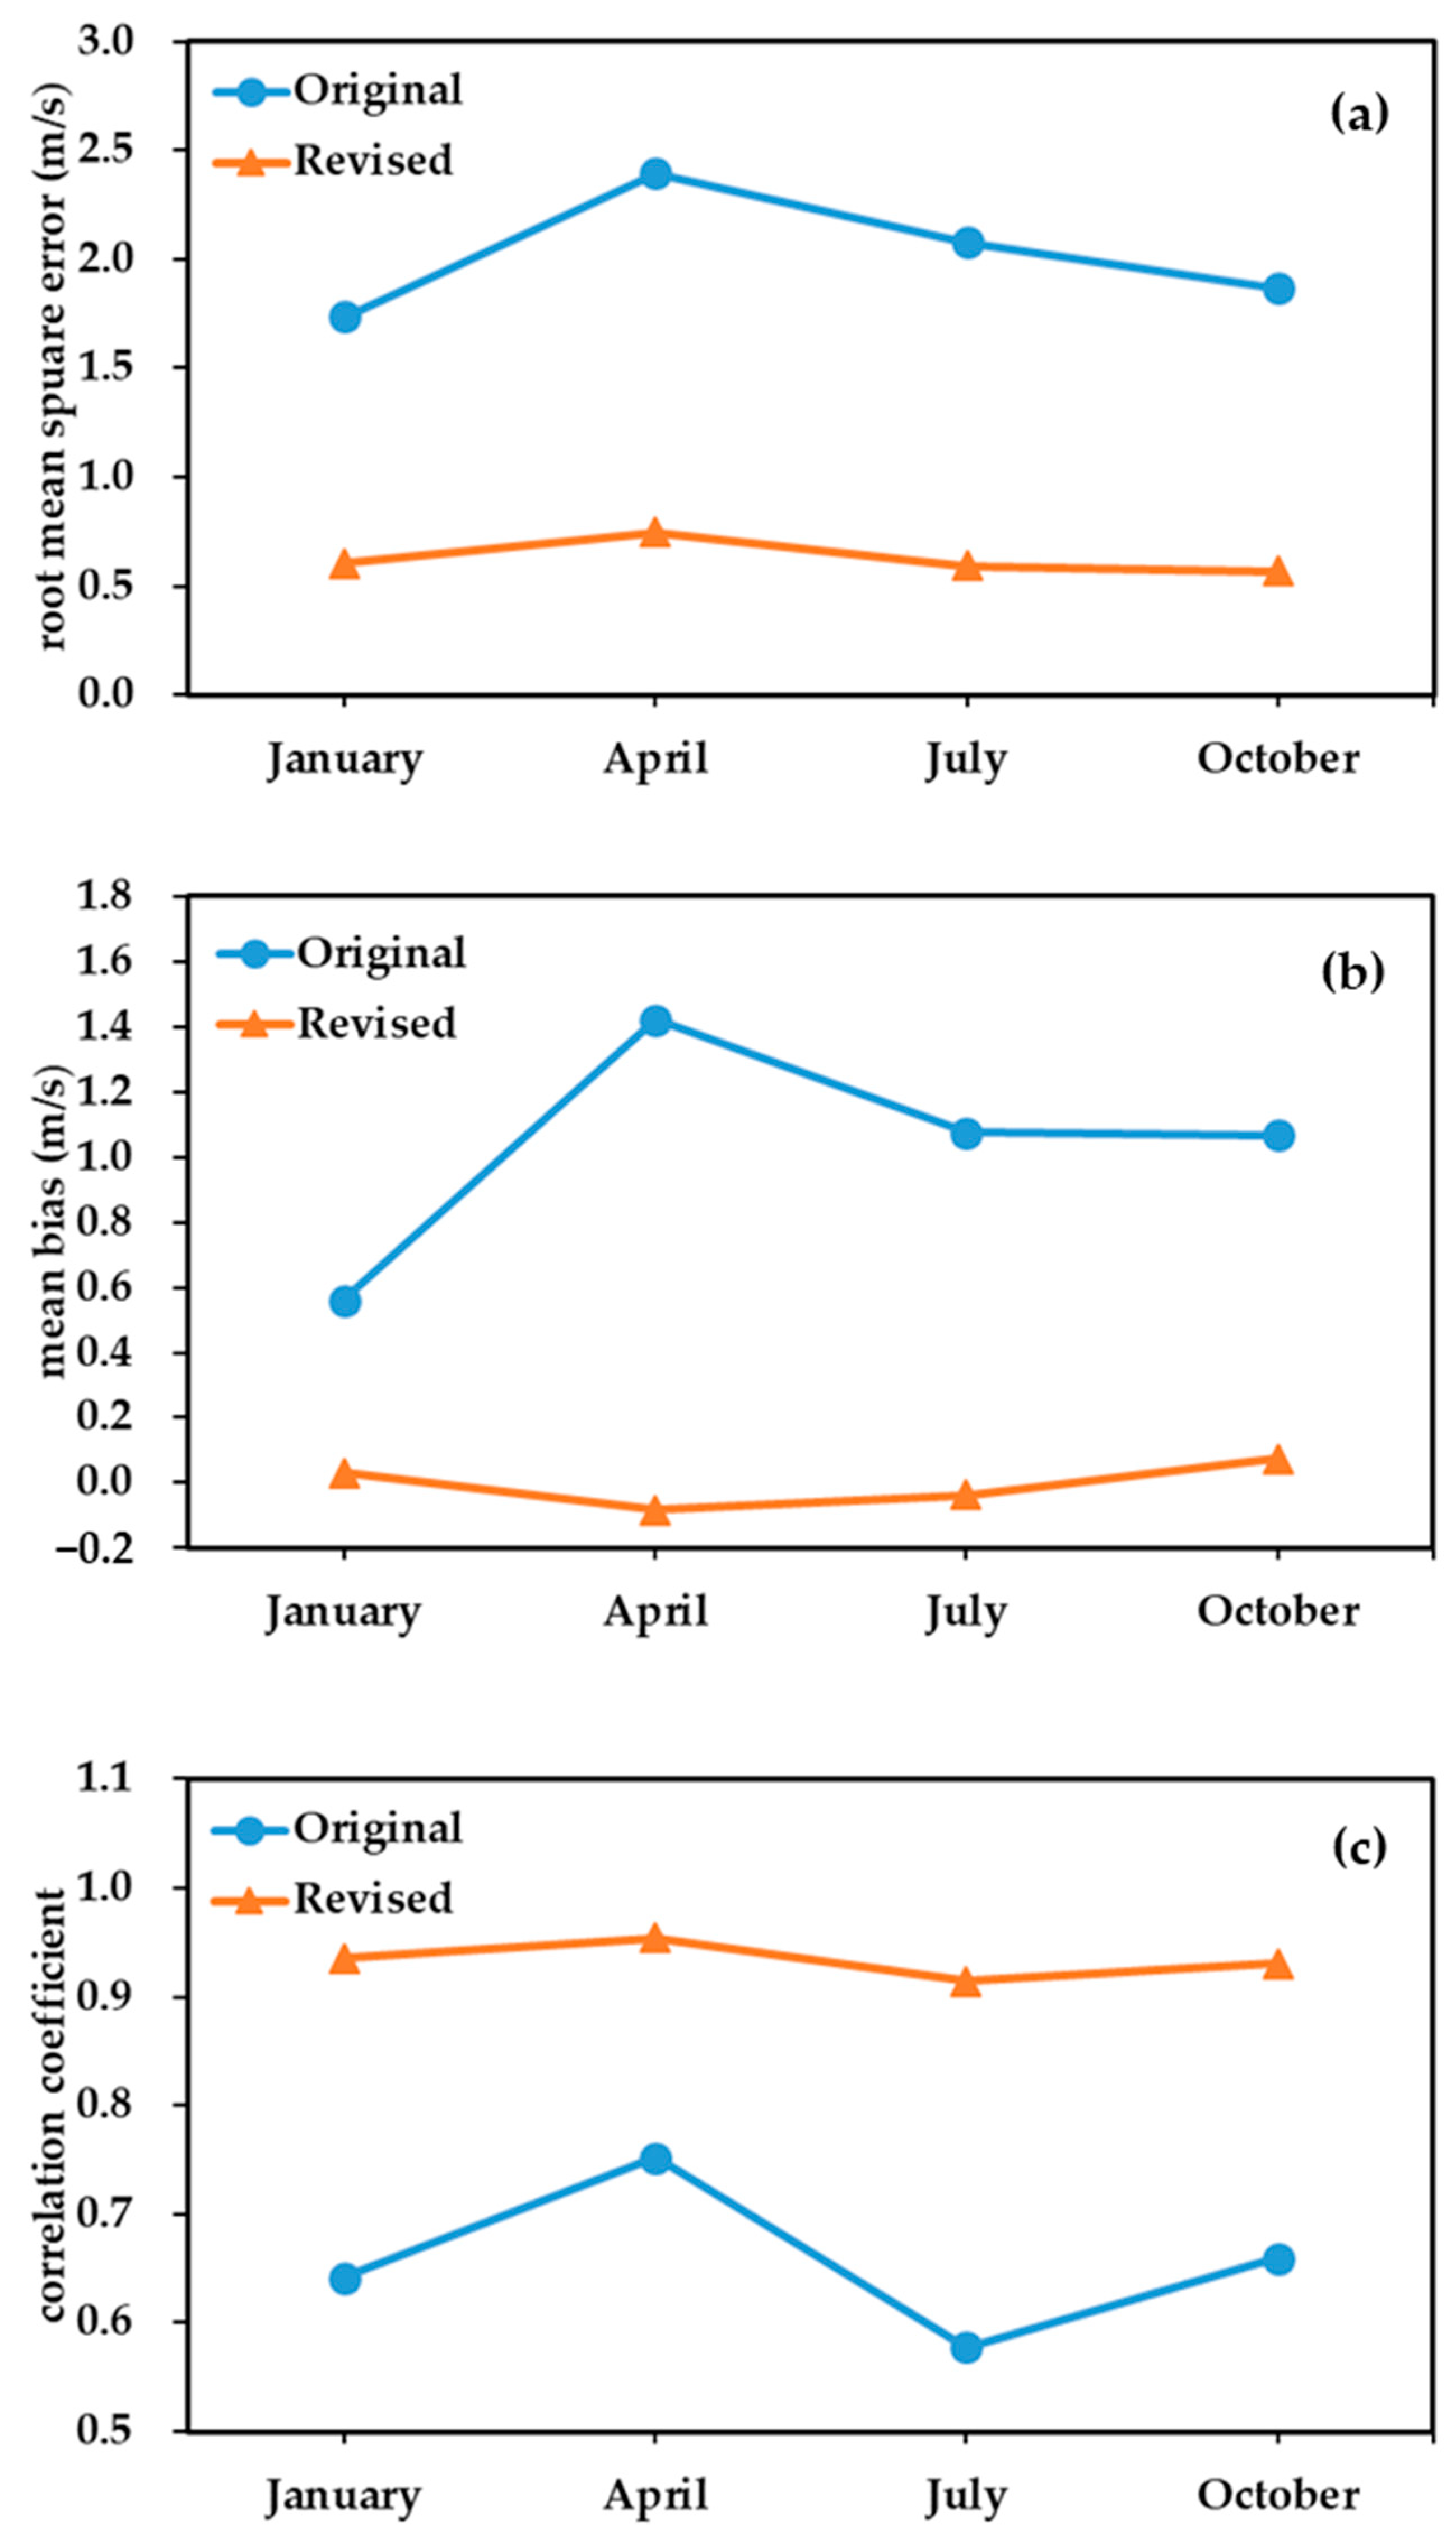
The wind speed forecast performance statistics for the representative months of each season in 2022 (January, April, July, and October) are shown in Figure 4. As illustrated in the figure, the original model has the largest forecast errors for spring wind speeds, with an RMSE of 2.40 m/s and a mean bias (BIAS) of 1.42 m/s. The smallest forecast errors are observed for winter wind speeds, with an RMSE of 1.74 m/s and a BIAS of 0.56 m/s. The downscaling correction significantly improves the wind speed forecast performance for all seasons. The RMSE for the representative months of each season decreases substantially after correction, with the corrected RMSE around 0.60 m/s. Specifically, the RMSE for spring decreases by 1.65 m/s, for winter by 1.13 m/s, for summer by 1.48 m/s, and for autumn by 1.30 m/s, with an RMSE improvement rate of approximately 70%. The BIAS for the representative months of each season is close to 0 m/s after correction. The correlation coefficient (R) improves from 0.60–0.70 to above 0.90 after correction. Overall, the downscaling correction has a significant effect on the wind speed forecasts for the representative months of each season, and the errors are stable after correction, basically eliminating the systematic errors of the model forecasts. The corrected wind speed forecast demonstrates both seasonal stability and forecast accuracy that are superior to the results of the study in [23], which reported an annual average RMSE of 0.78 m/s. Among the seasons, the autumn forecasts show the greatest improvement, with an RMSE improvement rate of 71.42%, while the winter forecasts show the smallest improvement, with an RMSE improvement rate of 65.17%.

3.2.2. Wind Speed Correction Effects for Different Forecast Lead Times

The wind speed forecast performance statistics for the 1–24 h forecast lead times in 2022 are shown in Figure 5. The forecast errors of the original model generally increase with the forecast lead time, especially after the 12 h forecast lead time, where the RMSE is consistently above 2 m/s and the mean bias (BIAS) is consistently above 1 m/s. Specifically, the RMSE for the 17 h and 19 h forecast lead times exceed 2.40 m/s, and the BIAS exceeds 1.40 m/s. Downscaling correction significantly improves the wind speed forecast performance for all 1–24 h forecast lead times. The RMSE for each forecast lead time decreases substantially after correction, with the corrected RMSE around 0.60 m/s. Specifically, the RMSE for the 17 h and 19 h forecast lead times decreases by 1.74 m/s and 1.83 m/s, respectively, while the RMSE for other forecast lead times decreases by 1.12–1.69 m/s, with an RMSE improvement rate of approximately 70%. The BIAS for each forecast lead time is close to 0 m/s after correction. The correlation coefficient (R) improves from 0.48–0.80 to around 0.90 after correction. Overall, the downscaling correction significantly enhances the wind speed forecast performance for all 1–24 h forecast lead times, and the errors are stable after correction, basically eliminating the systematic errors of the model forecasts. In contrast, the wind speed correction forecast errors in [14,21,22,23,24] show a significant increasing trend with longer forecast lead times, with [21] reporting that the 12–24 h forecast errors are significantly larger than the 0–12 h forecast errors. This study’s downscaling correction demonstrates a clear advantage. Among them, the forecast lead times of 6 h, 9 h, 15 to 17 h, 19 to 21 h, and 24 h show the greatest improvement, with RMSE improvement rates exceeding 70%. The 6 h and 19 h forecast lead times have the highest improvement rates, exceeding 74%.

3.3. Correction Effects of Different Wind Speed Levels

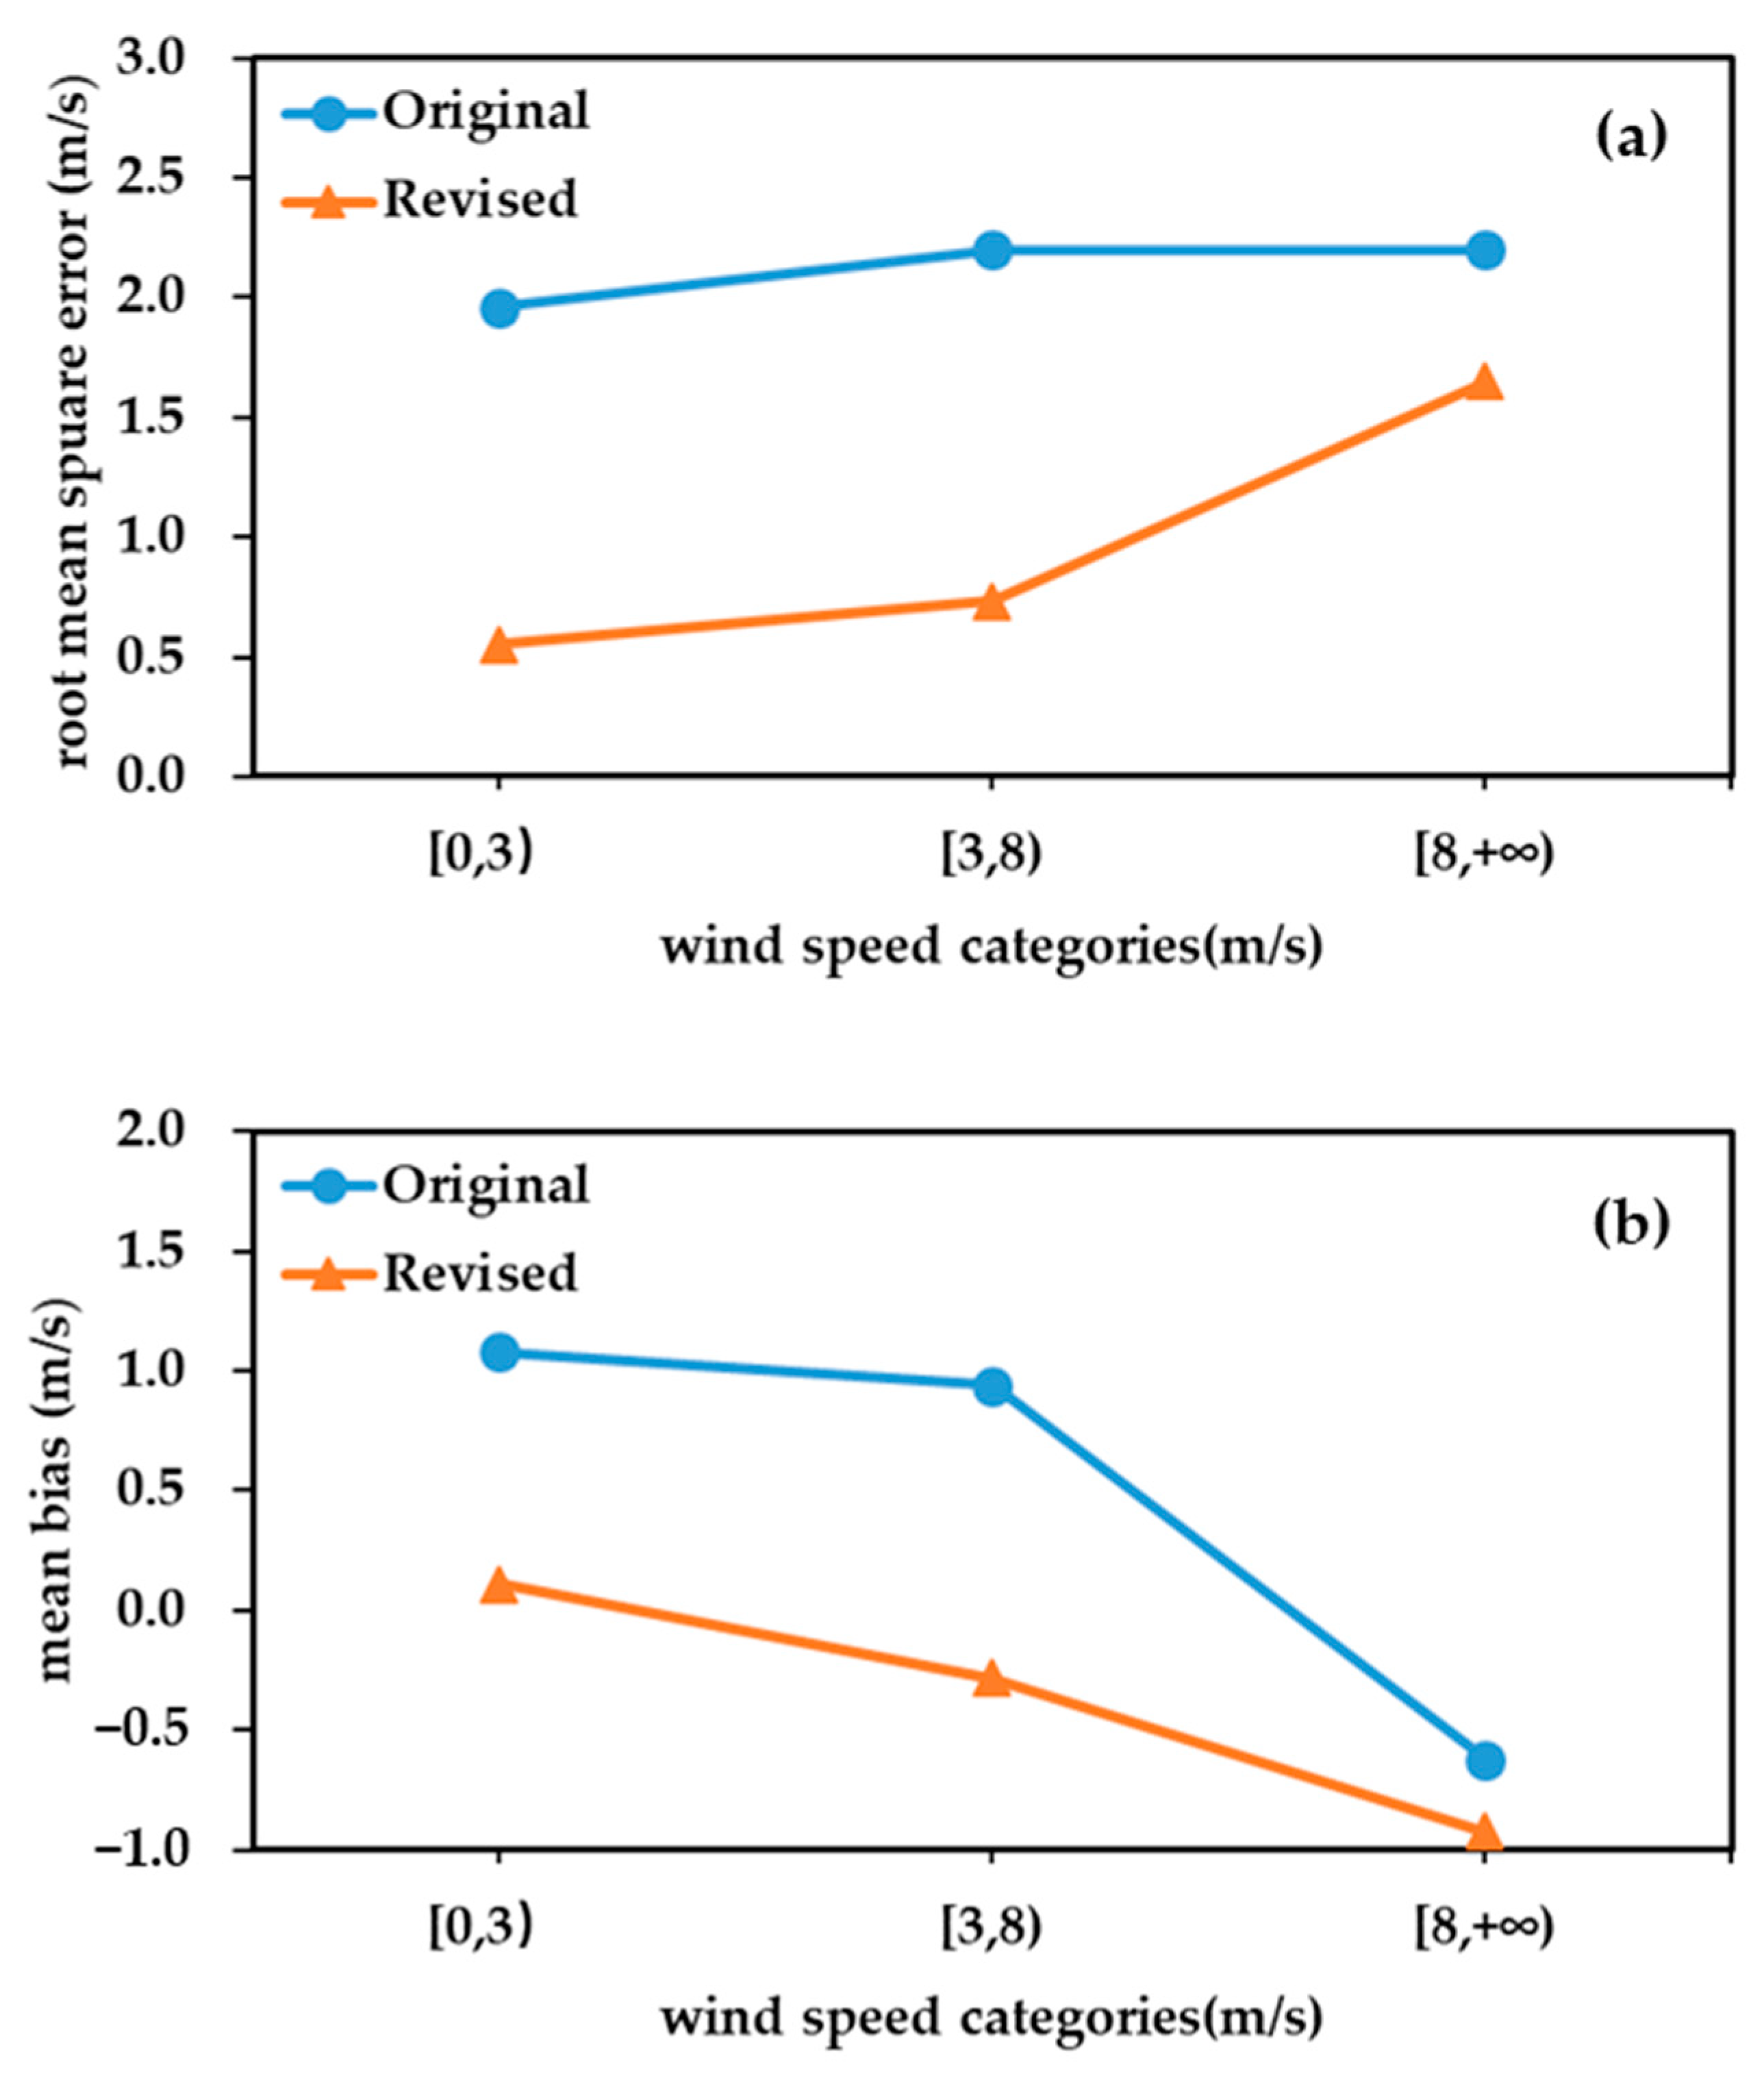
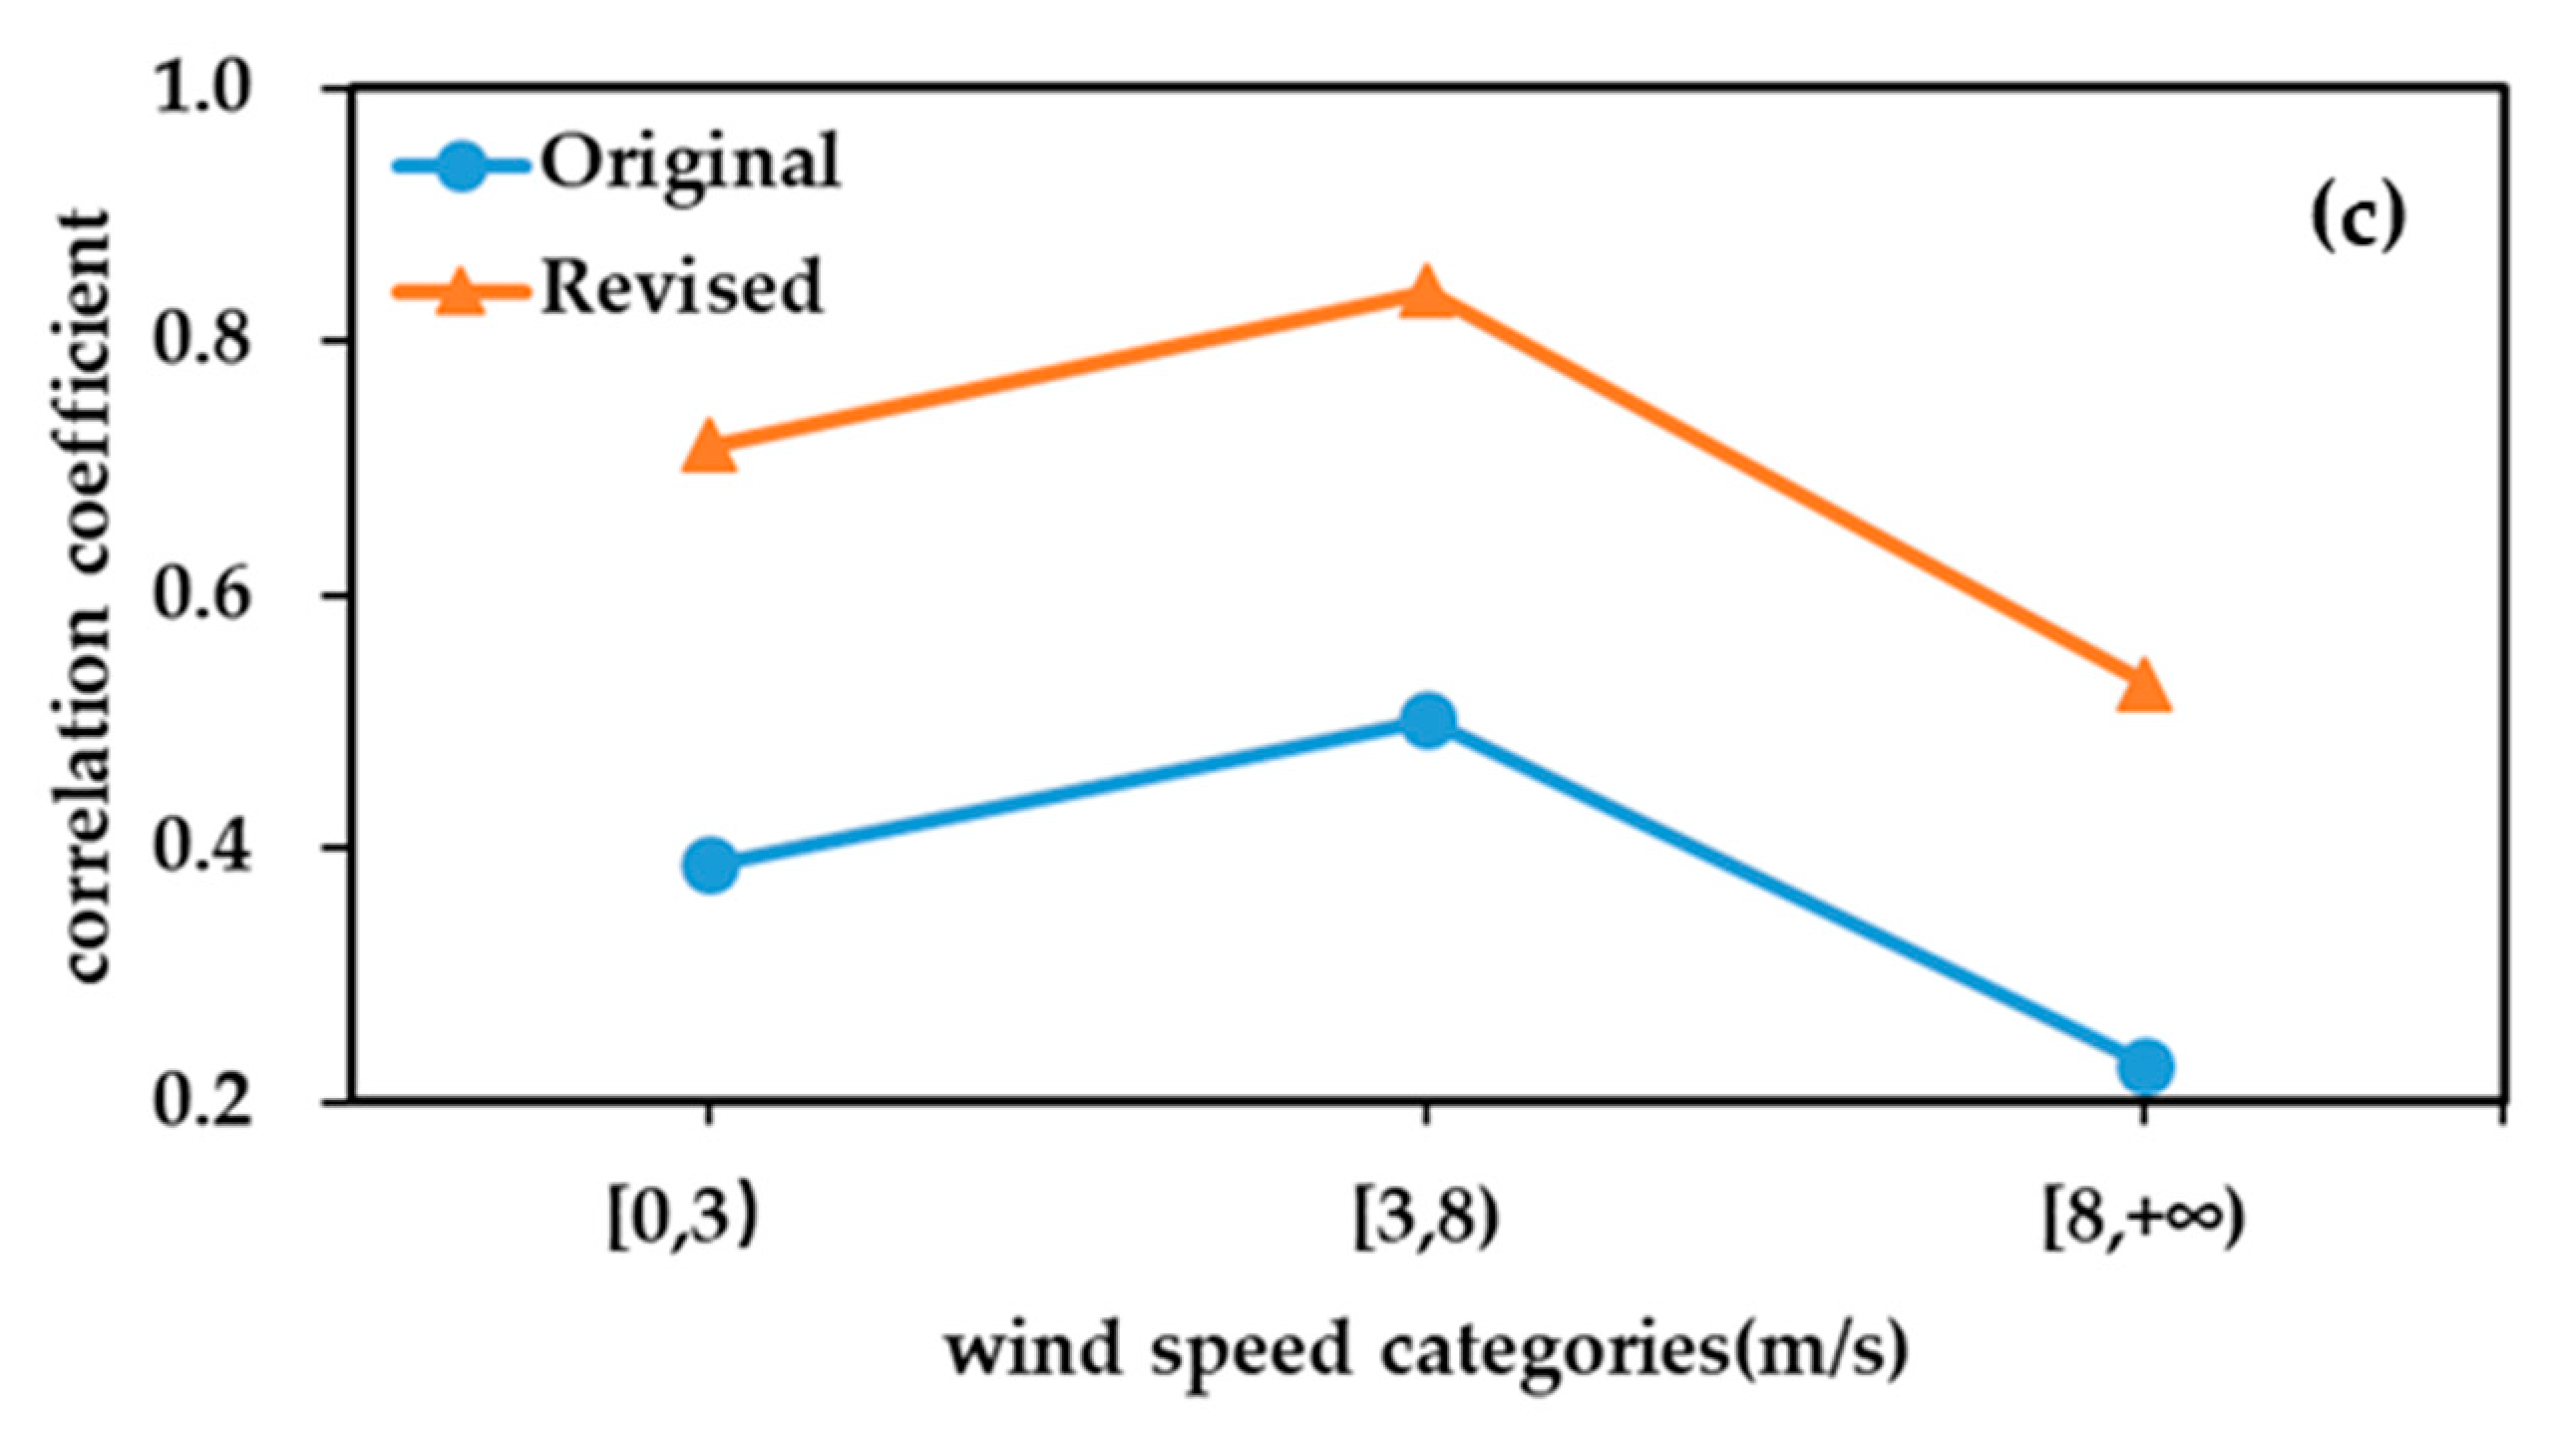
To evaluate the performance of the wind speed grid downscaling correction model under different wind speed levels, the observed wind speeds from national meteorological stations are divided into three categories: less than 3 m/s, between 3 and 8 m/s, and greater than or equal to 8 m/s. During the validation period, the sample sizes for these categories are 8402 (74.01%), 2786 (24.54%), and 164 (1.45%), respectively. The wind speed forecast performance statistics for different wind speed levels are shown in Figure 6. The forecast errors of the original model are relatively stable across all wind speed levels, with RMSE values around 2 m/s. The mean bias (BIAS) for wind speeds below 8 m/s is approximately 1 m/s, while for wind speeds above 8 m/s, the BIAS is −0.62 m/s, indicating that the model tends to overestimate wind speeds below 8 m/s and underestimate wind speeds above 8 m/s. Downscaling correction significantly improves the forecast accuracy for all wind speed levels, particularly for wind speeds below 8 m/s. For wind speeds below 3 m/s and between 3 and 8 m/s, the corrected RMSE values are 0.55 m/s and 0.73 m/s, respectively, reduced by approximately 1.45 m/s compared to the original forecasts, with RMSE improvement rates of 71.85% and 66.70%, respectively. The BIAS values for these categories are 0.11 m/s and −0.28 m/s, respectively, and the correlation coefficient (R) improves from 0.39–0.50 to around 0.80. For wind speeds above 8 m/s, the corrected RMSE is 1.65 m/s, reduced by 0.55 m/s, with an RMSE improvement rate of 24.98%. The BIAS is −0.93 m/s, slightly lower than the original model, likely due to the model’s tendency to significantly underestimate wind speeds during some strong wind events. The correlation coefficient (R) for this category improves significantly from 0.23 to 0.53. Overall, the downscaling correction has a significant effect on wind speed forecasts under all wind speed levels, particularly for wind speeds below 8 m/s, with RMSE improvement rates around 70%. Due to the fact that the ground truth grid data tend to underestimate wind speeds under strong wind conditions compared to observations, the downscaled corrected forecasts for strong winds are likely to be more noticeably underestimated. Future work can involve a detailed analysis of the wind speed distribution characteristics of the ground truth grid data under strong wind conditions, which can be used to further correct the forecasts for strong wind scenarios, thereby improving the accuracy of strong wind forecasts.

3.4. Analysis of Correction Effects for Strong Wind Cases

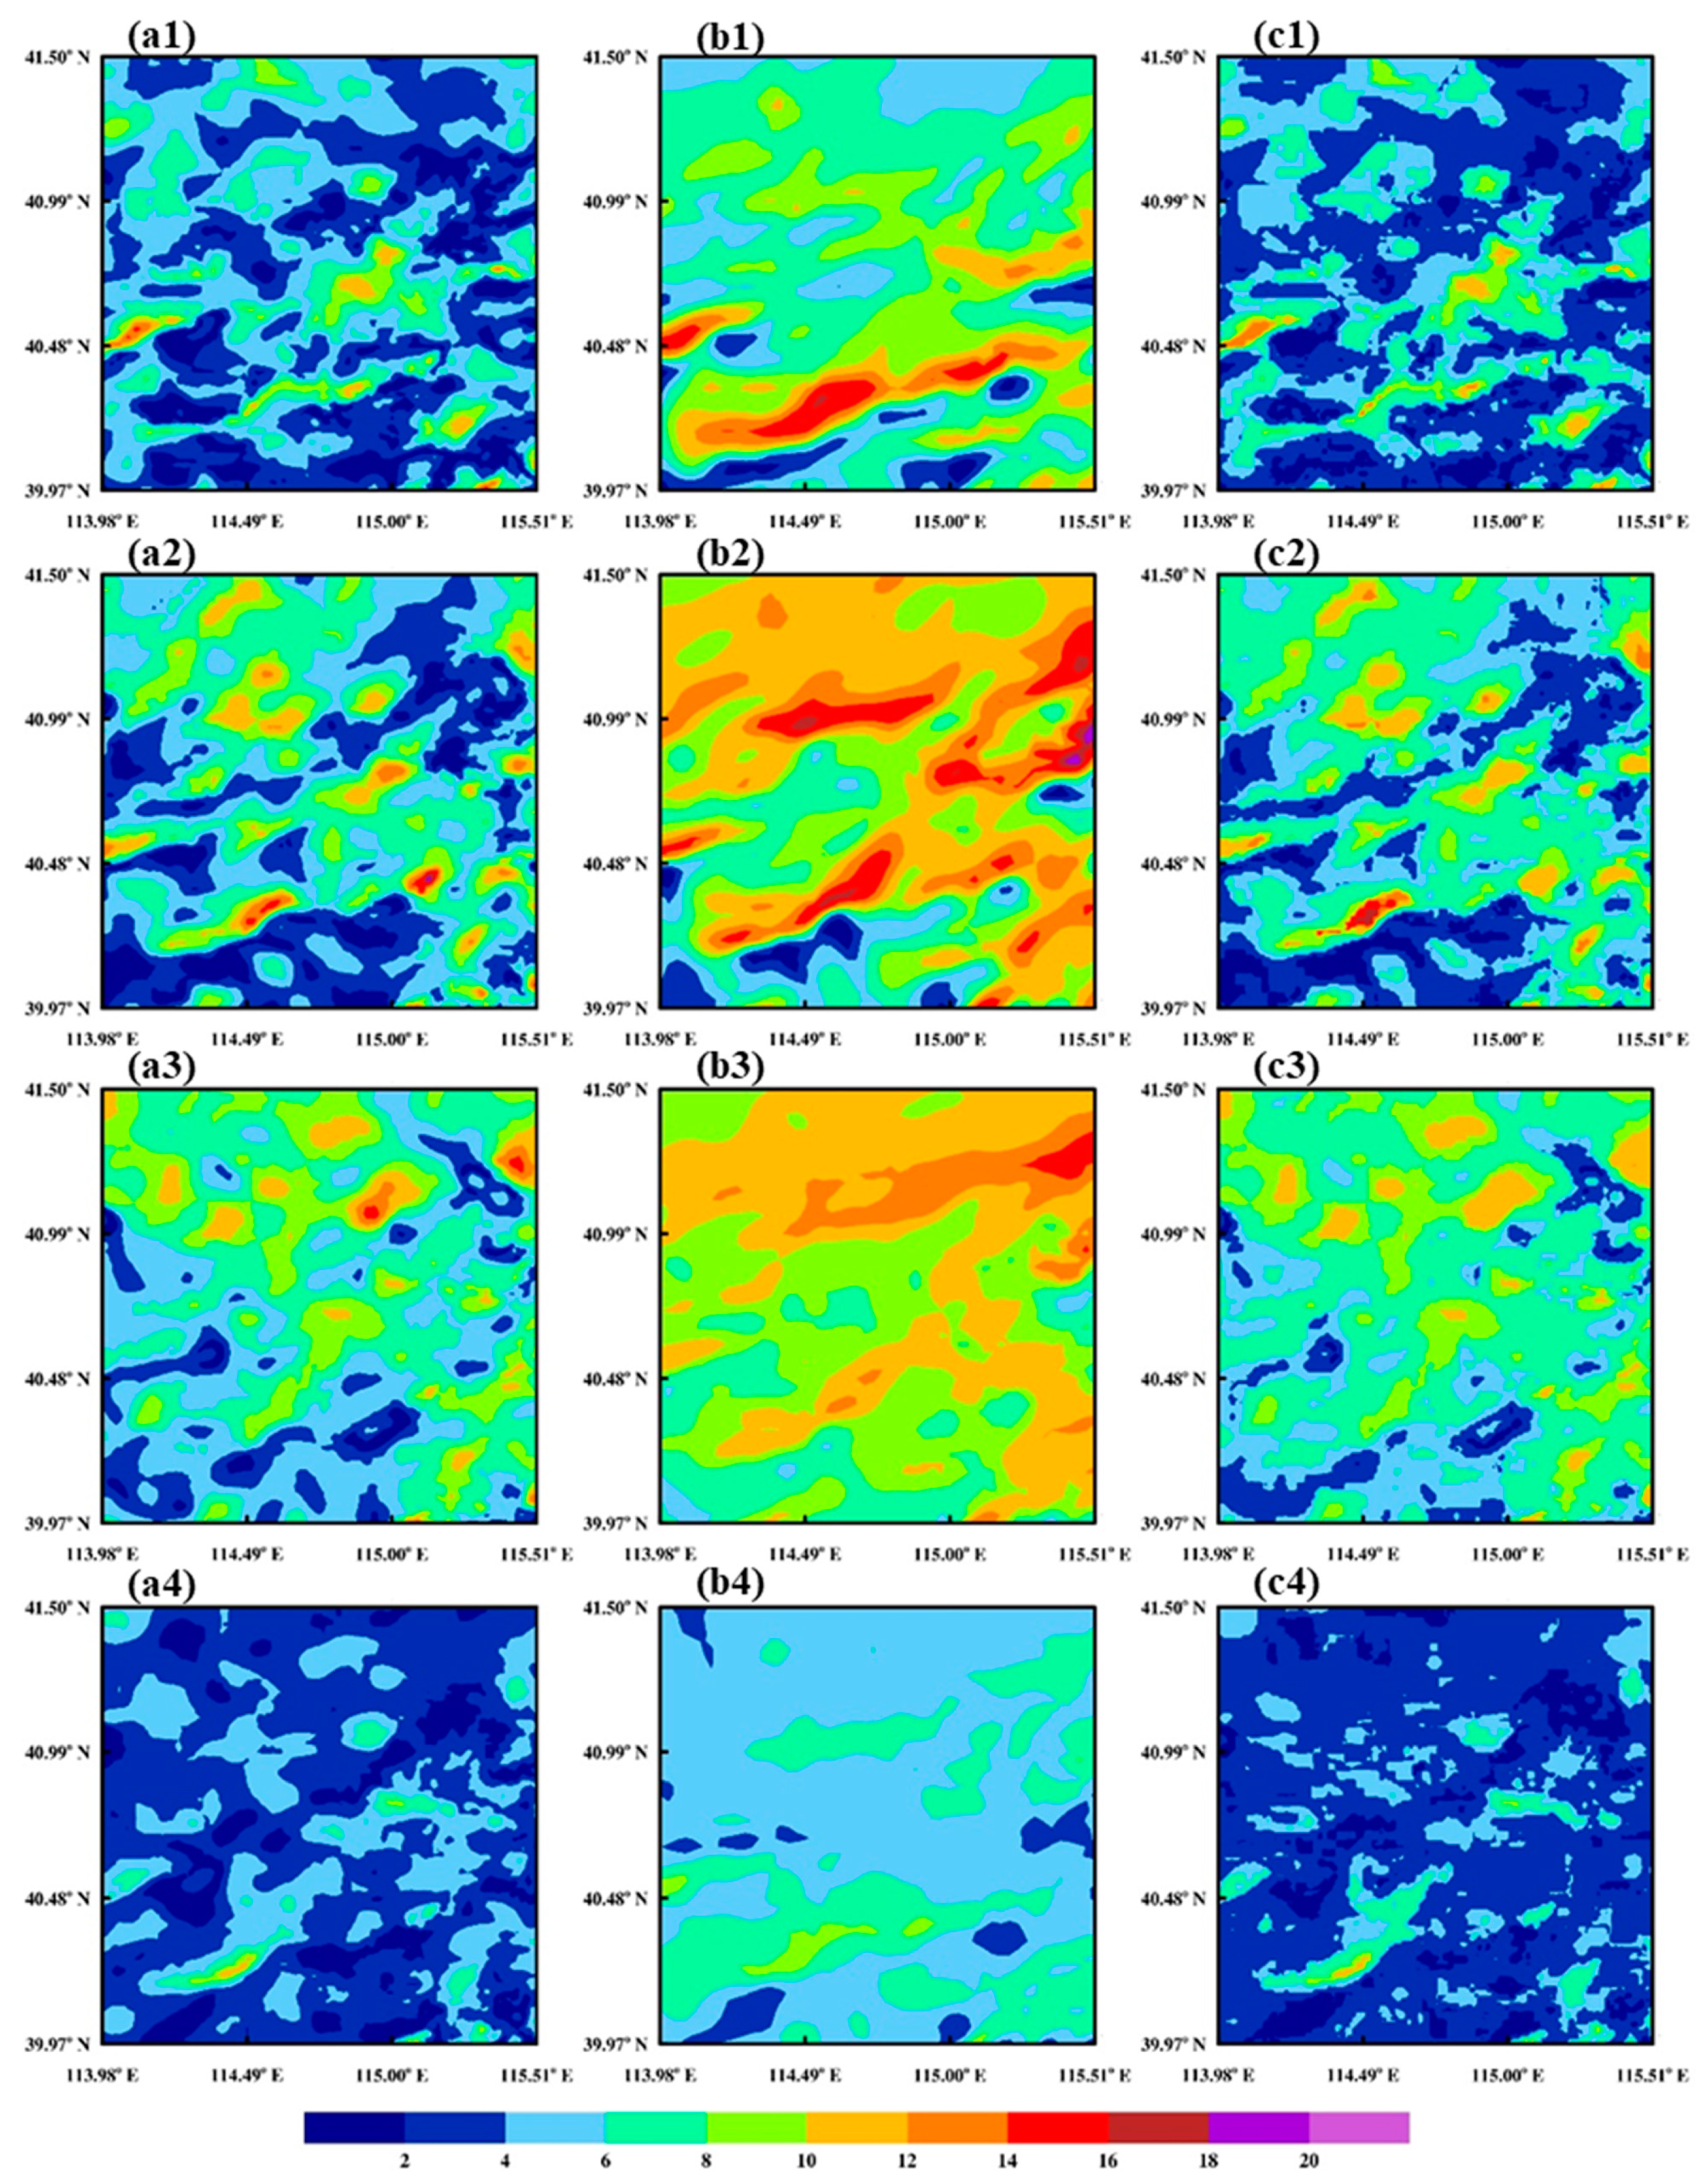
To further analyze the downscaling correction effects of wind speed forecasts under strong wind conditions, the spring strong wind event that occurred in Zhangjiakou, Hebei Province, on 26 April 2022 is selected. The strong winds tended to end around 17:00, and the main influencing weather system was the Mongolian cyclone. Figure 7a1–c1 show the CARAS-SUR_1 km ground truth wind speed, model forecast wind speed, and downscaled corrected forecast wind speed at 02:00 on 26 April 2022. At this time, the near-surface observed wind speeds were generally 2–8 m/s, while the model forecast wind speeds were mainly 6–12 m/s, significantly overestimating the observed values by more than 2 m/s, and in some southern parts of the study area, by more than 6 m/s. The downscaled corrected wind speeds were very close to the observed wind speeds, with consistent spatial distribution, except for some slightly underestimated wind speed extremes in the local valleys of the southwestern region. Compared to the model forecast wind speeds, the spatial distribution is more refined, demonstrating significant downscaling correction effects. Figure 7a2–c2 correspond to the observed and forecast wind speeds at 07:00 on 26 April 2022. At this time, the wind speeds had generally increased compared to 02:00, with near-surface observed wind speeds of 4–12 m/s. The model forecast wind speeds were mainly 6–16 m/s, significantly overestimating the observed values by more than 4 m/s, and in the northeastern part of the study area, where the terrain elevation exceeds 2000 m, by more than 10 m/s. The downscaled corrected wind speeds were very close to the observed wind speeds, with consistent overall spatial distribution, except for some slightly overestimated or underestimated wind speed extremes in local areas. Compared to the model forecast wind speeds, the spatial distribution is more refined, demonstrating significant downscaling correction effects. The conclusions for 13:00 (Figure 7a3–c3) and 19:00 (Figure 7a4–c4) are similar to the previous two times. Since these are 12 h and 18 h forecast wind speeds, the downscaling correction effects are slightly less effective than the previous two times. Overall, for the strong wind event, the downscaled corrected wind speed forecasts are more accurate, closely matching the observed wind speeds and providing a more refined spatial distribution compared to the original model forecast wind speeds. The spatiotemporal resolution and accuracy of the gridded wind speed forecasts are superior to those of existing regional studies [14,21,22,23,24]. The downscaling correction effects for wind speed forecasts are significant and have good reference value.
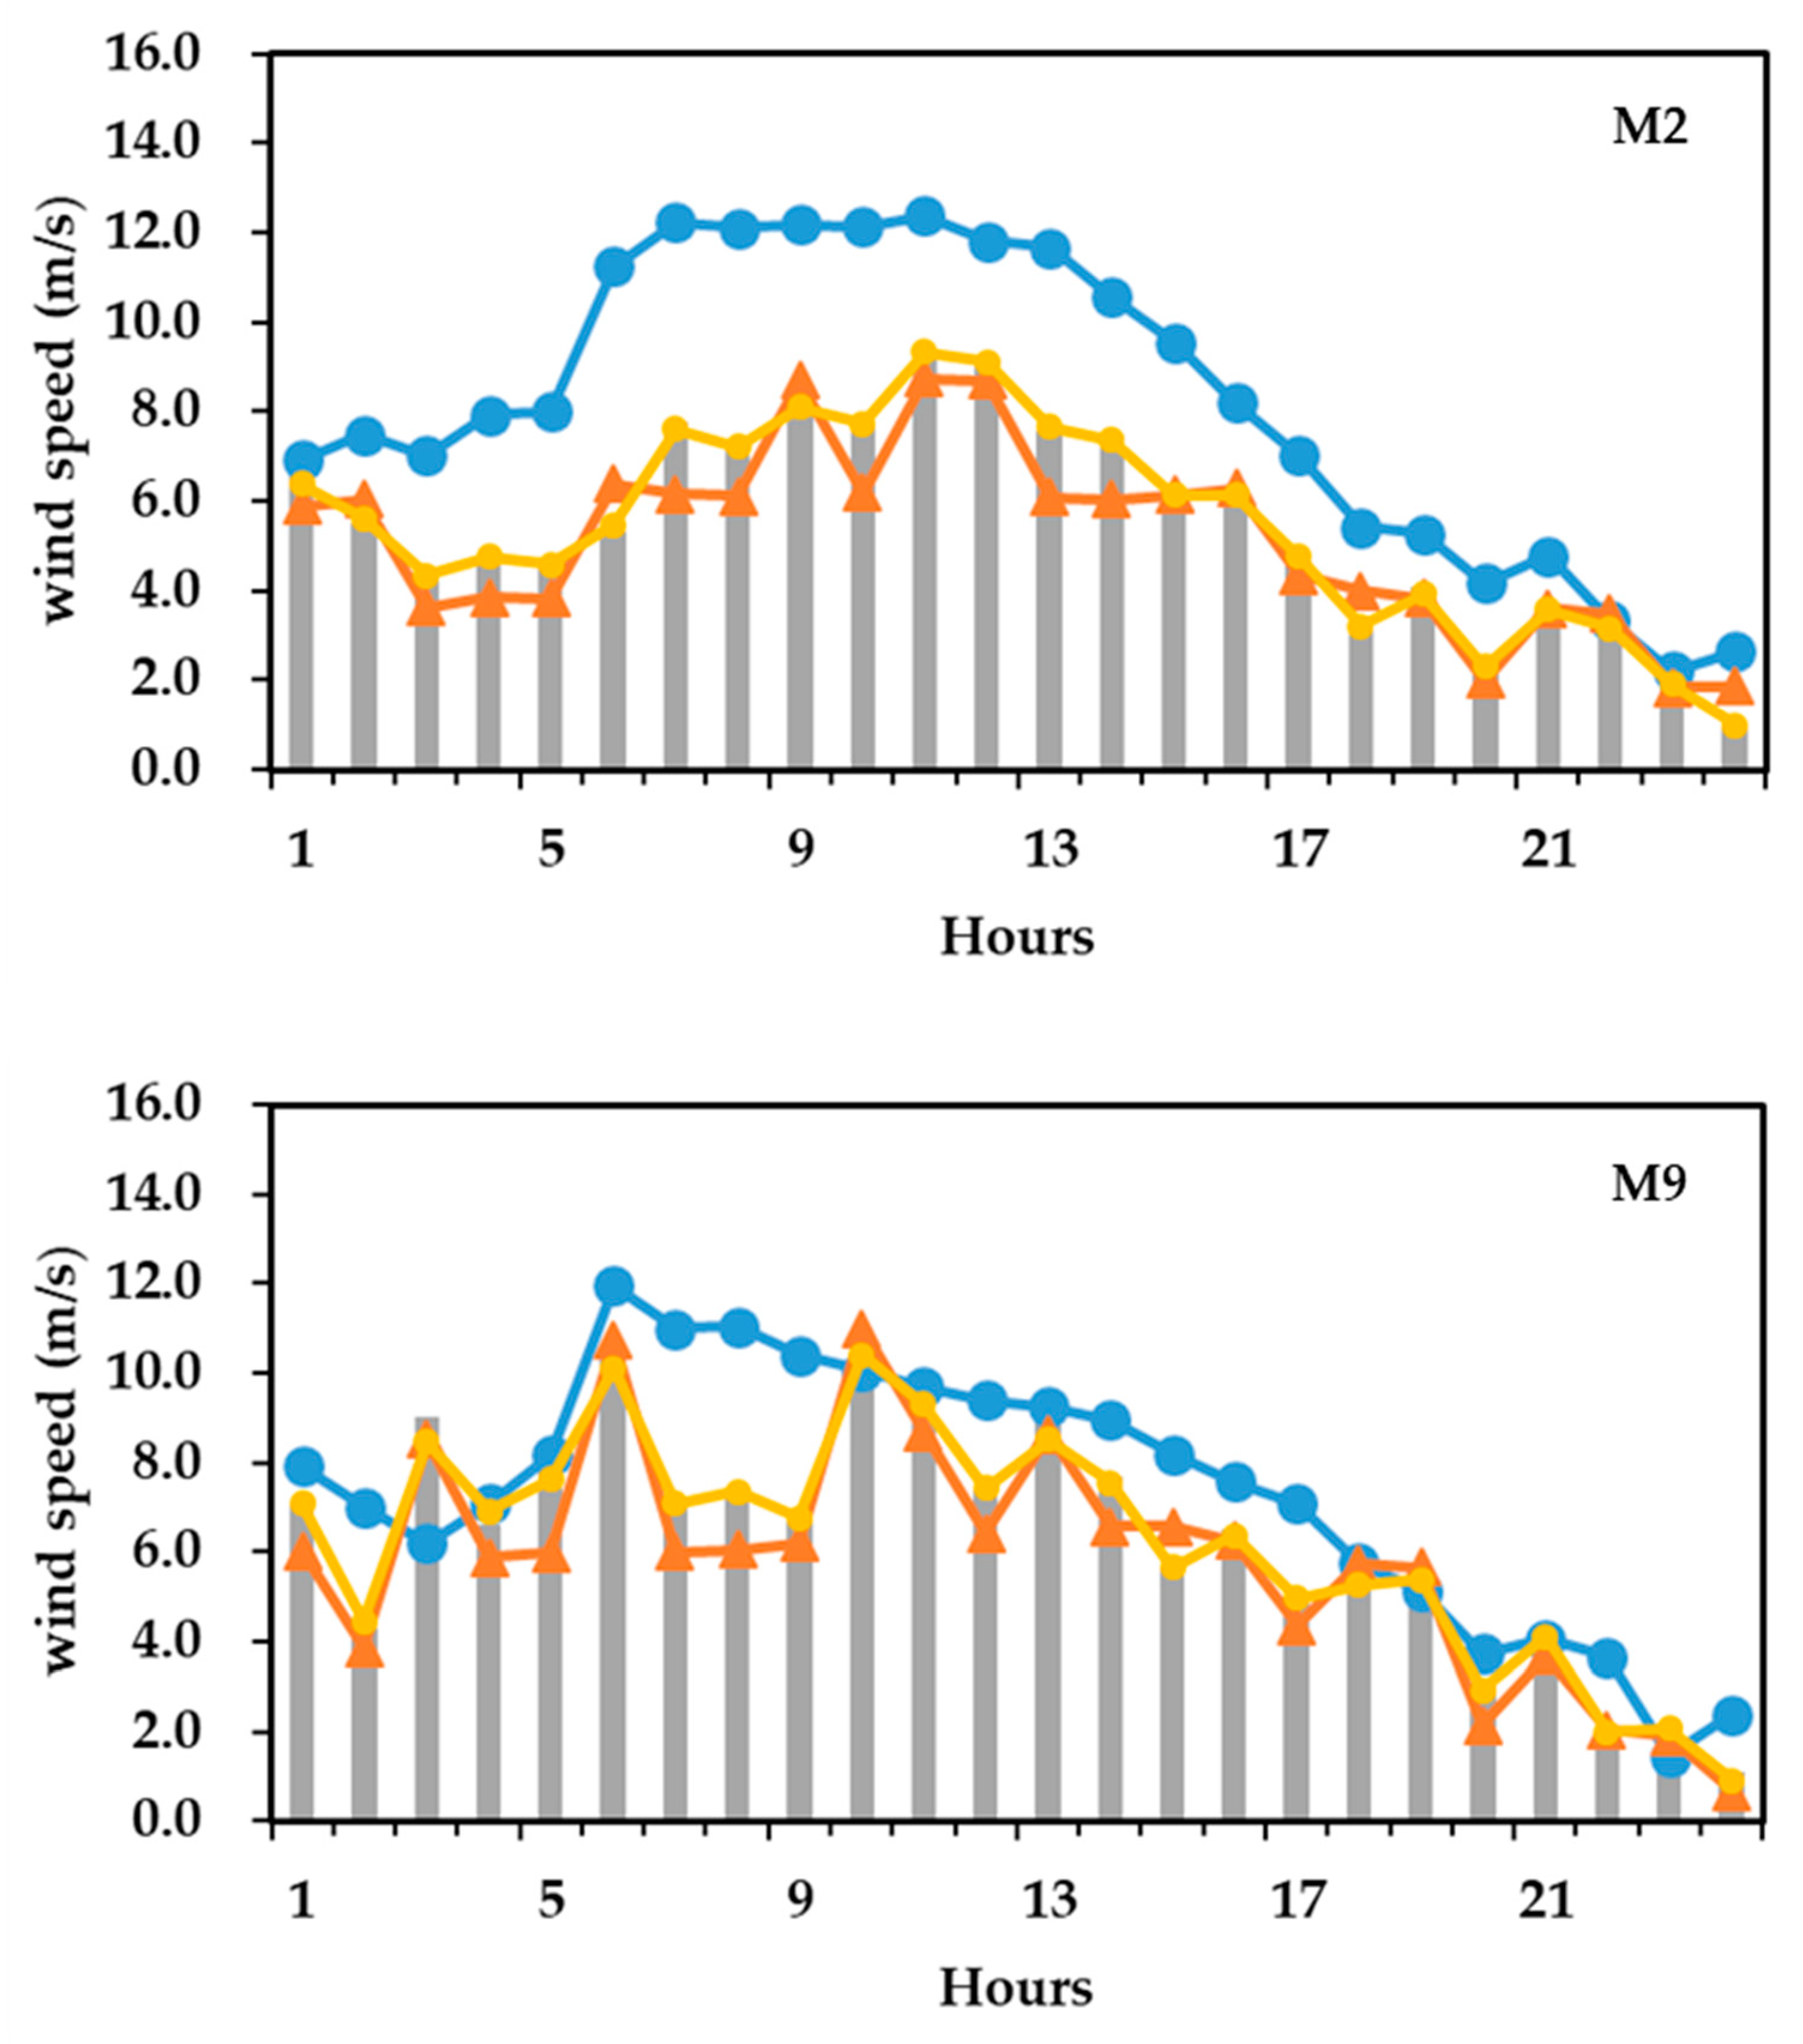
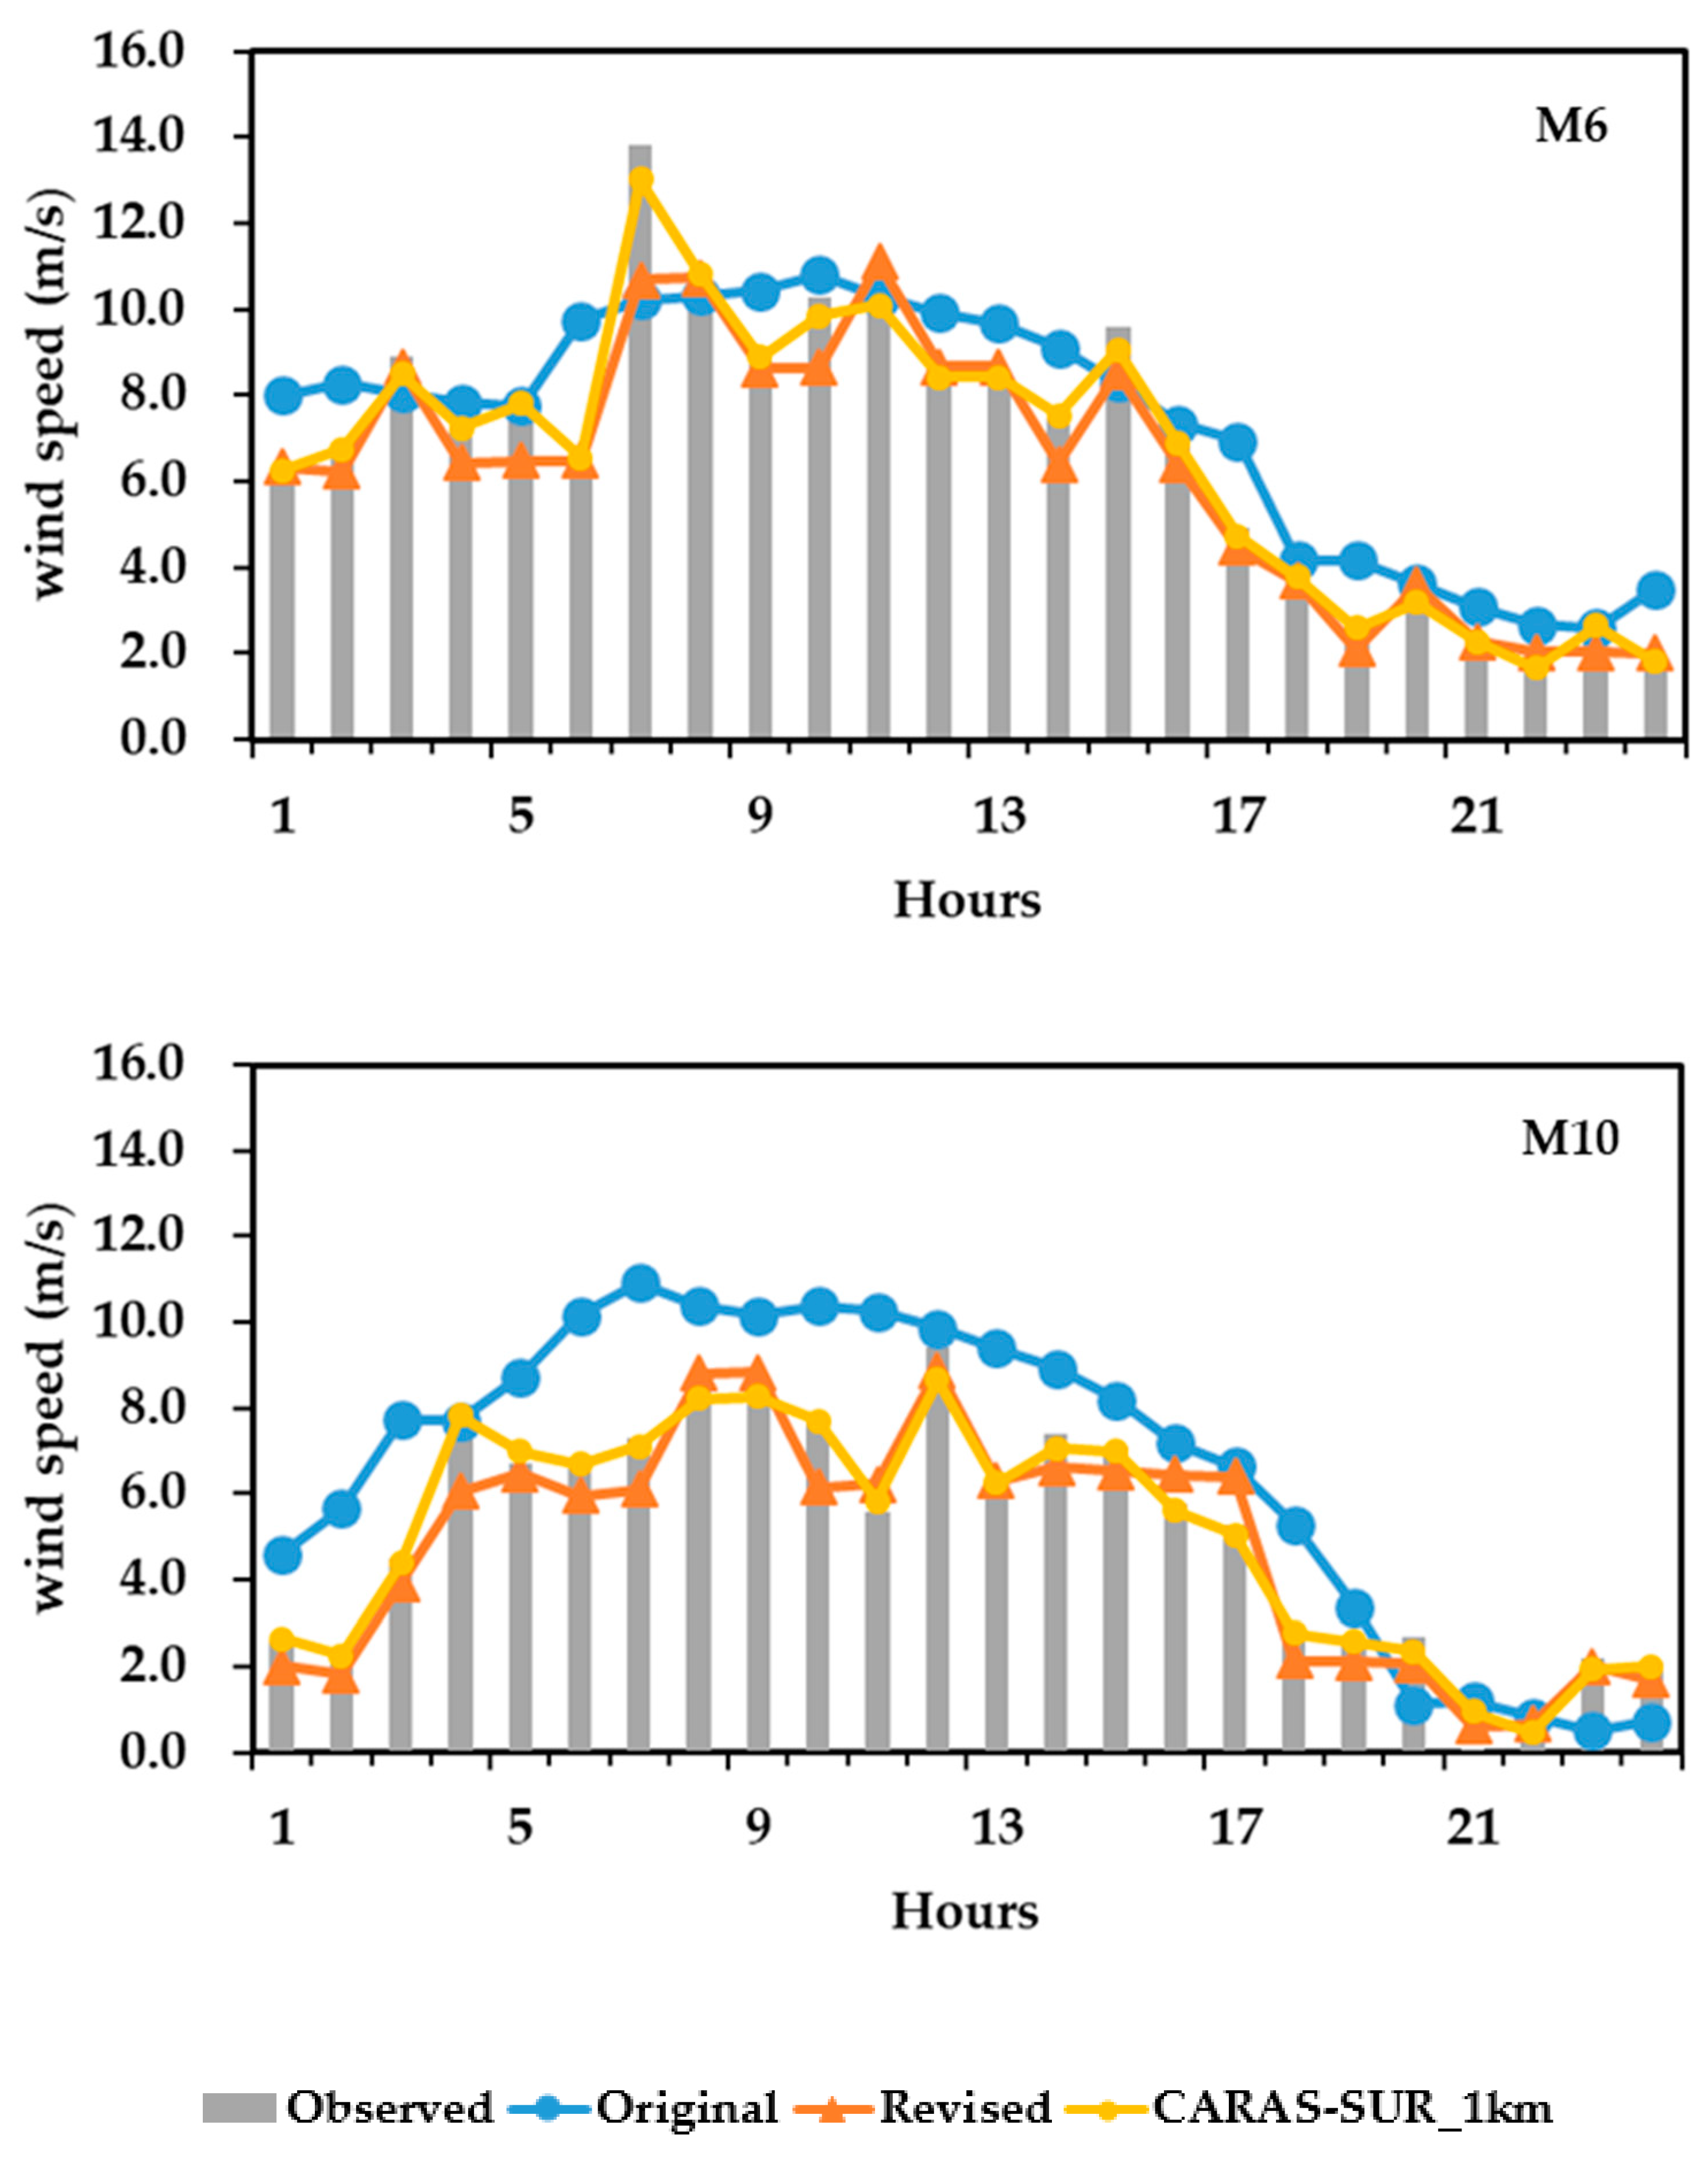
To calculate the improvement in wind speed forecasts after correction under different terrains in the strong wind-affected areas, four representative meteorological stations (M2, M9, M6, and M10) are selected for detailed analysis, covering the Bashang Plateau, mountainous areas, mid-mountain regions, and valleys (see Table 3). The original model’s wind speed forecast errors are relatively large, especially in the Bashang Plateau and valley regions, with RMSE values of 3.05 m/s and 2.28 m/s, and mean bias (BIAS) values of 2.66 m/s and 1.58 m/s, respectively. The RMSE values for the other representative meteorological stations are 1.89 m/s and 1.45 m/s, with BIAS values of 1.11 m/s and 0.57 m/s. After downscaling correction, the wind speed forecast improvements are significant, with RMSE values for the representative meteorological stations around 0.80 m/s. The RMSE improvement rates for the Bashang Plateau and valley representative stations are approximately 70%, while the improvement rates for the other representative stations are 58.96% and 35.87%, respectively. The BIAS values are around −0.40 m/s, and the correlation coefficient (R) improve to approximately 0.97. The time series of wind speeds for the representative meteorological stations on 26 April, as shown in Figure 8, indicate that the model forecast wind speeds were generally overestimated compared to the observations, with more obvious overestimations in the Bashang Plateau and valley regions. The corrected wind speeds were very close to the station observations and ground truth, with only a few instances where the corrected wind speeds, especially the extreme wind speeds, were underestimated compared to the observations. For the mid-mountain representative station M6, where the 7 h forecast wind speed suddenly increased to 13.8 m/s, the ground truth grid data were closest to the observations, with the model forecast wind speed at 10.2 m/s and the downscaled corrected forecast at 10.7 m/s, indicating a noticeable underestimation. Such abrupt increases in wind speed during transitional periods require further improvement and optimization in future work.

4. Conclusions

Using the CMA-MESO model forecast data and CARAS-SUR_1 km ground truth grid data from January, April, July, and October 2022, a near-surface 1 km wind speed grid forecast downscaling correction model has been established and evaluated for the complex terrain region in northwestern Hebei Province by employing the random forest machine learning algorithm. The following conclusions are drawn:
  • The evaluation with ground truth grid data indicates that, after downscaling correction, the spatial distribution of grid forecast wind speeds in the entire complex terrain study area becomes more refined, with the spatial resolution improving from 3 km to 1 km, reflecting the fine-scale terrain effects. The corrected wind speed significantly reduces the forecast errors compared to the model forecasts, with the forecast accuracy markedly improved. The mean bias (BIAS) decreases from 2.25 m/s to 0.02 m/s, basically eliminating the model’s systematic errors. The root mean square error (RMSE) decreases from 3.26 m/s to 0.52 m/s, reducing the model’s random errors, with an RMSE improvement rate of approximately 83.97%. The correlation coefficient (R) improves from 0.68 to 0.96.
  • In terms of spatiotemporal variation characteristics, the wind speed grid forecast downscaling correction method shows more significant improvements in high-altitude complex terrain areas, forecasts beyond 12 h, and spring wind speed forecasts. The corrected wind speed forecast errors are more stable in both time and space, with forecast errors caused by terrain, forecast lead time, and seasonal factors significantly reduced. For wind speed levels below 8 m/s, the RMSE decreases from 2.02 m/s to 0.59 m/s, with an RMSE improvement rate of 70.55%, indicating a significant correction improvement. For wind speed levels above 8 m/s, the RMSE decreases from 2.20 m/s to 1.65 m/s, with an RMSE improvement rate of 24.98%, showing good correction effects for wind speeds above 5 on the Beaufort scale.
  • The specific performance of the forecast wind speeds before and after downscaling correction is analyzed by selecting the strong wind event in Zhangjiakou on 26 April 2022. During this weather event, the forecast wind speeds in the study area are generally overestimated. After downscaling correction, the spatial distribution of the forecast wind speeds becomes more refined and closely matches the ground truth grid and station observations, with consistent spatial distribution. The RMSE in the strong wind-affected area decreases from 2.17 m/s to 0.83 m/s, with an RMSE improvement rate of 61.71%, indicating significant downscaling correction effects, especially in the Bashang Plateau and valley regions. The downscaling corrected results have significant reference value.
For wind events above 5 on the Beaufort scale in this article, the downscaled corrected wind speeds are still noticeably lower than the observed extreme winds or sudden increases in wind speed at certain times. This is due to the fact that the ground truth gridded data, which serve as the target variable for modeling, tend to underestimate wind speeds under strong wind conditions compared to observations. The quality of the ground truth gridded data is crucial for the downscaling correction effectiveness of gridded wind speed forecasts. Improving the accuracy of ground truth gridded data under strong wind conditions, or conducting an in-depth analysis of their error characteristics to further correct the gridded wind speed forecasts, will be key directions for enhancing the accuracy of gridded wind speed forecasts, especially for extreme and transitional wind events. Additionally, since the gridded downscaling correction model consumes significant computational and storage resources, future work should focus on optimizing and streamlining the model based on longer sequence datasets to facilitate operational applications. This will provide robust product support for wind power generation, transportation, and severe wind meteorological disaster risk warning services.

Author Contributions

Conceptualization, X.L. and Y.S.; methodology, X.L. and Y.S.; validation, X.L. and Z.L.; formal analysis, X.L. and Z.L.; data curation, Z.L.; writing—original draft preparation, X.L.; writing—review and editing, X.L.; visualization, X.L. and Z.L.; supervision, Y.S. All authors have read and agreed to the published version of the manuscript.

Funding

This research was funded by the Champion Project of China Meteorological Administration under Grant No. CMAJBGS202209b, the Innovation and Development Project of China Meteorological Administration under Grant No. CXFZ2024J038, the Youth Innovation Team Project of China Meteorological Administration under Grant No. CMA2024QN15.

Institutional Review Board Statement

Not applicable.

Informed Consent Statement

Not applicable.

Data Availability Statement

The raw data supporting the conclusions of this article will be made available by the authors upon request due to privacy.

Conflicts of Interest

The authors declare no conflicts of interest. The funders had no role in the design of the study; in the collection, analyses, or interpretation of data; or in the writing of the manuscript.

References

  1. Zhang, Y.C.; Xiao, Y.; Deng, H. Research on short-term wind speed correction technology of wind farm based on ELM. Meteor Mon. 2016, 42, 466–471. [Google Scholar]
  2. Ye, X.L.; Gu, R.; Deng, H.; Chen, H.; Yang, X. Modification technology research of short-term wind speed in wind farm based on WRF model and PSO-LSSVM method. Power Syst. Prot. Control 2017, 45, 48–54. [Google Scholar]
  3. Wang, H.; Li, Y.; Wu, Z.H.; Guo, P. Advances in researches on mechanisms and forecast techniques of high winds in China. Meteorol. Sci. Technol. 2019, 47, 600–607. [Google Scholar]
  4. Zhu, H.F.; Wang, D.Y.; Guan, Z.Y.; Liu, Y.; Fu, Y.F. Effects of different initial fields on grapes numerical prediction. Acta Meteorol. Sin. 2007, 65, 493–502. [Google Scholar]
  5. Zhang, G.J.; Wang, M.H.; Lu, C.S.; Bao, Q.; Wang, Y. Development of parameterizations of atmospheric physical processes for high resolution global climate models and their applications. China Basic Sci. 2017, 19, 40–44. [Google Scholar]
  6. Carvalho, D.; Rocha, A.; Gomez-Gesteira, M.; Santos, C. A sensitivity study of the WRF model in wind simulation for an area of high wind energy. Environ. Model. Softw. 2012, 33, 23–34. [Google Scholar] [CrossRef]
  7. Xiao, Q.Y.; Hu, F.; Fan, S.J. Model output statistics and wind power numerical prediction. Resour. Sci. 2017, 39, 116–124. [Google Scholar]
  8. Sun, J.B.; Qian, Y.Z.; Chen, P.Y.; Zheng, Z.; Le, Y.L. The Artificial neural network method on the station wind in landfall typhoon. Meteor Mon. 2010, 36, 81–86. [Google Scholar]
  9. Zjavka, L. Wind speed forecast correction models using polynomial neural networks. Renew. Energy 2015, 83, 998–1006. [Google Scholar] [CrossRef]
  10. Deng, H.; Zhang, Y.C.; Gu, R.; Huang, F.; Zhi, X.L. Correction method of short-term wind speed in wind farm research based on PCA and RBF neural network. Meteorol. Sci. Technol. 2018, 46, 10–15. [Google Scholar]
  11. QI, S.B.; WANG, W.Q.; ZHANG, X.Y. Wind speed and wind power prediction based on SVM. East China Electr. Power 2009, 37, 1600–1603. [Google Scholar]
  12. Kong, L.B.; Zhao, Y.R.; Wang, J.J.; Tong, J.L.; Dang, Z.L.; Zhang, W.Y. Modification of wind speed based on SVM. J. Southwest Univ. (Nat. Sci. Ed.) 2014, 36, 194–200. [Google Scholar]
  13. Lin, Y.J.; Kruger, U.; Zhang, J.P.; Wang, Q.; Lamont, L.; El Chaar, L. Seasonal analysis and prediction of wind energy using random forests and ARX model structures. IEEE Trans. Control Syst. Technol. 2015, 23, 1994–2002. [Google Scholar] [CrossRef]
  14. Sun, Q.D.; Jiao, R.L.; Xia, J.J.; Yan, Z.W.; Li, H.C.; Sun, J.H.; Wang, L.Z.; Liang, Z.M. Adjusting wind speed prediction of numerical weather forecast model based on machine learning methods. Meteorol. Mon. 2019, 45, 426–436. [Google Scholar]
  15. Xu, L.N.; Shen, Y.B.; Feng, Z.; Ye, H. Applicability research and integrated application of various correction methods for wind speed forecast in a wind farm. Arid Land Geogr. 2022, 45, 1114–1124. [Google Scholar]
  16. Zhang, T.J.; Yan, P.C.; Zhang, Z.Y.; Duan, H.X.; Wang, Y.S.; Li, Y.H. Application of various technologies in modification of wind speed forecast in wind farms. J. Arid Meteorol. 2018, 36, 835–844. [Google Scholar]
  17. Shi, L.; Xu, L.N.; Hao, Y.Z. The correction of forecast wind speed in a wind farm based on partitioning of the high correlation of wind speed. J. Appl. Meteorol. Sci. 2016, 27, 506–512. [Google Scholar]
  18. Su, X.; Li, C. Jiangsu offshore wind speed calibration based on optimal threat score and frequency matching. Mar. Sci. Bull. 2020, 39, 548–557. [Google Scholar]
  19. Wu, D.; Tian, H.Q.; Liu, H.; Wang, J.J.; Zuo, C.L.; Xu, J.J. Bias correction of wind speed forecasts for the WRF model in Anhui province based on the analog Kalman filter method. J. Meteorol. Environ. 2023, 39, 31–37. [Google Scholar]
  20. Yang, C.; Jiang, Y.J.; Yu, Z.S.; Jiang, W.D.; Kang, L.L.; Wang, L.J. Correction technology of regional wind speed forecasting based on partial least squares regression. Meteorol. Mon. 2019, 45, 676–684. [Google Scholar]
  21. Zeng, X.Q.; Xue, F.; Yao, L.; Zhao, S.R. Comparative study of different error correction methods on model output wind field. J. Appl. Meteorol. Sci. 2019, 30, 49–60. [Google Scholar]
  22. Mao, B.; Yang, H.; Zhou, S.J.; Yang, K.Q.; Chen, M. Deep learning method for wind speed grid point forecasting data correction based on CMA-REPS. J. Chengdu Univ. Inf. Technol. 2023, 38, 264–270. [Google Scholar]
  23. Han, L.; Chen, M.X.; Chen, K.K.; Chen, H.N.; Zhang, Y.B.; Lu, B.; Song, L.Y.; Qin, R. A Deep Learning Method for Bias Correction of ECMWF 24–240 h Forecasts. Adv. Atmos. Sci. 2021, 38, 1444–1459. [Google Scholar] [CrossRef]
  24. Yang, X.; Dai, K.; Zhu, Y.J. Calibration of Gridded Wind Speed Forecasts Based on Deep Learning. J. Meteor. Res. 2023, 37, 757–774. [Google Scholar] [CrossRef]
  25. Gerges, F.; Boufadel, M.C.; Bou-Zeid, E.; Nassif, H.; Wang, J.T.L. Downscaling Daily Wind Speed with Bayesian Deep Learning for Climate Monitoring. Int. J. Data Sci. Anal. 2024, 17, 411–424. [Google Scholar] [CrossRef]
  26. Ferrarin, L.; Stucchi, L.; Bocchiola, D. Statistical Downscaling of GCMs Wind Speed Data for Trend Analysis of Future Scenarios: A Case Study in the Lombardy Region. Theor. Appl. Climatol. 2024, 155, 4875–4890. [Google Scholar] [CrossRef]
  27. Wang, H.; Yin, S.; Yue, T.; Chen, X.; Chen, D. Developing a Dynamic-Statistical Downscaling Framework for Wind Speed Prediction for the Beijing 2022 Winter Olympics. Clim. Dyn. 2024. [Google Scholar] [CrossRef]
  28. Shin, J.Y.; Min, B.; Kim, K.R. High-Resolution Wind Speed Forecast System Coupling Numerical Weather Prediction and Machine Learning for Agricultural Studies—A Case Study from South Korea. Int. J. Biometeorol. 2022, 66, 1429–1443. [Google Scholar] [CrossRef]
  29. Hao, L.; Li, W. Relationship between Circulation Patterns in North China and Climate in Hebei. Trans. Atmos. Sci. 2009, 32, 618–626. [Google Scholar]
  30. Yuan, S.; Qi, J.; Wang, W.; Huang, N. Short-term Wind Speed Prediction Using Regularized Extreme Learning Machine. Power Syst. Clean Energy 2016, 32, 62–68. [Google Scholar]
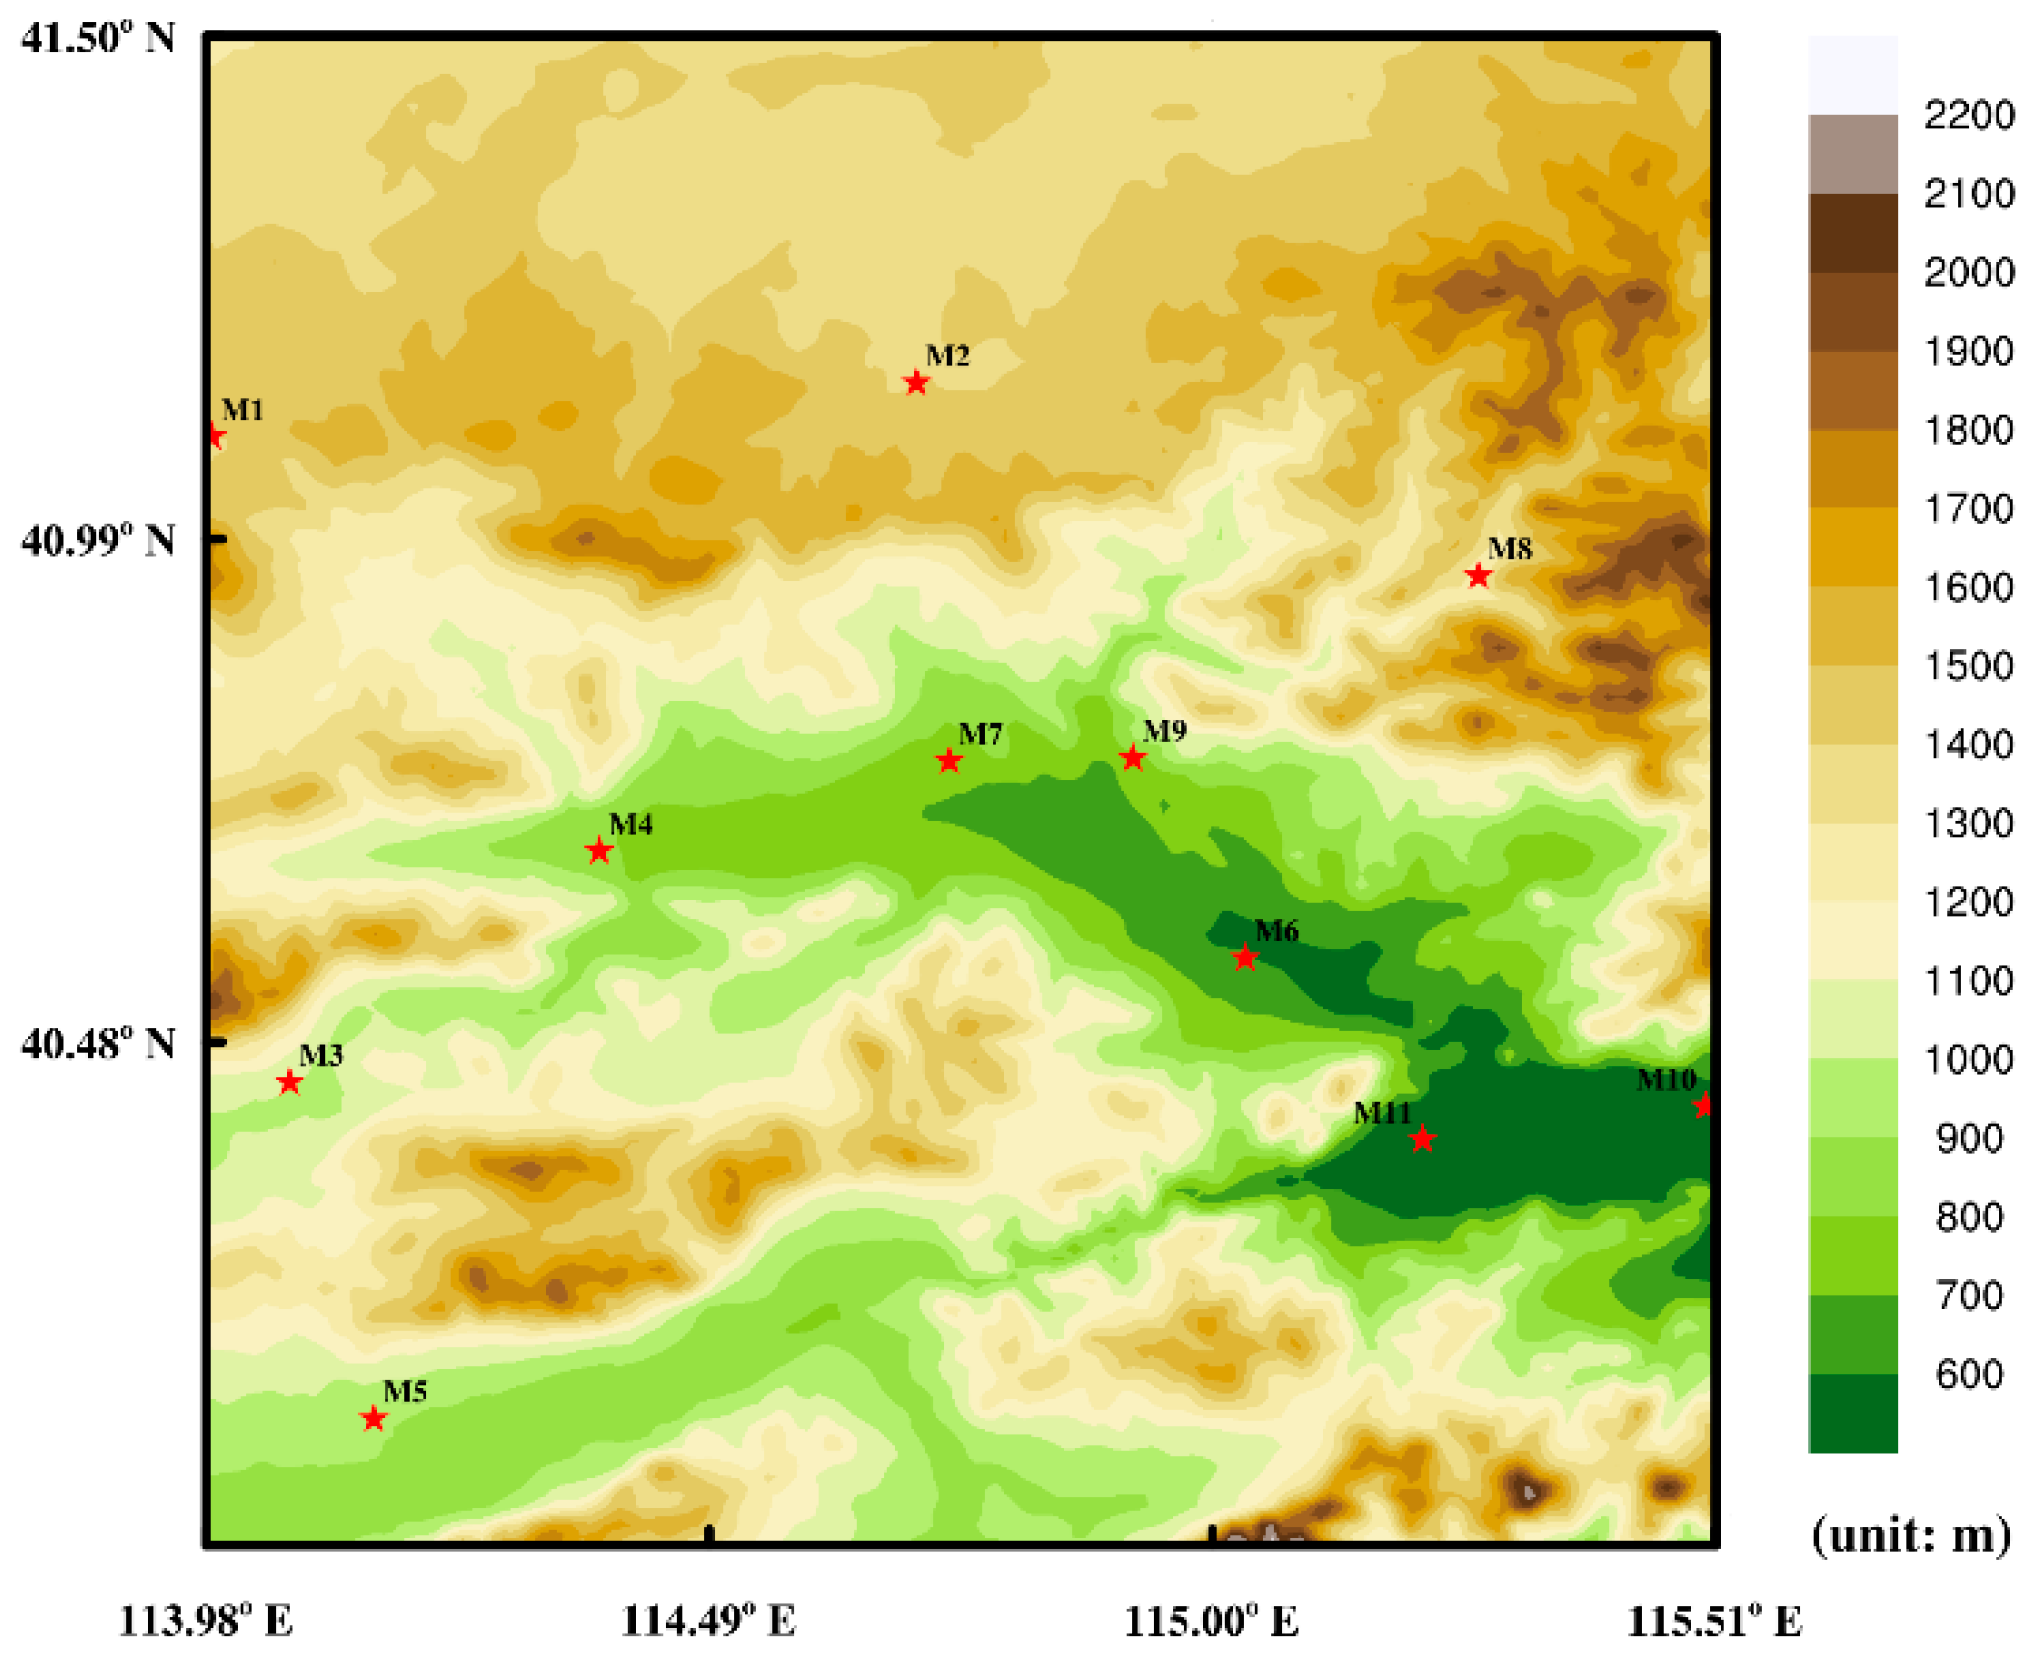
Figure 1. The topography and distribution of national meteorological stations in the study area. M1—Shangyi, M2—Zhangbei, M3—Tianzhen, M4—Huai’an, M5—Yangyuan, M6—Xuanhua, M7—Wanquan, M8—Chongli, M9—Qiaodong, M10—Huailai, M11—Zhuolu.
Atmosphere 15 01090 g001
Figure 2. Flowchart of the wind speed gridded downscaling correction model using the random forest algorithm.
Atmosphere 15 01090 g002
Figure 3. Spatial distributions of the mean wind speed by CARAS-SUR_1 km (a), CMA-MESO 3 km (b), downscaling corrected forecast (c), the root mean square error (RMSE) of forecasting wind speed (d), and downscaling corrected wind speed (e) in the study area in 2022 (unit: m/s).
Atmosphere 15 01090 g003
Figure 4. The root mean square error (RMSE) (a), mean bias (BIAS) (b), and correlation coefficient (R) (c) of wind speed forecasts for representative months in each season in the study area in 2022.
Atmosphere 15 01090 g004
Figure 5. The root mean square error (RMSE) (a), mean bias (BIAS) (b), and correlation coefficient (R) (c) of wind speed forecasts for 1 to 24 h in the study area in 2022.
Atmosphere 15 01090 g005aAtmosphere 15 01090 g005b
Figure 6. The root mean square error (RMSE) (a), mean bias (BIAS) (b), and correlation coefficient (R) (c) of wind speed forecasts for different wind speed categories in the study area in 2022.
Atmosphere 15 01090 g006aAtmosphere 15 01090 g006b
Figure 7. Spatial distributions of near-surface observed wind speed from CARAS-SUR_1 km (a1,a2,a3,a4), forecasted wind speed from CMA-MESO 3 km (b1,b2,b3,b4), and downscaling corrected forecasted wind speed (c1,c2,c3,c4) at 02:00, 07:00, 13:00, and 19:00 on 26 April 2022 in the study area (unit: m/s).
Atmosphere 15 01090 g007
Figure 8. The time series plot of wind speeds at representative meteorological stations on 26 April 2022. M2—Zhangbei, M9—Qiaodong, M6—Xuanhua, M10—Huailai.
Atmosphere 15 01090 g008aAtmosphere 15 01090 g008b
Table 1. The 24 feature variables used for model training.
NumberNameNumberName
1Elevation13Horizontal wind speed at 700 hPa
2Lat14Geopotential height at 700 hPa
3Lon15Relative humidity at 700 hPa
4Forecast duration16Temperature at 700 hPa
5Wind speed at 10 m17Horizontal wind speed at 850 hPa
6Surface pressure18Geopotential height at 850 hPa
7Relative humidity at 2 m19Relative humidity at 850 hPa
8Air temperature at 2 m20Temperature at 850 hPa
9Horizontal wind speed at 500 hPa21Horizontal wind speed at 925 hPa
10Geopotential height at 500 hPa22Geopotential height at 925 hPa
11Relative humidity at 500 hPa23Relative humidity at 925 hPa
12Temperature at 500 hPa24Temperature at 925 hPa
Table 2. Statistical analysis of downscaling correction forecast performance of wind speed at meteorological stations in the study area in 2022.
SitesObserved Mean
(m/s)
Revision StatusRMSE
(m/s)
BIAS
(m/s)
RC
(%)
M12.75original2.501.80 0.7465.82
revised0.86−0.080.95
M22.89original2.611.930.7076.35
revised0.62−0.030.96
M32.37original1.770.460.6465.96
revised0.60−0.010.93
M41.85original1.830.870.6768.80
revised0.570.010.91
M51.74original2.091.180.6274.68
revised0.530.080.92
M62.81original1.780.500.7365.25
revised0.62−0.120.96
M72.07original1.860.810.6969.53
revised0.57−0.030.95
M81.69original1.880.900.6760.72
revised0.740.150.88
M92.58original2.121.110.6969.22
revised0.65−0.120.94
M102.11original2.181.380.7474.29
revised0.560.030.95
M111.54original1.330.280.6559.70
revised0.540.080.91
Table 3. Statistical analysis of downscaling correction forecast performance of wind speed at representative meteorological stations during the severe wind event on 26 April 2022 in the study area.
SitesObserved Mean
(m/s)
Revision StatusRMSE
(m/s)
BIAS
(m/s)
RC
(%)
M25.52original3.052.660.9371.97
revised0.85−0.360.94
M96.28original1.891.110.8458.96
revised0.78−0.460.97
M66.80original1.450.570.9135.87
revised0.93−0.500.97
M105.09original2.281.580.9066.50
revised0.76−0.310.97
Disclaimer/Publisher’s Note: The statements, opinions and data contained in all publications are solely those of the individual author(s) and contributor(s) and not of MDPI and/or the editor(s). MDPI and/or the editor(s) disclaim responsibility for any injury to people or property resulting from any ideas, methods, instructions or products referred to in the content.