Abstract
The spatiotemporal and cloud features of the extreme rainfall under the warm and cold upper-level anomalies over the central Yungui Plateau (YGP) were investigated using the hourly rain gauge records, ERA5 reanalysis data, TRMM, and Fengyun satellite data, aiming to refine the understanding of different types of extreme rainfall. Extreme rainfall under an upper-level negative temperature anomaly (cold events) presents stronger convective cloud features when compared with the positive temperature anomaly (warm events). The maximum rainfall intensity and duration in cold events is much larger than that of warm events, while the brightness temperature of the cloud top is lower, and the ratio of convective rainfall is higher. In cold events, the middle-to-upper troposphere is dominated by a cold anomaly, and an unstable configuration with upper (lower) cold (warm) anomalies is observed around the central YGP. Although the upper-level temperature anomaly is positive, the anomalous divergence and convergence of southerly and northerly winds, as well as the strong moisture center and upward motions, are also found over the central YGP in warm events. The stronger atmospheric instability and higher convective energy under the upper-level cold anomalous circulation are closely associated with the rainfall features over the central YGP. The results indicate that the upper tropospheric temperature has significant influences on extreme rainfall, and thus more attention should be paid to the upper tropospheric temperature in future analyses.
1. Introduction
Scholars have always focused on the mechanisms of the form and variation in extreme rainfall, especially in regions with complex terrain [1,2]. The Yungui Plateau (YGP) is located in the southeastern region of the Tibetan Plateau. Influenced by complex topography, rainfall over the YGP usually occurs during the period from midnight to the morning, and the hourly maximum of heavy rainfall over the central YGP is observed around midnight [3]. It is different from the diurnal peaks of heavy rainfall over eastern China and even that over the higher elevations over the YGP, where heavy rainfall always follows the late-afternoon peak patterns [4,5]. Late-afternoon rainfall is usually closely linked with unstable atmospheric stability [6], lasting for a shorter period and presenting a larger convective ratio [7,8,9]. Nocturnal rainfall is greatly influenced by large-scale low-level circulations and has opposite rainfall characteristics to the late-afternoon rainfall [10,11,12].
The different rainfall features may also be affected by upper-level circulations. As shown by Sun et al. [13], the upper-level cold anomalous circulation is closely connected with local, short-duration rainfall events concentrated from late afternoon to early nighttime over central North China, whereas the warm upper-level anomalous circulation is associated with large-scale, long-duration rainfall events with nocturnal diurnal peaks. Moreover, Hu et al. [14] focused on rainfall over the eastern Tibetan Plateau and pointed out that the rainfall system presents southward movements under an upper-level warm anomaly, whereas eastward-moving low-pressure systems were found under a cold anomaly. The upper tropospheric temperature causes a significant impact on extreme rainfall. As revealed by Yuan and Yu [3], the midnight strong rainfall over the central YGP is influenced by the three-dimensional circulations characterized by an upper-level warm anomaly covering most of eastern China. Rainfall patterns over the central YGP under different upper-level temperature anomalies may also show different features, and they have not been fully studied. The results can further improve our understanding of how large-scale circulations, especially upper-level circulations, influence the spatiotemporal variations in extreme rainfall over the central YGP.
The remainder of this paper is structured as follows: The data and methods are introduced in Section 2. The selection of cold and warm extreme events is presented in Section 3. Characteristics of the cold and warm circulation structures are analyzed in Section 4, and differences between rainfall corresponding to the cold and warm anomalies are investigated in Section 5. The conclusions and further discussions are given in Section 6 and Section 7.
2. Data and Methods
The hourly temperature, winds, geopotential height, and specific humidity at 100–1000 hPa in ERA5 reanalysis data (0.25° × 0.25°), provided by the European Centre for Medium-Range Weather Forecasts [15], were used. The time span was the warm seasons (March–October) from 1980 to 2020. The variables of the air circulation in ERA5 have been widely used in studies of East Asia [5,16]. Following Yuan and Yu [3], a composite analysis of the anomalous circulation was performed by removing the multiyear mean of the 11-day average (−5 to +5 days) around the extreme rainfall days to avoid intraseasonal and diurnal variabilities.
The quality-controlled hourly rain gauge records provided by the National Meteorological Information Center of the China Meteorology Administration were used during warm seasons (March–October) from 1980 to 2020 [17]. Tropical Rainfall Measuring Mission (TRMM) 3A25 version 7 for the period of 1998 to 2012 [18] and the brightness temperature of blackbody (TBB) data from 2010 to 2016, derived from the FengYun-2E geostationary satellite, were used to clarify the convective property of different types of rainfall.
To study the evolution of rainfall events that affect the focal area over the central YGP, the method of regional rainfall events (RREs) suggested by Yu et al. [19] was applied. The RRE method is well suited to study the spatial–temporal evolution characteristics of rainfall processes in a specific region. For every hour t, the maximum hourly intensity is determined within N stations in a selected key region as follows:
where Pi,t is the measured rainfall at station i for hour t (here, x refers to the maximum). Here, N is for 15 focal stations in central YGP (dots in Figure 1). The time series of Px,t thus represents the precipitation intensity of the key region, and an event is then defined as a period of consequent time series above the threshold (0.1 mm h−1 here) with at most a 1 h intermittency, following Yu et al. [19]. Each event has its starting, peak, and ending times.
Px,t = max(Pi,t) (i = 1,N)
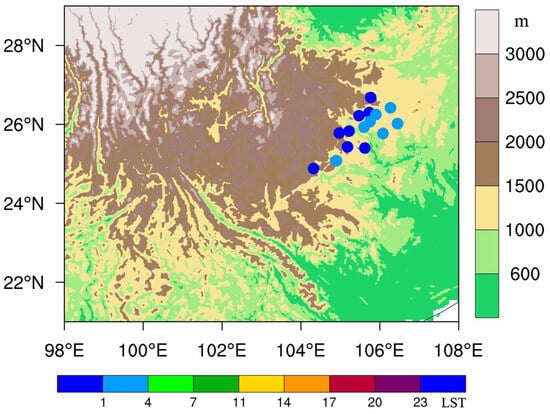
Figure 1.
The topography (shading, the color bar on the right, units: m) and the colored dots represent diurnal peaks of extreme rainfall amount (>26 mm h−1) averaged over 1980–2020 (the color bar at the bottom, in local solar time).
3. Selection of Cold and Warm Extreme Events
Over the central YGP, a group of stations (dots in Figure 1) had more than 1200 mm of accumulated rainfall during the warm season. Meanwhile, the extreme rainfall here presented midnight diurnal peaks, and the peaks for weak rainfall appeared about 4 h later (Figure 2 in Yuan and Yu [3]). There were 462 extreme events with maximum hourly rainfall intensity exceeding the 99th percentile of all rainy hours (26 mm h−1) during 1980–2020 and the extreme rainfall mainly occurred during 2100–0400 LST (dots in Figure 1). The composite analyses of the three-dimensional circulations of the strongest 100 events showed an obvious upper-level temperature anomaly at 300 hPa [3].
To fully analyze the circulation structures corresponding to the extreme events, the Empirical Orthogonal Function [20] (EOF) analysis was applied to the temperature anomaly field at 300 hPa for 2100–0400 LST on the 462 extreme rainfall days. The first mode of the EOF accounted for approximately 56% of the total variance, and the spatial distribution showed a center over North China (Figure 2a). This first mode pattern with a large explanatory variance indicates that the monopolar temperature anomaly at 300 hPa frequently occurs in extreme events over this region. According to the principal component of the first EOF mode (Figure 2b), the events were categorized as cold (warm) ones if their principal component was greater (less) than +σ (−σ), where σ equals the standard deviation of the principal component. In total, 81 cold events and 93 warm ones were selected. Figure 2c,d present the composite temperature anomalies at 300 hPa of cold and warm events, respectively. The warm anomaly was larger and stronger than that of a cold anomaly, and the warm center was located relatively to the east.
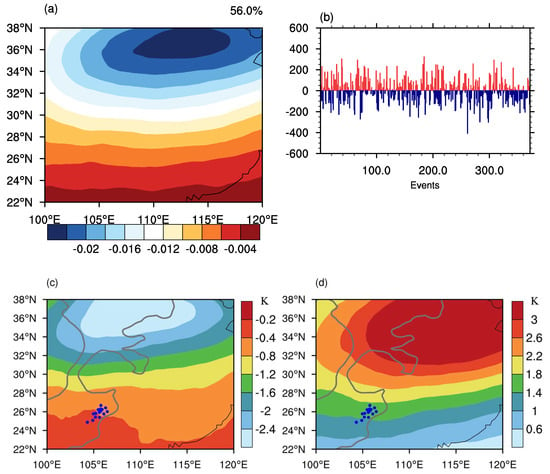
Figure 2.
(a) The 1st EOF mode of the temperature anomaly averaged in 2100–0400 LST during 462 extreme event days over central YGP and (b) the principal component. The composite 300 hPa temperature anomalies (unit: K) of (c) cold and (d) warm events. Blue dots mark the focal stations.
4. Three-Dimensional Circulation Patterns Corresponding to the Cold and Warm Extreme Events
Figure 3 and Figure 4 illustrate the anomalous atmospheric circulations (i.e., removing the climatology) averaged over 2100–0400 LST on 81 cold and 93 warm events. In the upper troposphere (300–500 hPa), there is an anomalous cold center located over 34–38° N over North China, with the cold core at approximately 35° N, 110° E (Figure 3a). The cold anomaly over North China exists from about 200 to 750 hPa and exhibits the minimum at 350 hPa. The cold anomaly reduces the geopotential height (GPH) above it and strengthens the low-level GPH, driven by hydrostatic and geostrophic balances. At 150 hPa, a negative GPH anomaly controls the whole of eastern China (Figure 3a), and the negative GPH anomaly extends to about 600 hPa. The negative GPH anomaly and the corresponding anticyclone strengthen the westerly over the north of central YGP. Meanwhile, the anomalous anticyclone presents a southwest–northeast tilted feature, causing the central YGP to be located over the exit region on the south side of the upper-level jet. Correspondingly, a divergence was observed over the central YGP.
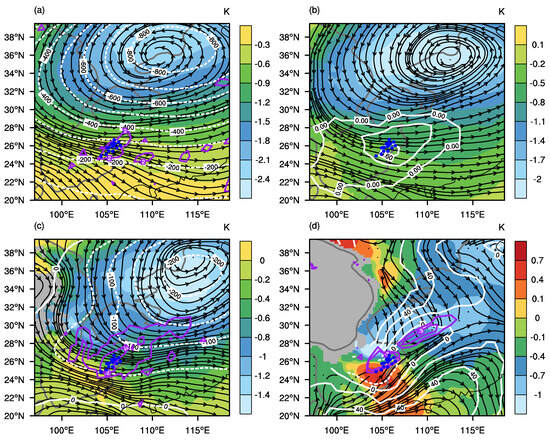
Figure 3.
Anomalous circulations averaged during 2100–0400 LST on cold events. The shading represents the anomalous temperature (unit: K) averaged at (a) 200–400 hPa, (b) 400–600 hPa, (c) 600–700 hPa, and (d) 700–800 hPa. White contours represent the geopotential height (units: gpm) at (a) 150 hPa (interval 100), (c) 500 hPa (interval 50), (d) 800 hPa (interval 20), and (b) specific humidity (interval 0.2, unit: g kg−1) averaged at 200–900 hPa. The streamlines are the anomalous wind fields at (a) 350 hPa, (b) 500 hPa (c) 700 hPa, and (d) 800 hPa. The purple contours are the divergence (interval 1, unit: 10−6 s−1) at (a) 150 hPa, (c) are the vertical velocity at 500 hPa (interval 1, unit: 10−1 Pa s−1) and (d) averaged over 700–800 hPa. Blue dots represent the focal stations.
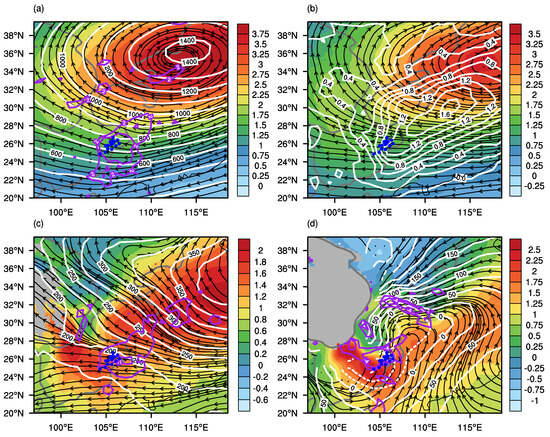
Figure 4.
Same as the caption in Figure 3a–d, but for warm events.
In the lower levels, the cold anomalous center moves southwards, lying around 30° N (Figure 3d). Below 600 hPa, there is a weak warm center to the south of the central YGP, and it becomes comparable to the cold anomaly below 700 hPa. The central YGP is rounded with a zero-degree isotherm and a large temperature gradient. A large area of convergence and a frontal system are found over the central YGP, owing to the anomalous northerly and southwesterly winds convergence over the focused region (Figure 3d). The convergence and southeasterly winds at lower levels result in high water vapor concentrations in the middle–lower troposphere (Figure 3b). When combined with the upper-level divergence (Figure 3a), a strong updraft is found in the middle levels (Figure 3c). Together with the abundant water vapor in the lower troposphere, extreme rainfall occurs over the central YGP.
For the warm events (Figure 4a), although the upper-level temperature anomaly is different, divergence is found over the central YGP. In the lower troposphere (Figure 4d), the contrast of warm and cold anomalies and the convergence of anomalous northerly and southerly winds are also found, resembling those in cold events (Figure 3d). The major difference in the low-level environments between cold and warm events is that water vapor is much stronger in warm events (Figure 4b). Meanwhile, the vertical distributions of the temperature anomalies are different in the two kinds of events. The low-level warm anomaly is stronger in warm events, but the upper-level temperature is also warmer. As a result, the temperature divergence between the upper- and lower-level temperatures is larger in cold events.
To analyze the evolution of the circulation structures influencing extreme rainfall under upper cold and warm anomalies, the circulations before and after rainfall occurrence were investigated. Figure 5 and Figure 6 illustrate the spatial distributions of atmospheric circulations at upper and lower levels during −1 to 1 day after the occurrence of cold events. One day before the occurrence of the cold events, the cold anomaly over the northeast of the central YGP strengthens, and the negative GPH anomalous deepens gradually (Figure 5a–c). In the downstream of the central YGP, the northerly component of flow increases, and the original flat flow field becomes curved (Figure 5c). Over the exit region on the south side of the upper-level jet, divergence appears over the upper level of the central YGP (Figure 5c). Along with the upper-level divergence, the upward vertical motions were significantly enhanced in the middle levels.
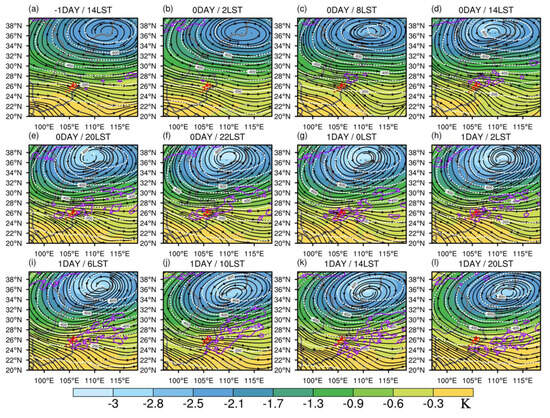
Figure 5.
Temperature anomalies averaged over 300–400 hPa (shaded, unit: K), anomalous divergence (purple contours, unit: 10−6 s−1, starting from 1, interval 1), anomalous geopotential height (white contours, unit: gpm, starting from −800, interval 100), and winds (streamlines) averaged over 150–200 hPa. The gray contour indicates the elevations of 1000, 1500, and 3000 m. Red dots mark the focal stations. The number on the top center of each panel represents the time, the number before (after) the slash is the day (hour in LST) relative to the cold events, and a negative (positive) value indicates the day before (after) the cold events.
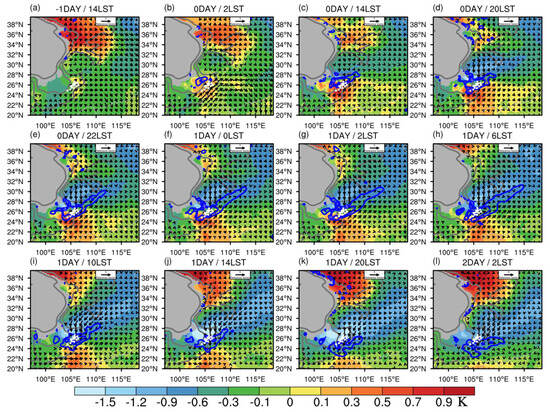
Figure 6.
Same as the caption in Figure 5 but for temperature anomalies (shaded, unit: K), winds (black vectors, unit: m s−1), and divergence (blue contours, unit: 10−6 s−1, starting from −2, interval 1) averaged over 750–875 hPa. White dots represent the focal stations.
Blocked by topography, a warm anomaly dominates over the north of the Sichuan Basin in the lower level (Figure 6a), and the anomalous temperature over the basin and the central YGP is weak. Together with the cooling in the upper level, the temperature to the north of central YGP in low levels also decreases (Figure 6b–d). The weak indeterminate wind anomaly in the Sichuan Basin (Figure 6a,b) turns to a strong uniform anomalous northerly wind (Figure 6d,e). Meanwhile, with the strengthening of southerly wind over the central YGP (Figure 6b), a warm anomaly controls the central YGP. Cold anomalies are located to the north of the warm anomaly in the lower levels, resembling the typical thermodynamic structure of a frontal system. The anomalous southerly and northerly intrusions converge over the central YGP, and an anomalous convergence is observed around 24–28° N (Figure 6d,e). A narrow, high-moisture area oriented from northeast to southwest is formed above a low-level convergence zone (Figure 6e–h). Given the convergence in the lower levels and divergence in the upper levels, the updraft reaches its maximum intensity when the cold extreme event occurs (figure omitted). During the rainfall, the upper- and middle-level cold anomaly slightly deepens, and the minimum in the low-level cold anomaly is reached within one day after the occurrence of cold events. With the strengthening of the cold center, the warm anomaly, and the southerly wind retreat, and the convergence zone moves to the south of the central YGP.
As for the upper-level circulations in warm events (Figure 7), the absolute value of temperature anomaly centers is larger than that in cold ones. The warm centers move eastward slightly and weaken after the occurrences of extreme rainfall. The upper-level wind anomaly blows in the opposite direction when compared to that in cold events, but similar divergences are found over the central YGP. In the lower level (Figure 8), the warm anomaly occupies most of southwestern China one day before the warm extreme rainfall. Different from the cold anomaly from eastern China in cold events, the cold air intrudes the Sichuan Basin, followed by the central YGP from the west and along the edges of the Tibetan Plateau. Accordingly, the strong moisture center first forms to the north of the basin and then shifts southward to the central YGP as the cold air pushes southward. Compared to the cold events, the low-level moisture center is stronger, and the extent of the high-moisture region is also larger (Figure 8). During the extreme rainfall day, a similar contrast of the warm and cold anomalies, as well as southerly and northerly winds, forms over the central YGP, resulting in a large area of updraft motions.
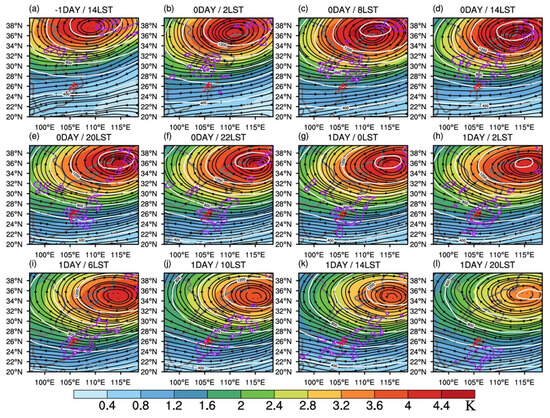
Figure 7.
Same as the caption in Figure 5 but for warm events.
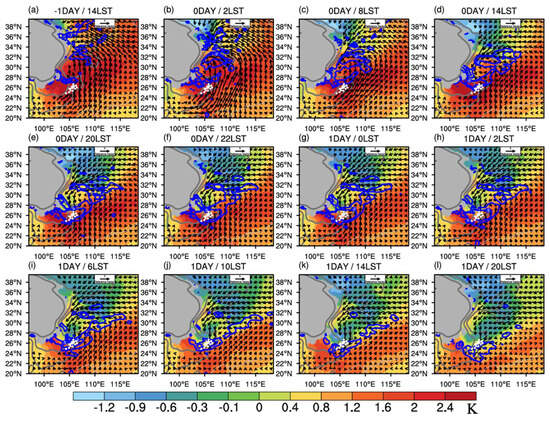
Figure 8.
Same as the caption in Figure 6 but for warm events.
5. Differences between Rainfall Corresponding to the Cold and Warm Anomalies
Based on the results, the upper-level temperature of the selected cold events greatly differs from that under the warm ones. The corresponding rainfall features are compared in this section. As shown in Figure 9a, about 74% of warm events occur in May and June, and the cold events are more evenly distributed in each month. The most occurrences of cold events are in July, accounting for 20.65% of total events, while the counterpart in warm events is 39.13% (in May). The diurnal peaks of warm events are also more concentrated, and 20.4% of events reach their hourly maximum at 0000 LST (Figure 9b).

Figure 9.
(a) The occurrences of warm (red lines) and cold (blue lines) events in different months and (b) the diurnal peaks in different hours.
The most apparent differences in the circulation structures between the cold and warm events are the upper-level temperature anomalies. The low-level temperature anomalies show a frontal temperature contrast in both warm and cold events. The upper cold anomaly and lower warm anomaly over the central YGP during the cold events indicate a more unstable environment. The mean TBB derived from the Fengyun satellite further verified this finding (Figure 10). During the two types of events, the central YGP is covered by a low TBB zone, and the minimum value of cold events is lower (233.11 K vs. 238.68 K). Over the focal region, the mean TBB in cold events is 241.15 K, and the mean value in warm ones is 246.40 K. As shown in Figure 11a, although the mean maximum intensities of both types of events are similar (28.20 mm h−1 for cold events and 25.75 mm h−1 for warm ones), the maximum intensity of all cold events (113.36 mm h−1) is much stronger than that in warm ones (73.21 mm h−1). Additionally, the maximum duration of cold events is also much longer (72 h vs. 31 h, Figure 11b). Meanwhile, the 25th percentile maximum intensity of warm events is stronger than that of cold ones. The TRMM 3A25 also reveals that the ratio of convective rainfall in cold events (36.01%) is larger than that in warm ones (23.38%).
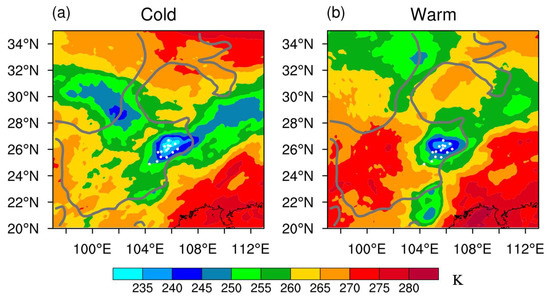
Figure 10.
The mean TBB (units: K) derived from Fengyun satellite measurements for (a) cold and (b) warm events.
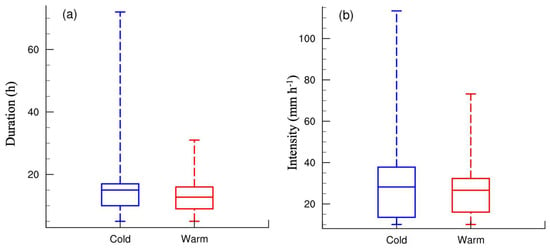
Figure 11.
The maximum, 75%, mean, 25%, and minimum values of (a) durations (units: hours) and (b) maximum hourly rainfall intensity (units: mm h−1) of cold (blue) and warm (red) events.
6. Conclusions
Using ERA5 reanalysis, the circulation structures and the evolution of extreme regional rainfall events against cold and warm upper-level anomalies were investigated. The corresponding rainfall characteristics and cloud physical features between the cold and warm events were compared by using hourly rain gauge records and satellite datasets. The main conclusions are summarized below.
Based on the temperature anomaly at 300 hPa for 2100–0400 LST on extreme rainfall days, 81 extreme cold and 93 warm events were selected among 462 extreme events during the warm seasons in 1980–2020. In cold events, the middle-to-upper troposphere is dominated by a cold anomaly and a negative geopotential height correspondingly. The cyclonic circulation at the higher level associated with the negative geopotential height anomaly bends the high-level jet to the south, forming a divergent zone over the central YGP. In the lower levels, the cold anomaly plugs into the Sichuan Basin and the northern YGP, forming a temperature gradient over the central YGP. The convergence of anomalous southerly and northerly winds, accompanied by temperature contrasts, contributes to the cold extreme events. In warm extremes, the temperature and geopotential height anomaly are opposite, but the divergent zone over the central YGP is similar. In the lower troposphere, the wind and temperature anomaly resemble those in cold events. The maximum rainfall intensity and duration in cold events are much larger than that of warm ones, although the mean values of the two types of events are similar. In cold events, the TBB is lower, and the ratio of convective rainfall is higher. Rainfall under a cold upper-level anomaly presents more convective features when compared with that under a warm upper-level anomaly.
7. Discussions
Hu et al. [14] pointed out that rainfall around the eastern edges of the Tibetan Plateau propagates along a west–east direction under a cold upper-level anomaly, while it moves along a north–south direction under a warm anomaly. The eastward movement of rainfall systems under the cold anomaly is highly related to the activity of Plateau vortices. Over the central YGP, the influences of Plateau vortexes on cold events are not obvious (figure omitted). However, the cloud features during cold and warm events differ. As shown in Figure 10 and Figure 11, rainfall presents stronger convective features under a cold anomaly, and similar results have been found for North China [21]. During cold events, the warm anomaly is restricted to lower levels with a cold anomaly above (Figure 12). This upper-cold–lower-warm environmental configuration could benefit the formation of instability stratification. For the focal stations over central YGP, the mean convective available potential energy in the cold anomalous circulation is 104.7 kJ/kg, which is higher than the value of 94.4 kJ/kg in the warm anomalous circulation, indicating a stronger local convective energy and local instability under the cold anomalous circulation. Different from the cold heavy rainfall in North China [21], the durations of cold events are comparable to that of warm ones. The long duration of cold events over the central YGP is possibly due to the much higher relative humidity over the YGP when compared with North China. These results further provide evidence of the importance of upper-level circulations in the evolutions and properties of rainfall.
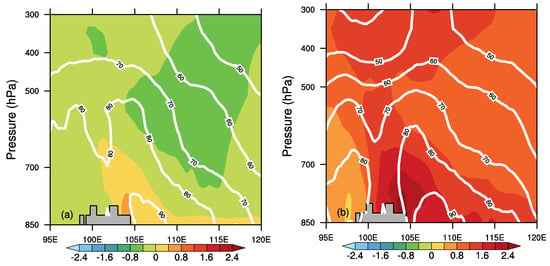
Figure 12.
Temperature anomaly (shaded, unit: K) and relative humidity (contours, unit: %) at 2100–0400 LST on (a) cold and (b) warm events averaged over 24–26° N.
Author Contributions
All authors contributed to the study’s conception and design. Material preparation, data collection, and analysis were performed by Z.L. Correction of the analysis, supervision, and comments were provided by W.Y. The first draft of the manuscript was written by W.Y., and all authors commented on previous versions of the manuscript. All authors have read and agreed to the published version of the manuscript.
Funding
This work was jointly supported by the National Natural Science Foundation of China (Grant Nos. U2142204 and 42375011).
Institutional Review Board Statement
Not applicable.
Informed Consent Statement
Not applicable.
Data Availability Statement
The data supporting the findings of this study were collected and compiled by the National Meteorological Information Center of the China Meteorological Administration. The ERA5 reanalysis data were provided by the European Centre for Medium-Range Weather Forecasts. The TRMM data were provided by NASA. Fengyun satellite was provided by the National Satellite Meteorological Center of China.
Conflicts of Interest
The authors declare no conflicts of interest.
References
- Kara, Y.; Yavuz, V.; Temiz, C.; Lupo, A.R. Exploring Spatio-Temporal Precipitation Variations in Istanbul: Trends and Patterns from Five Stations across Two Continents. Atmosphere 2024, 15, 539. [Google Scholar] [CrossRef]
- Akkoyunlu, B.O.; Baltaci, H.; Tayanc, M. Atmospheric conditions of extreme precipitation events in western Turkey for the period 2006–2015. Nat. Hazards Earth Syst. Sci. 2019, 19, 107–119. [Google Scholar] [CrossRef]
- Yuan, W.; Yu, R. Spatiotemporal features of nocturnal heavy rainfall over the central Yungui Plateau and its leading three-dimensional circulations patterns. Clim. Dyn. 2023, 61, 2471–2484. [Google Scholar] [CrossRef]
- Zhou, X.; Yang, K.; Ouyang, L.; Wang, Y.; Jiang, Y.; Li, X.; Chen, D.; Prein, A. Added value of kilometer-scale modeling over the third pole region: A CORDEX-CPTP pilot study. Clim. Dyn. 2021, 57, 1673–1687. [Google Scholar] [CrossRef]
- Chen, Q.; Ge, F.; Jin, Z.; Lin, Z. How well do the CMIP6 HighResMIP models simulate precipitation over the Tibetan Plateau? Atmos. Res. 2022, 279, 106393. [Google Scholar] [CrossRef]
- Dai, A. Global Precipitation and Thunderstorm Frequencies. Part I: Seasonal and Interannual Variations. J. Clim. 2001, 14, 1092–1111. [Google Scholar] [CrossRef]
- Yu, R.; Xu, Y.; Zhou, T.; Li, J. Relation between rainfall duration and diurnal variation in the warm season precipitation over central eastern China. Geophys. Res. Lett. 2007, 34, L13703. [Google Scholar] [CrossRef]
- Yu, R.; Yuan, W.; Li, J.; Fu, Y. Diurnal phase of late-night against late-afternoon of stratiform and convective precipitation in summer southern contiguous China. Clim. Dyn. 2010, 35, 567–576. [Google Scholar] [CrossRef]
- Yuan, W.; Yu, R.; Zhang, M.; Lin, W.; Li, J.; Fu, Y. Diurnal Cycle of Summer Precipitation over Subtropical East Asia in CAM5. J. Clim. 2013, 26, 3159–3172. [Google Scholar] [CrossRef]
- Yuan, W.; Yu, R.; Chen, H.; Li, J.; Zhang, M. Subseasonal Characteristics of Diurnal Variation in Summer Monsoon Rainfall over Central Eastern China. J. Clim. 2010, 23, 6684–6695. [Google Scholar] [CrossRef]
- Chen, H.; Yu, R.; Li, J.; Yuan, W.; Zhou, T. Why Nocturnal Long-Duration Rainfall Presents an Eastward-Delayed Diurnal Phase of Rainfall down the Yangtze River Valley. J. Clim. 2010, 23, 905–917. [Google Scholar] [CrossRef]
- Yu, R.; Li, J.; Yuan, W.; Chen, H. Changes in Characteristics of Late-Summer Precipitation over Eastern China in the Past 40 Years Revealed by Hourly Precipitation Data. J. Clim. 2010, 23, 3390–3396. [Google Scholar] [CrossRef]
- Sun, W.; Yu, R.; Li, J.; Yuan, W. Three-Dimensional Circulation Structure of Summer Heavy Rainfall in Central North China. Weather Forecast. 2015, 30, 238–250. [Google Scholar] [CrossRef]
- Hu, X.; Yuan, W.; Yu, R. Evolution of warm season intense rainfall in Yaan against a cold-anomaly background. Clim. Dyn. 2022, 59, 2169–2180. [Google Scholar] [CrossRef]
- Hersbach, H.; Bell, B.; Berrisford, P.; Horányi, A.; Sabater, J.M.; Nicolas, J.; Radu, R.; Schepers, D.; Simmons, A.; Soci, C.; et al. Global reanalysis: Goodbye ERA-Interim, hello ERA5. ECMWF Newsl. 2019, 159, 17–24. [Google Scholar]
- Hu, X.; Yuan, W. Evaluation of ERA5 precipitation over the eastern periphery of the Tibetan plateau from the perspective of regional rainfall events. Int. J. Climatol. 2021, 41, 2625–2637. [Google Scholar] [CrossRef]
- Zhang, Q.; Zhao, Y.; Fan, S. Development of hourly precipitation datasets for national meteorological stations in China. Torrential Rain Disasters 2016, 35, 182–186. (In Chinese) [Google Scholar]
- Huffman, G.J.; Adler, R.F.; Bolvin, D.T.; Gu, G.; Nelkin, E.J.; Bowman, K.P.; Hong, Y.; Stocker, E.F.; Wolff, D.B. The TRMM Multisatellite Precipitation Analysis (TMPA): Quasi-Global, Multiyear, Combined-Sensor Precipitation Estimates at Fine Scales. J. Hydrometeorol. 2007, 8, 38–55. [Google Scholar] [CrossRef]
- Yu, R.; Chen, H.; Sun, W. Definition and Characteristics of Regional Rainfall Events Demonstrated by Warm Season Precipitation over the Beijing Plain. J. Hydrometeorol. 2015, 16, 396–406. [Google Scholar] [CrossRef]
- Zhang, Z.; Moore, J.C. Chapter 6—Empirical Orthogonal Functions. In Mathematical and Physical Fundamentals of Climate Change; Zhang, Z., Moore, J.C., Eds.; Elsevier: Boston, MA, USA, 2015; pp. 161–197. [Google Scholar]
- Sun, W.; Li, J.; Yu, R.; Yuan, W. Two Major Circulation Structures Leading to Heavy Summer Rainfall over Central North China. J. Geophys. Res. Atmos. 2015, 120, 4466–4482. [Google Scholar] [CrossRef]
Disclaimer/Publisher’s Note: The statements, opinions and data contained in all publications are solely those of the individual author(s) and contributor(s) and not of MDPI and/or the editor(s). MDPI and/or the editor(s) disclaim responsibility for any injury to people or property resulting from any ideas, methods, instructions or products referred to in the content. |
© 2024 by the authors. Licensee MDPI, Basel, Switzerland. This article is an open access article distributed under the terms and conditions of the Creative Commons Attribution (CC BY) license (https://creativecommons.org/licenses/by/4.0/).