Abstract
Oxygenated volatile organic compound (OVOC) emissions play a critical role in tropospheric ozone (O3) formation. This paper aims to establish an emission inventory and source profile database for OVOCs in Beijing, utilizing revised and reconstructed data from field measurements and existing literature. The study also assesses their potential impact on the O3 base on the ozone formation potential (OFP). Results indicate that OVOC emissions in Beijing predominantly originate from natural and residential sources, encompassing commercial solvent usage, cooking, residential combustion, construction adhesives, and construction coatings. OVOCs contributed 5.6% to OFP, which is significantly less than their emission contribution of 20.1%. Major OFP contributors include plant sources (26.2%), commercial solvent use (21.0%), cooking (20.5%), and construction adhesives (8.4%). The primary OVOC species contributing to OFP for OVOCs are acetaldehyde, methanol, hexanal, ethanol, and acetone, collectively contributing 59.0% of the total OFP. Natural sources exhibit significant seasonal variability, particularly in summer when plant emissions peak, constituting 78.9% of annual emissions and significantly impacting summer ozone pollution (OFP of 13,954 t). Conversely, emissions from other OVOC sources remain relatively stable year-round. Thus, strategies to mitigate summer ozone pollution in Beijing should prioritize plant sources while comprehensively addressing residential sources in other seasons. District-specific annual OVOC emissions are from Fangshan (3967 t), Changping (3958 t), Daxing (3853 t), and Chaoyang (3616 t), which reflect year-round forested areas in these regions and high populations.
1. Introduction
Since 1998, Beijing has implemented multiple stages of robust, comprehensive measures for controlling atmospheric pollution, resulting in annual decreases in pollutant emissions and significant improvements in air quality. Despite these achievements, reductions in tropospheric ozone (O3) concentrations have been slower compared to other pollutants [1,2,3,4]. For instance, in 2022, the 24-h average 95th percentile concentrations of PM2.5, SO2, NO2, PM10, and CO decreased by 66.5%, 88.7%, 58.9%, 50.0%, and 70.6%, respectively, compared to 2013. In contrast, the maximum 8-h daily average 90th percentile concentration of O3 decreased by only 6.8%, highlighting the challenge in reducing O3 levels [5]. O3 is a potent air pollutant with detrimental effects on human health and vegetation. High concentrations of O3 can damage plant tissues, reduce photosynthesis, and alter the antioxidant content of plants [6,7]. Consequently, O3 has become a primary target for pollution control efforts, given its dependency on precursor concentrations, particularly volatile organic compounds (VOCs) and nitrogen oxides (NOx) [8,9].
Studies indicate that O3 formation in Beijing is VOC-limited [8], underscoring the role of VOC emissions in O3 mitigation. Among VOCs, OVOCs—comprising aldehydes, ketones, and alcohols—are particularly reactive. They undergo oxidation by OH radicals to form secondary pollutants like O3, thereby significantly influencing the oxidative capacity of the tropospheric atmosphere [10]. Additionally, certain OVOCs, such as formaldehyde, contribute to atmospheric oxidation through photolysis, generating OH radicals and promoting O3 formation [8,11]. Moreover, in the presence of NOx, oxidation of OVOCs like acetaldehyde and acetone can produce peroxyacetyl nitrate and ozone, while compounds like formic acid and acetic acid contribute to atmospheric acidity [12,13,14]. Thus, OVOC emissions play a critical role in O3 formation, necessitating a thorough investigation of their sources to mitigate ozone pollution effectively.
In line with Beijing’s advancements in environmental management, efforts are underway to promote the use of low-VOC materials. The “Three-Year Action Plan for Winning the Blue Sky Defense Battle in Beijing” advocates for industries including petrochemicals, automobile manufacturing, printing, furniture, machinery, and electronics to adopt the use of low-VOC raw materials. Research indicates that coatings with lower VOC content, such as water-based, solvent-based UV, water-based UV, and powder coatings, substantially reduce OVOC emissions compared to traditional solvent-based coatings. Notably, OVOCs constitute a significant proportion of emissions from water-based and powder coatings, with OVOCs in solvent-based UV coatings being approximately 40% higher than in solvent-based coatings [15]. Moreover, existing VOC composition lists often underestimate OVOC emissions [10,16,17,18,19,20]. Therefore, establishing an accurate OVOC emission inventory is crucial for assessing their environmental impact and formulating effective measures [21].
This study aims to develop a comprehensive inventory of OVOC species in Beijing, investigate their role in ozone formation, and identify highly reactive OVOC species and emission sources.
2. Materials and Methods
2.1. Developments of OVOC Source Profiles
2.1.1. Sampling and Analysis
In the present study, we selected 13 types of emission sources to collect samples for updating the VOC profile. These sources included five industrial processes, three stationary combustion sources, one residential source (vehicle maintenance), and four mobile sources. The main industrial processes comprised the petrochemical industry, printing, vehicle manufacturing, furniture manufacturing, and electronic equipment manufacturing. The stationary combustion sources were industrial combustion boilers using natural gas and coal, as well as natural gas-fired power plants. The mobile sources included petrol and diesel vehicles, gas stations, and storage transport sources. Samples were collected in either 0.5 L glass or high-sealability plastic containers, with at least three sampling procedures conducted per operational process.
VOCs were collected in 0.5 L glass containers (Huaboglass Co., Guangzhou, Guangdong, China), plastic bags (Tedlar, Wilmington, DE, USA), or soma cans (Tianjing Inspection Technology Co., Hangzhou, China), adhering to technical specifications for emission monitoring of stationary sources (HJ/T 397-2007) [22] and sampling method (HJ 732-2014) [23]. Each sampling event lasted approximately 20 min during operational processes. Subsequently, samples were promptly transferred to 3.2 L Summa containers to minimize VOC losses during transport.
Analysis of specific VOC components utilized a three-stage cold trap preconcentration method coupled with a two-dimensional GC–MS/FID system. Initially, VOCs underwent pretreatment using an automatic pre-concentrator (Entech 7100, Entech instruments inc., Simi Valley, CA, USA) to remove water and CO2. The VOCs were then trapped in a third-stage cold trap. The system was subsequently rapidly heated to vaporize VOC components enriched in the cold trap, which were carried to the GC–MS/FID system (Agilent 7890A/5975C, Agilent, Santa Clara, CA, USA) for analysis. High-purity helium (>99.999%) served as the carrier gas. Standard gases used included TO-15 (Scott Gases, Philadelphia, PA, USA), PAMS (Spectra Gases, Linde, NJ, USA), and an internal standard gas comprising bromochloromethane, 1,4-difluorobenzene, D5-chlorobenzene, and 1-bromo-4-fluorobenzene (Spectra Gases, Linde, NJ, USA). Additional details on VOC analysis methods can be found elsewhere [24,25].
2.1.2. Selection of OVOC Species
A comprehensive, unified list of 317 organic volatile organic compounds (OVOCs) was established based on literature research and field test results. This effort addresses the variability in OVOC species reported across different studies for the same emission sources, as detailed in the Supporting Information. The species included in this list were selected for their measurability, abundance, or high reactivity. They were categorized into seven groups: alkanes (55 species), alkenes (38 species), alkynes (2 species), aromatics (57 species), halocarbons (37 species), oxygenated organic compounds (126 species), and other organics (2 species).
A three-level source category system (Table S1) was established based on pollution sources that encompass all processes emitting VOCs in Beijing. The source classification was conducted following the Technical Guidelines for Developing Volatile Organic Compound Emission Inventories in China [26]. The Level-I source categories include six major VOC emission sources in Beijing: industrial processes, stationary combustion, residential sources, waste disposal, mobile sources, and natural sources. Each of these categories was further divided into Level-II source sectors and Level-III sub-sectors, depending on the availability of VOC source profiles for the emission inventory classification. For example, stationary combustion sources were classified into Level-II sectors based on their energy use and further divided into Level-III sub-sectors based on the type of energy used.
The process of selecting pollution source composition profiles was conducted in three main steps. Firstly, priority was given to pollution sources based on localized tests, including data from 13 sources measured in the present study and 7 sources from the literature, with a focus on studies providing comprehensive OVOC emissions data. Secondly, for pollution sources where local data were insufficient or incomplete, data from 52 international sources were used to supplement the dataset, ensuring a broader and more complete representation of OVOC species. Finally, in cases where test data were unavailable, unclear, or unspecified, data from 7 sources were obtained from the SPECIATE database version 5.5, which provides detailed emission profiles, including OVOC species, from a variety of sources.
2.2. VOC Emission Inventory
The VOC emission inventory for Beijing in 2022 was developed based on refined levels of anthropogenic activities, pollution control efficiencies (removal rates), and localized emission factors. The inventory covered various sectors, including industrial processes, stationary combustion, residential sources, waste disposal, mobile sources, and natural sources.
For industrial point sources, emissions were calculated using material balance algorithms, assuming that all uncontrolled and unrecovered VOCs from organic raw materials during use are emitted into the atmosphere. The emission calculation formula is as follows:
where i represents emission sources; j represents specific processes within each source sector, k represents organic raw material; means VOC emissions corresponding to process j within sector i; is sum of VOC quantities in organic raw materials corresponding to process j within sector i; : total amount of organic solvents recovered corresponding to process j within sector i; : VOC removal amount by control facilities corresponding to process j within sector i; : amount of organic raw material k used corresponding to process j within sector i; : VOC mass fraction in organic raw material k, sourced from material safety data sheets (MSDS) or testing reports; means exhaust gas collection efficiency corresponding to process j within sector i; VOC control efficiency corresponding to process j within sector i.
For sectors other than industrial point sources, VOC emissions were estimated using emission factor methods, considering activity levels A, specific pollution control technology percentages X, emission factors EF for VOCs without pollution control measures (in kg VOCs emitted per activity unit), and proportions C of VOCs emitted for specific manufacturing techniques, with removal efficiencies η of VOC control devices.
where m represents manufacturing technology and n represents pollution control technology.
2.3. OVOC Emission Inventory
Based on the total VOC emission inventory and the composition of pollutant sources, the emission inventory for OVOC species is established using the following Equation (5):
where means emissions of OVOC species t from sector i; : emissions mass fraction of OVOC species t within VOCs. OVOC emissions for a specific source () are calculated as the sum of all OVOC species emissions () from that source, and the total OVOC emissions () are the sum of all types of pollutant source OVOC emissions (), calculated by Equations (6) and (7), respectively.
2.4. Calculation of Ozone Formation Potential (OFP)
Due to varying chemical reactivities among VOC species, their contributions to O3 formation differ significantly. This study employs Maximum Incremental Reactivity (MIR) values to estimate the Ozone Formation Potential (OFP) of individual VOC species:
where is the emission of VOC species j from pollution source i and is the maximum incremental reactivity of VOC species j. The MIR values used in this study are sourced from the California Air Resources Board (CARB) [27] and Carter [28]. The total OFP for a specific pollution source i is the sum of the OFP of all VOC species emitted:
It should be noted that while OFP provides insights into potential O3 formation, its calculation does not fully capture the actual impact of VOC emissions on O3. The interaction between VOCs, NOx concentrations, and meteorological conditions is complex and nonlinear. In Beijing, classified as a “VOCs control area”, VOCs may exhibit positive reinforcing effects on O3 levels due to high NOx emissions. Comprehensive studies combining emission inventories with atmospheric chemical transport models are essential for deeper understanding [9].
2.5. The Spatio-Temporal Distribution
A monthly allocation coefficient was employed to study the temporal distribution of VOC emissions, as shown in Table S3. For the spatial allocation of emissions, a Geographical Information System (GIS) application was developed, which enables optimal processing and presentation of emission results. The developed GIS application contains coverages such as the boundaries of prefectures as well as the boundaries of the urban area of Beijing, the land use categories in the area under consideration (built-up areas, lakes, forests, agricultural land, other land types, etc.), the transportation network; all industrial installations; all gasoline stations (Table 1).

Table 1.
Classification of polluting activities as point, line, and area sources in the developed GIS application.
2.6. Quantification of Uncertainty
To quantify uncertainties in OVOC emissions, Monte Carlo stochastic simulation using Crystal Ball (Oracle Crystal Ball, Version 11.1.2.4.400) was employed. The approach considered various sources of uncertainty within the emission inventory methodology. Emissions derived from material balance algorithms followed a normal distribution with a coefficient of variation (CV) of 20%. Emission factors were assumed to follow a normal distribution based on means and standard deviations derived from field measurements. Sources included data from previous studies, incorporating reported uncertainties. Activity levels were primarily derived from statistical data with a low uncertainty of 10%. OVOC source profiles were modeled using a normal distribution based on means and standard deviations obtained from field measurements. When data were sourced from the literature, the uncertainties reported in the literature were utilized. If uncertainties were not specified, a default uncertainty of 50% was applied. The uncertainty associated with MIR values was assumed to be 30%. MIR values play a crucial role in assessing the ozone formation potential of VOC emissions. Ten thousand Monte Carlo sampling iterations were conducted to simulate uncertainties in the emission inventory.
3. Results and Discussion
3.1. Characteristics of Total VOC Emissions in Beijing
In 2022, total VOC emissions in Beijing amounted to 209,700 t, with natural sources contributing the largest share at 102,400 t (48.85%) in Figure 1. Among natural sources, plant emissions predominated, accounting for 48.83% of total VOC emissions. Residential sources followed with 46,300 t (22.1%), prominently contributed to by commercial solvent use (9.6%), residential solvent use (2.66%), cooking (2.6%), and asphalt paving (2.26%). Mobile sources accounted for 40,000 t (19.06%), with vehicles as the primary contributor at 16.72%.
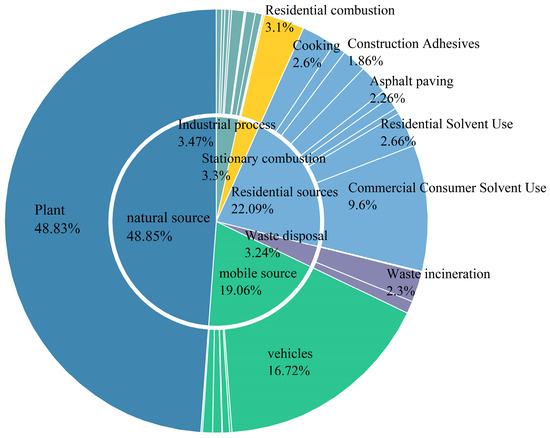
Figure 1.
The emission of VOCs in Beijing.
The annual VOC emissions were compared with TRACE-P [29], INTEX-B [30], MEIC [31,32,33] inventories and inventory derived from ambient measurements [34]. The annual VOC emissions were much lower than in the other studies, which may be due to the following reasons: (1) The emission inventory compiled in this study represents the latest data, incorporating the significant reductions in VOC emissions due to the extensive control measures implemented in Beijing in recent years. (2) This study utilizes a bottom-up methodology, which calculates emissions based on detailed activity data. This approach provides a higher degree of accuracy in estimating emission levels. In terms of species composition, alkenes constituted the highest emissions, at 47.3% of total VOC emissions, followed by OVOCs at 42,201 t (20.1%), as shown in Figure 2. Alkanes and aromatics were comparatively lower at 33,188 t (15.8%) and 29,089 t (13.9%), respectively. The top ten components by emission weight were isoprene, methanol, acetone, monoterpenes, ethene, toluene, ethanol, benzene, i-pentane, and ethane, contributing 34.8%, 5.7%, 5.5%, 5.3%, 3.3%, 3.1%, 2.2%, 1.8%, 1.8%, and 1.6% of total emissions, respectively. Ethene, toluene, benzene, i-pentane, and ethane primarily originated from mobile sources. Furthermore, natural sources, residential sources, and waste disposal were the main sources of ethene, toluene, and ethane, respectively. Ethanol was mainly from residential sources.
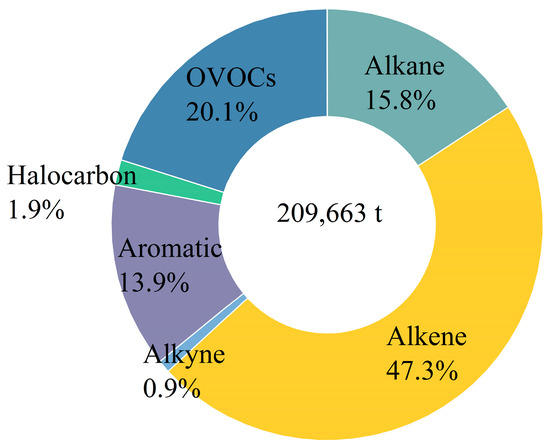
Figure 2.
The emission composition of VOCs in Beijing.
3.2. Composition of OVOC Emissions in Beijing
OVOCs in Beijing predominantly originated from natural and residential sources, with emissions of 14,504 t (34.4%) and 27,696 t (65.6%), respectively. Monte Carlo simulations (10,000 iterations) indicated a 95% confidence interval for emissions of (−34.2%, 35.3%). Plant emissions were solely responsible for natural sources. Residential sources encompassed various sources, with significant OVOC emissions from commercial solvent use (11,912 t), cooking (4701 t), residential combustion (2386 t), construction adhesives (2301 t) and residential solvent use (1155 t), accounting for 28.2%, 11.2%, 5.7%, 5.5%, and 2.7% of emissions, respectively. Additionally, residential combustion and industrial processes were notable contributors to OVOCs.
The substantial differences between the OVOC emission inventory developed in this study and previous historical data can be attributed to several key factors. Firstly, Variation in VOC Emissions from Different Sources: The composition of OVOCs varies significantly across different pollution sources. This variation leads to discrepancies in the overall OVOC profile when comparing different inventories due to the variation in VOC emissions from different sources. Secondly, the OVOC profile used in this study is specifically tailored to the conditions of Beijing. This localized approach provides a more accurate representation of the OVOC emissions in this particular region compared to broader, less region-specific profiles used in earlier studies. As shown in Figure 3, the top ten OVOC species by emission volume were methanol, acetone, ethanol, hexanal, acetaldehyde, isopropanol, tetrahydrofuran, ethyl acetate, butanone, and benzyl alcohol contributing 11,846t, 11,609t, 4680t, 1676t, 1665t, 1350t, 1100t, 658t, 608t and 605t. These species accounted for 28.1%, 27.5%, 11.1%, 4.0%, 3.9%, 3.2%, 2.6%, 1.6%, 1.4% and 1.4% of total OVOC emissions, respectively. Methanol and acetaldehyde primarily originated from natural sources. Methanol was mainly from residential sources. Residential sources are the primary contributors to acetone, ethanol, hexanal, isopropanol, and tetrahydrofuran emissions. Acetone emissions also had contributions from natural sources and stationary combustion. Waste disposal was the primary source of ethyl acetate emissions, followed by residential sources and industrial processes. Butanone and benzyl alcohol are mainly from commercial consumer solvent use and construction adhesives, respectively.
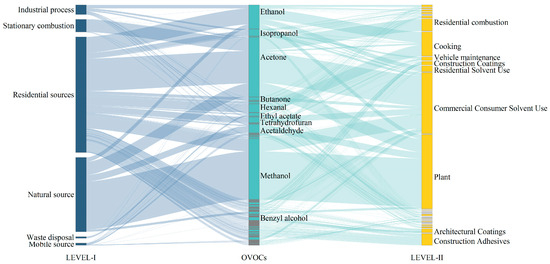
Figure 3.
Sources and species composition of OVOC emissions in Beijing.
3.3. Impact of OVOC Emissions on O3 in Beijing
In 2022, Beijing’s annual VOC emissions resulted in an overall ozone formation potential (OFP) of 1,206,330 t (Figure 4), with anthropogenic sources contributing 337,028 t and natural sources contributing 869,301 t. Despite alkenes accounting for only 47.3% of total emissions, their high chemical reactivity led to a substantial OFP contribution of 79.9%, making them the primary source of OFP. OVOCs contributed 5.6% to the OFP, which is significantly less than their emission contribution of 20.1%; although OVOCs are substantial in emissions, their impact on ozone formation is lower compared to alkenes and aromatics. Monte Carlo simulations (10,000 iterations) indicated a 95% confidence interval for emissions of (−46.2%, 45.4%).
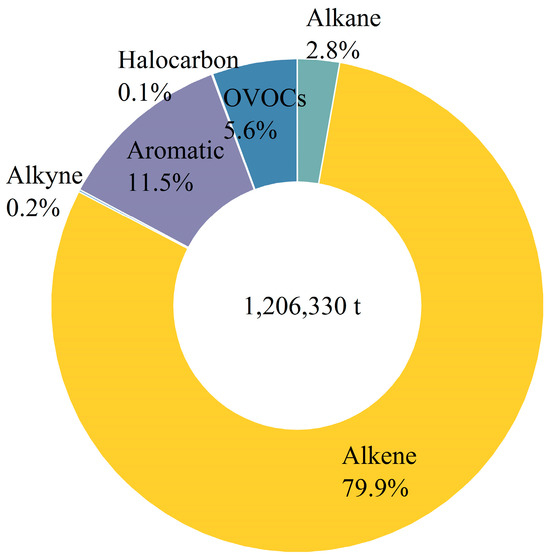
Figure 4.
Contributions of VOCs to the total OFP.
Figure 5 illustrates that major OVOC sources contributing to OFP include plants (26.2%), commercial solvent use (21.0%), cooking (20.5%), and construction adhesives (8.4%). The top five OVOC species contributing to OFP were acetaldehyde, methanol, hexanal, ethanol, and acetone, collectively accounting for 59.0% of the total, with acetaldehyde alone contributing 16.2%. Acetaldehyde and methanol primarily originated from natural sources, with residential sources also significant contributors to acetaldehyde and methanol. Residential sources were the primary sources of ethanol and acetone, followed by natural sources. Commercial consumer solvent use and plant and residential combustion are the important sources of acetone.
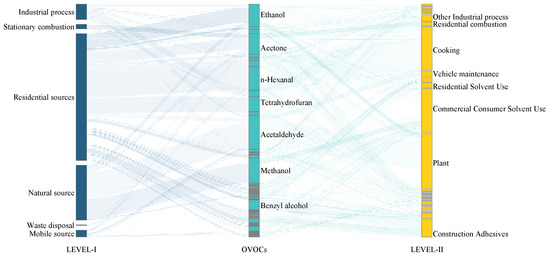
Figure 5.
Contributions of OVOCs and species to the total OFP.
3.4. Temporal Distribution Characteristics of OVOC Emissions in Beijing
As depicted in Figure 6, natural sources exhibited significant seasonal variation. During winter, early spring, and late autumn (January, February, March, November, and December), low temperatures, short daylight hours, and weak solar radiation led to diminished vegetation, activity, and lower natural OVOC emissions compared to other seasons [16]. From April onwards, natural emissions increased sharply, peaking in May and June and surpassing emissions from other sources. Summer (June, July, and August) saw peak natural OVOC emissions due to high temperatures, extended daylight hours, and intense solar radiation, accounting for 78.9% of the annual total and significantly impacting summer ozone pollution in Beijing with an OFP of 13,954 t.
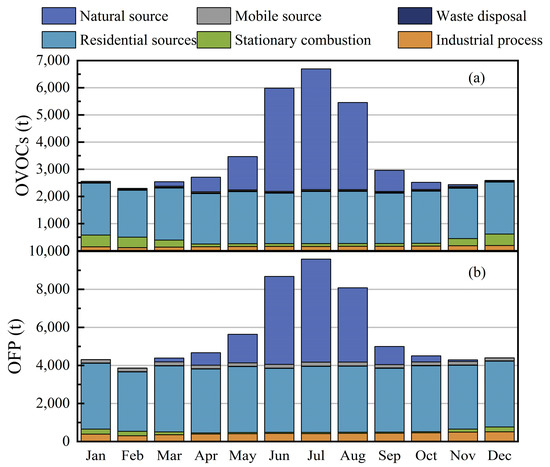
Figure 6.
Temporal variation patterns of OVOCs (a) and their impact on ozone (b) in Beijing.
Other pollution sources exhibited relatively stable OVOC emissions throughout the year. Emissions spiked in December, November, and January, likely due to increased fossil fuel combustion for winter heating. Stationary combustion emissions in winter (746 t) were 2.7 times higher than in spring and autumn and 4.1 times higher than in summer, although their OFP contribution was relatively low at 2.2%. Residential sources contributed significantly to OFP, with seasonal contributions of 44%, 15%, 51%, and 69% to total OVOC emissions in spring, summer, autumn, and winter, respectively. Thus, effective control of ozone pollution from OVOCs in Beijing should focus on addressing plant sources in summer and residential sources in other seasons.
3.5. Spatial Distribution Characteristics of OVOC Emissions in Beijing
Figure 7 shows a 1 km × 1 km grid, highlighting that high OVOC emission areas in Beijing are primarily clustered in densely populated regions such as Haidian, Chaoyang, and Fengtai districts. Due to plants being the main contributors to OVOC emissions, high-emission areas were widespread and correlated closely with forested areas, notably in Huairou, Miyun, Yanqing, and Fangshan districts.
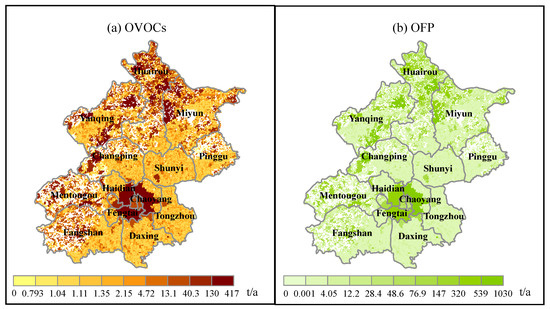
Figure 7.
Spatial variation patterns of OVOCs (a) and their impact on ozone (b) in Beijing.
Statistical analysis revealed that grids with emissions exceeding 130 t per year accounted for 8.9% of total grids, while those emitting between 40.3 and 130 t per year accounted for 7.3%. Grids with emissions ranging from 13.2 to 40.2 t per year comprised 11.3% of total grids, while those emitting between 4.73 and 13.1 t per year accounted for 8.0%. Grids with emissions between 2.15 and 4.72 t per year made up 9.5%, and grids emitting less than 2.15 t per year constituted 54.9% of total grids. Ecological conservation areas exhibited notably high OVOC emissions due to contributions from natural sources.
The annual OVOC emissions by district in descending order were Fangshan (3967 t), Changping (3958 t), Daxing (3853 t), and Chaoyang (3616 t). These districts, characterized by extensive population and forest cover including Pinus tabuliformis, Larix, Platycladus orientalis, Quercus, Betula, Robinia pseudoacacia, and Populus, are significant contributors to OVOC emissions.
4. Conclusions
OVOC emissions play an important role in O3 formation. This study developed a highly resolved temporal and spatial speciated OVOC emission inventory for Beijing based on a comprehensive database of VOC source profiles derived from field measurements and a literature review. The impact of OVOCs on O3 formation potential (OFP) was also assessed.
In 2022, Beijing’s total VOC emissions amounted to 209,700 t, with natural sources contributing the largest share at 102,417 t, accounting for 48.85% of the total. Alkenes were the predominant species emitted (47.3%), followed by OVOCs (20.1%), alkanes (15.8%), and aromatics (13.9%). OVOCs in Beijing primarily originated from natural sources and residential emissions. Residential sources included the use of commercial solvents, cooking, residential combustion, construction adhesives, and construction coatings. The OFP contribution of OVOCs was 5.6%, which is significantly less than their emission contribution of 20.1%. Major contributors to OFP were plants (26.2%), commercial consumer solvent use (21.0%), cooking (20.5%), and construction adhesives (8.4%). The top five OVOC species contributing to OFP were acetaldehyde, methanol, hexanal, ethanol, and acetone, collectively contributing 59.0% to OFP.
Natural sources exhibited significant seasonal variability. In summer, when O3 pollution was most severe, natural sources contributed 78.9% of the annual OVOC emissions and had a substantial impact on summer O3 pollution, with an OFP of 13,954 t, or 78.9% of the total. OVOC emissions from other sources remained relatively stable throughout the year. Therefore, controlling O3 pollution from OVOCs in Beijing should prioritize addressing the impact of natural sources in summer and residential sources comprehensively throughout the year.
District-level analysis revealed that annual OVOC emissions were highest in Fangshan (3967), followed by Changping (3958 t), Daxing (3853 t), and Chaoyang (3616 t). These districts are characterized by extensive population and forested areas, which contribute significantly to OVOC emissions throughout the year.
Supplementary Materials
The following supporting information can be downloaded at: https://www.mdpi.com/article/10.3390/atmos15080970/s1, Table S1: Classification and codes of pollution sources; Table S2: the composite source profiles; Table S3: the coefficiency of temporal variation.
Author Contributions
Conceptualization, X.Y. and L.W.; methodology, X.Y.; validation, X.Q. and L.W.; formal analysis, X.Q.; investigation, Z.Y. and J. L.; data curation, J.L.; writing—original draft preparation, X.Y.; writing—review and editing, X.Y.; visualization, X.Y.; supervision, L.W.; project administration, L.W.; funding acquisition, X.Y. All authors have read and agreed to the published version of the manuscript.
Funding
This work was sponsored by the Beijing Natural Science Foundation (8232031) and the National Natural Science Foundation of China (42207516).
Institutional Review Board Statement
Not applicable.
Informed Consent Statement
Not applicable.
Data Availability Statement
The original contributions presented in the study are included in the article/supplementary materials, further inquiries can be directed to the corresponding author.
Conflicts of Interest
The authors declare no conflict of interest.
References
- Cheng, J.; Su, J.; Cui, T.; Li, X.; Dong, X.; Sun, F.; Yang, Y.; Tong, D.; Zheng, Y.; Li, Y.; et al. Dominant role of emission reduction in PM2.5 air quality improvement in Beijing during 2013–2017: A model-based decomposition analysis. Atmos. Chem. Phys. 2019, 19, 6125–6146. [Google Scholar] [CrossRef]
- Hua, Y.; Wang, S.; Jiang, J.; Zhou, W.; Xu, Q.; Li, X.; Liu, B.; Zhang, D.; Zheng, M. Characteristics and sources of aerosol pollution at a polluted rural site southwest in Beijing, China. Sci. Total Environ. 2018, 626, 519–527. [Google Scholar] [CrossRef] [PubMed]
- Xu, Q.; Wang, S.; Jiang, J.; Bhattarai, N.; Li, X.; Chang, X.; Qiu, X.; Zheng, M.; Hua, Y.; Hao, J. Nitrate dominates the chemical composition of PM2.5 during haze event in Beijing, China. Sci. Total Environ. 2019, 689, 1293–1303. [Google Scholar] [CrossRef]
- Yan, X.; Shi, A.; Cao, J.; Li, T.; Sun, X.; Zhang, R.; Qiu, X.; Li, Y.; Liang, M.; Lv, M.; et al. The Occurrence of Heavy Air Pollution during the COVID-19 Outbreak in Beijing, China: Roles of Emission Reduction, Meteorological Conditions, and Regional Transport. Sustainability 2021, 13, 12312. [Google Scholar] [CrossRef]
- Beijing Municipal Bureau of Ecology and Environment (BMBEE). 2022 Annual Report on the Ecological and Environmental Status of Beijing; BMBEE: Beijing, China, 2023. [Google Scholar]
- Zapletal, M.; Juran, S.; Krpes, V.; Michna, K.; Cudlin, P.; Edwards, M. Effect of ozone flux on selected structural and antioxidant characteristics of a mountain norway spruce forest. Balt. For. 2018, 24, 261–267. [Google Scholar]
- Juráň, S.; Grace, J.; Urban, O. Temporal Changes in Ozone Concentrations and Their Impact on Vegetation. Atmosphere 2021, 12, 82. [Google Scholar] [CrossRef]
- Zhang, Y.; Tao, M.; Zhang, J.; Liu, Y.; Chen, H.; Cai, Z.; Konopka, P. Long-term variations in ozone levels in the troposphere and lower stratosphere over Beijing: Observations and model simulations. Atmos. Chem. Phys. 2020, 20, 13343–13354. [Google Scholar] [CrossRef]
- Zhang, M.; Shao, M.; Chen, P.L.; Gu, C.; Wang, Q.G. Characteristics of VOCs emissions in the Yangtze River Delta region and their potential impacts on atmospheric O3 and SOA. China Environ. Sci. 2023, 43, 2694–2702. (In Chinese) [Google Scholar]
- Huang, X.F.; Zhang, B.; Xia, S.Y.; Han, Y.; Wang, C.; Yu, G.H.; Feng, N. Sources of oxygenated volatile organic compounds (OVOCs) in urban atmospheres in North and South China. Environ. Pollut. 2020, 261, 114152. [Google Scholar] [CrossRef]
- Xue, L.; Gu, R.; Wang, T.; Wang, X.; Saunders, S.; Blake, D.; Louie, P.K.K.; Luk, C.W.Y.; Simpson, I.; Xu, Z.; et al. Oxidative capacity and radical chemistry in the polluted atmosphere of Hong Kong and Pearl River Delta region: Analysis of a severe photochemical smog episode. Atmos. Chem. Phys. 2016, 16, 9891–9903. [Google Scholar] [CrossRef]
- Farrah, S.R.; Goyal, S.M.; Gerba, C.P.; Wallis, C.; Melnick, J.L. Concentration of poliovirus from tap water onto membrane filters with aluminum chloride at ambient pH levels. Appl. Environ. Microbiol. 1978, 35, 624–626. [Google Scholar] [CrossRef]
- Liu, Y.; Kong, L.; Liu, X.; Zhang, Y.; Li, C.; Zhang, Y.; Zhang, C.; Qu, Y.; An, J.; Ma, D.; et al. Characteristics, secondary transformation, and health risk assessment of ambient volatile organic compounds (VOCs) in urban Beijing, China. Atmos. Pollut. Res. 2021, 12, 33–46. [Google Scholar] [CrossRef]
- Millet, D.B.; Baasandorj, M.; Farmer, D.K.; Thornton, J.A.; Baumann, K.; Brophy, P.; Chaliyakunnel, S.; de Gouw, J.A.; Graus, M.; Hu, L.; et al. A large and ubiquitous source of atmospheric formic acid. Atmos. Chem. Phys. 2015, 15, 6283–6304. [Google Scholar] [CrossRef]
- Zeng, C.L.; Shao, X.; Liu, R.Y.; Yao, Y.J.; Li, Y.S.; Hou, M.; Liu, Y.; Fan, L.Y.; Ye, D.Q. Coating-derived VOCs Emission Characteristics and Environmental Impacts from the Furniture Industry in Guangdong Province. Huan Jing Ke Xue 2021, 42, 4641–4649. [Google Scholar] [CrossRef]
- Lun, X.; Lin, Y.; Chai, F.; Fan, C.; Li, H.; Liu, J. Reviews of emission of biogenic volatile organic compounds (BVOCs) in Asia. J. Environ. Sci. 2020, 95, 266–277. [Google Scholar] [CrossRef]
- Mozaffar, A.; Zhang, Y.-L.; Lin, Y.-C.; Xie, F.; Fan, M.-Y.; Cao, F. Measurement report: High contributions of halocarbon and aromatic compounds to atmospheric volatile organic compounds in an industrial area. Atmos. Chem. Phys. 2021, 21, 18087–18099. [Google Scholar] [CrossRef]
- Na, K.; Kim, Y.P.; Moon, K.-C.; Moon, I.; Fung, K. Concentrations of volatile organic compounds in an industrial area of Korea. Atmos. Environ. 2001, 35, 2747–2756. [Google Scholar] [CrossRef]
- Shi, J.; Deng, H.; Bai, Z.; Kong, S.; Wang, X.; Hao, J.; Han, X.; Ning, P. Emission and profile characteristic of volatile organic compounds emitted from coke production, iron smelt, heating station and power plant in Liaoning Province, China. Sci. Total Environ. 2015, 515, 101–108. [Google Scholar] [CrossRef] [PubMed]
- Zheng, J.; Yu, Y.; Mo, Z.; Zhang, Z.; Wang, X.; Yin, S.; Peng, K.; Yang, Y.; Feng, X.; Cai, H. Industrial sector-based volatile organic compound (VOC) source profiles measured in manufacturing facilities in the Pearl River Delta, China. Sci. Total Environ. 2013, 456, 127–136. [Google Scholar] [CrossRef]
- Song, X.; Yuan, B.; Wang, S.H.; He, X.J.; Li, X.B.; Peng, Y.W.; Chen, Y.B.; Qi, J.P.; Cai, J.H.; Huang, S.; et al. Compositional Characteristics of Volatile Organic Compounds in Typical Industrial Areas of the Pearl River Delta: Importance of Oxygenated Volatile Organic Compounds. Huan Jing Ke Xue 2023, 44, 1336–1345. [Google Scholar] [CrossRef] [PubMed]
- HJ/T 397-2007; Technical Specifications for Emission Monitoring of Stationary Source. MEEPRC (Ministry of Ecology and Environmental of the People’s Republic of China): Beijing, China, 2008. (In Chinese)
- HJ 734-2014; Stationary Source Emission-Determination of Volatile Organic Compounds-Sorbent Adsorption and Thermal Desorption Gas Chromatography Mass Spectrometry Method. MEEPRC (Ministry of Ecology and Environmental of the People’s Republic of China): Beijing, China, 2014. (In Chinese)
- Wang, H.; Hao, R.; Fang, L.; Nie, L.; Zhang, Z.; Hao, Z. Study on emissions of volatile organic compounds from a typical coking chemical plant in China. Sci. Total Environ. 2021, 752, 141927. [Google Scholar] [CrossRef] [PubMed]
- Wang, H.; Yang, T.; Nie, L.; Fang, L.; Zhang, Z.; Hao, Z. Volatile organic compounds in the vehicle repairing industry of China: Emission, management, purification, and policy. Environ. Sci. 2021, 42, 5574–5584. [Google Scholar]
- MEE. Technical Guidelines for Developing Volatile Organic Compound Emission Inventories in China. Source: Ministry of Ecology and Environment of the People’s Republic of China. 2014. Available online: http://www.mee.gov.cn/gkml/hbb/bgg/201408/W020140828351293705457.pdf (accessed on 15 January 2024).
- CARB (California Air Resources Board). Tables of Maximum Incremental Reactivity (MIR) Values; CARB: Sacramento, CA, USA, 2010. [Google Scholar]
- Carter, W.P. Reactivity Estimates for Selected Consumer Product Compounds; Final Report to the California Air Resources Board Contract: 06-408; CARB: Sacramento, CA, USA, 2008. [Google Scholar]
- Streets, D.G.; Zhang, Q.; Wang, L.; He, K.; Hao, J.; Wu, Y.; Tang, Y.; Carmichael, G.R. Revisiting China’s CO emissions after the Transport and Chemical Evolution over the Pacific (TRACE-P) mission: Synthesis of inventories, atmospheric modeling, and observations. J. Geophys. Res. Atmos. 2006, 111, D14306. [Google Scholar] [CrossRef]
- Zhang, Q.; Streets, D.G.; Carmichael, G.R.; He, K.B.; Huo, H.; Kannari, A.; Klimont, Z.; Park, I.S.; Reddy, S.; Fu, J.S.; et al. Asian emissions in 2006 for the NASA INTEX-B mission. Atmos. Chem. Phys. 2009, 9, 5131–5153. [Google Scholar] [CrossRef]
- MEICModel—Tracking Athropogenic Emissions in China. Available online: http://meicmodel.org.cn (accessed on 5 July 2024).
- Li, M.; Liu, H.; Geng, G.; Hong, C.; Liu, F.; Song, Y.; Tong, D.; Zheng, B.; Cui, H.; Man, H.; et al. Anthropogenic emission inventories in China: A review. Natl. Sci. Rev. 2017, 4, 834–866. [Google Scholar] [CrossRef]
- Zheng, B.; Tong, D.; Li, M.; Liu, F.; Hong, C.; Geng, G.; Li, H.; Li, X.; Peng, L.; Qi, J.; et al. Trends in China’s anthropogenic emissions since 2010 as the consequence of clean air actions. Atmos. Chem. Phys. 2018, 18, 14095–14111. [Google Scholar] [CrossRef]
- Wang, M.; Shao, M.; Chen, W.; Yuan, B.; Lu, S.; Zhang, Q.; Zeng, L.; Wang, Q. A temporally and spatially resolved validation of emission inventories by measurements of ambient volatile organic compounds in Beijing, China. Atmos. Chem. Phys. 2014, 14, 5871–5891. [Google Scholar] [CrossRef]
Disclaimer/Publisher’s Note: The statements, opinions and data contained in all publications are solely those of the individual author(s) and contributor(s) and not of MDPI and/or the editor(s). MDPI and/or the editor(s) disclaim responsibility for any injury to people or property resulting from any ideas, methods, instructions or products referred to in the content. |
© 2024 by the authors. Licensee MDPI, Basel, Switzerland. This article is an open access article distributed under the terms and conditions of the Creative Commons Attribution (CC BY) license (https://creativecommons.org/licenses/by/4.0/).