Article

Analysis of Ionospheric Anomalies before Earthquakes of Mw6.5 and above in Japan from 2011 to 2022

College of Surveying and Geo-Informatics, North China University of Water Resources and Electric Power, 136 East Jinshui Road, Zhengzhou 450046, China
*
Author to whom correspondence should be addressed.
Atmosphere 2024, 15(8), 887; https://doi.org/10.3390/atmos15080887
Submission received: 20 May 2024 / Revised: 10 July 2024 / Accepted: 20 July 2024 / Published: 25 July 2024
(This article belongs to the Section Planetary Atmospheres)

Abstract

:
In this study, a TEC variation window value was selected based on the wavelet power spectrum method to analyze the seismic–ionospheric coupling relationship. In the full-time domain, a 27-day periodicity of the wavelet power spectrum was obtained that passed the 95% significance test. The sliding interquartile range method was used to analyze earthquakes above Mw6.5 in Japan from 2011 to 2022, excluding the hybrid effects between earthquakes close to one another. The sunspot number (SSN), 10.7 cm radio flux (F10.7), total solar irradiance (TSI), solar wind velocity (Vsw), geomagnetic activity index in the equatorial region (DST), and global geomagnetic activity index (KP) were used as indices representing solar and geomagnetic activity. After removing solar and geomagnetic interference from ionospheric anomaly changes using the sliding interquartile range method, the TEC anomaly changes before the earthquake were verified as being caused by the earthquake and analyzed. The statistical analysis of ionospheric total electron content (TEC) anomalies showed that earthquake magnitude was positively correlated with the amplitude of TEC anomalies but not linearly. The occurrence time of ionospheric anomalies lagged behind to some extent with the increase in earthquake magnitude. Additionally, abnormal changes on the 29th day (15 February 2022) before the 20th earthquake did not conform to previous research rules. According to the lithosphere–atmosphere–ionospheric coupling (LAIC) mechanism and global ionospheric map (GIM) studies, the TEC anomaly was consistent with the vertical projection of the epicenter with obvious regularity. The results show that these TEC anomalies may be related to earthquakes.

1. Introduction

Earthquakes rank among the most devastating natural disasters. Beyond their direct impact, chain reactions, such as tsunamis and volcanic eruptions, pose significant threats to both lives and property. Therefore, forewarning the occurrence of earthquakes has been the focus of many scientists and researchers. As early as the 1960s, Davies and Baker observed the phenomenon of ionospheric effects before and after the Alaska earthquake [1]. Studies have demonstrated a correlation between ionospheric anomalies and earthquakes, and an increasing number of investigations have indicated the presence of abnormal ionospheric disturbances preceding seismic events [2,3,4,5]. Furthermore, most ionospheric disturbance phenomena were observed within the initial 15-day period preceding the earthquake [6,7]. According to Heki K’s research and statistics on resonance atmospheric shock after the earthquake, the ionosphere’s positron density directly above the fault layer is positively correlated with the earthquake’s increasing magnitude, verifying the seismic–ionospheric coupling mechanism [8]. Ulukavak et al. analyzed the TEC of different magnitude groups before the earthquake and detected that the number of positive TEC anomalies before the earthquake was greater than the number of negative anomalies, which has certain significance for short-term earthquake prediction [9]. Saqib et al. proposed a time series analysis technique (ARIMA) for predicting short-term TEC and provided a new method for detecting TEC anomalies before earthquakes [10]. Data show that the seismic process is not only limited to the Earth’s lithosphere, altering and affecting the surface morphology, but also affects the atmosphere, ionosphere, and magnetosphere by interacting with electromagnetic fields, thereby disturbing the ionosphere above and affecting abnormal TEC changes. Seismo-ionosphere physical mechanisms have been studied for a long time by many researchers, who have proposed many theories based on the different objects investigated. Pulinets and Ouzounov proposed the LAIC model [11], which chiefly describes the processes seen in radon-dominated gas escaping from rock layers during the time of earthquakes. Radon gas is released into the atmosphere and rapidly decays at the same time. High-energy particles released during the decay process are accompanied by a series of plasma chemical reactions. Primary ions form positive and negative electrodes that attach to water molecules in the atmosphere and combine with them, releasing heat energy in the process of attachment. This process is called latent heat of condensation. In turn, free water vapor in the atmosphere is removed, humidity is reduced, and the release of latent heat leads to an increase in air temperature, which is the main cause of air ionization. This process excites the formation of ion clusters in the atmospheric boundary layer, which generates local changes in the global circuit and leads to abnormal changes in the ionosphere. Freund et al. proposed a positive hole model during earthquake pregnancy. Their model shows that under stress compression, rocks activate positive hole charge flow, generating currents that cause electrons to flow between the ground and the bottom of the ionosphere, resulting in anomalous changes in the ionosphere [12,13,14]. By analyzing the Mw9.0 earthquake in Japan and the Mw8.1 earthquake in Nepal in 2011, Ouzounov et al. concluded that the ionospheric anomalies were caused by outward wave radiation [15,16]. Pulinets et al. studied earthquakes in areas such as the Kuril Islands area with an LAIC model. They concluded that earthquake preparation is coupled to the functional processes of the global electric circuit, and the global electric circuit generates atmospheric electric fields [17,18]. Parrot et al. verified the coupling relationship between the atmosphere and ionosphere based on a GIM, thermal infrared (TIR) anomalies, and outgoing long-wave radiation (OLR) data for TEC [19]. Thomas et al. confirmed that solar and geomagnetic activities have certain seasonal variation characteristics through TEC storm response statistics. Afraimovich et al. also confirmed that TEC has similar periodic changes through global electron content and the ionospheric model IRI [20,21]. In addition, many studies have detected the magnetic conjugation effect caused by seismic–ionospheric coupling before earthquakes. These findings provide a theoretical basis for ionospheric disturbances caused by earthquakes [22,23,24]. Equatorial Plasma Bubbles (EPBs) and Traveling Ionospheric Disturbances (TIDs) are considered major factors affecting irregular changes in plasma density in the low-latitude and mid-dimensional F regions [25,26]. Pimenta et al. observed the density enhancement of local plasma blobs during the density loss of plasma bubbles through ionosondes and all-sky imaging systems during geomagnetic perturbations and found that the density variation regions were similar. A certain degree of complementarity between plasma bubbles and plasma blobs has been observed [27,28]. Miller et al. and Kil et al. used an airglow imager and a CINDI in situ plasma density and velocity instrument to analyze C/NOFS observations made by spacecraft. They found that the blob height change and the density perturbation characteristics of the westward drift are consistent with the structure driven by MSTID. Therefore, the origin of blobs may be related to MSTID [29,30]. Wang et al. also used simultaneous ionospheric measurements from a ROCSAT-1 satellite and ground ionosondes/GPS receivers to detect EPB and blob production at similar heights in the lower part of zone F above Hainan. The peak could be as high as 600 km, the height at which the electric field deposits charges from the gravity wave. In this case, Wang et al. concluded that blob generation may be caused by gravity waves, but further measurements are needed to confirm this conclusion [31]. It is worth noting that Kil et al., Lee et al., and Aa et al. proposed that under magnetostatic conditions, EPBs occur at low equatorial latitudes within ±20° [32,33,34]. EPB disturbance occurs mostly at midnight, and EPB moves to the southwest in the northern hemisphere for a short time [26]. In addition, traveling ionospheric disturbance (TID) causes interference with the ionosphere to a certain extent. Current research results show that TID can be divided into two categories according to the wavy structure and basic characteristics of ionospheric density: mesoscale TIDs (MSTIDs) and large-scale TIDs (LSTIDs), which mainly occur during geomagnetic storms [35]. Cowling et al. and Vasseur et al. concluded that MSTIDs are mostly affected by gravity waves [36,37]. Jonah et al. compared TID changes in different geomagnetic environments. MSTID mostly occurs during quiet geomagnetic activity, while LSTID mostly occurs during geomagnetic activity [38]. Frissell et al. confirmed the effects of geomagnetic activity on mid-latitude MSTID by observing the auroral electrojet (AE) index with LIDAR. They also suggested MSTID’s potential association with thermospheric gravity waves [39]. The generation and propagation mechanism of TID is complex and interrelated. At present, research on TID has not been fully verified or quantitatively analyzed, and the origin of TID is not unified. Many factors affect Sporadic E; statistical studies by Zhang YB et al. and Zhou C et al. showed that Sporadic E (Es) occurrence rate may be affected by geomagnetic activity [40,41]. Zhou C et al. and Liu Y et al. observed the simultaneous occurrence of Es, E region FAI echoes, and MSTIDs in the ionosphere at night. They also described the statistical characteristics of ionospheric E–F coupling phenomena [42,43]. Mošna et al. used the critical frequency of the F2 layer (foF2) and other parameters to evaluate Sudden Stratospheric Warming (SSW) effects at low and middle latitudes. In the case of both geomagnetic quiet and geomagnetic disturbance, they concluded that low-latitude SSW significantly impacts the mid-latitude ionosphere [44]. Pedatella et al. used the thermosphere–ionosphere–electrodynamics general circulation model (TIE-GCM) to simulate how strong lower atmosphere forcing would influence the ionosphere’s response to a geomagnetic superstorm [45]. In this paper, GIM TEC data and the seismic–ionospheric coupling mechanism of Mw6.5 + earthquakes in Japan from 2011 to 2022 are studied.

2. Data and Methodology

2.1. Data Selection

In this paper, Japan was chosen as the focal point for investigating seismic–ionospheric coupling mechanisms. To avoid confusion between different earthquakes occurring in nearby areas [46], earthquakes of Mw6.5 and above at the epicenter, occurring from 2011 to 2022, were selected as research objects. To describe ionosphere state data, IGS stations were used to collect TEC data provided by the European Centre for Orbit Determination (CODE), which monitors 300 IGS stations in real time worldwide (https://www.aiub.unibe.ch/download (accessed on 27 January 2024)). The vertical total electron content (VTEC) is used to model TEC data through spherical harmonic expansion techniques. Since 2014, CODE has reconstructed TEC data with higher 15-order spherical harmonics, with a spatial resolution of 2.5° in dimension and 5° in longitude [47]. Global TEC data were more precise and sufficient for studying the spatiotemporal variation in the ionosphere after the time resolution of the data changed from 2 h to 1 h after the update. However, the data from these grid points may not be positioned vertically above the epicenter [48]. Hence, this study employs the nearest grid point method near the earthquake epicenter to interpolate and determine the total electron content (TEC) directly above. To mitigate factors impacting ionospheric disturbances, this research incorporates SSN, F10.7, Vsw, TSI, KP, and DST to analyze and detect them with the sliding quartile method and data provided by NASA (https://omniweb.gsfc.nasa.gov/form/dx1.html (accessed on 4 December 2023). Sunspot numbers (SSNs) have been observed for more than 300 years and are the main parameter for expressing solar activity. The solar radio flux of 10.7 cm (2800 MHz) at one-hour intervals is a crucial metric for assessing solar activity which is expressed in solar luminous flux units (sfu), usually 50–300 SFU. Total solar irradiance (TSI) is an important indicator of solar activity, reflecting changes that affect the physical and chemical processes of the Earth’s climate and atmosphere. It is usually expressed in watts per square meter unit area (W/m2). The velocity of solar wind (Vsw) can characterize solar activity, including solar flares and coronal mass ejections, which affect Earth’s magnetosphere and space weather. The DST index is calculated every hour by observing the reduction in the horizontal component of the Earth’s magnetic field near the magnetic equator. This index is widely used to measure the intensity of geomagnetic storms. The KP index has a temporal resolution of 3 h and is currently divided into 10 levels (KP = 0–9) [49]. In this study, 20 earthquakes were classified according to their magnitude to investigate the relationship between the ionosphere and earthquakes. Figure 1 illustrates the geographical arrangement of 20 earthquakes that occurred in the vicinity of Japan. The accompanying Table 1 furnishes exact geographic and temporal information for these seismic events.

2.2. Methods

Since solar rotation follows a 27-day cycle, solar radiation likewise follows a 27-day periodicity [50]. Solar radiation causes ultraviolet rays, X-rays, and solar wind to act on the atmosphere. The ionosphere may also be affected by this and experience periodic changes. To quantitatively analyze this influence on the cycle, the method of wavelet analysis was used to explore the periodic window. Wavelet analysis is a method used for examining the power spectrum of time series data. Contrary to the Fourier transform, it can mitigate the impact of edge effects on the period. The Morlet wavelet was selected for this study as the mother wavelet because it has better localization properties in the frequency and time domains [51].
The specific expression of the Morlet wavelet is:
ψ ( t ) = e a t 2 cos ( 5 t )
where a is the scaling factor, and the wavelet transform of the signal f ( t ) is defined as:
w f ( a , b ) = R f ( t ) ψ ¯ a b ( t ) d t
where ψ ¯ a b ( t ) is the conjugate function of ψ a b ( t ) , and b is the translation factor.
The definition of the wavelet power spectrum is:
E a , b = W f ( a , b ) 2
The global wavelet power spectrum E a depicts the distribution of energy density across various scales a :
E a = 1 N b N W f ( a , b ) 2
Since solar and geomagnetic activities have always existed and activity changes have high frequency, potential time variations that could contribute to abnormal shifts in the ionosphere are currently unidentified. Therefore, methods are needed to mitigate these effects. In this paper, the TEC period in the global time domain was obtained using the wavelet power spectrum and tested with 95% significance. Using the period that passed the test as the window value, the sliding quartile method was used to extract abnormal TEC changes and solar and geomagnetic fluctuations before obtaining their time series. To eliminate the impact of solar and geomagnetic activities on the ionosphere, the sliding quartile method was employed to compare the time series of TEC abnormal changes with solar and geomagnetic fluctuations, retaining only the moment when TEC abnormal changes occurred. This method involves sorting daily TEC values in ascending order, dividing them into four parts (lower quartile Q1, middle quartile Q2, and upper quartile Q3), and using a sliding window to identify abnormal changes. This study used 27 days as the window value.
Q 1 = ( x 7 + x 8 ) 2
Q 2 = ( x 14 + x 15 ) 2
Q 3 = ( x 21 + x 22 ) 2
where the interquartile distance can be calculated as:
I Q R = Q 3 Q 1
IQR is approximately equal to 1.349 times the standard deviation, and 1.5 IQR is approximately equal to two times the standard deviation (distribution probability is 95.44%) to satisfy the 95% confidence interval. Therefore, this study used 1.5 IQR as the standard and values l1 and l2 as the upper and lower limits of the anomaly test, respectively.
l 1 = Q 2 + 1.5 I Q R
l 2 = Q 2 1.5 I Q R
TEC values that fall outside the predefined upper and lower thresholds are considered anomalies:
Δ TEC = TEC l 1 ; while TEC > l 1 0 ; while TEC < l 1 , TEC > l 2 TEC l 2 ; while TEC < l 2

3. Results

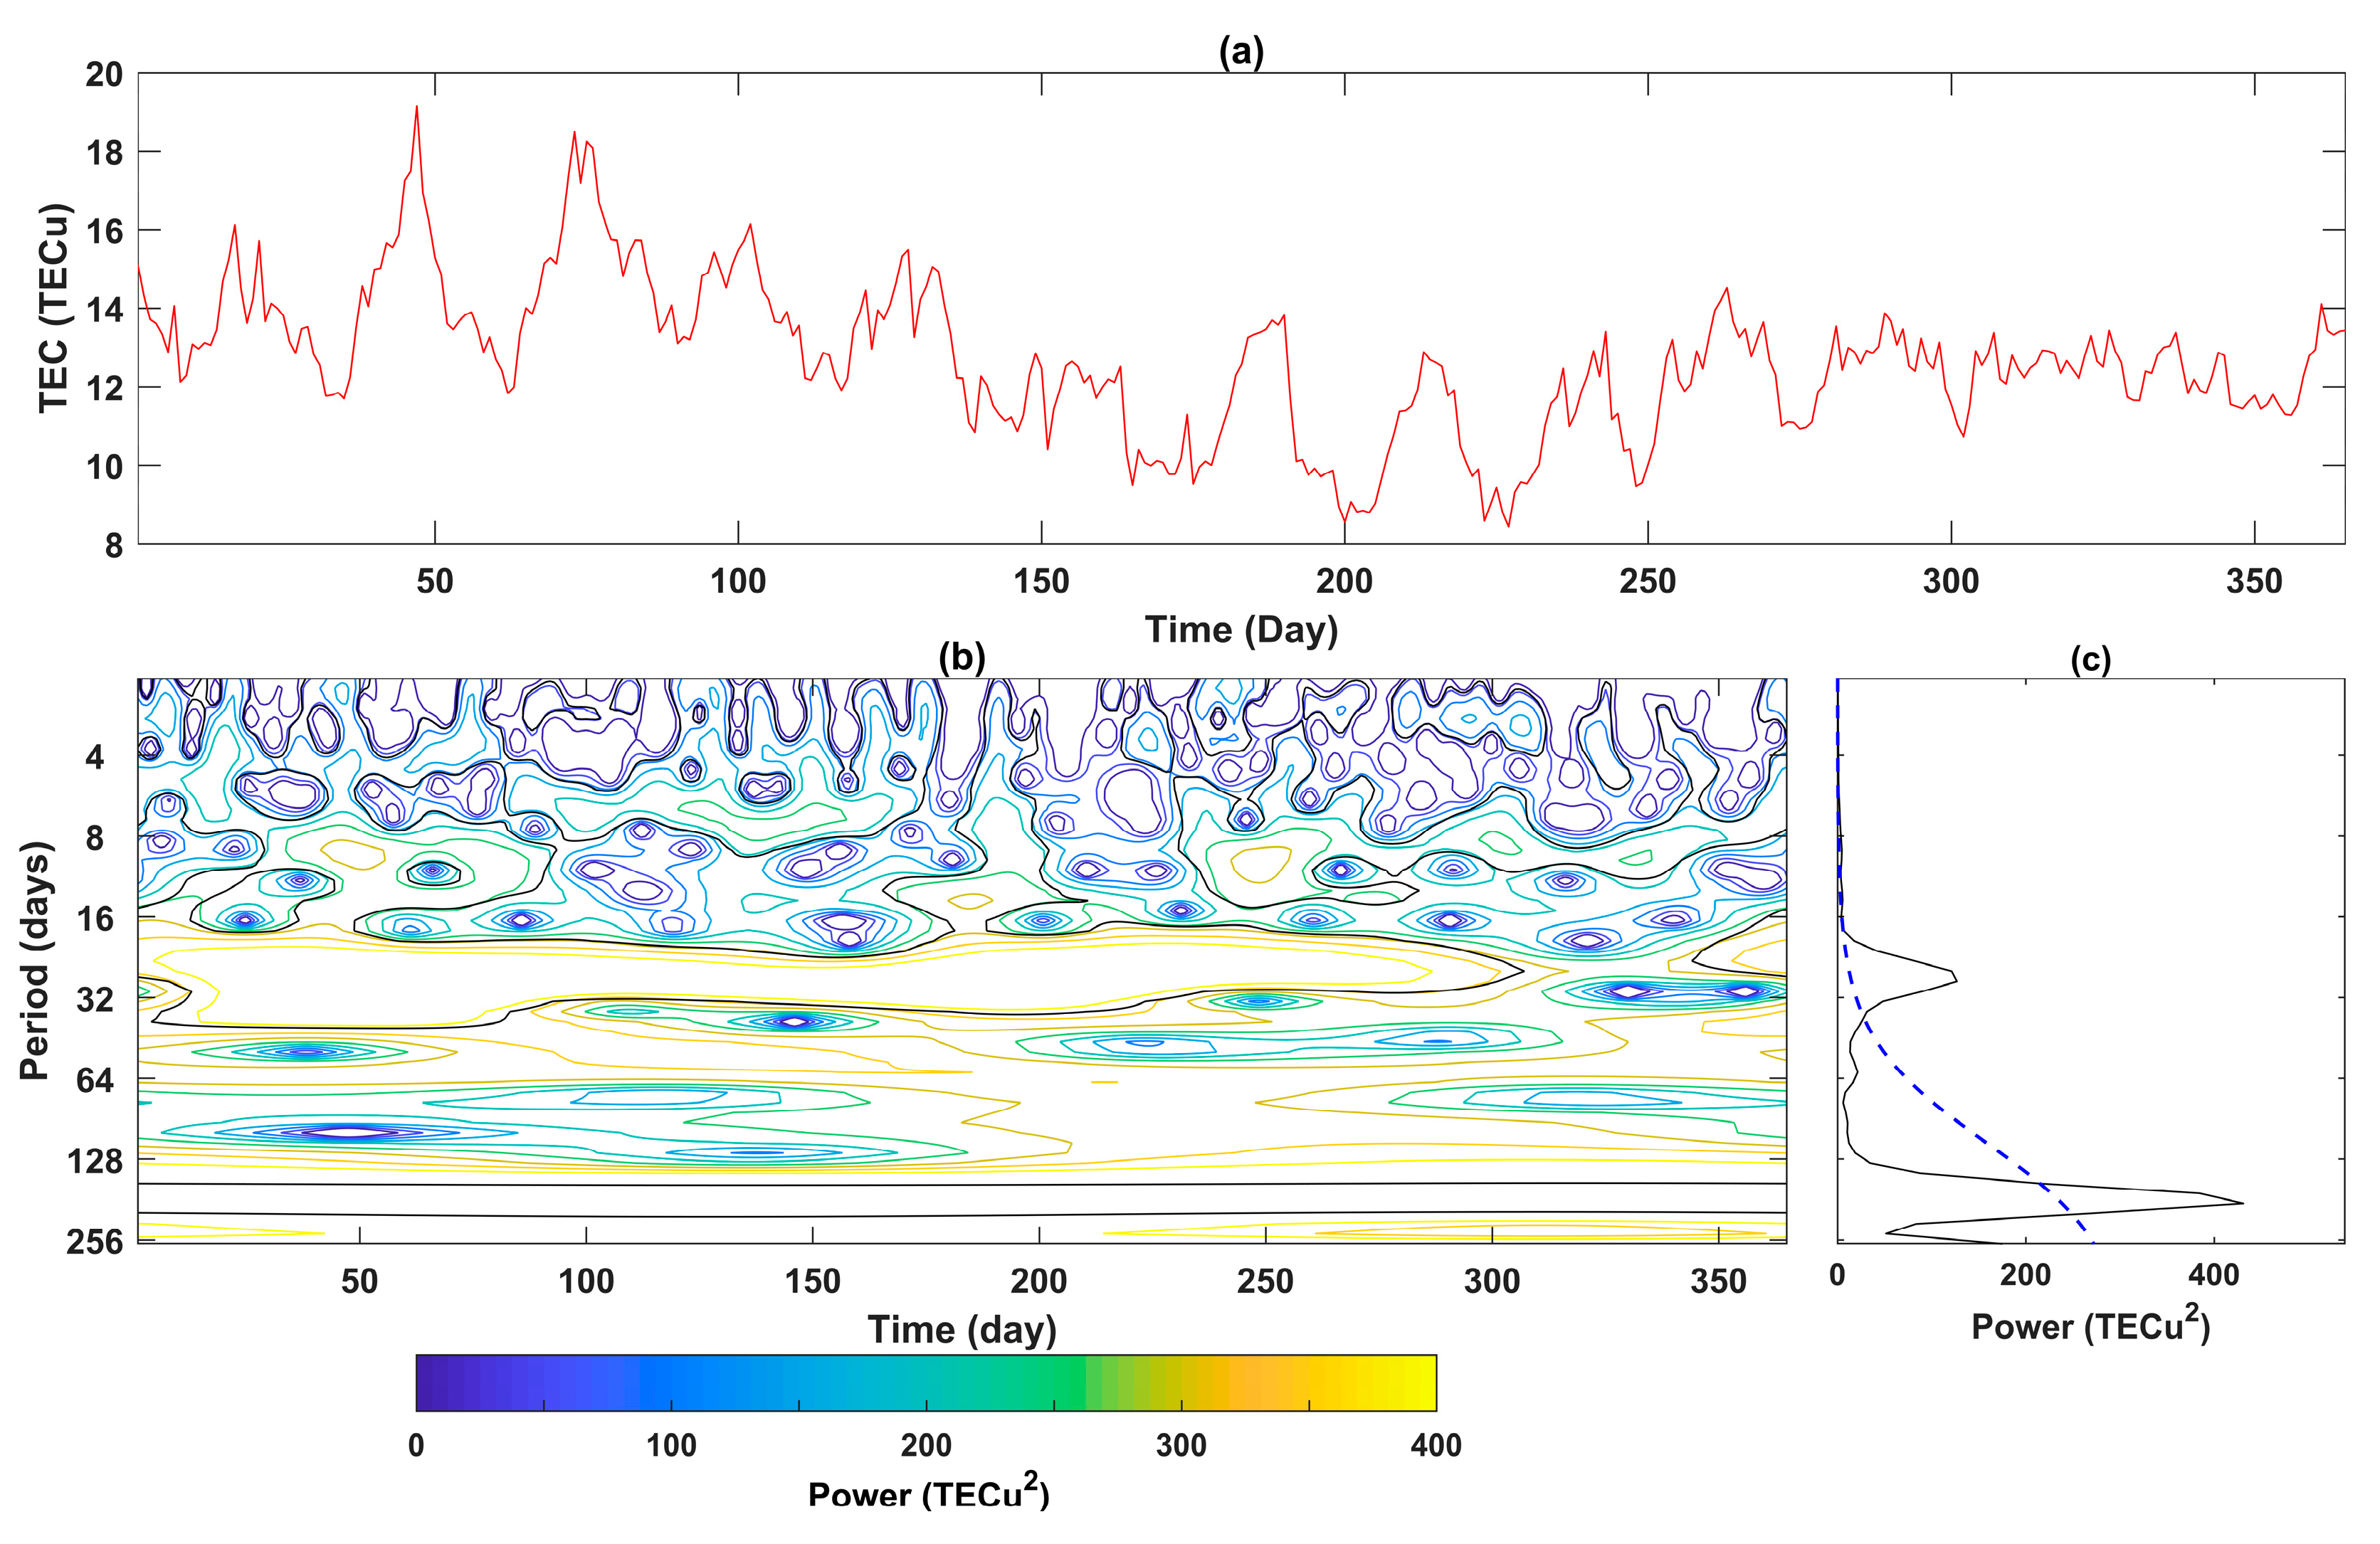
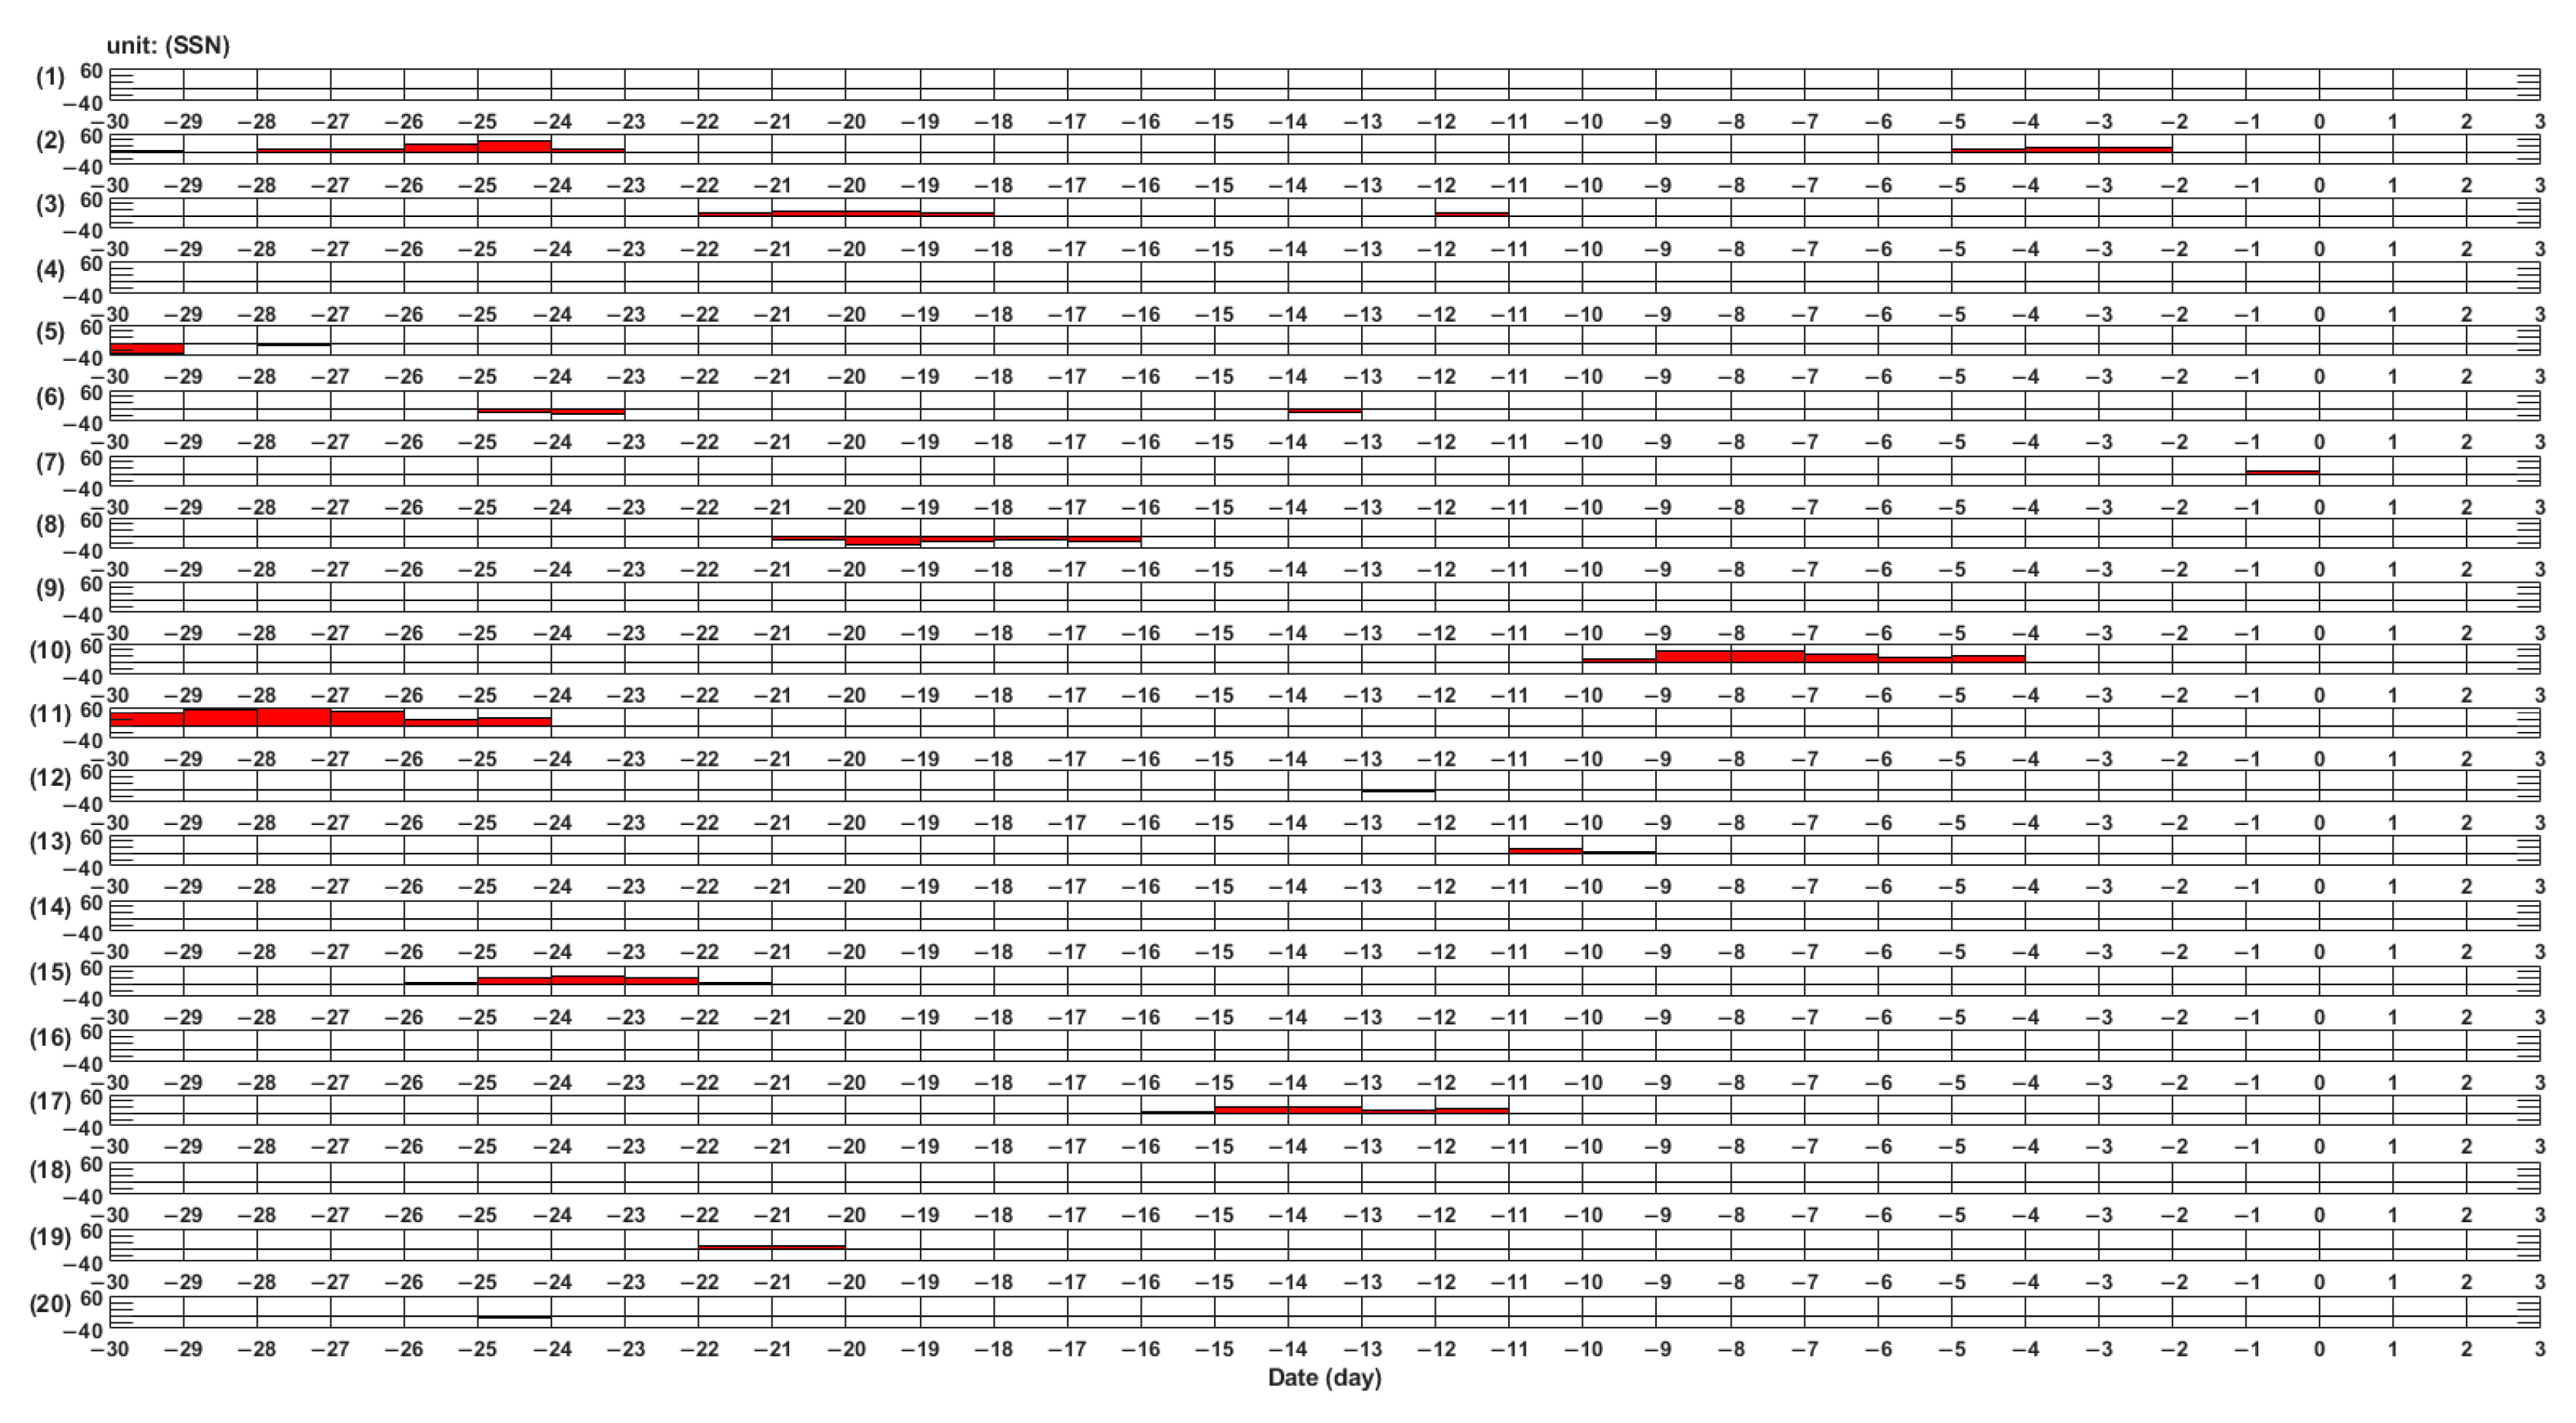
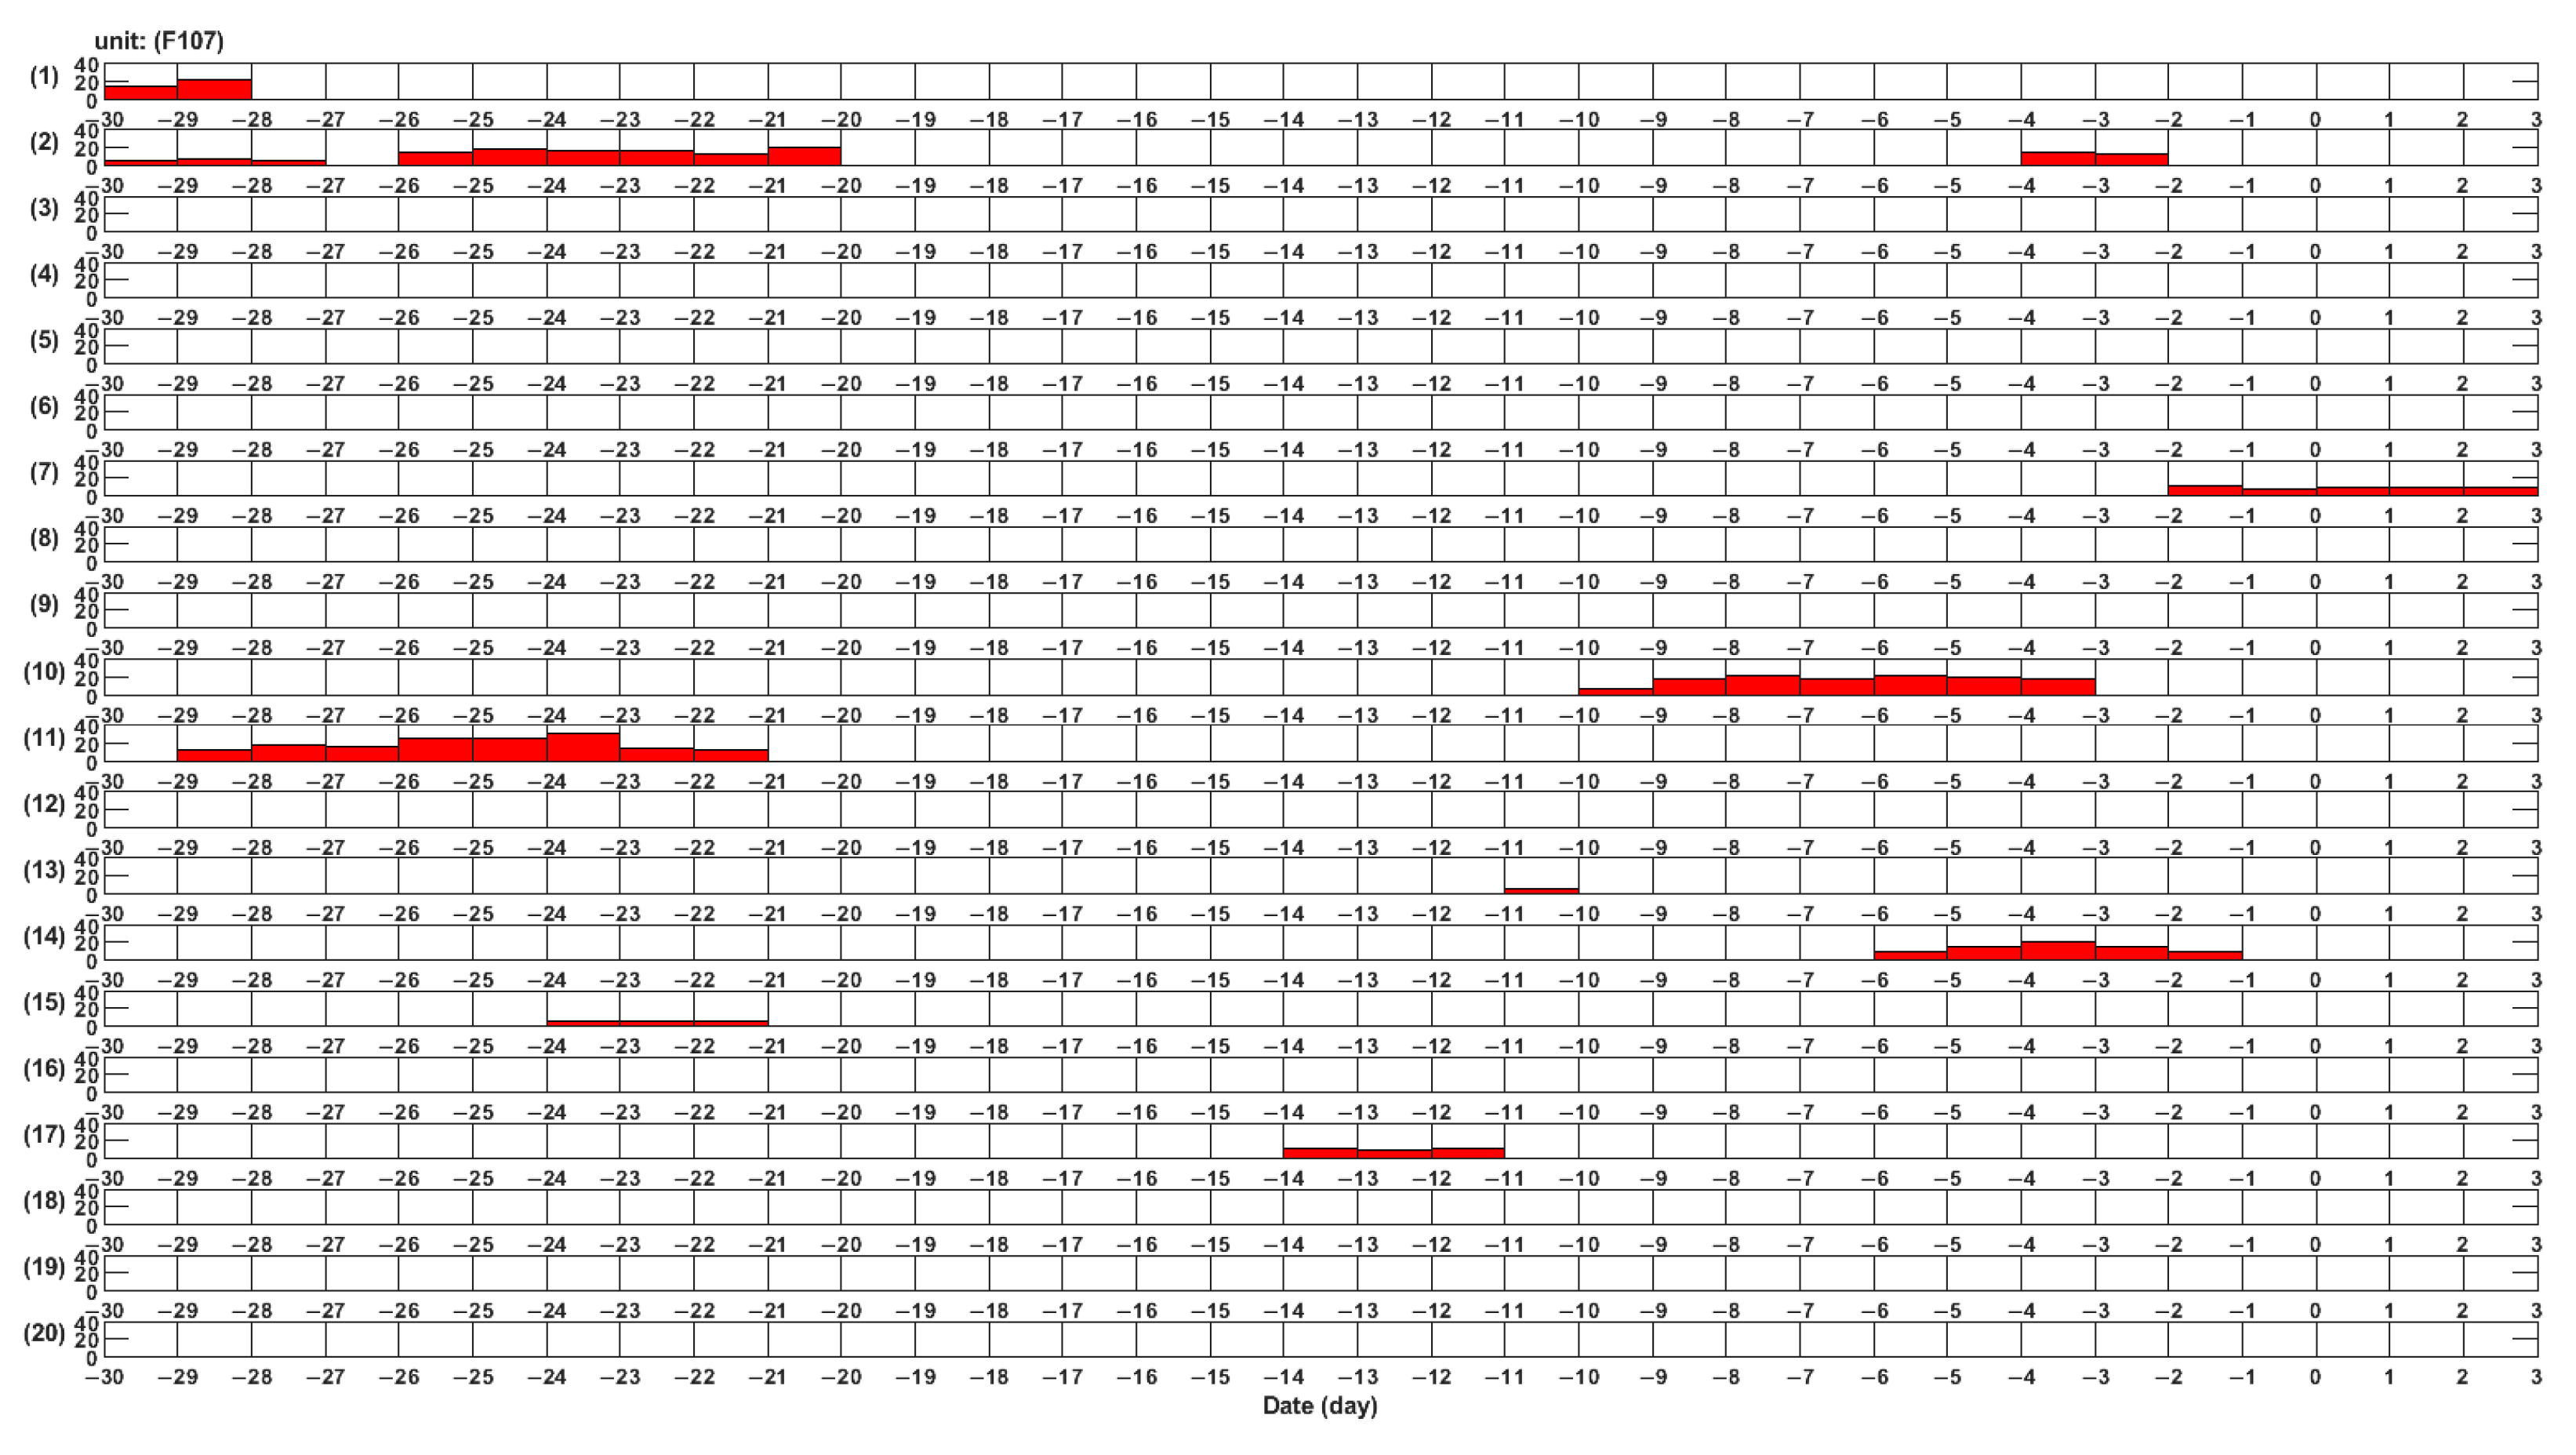
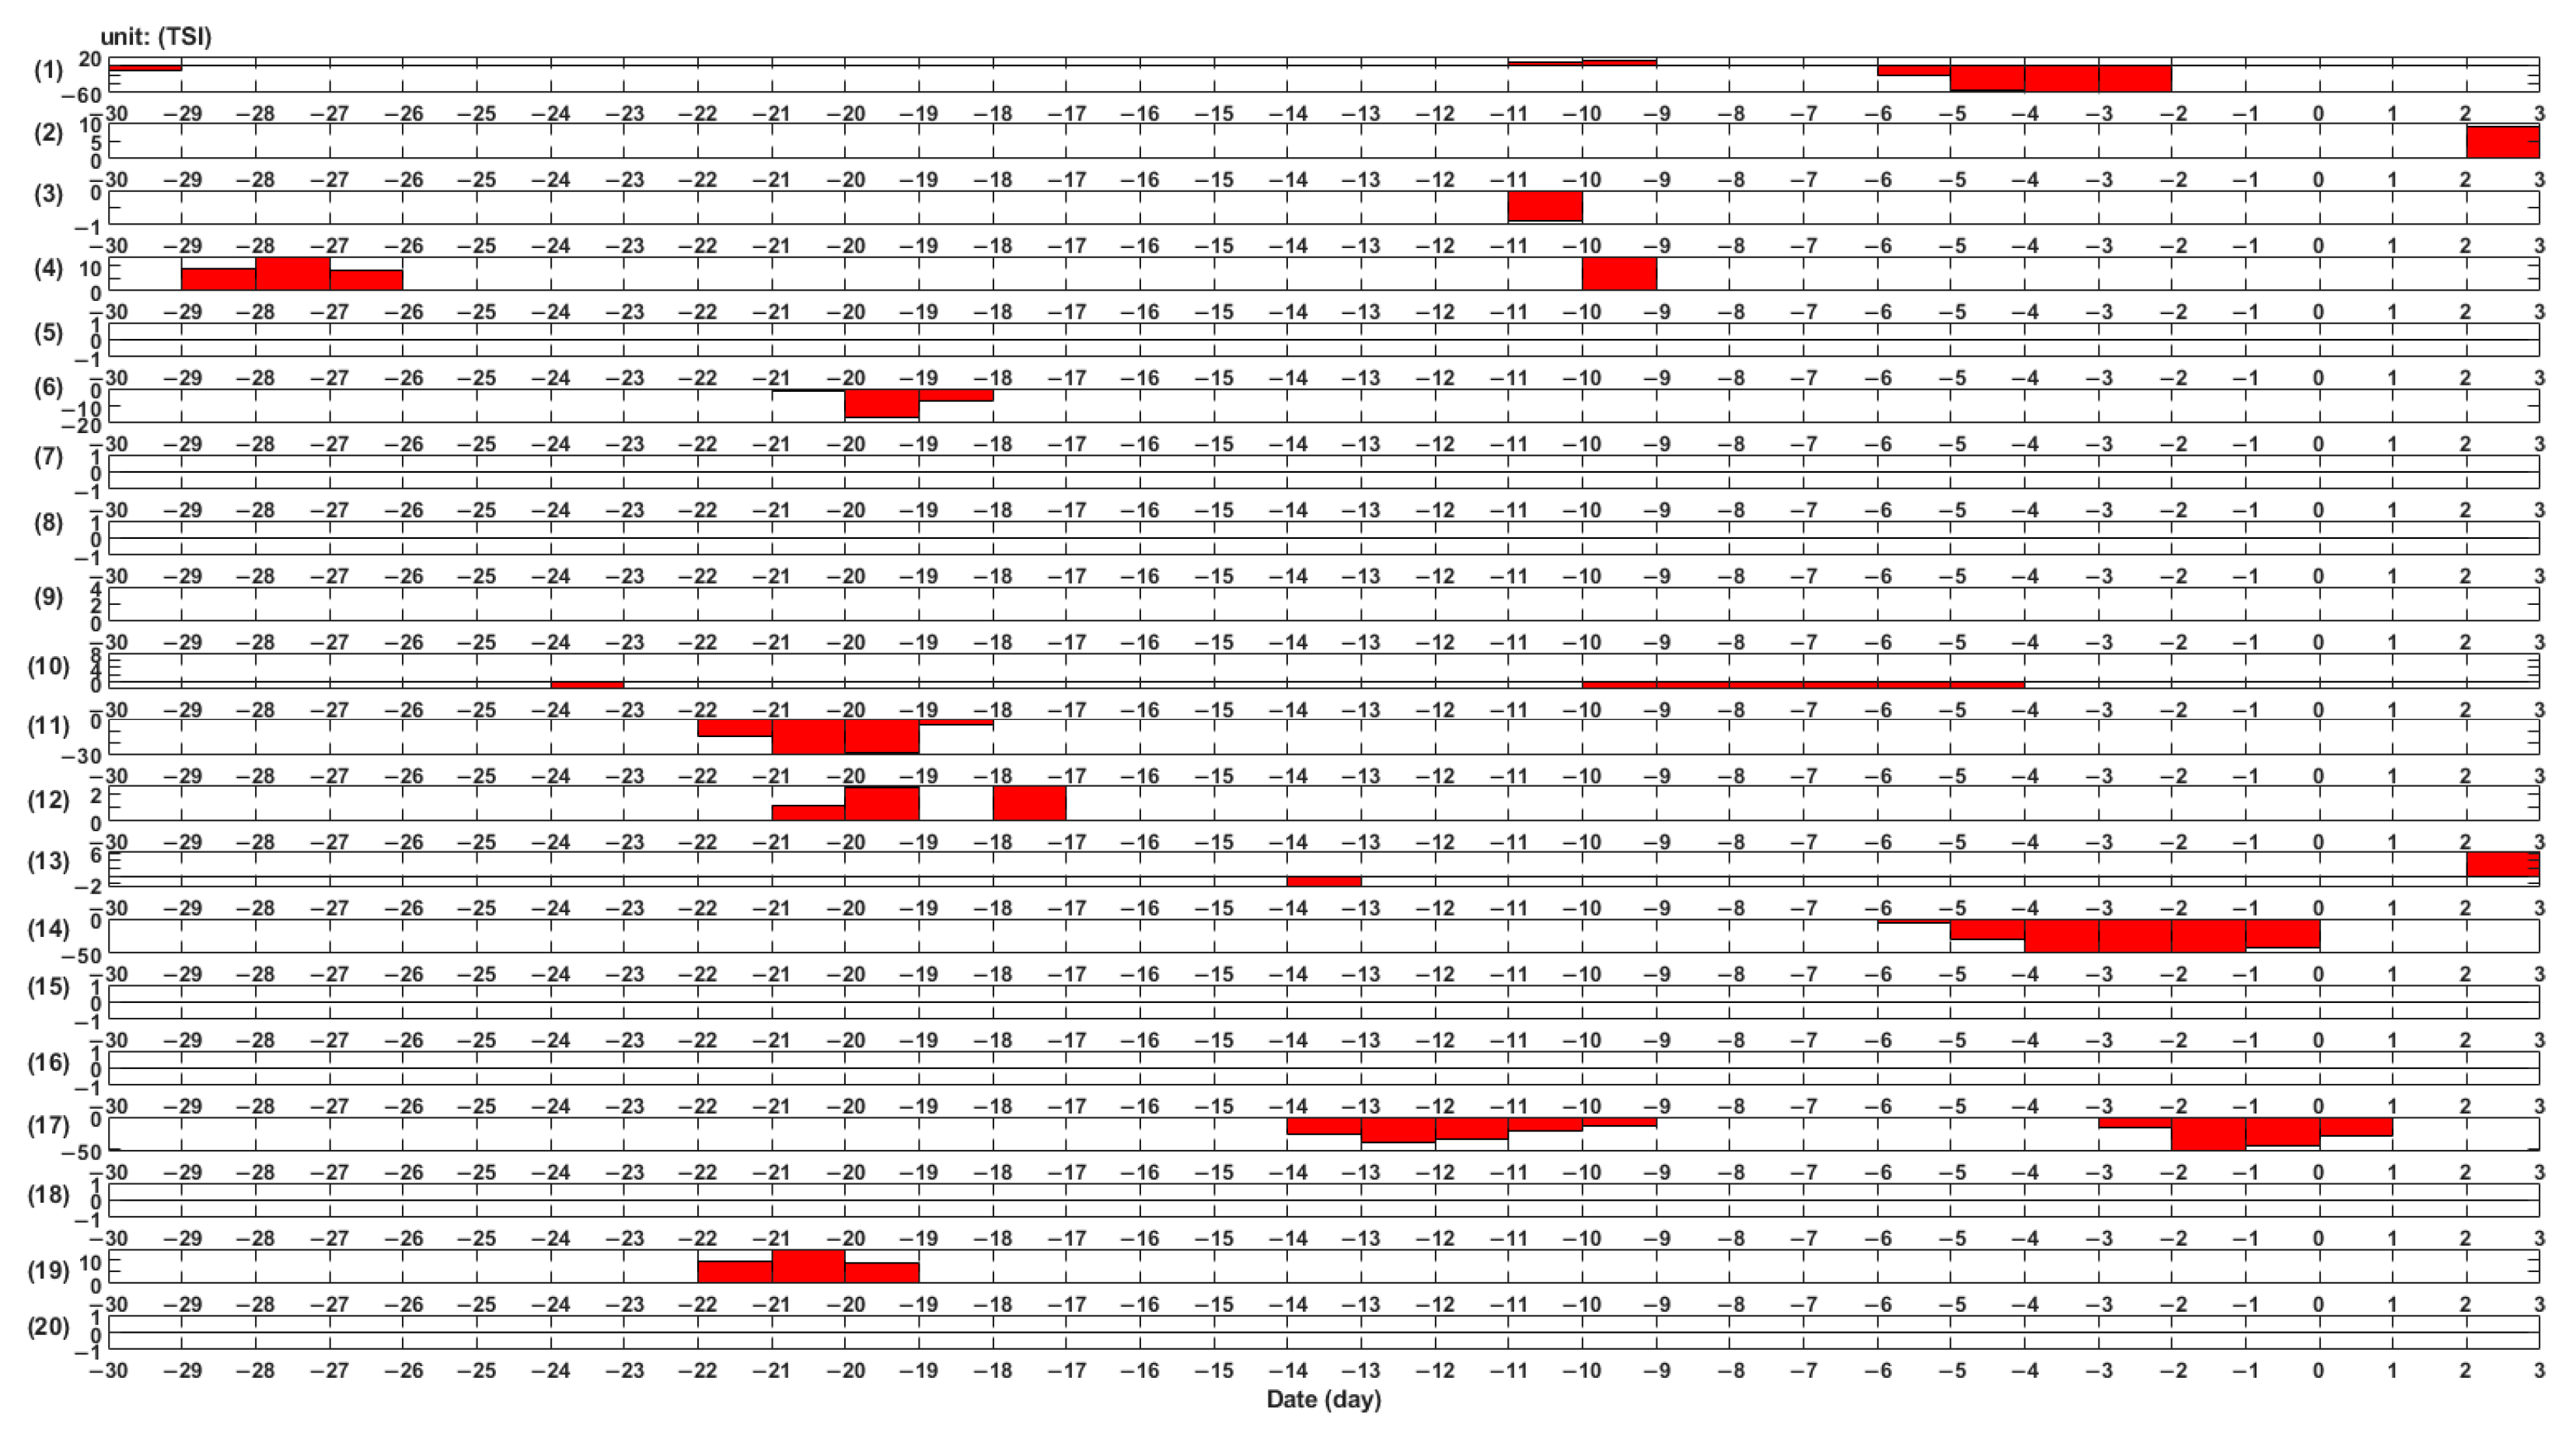
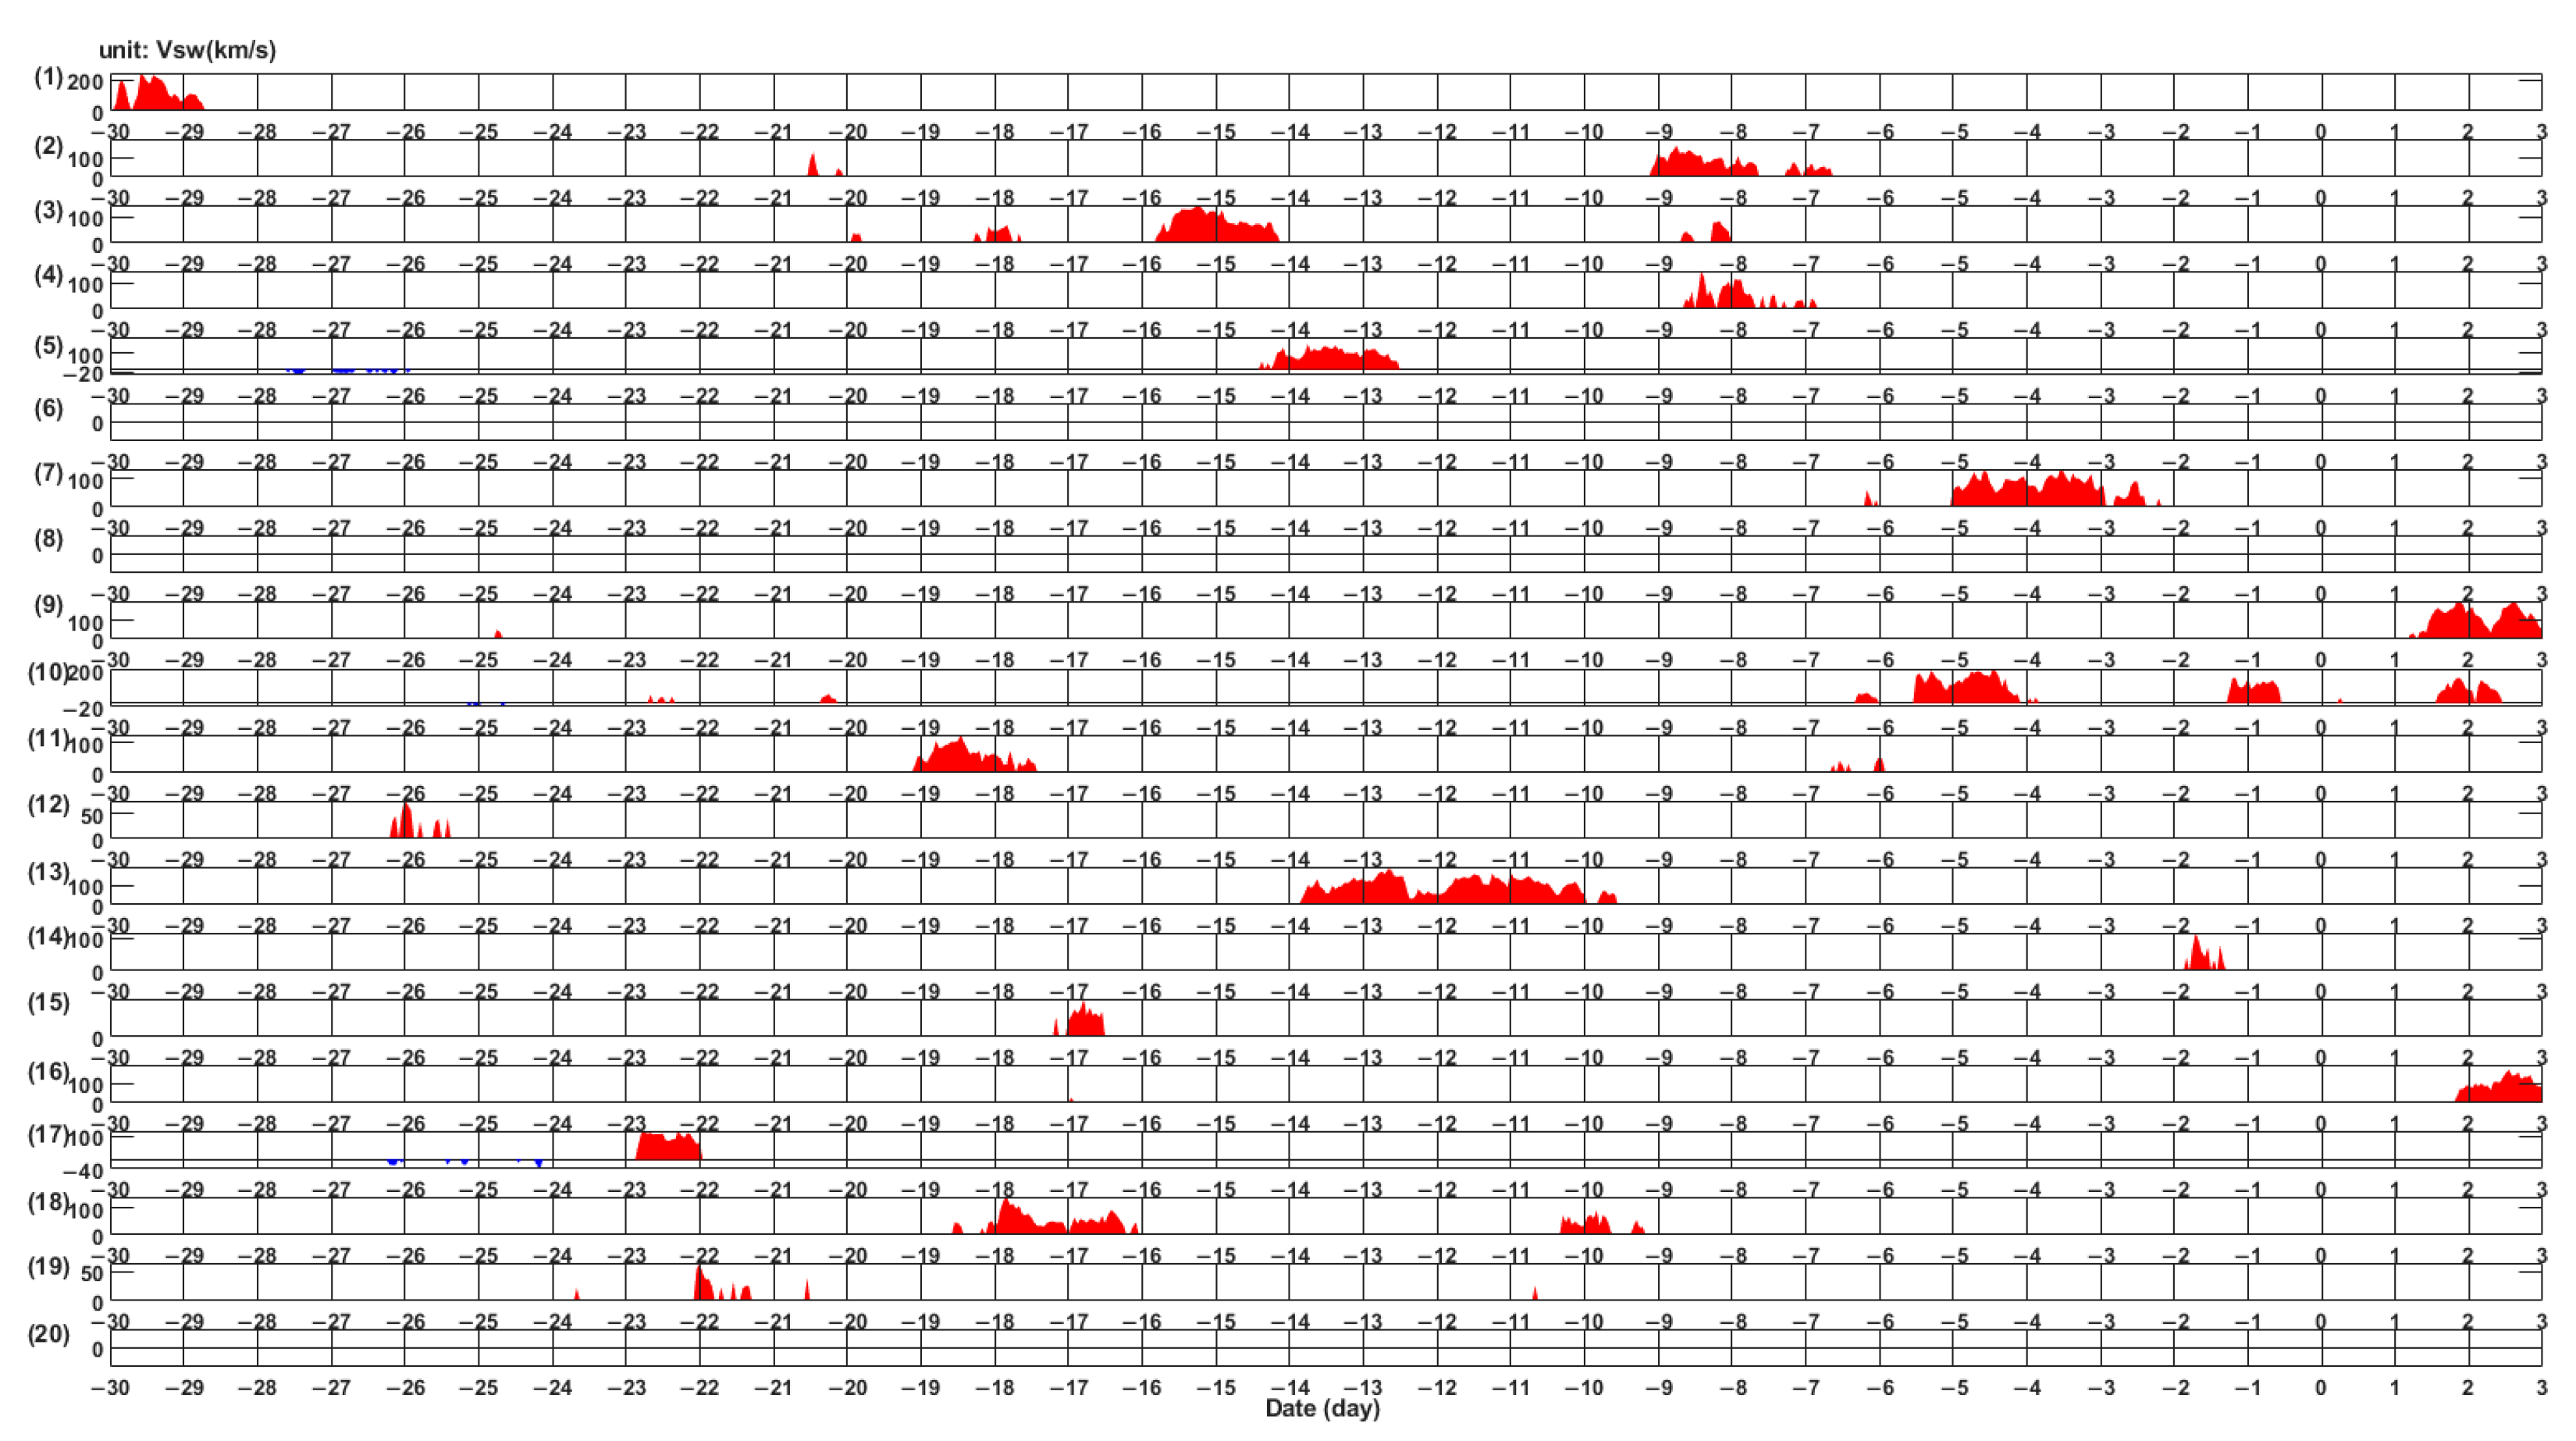
In this study, the average daily TEC value in 2005 was obtained by processing data from the same grid points at different times during the same day. This period was verified via wavelet analysis. Figure 2b shows that TEC has significant periods in the 16–32-day period and the 128–256-day period. The 16–32-day period exists in most time domains, while the 128–256-day period is significant in all time domains. Figure 2c shows that the 27.8-day and 187-day periods in the overall periodic spectrum pass the 95% significance test, indicating their significance in the global time domain and proving that the ionosphere has a periodicity of 27 days due to solar activity. Thus, in this study, we used the sliding quartile distance method with a window value of 27 days to analyze data within a time range of 30 days before and 2 days after each earthquake event. Figure 3, Figure 4, Figure 5, Figure 6, Figure 7 and Figure 8 show abnormal data from solar and geomagnetic activity after processing, and Figure 9 shows abnormal TEC data after processing.
Figure 3, Figure 4, Figure 5 and Figure 6 show that in the 20 selected earthquakes, solar activity exhibited varying degrees of change from 30 days prior to the earthquake event to 2 days following it. However, the occurrence of anomalous alterations was lower than the overall level of geomagnetic activity. Figure 7 and Figure 8 show that geomagnetic activity anomalies are more frequent, the distribution is more dispersed, and the amplitude of some abnormal changes is larger, which may indicate large or medium-sized magnetic storms. Figure 9 reveals that in addition to abnormal TEC disturbance in the 15 days studied before, there was abnormal TEC disturbance 15 days earlier, possibly caused by solar and geomagnetic activities. Thus, measures were taken to eliminate interference from solar and geomagnetic activities with ionospheric anomalies. The period in which solar and geomagnetic activities occur is excluded from the period of abnormal TEC changes. TEC anomalies in the remaining period may be related to earthquakes. The red and blue areas highlighted above and below the zero line correspondingly represent positive and negative TEC anomalies. After statistical analyses, 65% (13 out of 20 earthquakes) of Mw6.5 or more earthquakes occurred before the TEC anomaly. Several TEC anomalies were found before some earthquakes, such as 2 days after the earthquake and 10 days before the earthquake for earthquake no. 12. Earthquake no. 13 occurred one day post-event and two days pre-event. No TEC anomalies were found in earthquakes 1, 3, 8, 10, 17, 18, or 19 after excluding solar and geomagnetic activities. TEC anomalies were also found 15 days before individual earthquakes; however, all of them were minor anomalies and global disturbances observed via VTECmap. They lacked the features typically associated with seismic-activity-induced anomalies in the ionosphere.
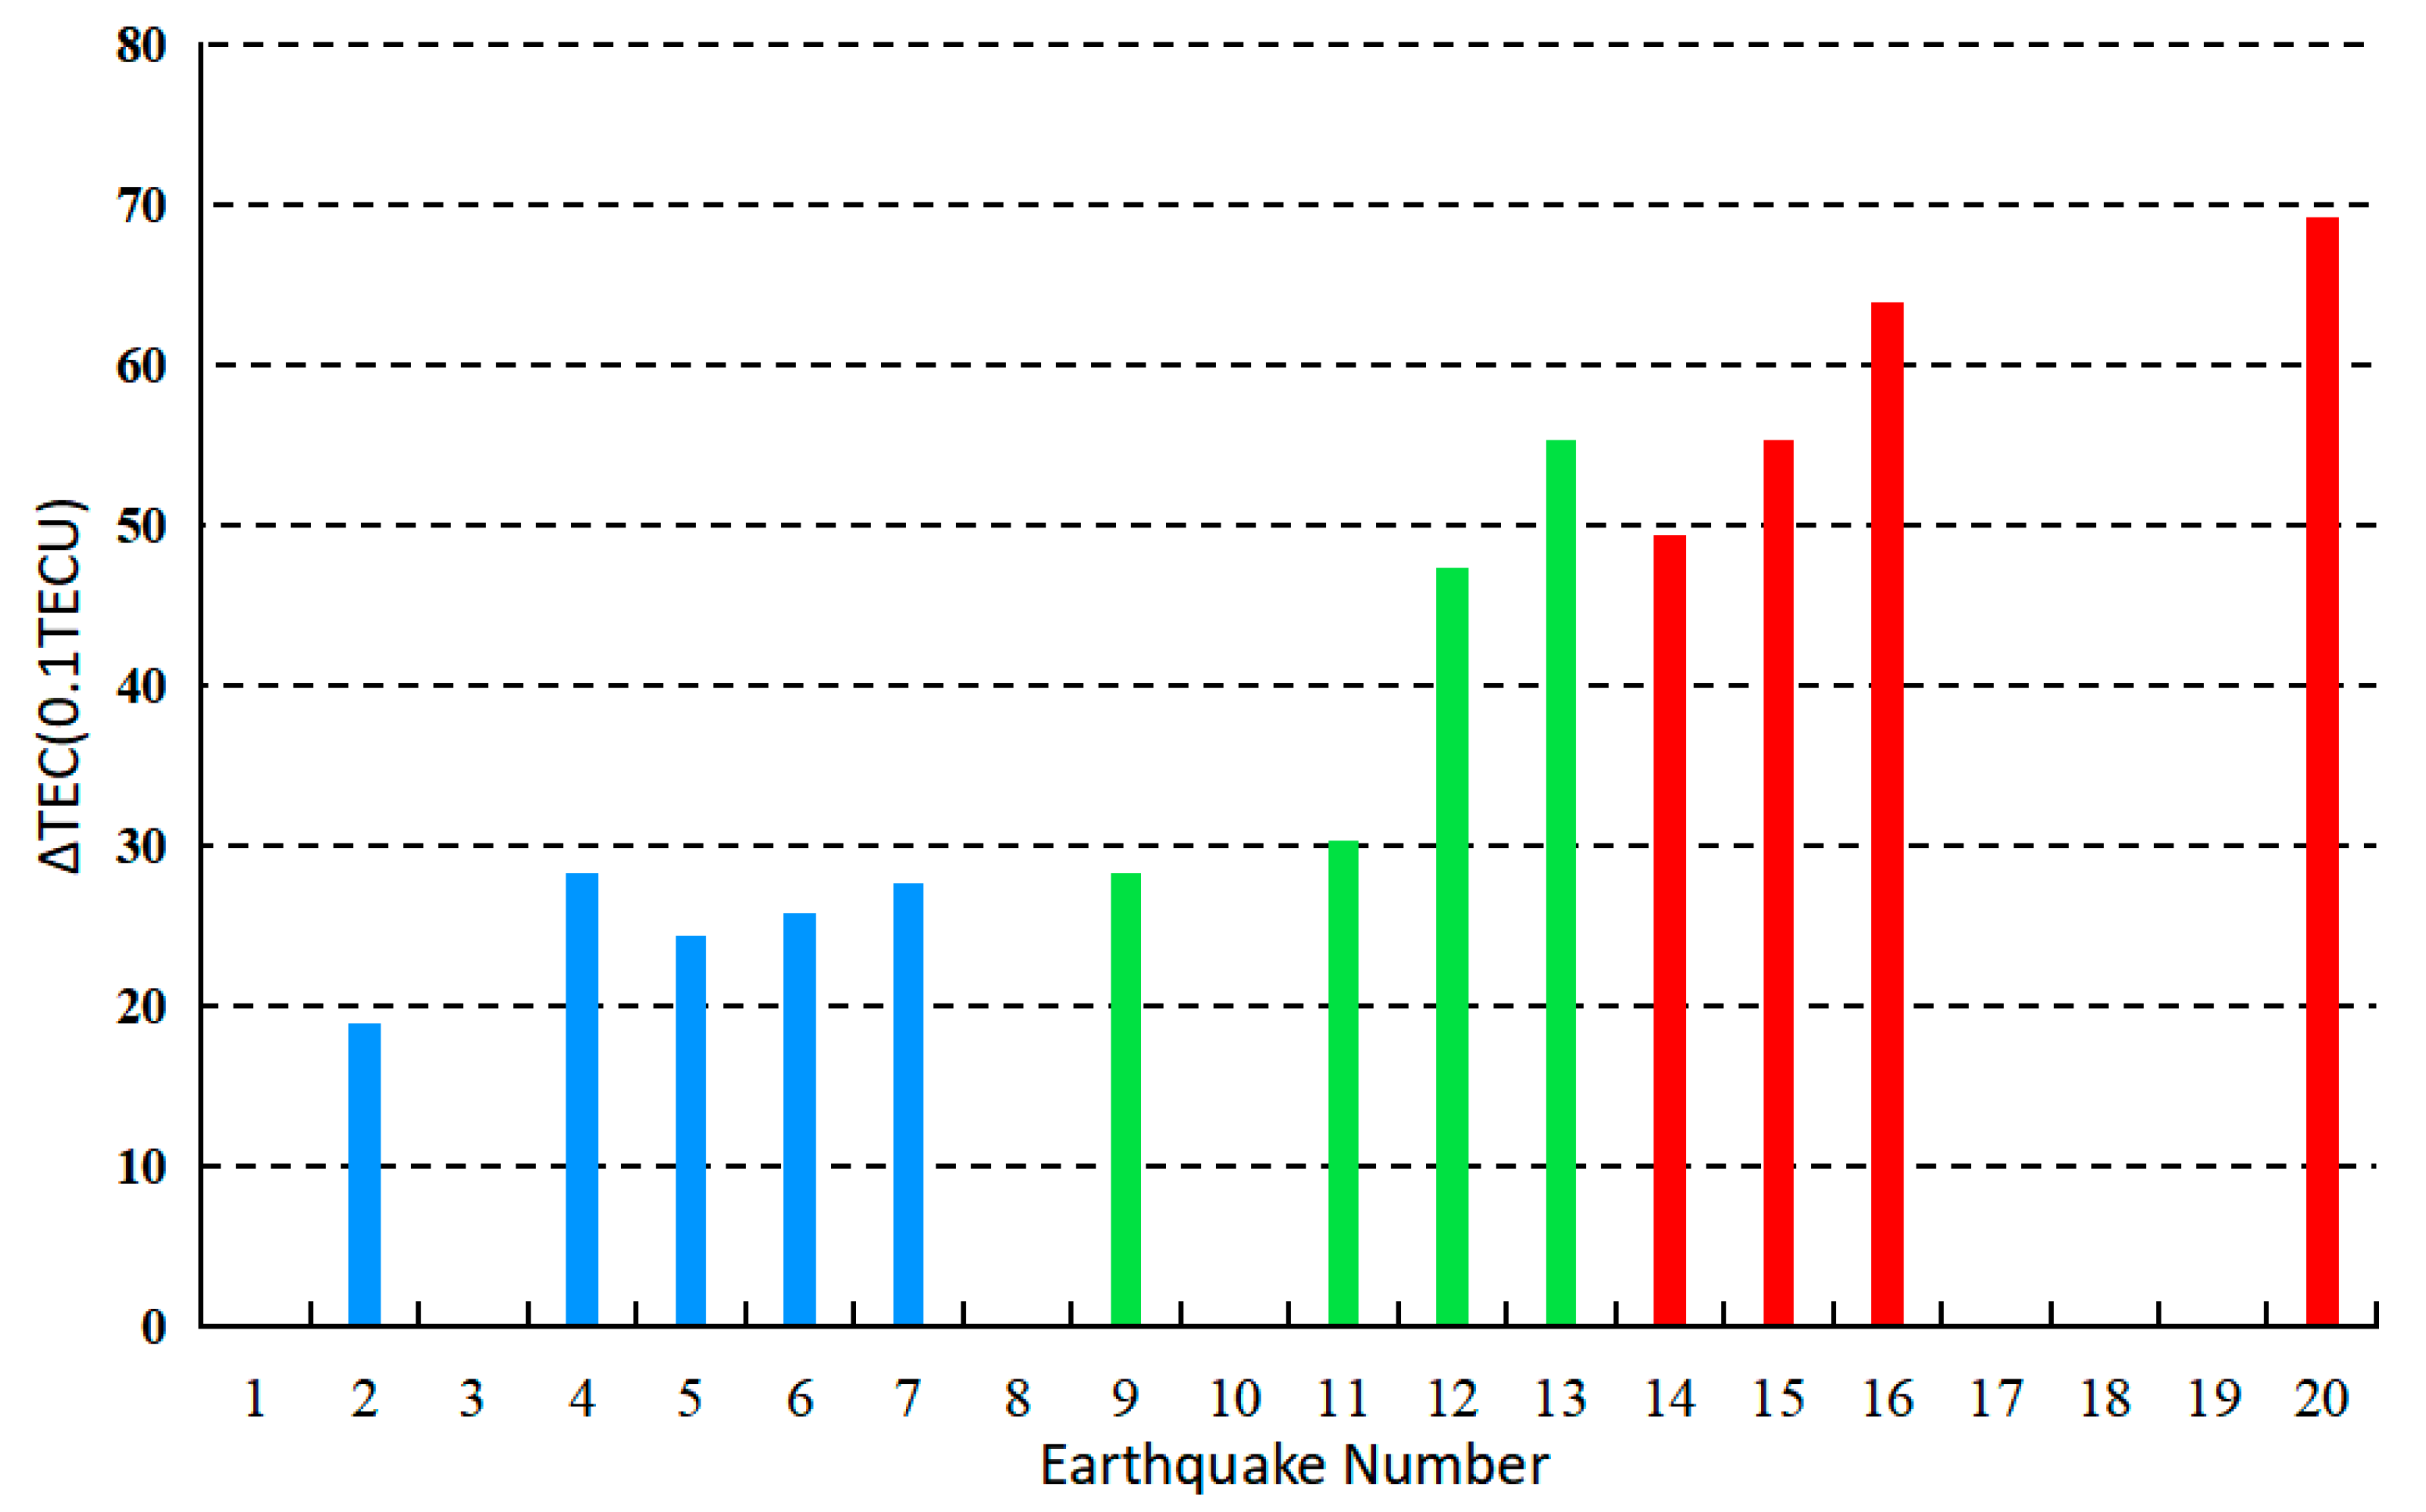
Considering that the ionospheric anomaly occurs more than once, we chose the anomaly’s maximum amplitude to represent the TEC anomaly of the relevant earthquake. Figure 10 shows the maximum amplitude of the ionospheric anomaly before each earthquake. The blank space indicates that there were no TEC anomalies near the epicenter before the earthquake. The colors represent earthquake magnitudes, with blue (earthquakes 2, 4, 5, 6, and 7) representing magnitudes 6.5 to 6.7, green (earthquakes 9, 11, 12, and 13) representing magnitudes 6.8–6.9, and red (earthquakes 14, 15, 16, and 20) representing magnitudes 7.0–7.3. Earthquake no. 9 has a maximum amplitude of 28.3, earthquake no. 7 has a maximum amplitude of 27.6, and earthquake no. 4 has a maximum amplitude of 28.3, indicating that the maximum amplitude of earthquakes between magnitudes 6.5 and 6.7 increases with magnitude except for earthquake no. 4. This phenomenon was also observed for earthquakes between 6.7 and 6.9 and between 7.0 and 7.3 in magnitude. The maximum amplitude increases with magnitude, except for earthquake no. 13 with a maximum amplitude of 55.3, which is higher than earthquake no. 14 with a maximum amplitude of 49.4.
According to the above analysis, the most obvious ionospheric anomaly before the earthquake was used to analyze and develop statistics for the occurrence time of each anomaly within one day (UTC). Figure 11 indicates that, except for earthquake no. 14, other TEC anomalies occurred after UTC5 and before UTC14. The time of the earthquake may also be delayed by an increase in earthquake magnitude.
TEC anomalies were detected on the 29th day before the 20th earthquake (15 February 2022) after eliminating the influence of solar and geomagnetic activity (Figure 9). Since almost all anomalies in previous studies were observed 15 days before the earthquake, this special phenomenon was chosen for analysis in this study. On 16 March 2022, a 7.3 magnitude earthquake occurred in Japan. The epicenter was located at 141.58° E, 37.71° N and the focal depth was 41 km. The TEC anomaly is analyzed in detail below.
Solar activity and geomagnetic storms significantly impact ionospheric disturbances. Therefore, to analyze and eliminate these factors from affecting ionospheric anomalies, this study used SSN, F10.7, TSI, Vsw, Dst, and KP as indicators of solar and geomagnetic activities. The solar–terrestrial environmental changes from 30 days before the earthquake to two days after the earthquake are shown in Figure 11. The bold green line indicates the moment the earthquake occurred. The faint green line denotes the moment the ionospheric anomaly occurred. As shown in Figure 12a,d, the solar variation is relatively stable on 15 February 2022. The SSN index is about 70, the F10.7 index is about 100SFU, and the change in TSI and Vsw data is not obvious. Figure 12e,f shows the DST and KP time series. The DST index measures geomagnetic activity in the equatorial region, while the KP index measures geomagnetic activity on a global scale. According to both data sets, the geomagnetic environment around 15 February was relatively calm. Although there was a large degree of geomagnetic solar activity on 24, 10, and 2 days before the earthquake, there were no abnormal solar or geomagnetic activities detected on February 15th preceding the earthquake. We analyzed TEC anomaly changes on this day using VTECmap.
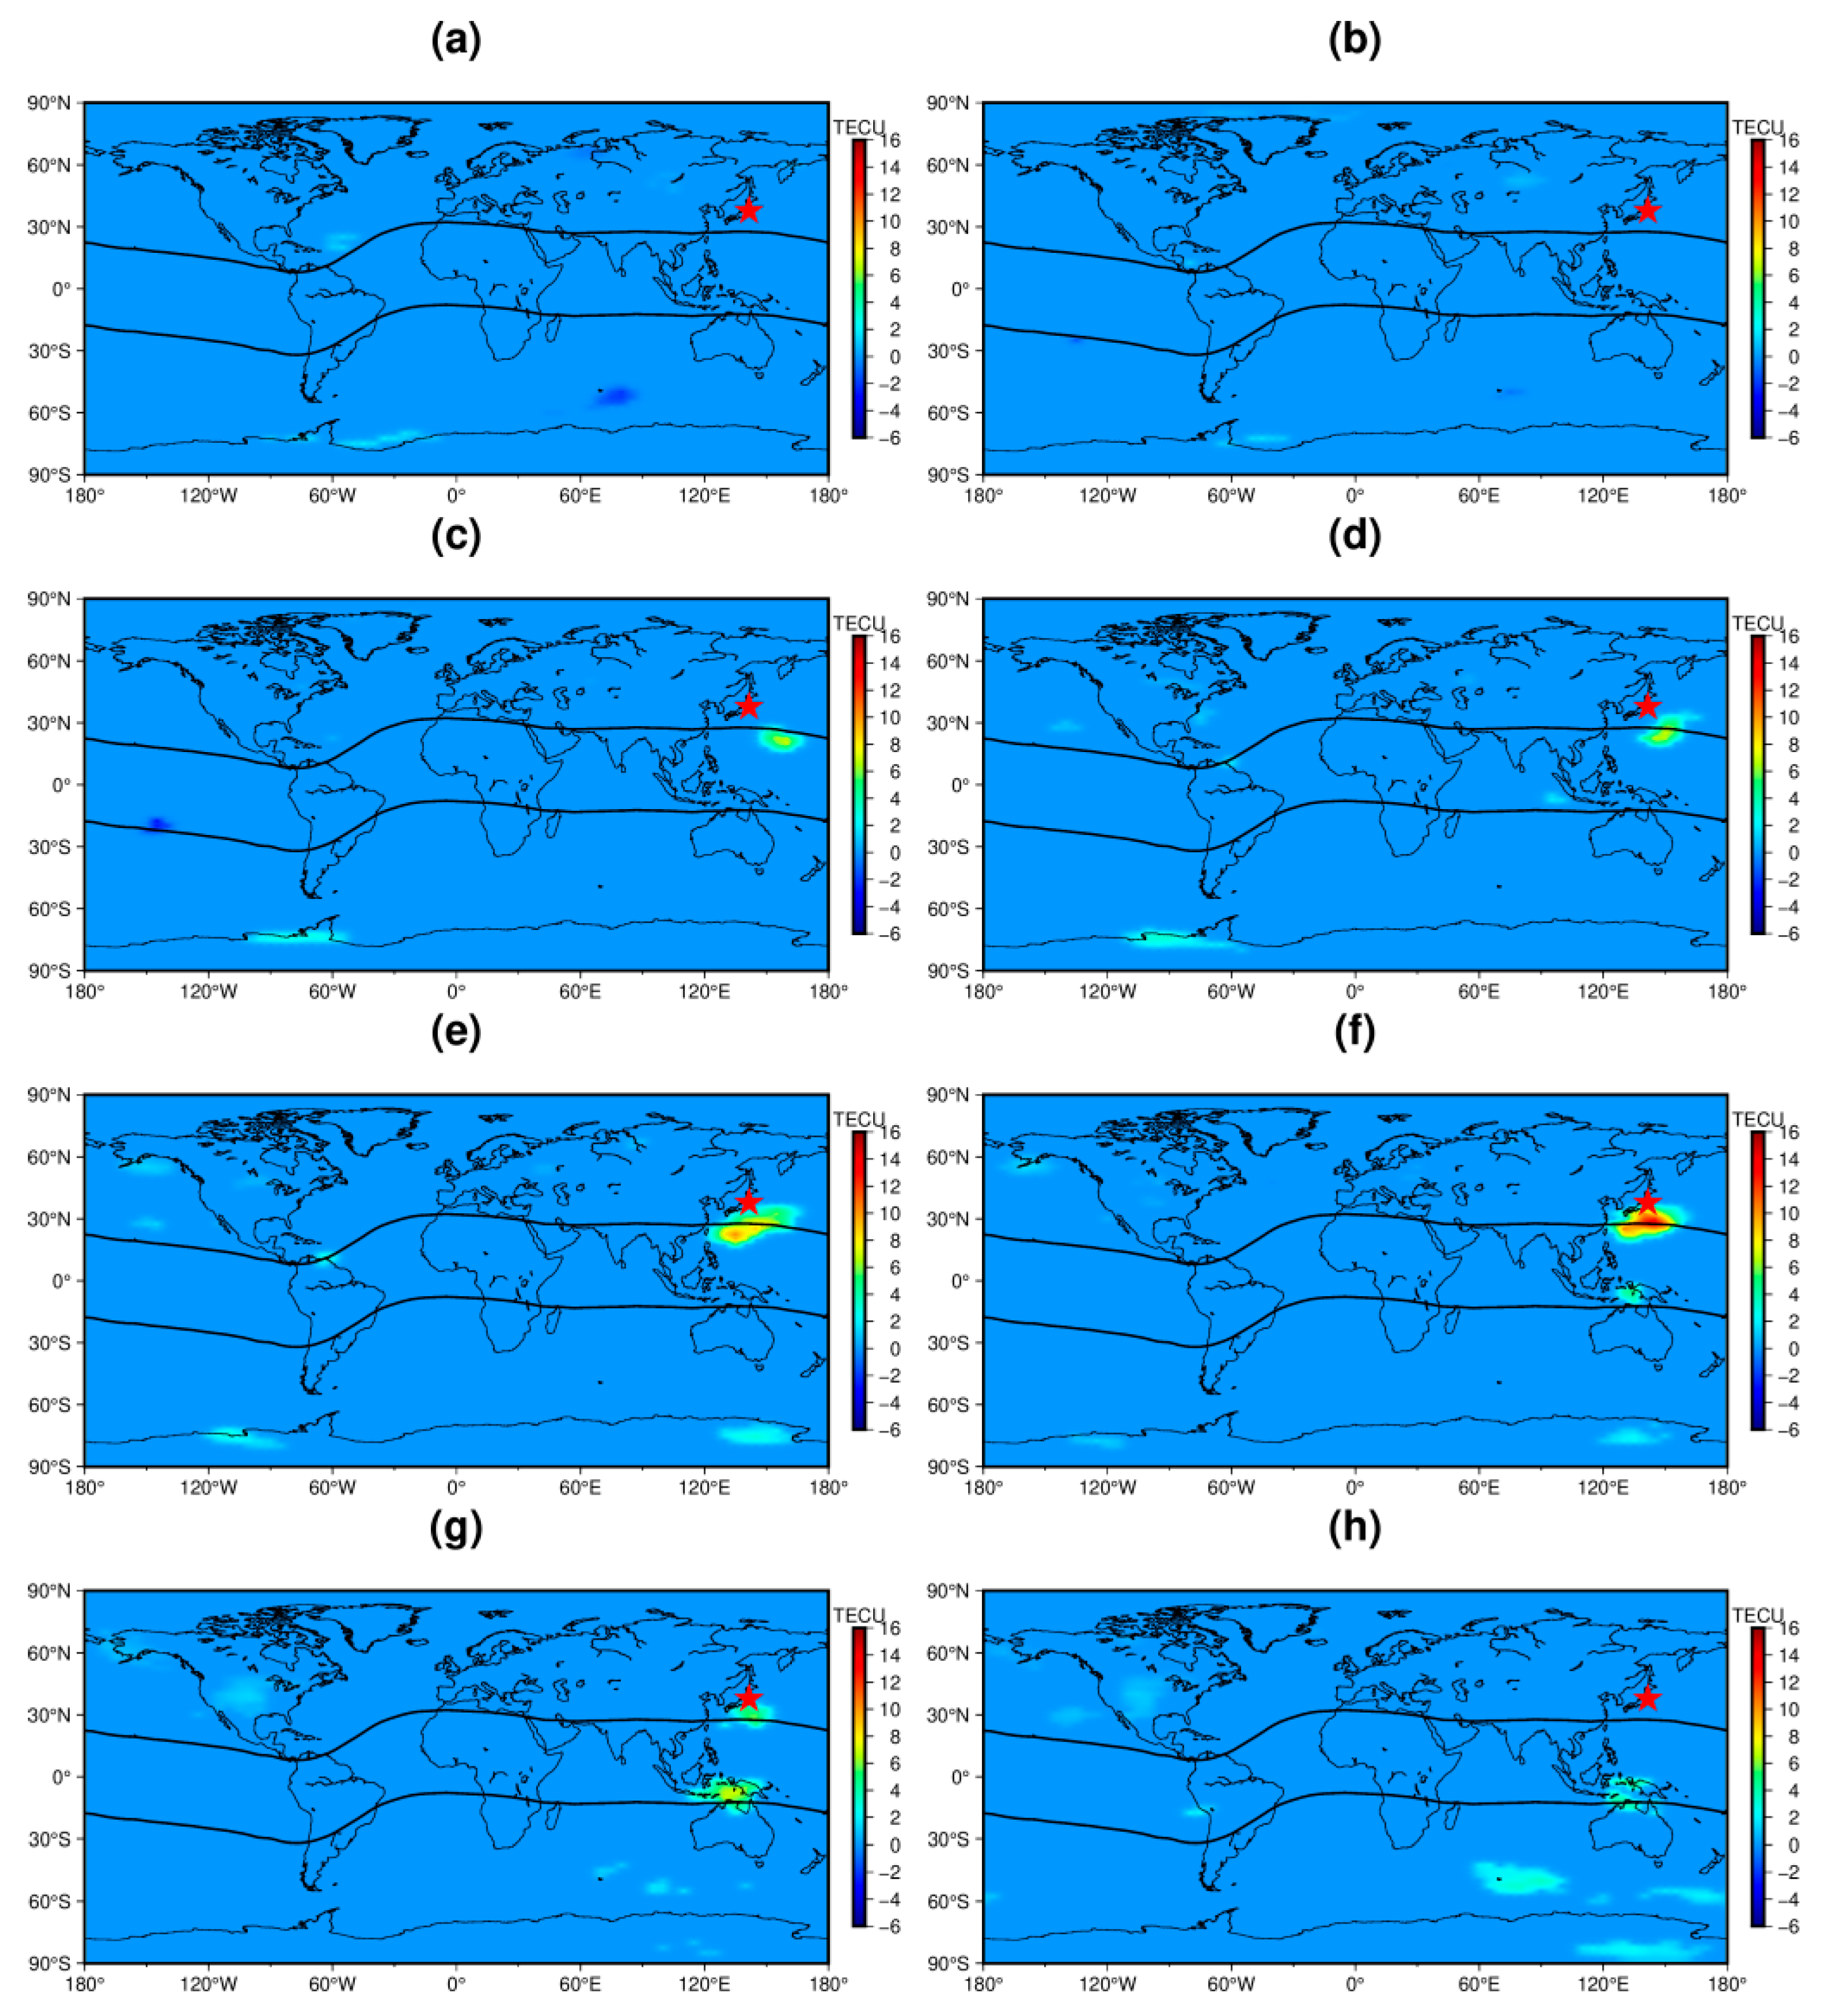
Figure 13 shows the global TEC anomaly between UTC 00:00 and UTC 07:00 on 15 February 2022. As shown in Figure 13, global ionospheric activity is relatively stable from UTC 00:00 to UTC 01:00, with an amplitude anomaly of 6TECU southeast of the epicenter at UTC 02:00. The anomalous region expanded gradually and shifted westward with time, approaching the vicinity of the epicenter. The TEC anomaly amplitude reached a maximum of 14TECU at UTC 5:00. Simultaneously, corresponding TEC irregularities were observed in the magnetic conjugate area, but their amplitude and extent were relatively minor. At UTC 06:00, the TEC anomaly area in the magnetic conjugate region reached its maximum while the TEC anomaly area and amplitude near the epicenter gradually decreased. At UTC 07:00, the TEC anomaly near the epicenter disappeared, and the TEC anomaly in the corresponding magnetic conjugate region gradually decreased until it disappeared. During the TEC anomaly period, TEC in other parts of the world did not show particularly obvious anomalies, and the amplitude was minor. TEC anomalies caused by the space environment usually have different degrees of irregular ionospheric abnormal disturbances over a wide geographical range. Seismic–ionospheric coupling characteristics are evident in TEC anomalies near the epicenter. A variety of phenomena indicate that such anomalies are not caused by solar or geomagnetic activities but by subsequent earthquakes.

4. Discussion

The physical mechanism of the seismo-ionospheric effect has been a key issue in studying ionospheric abnormal disturbances before earthquakes. In many studies, three explanations for the physical mechanism of the seismo-ionospheric effect have been proposed: Before an earthquake, long-period ground oscillations or thermal anomalies can excite acoustic gravity waves, which propagate upward and eventually reach the ionosphere, where a neutral particle flow coupled with ionized plasma can induce fluctuations in ionospheric electron density [3,19,52,53]. These fluctuations propagate and cause fluctuations in the ionosphere, leading to changes in electron density and abnormal ionospheric disturbances. The change in ionospheric conductivity is caused by radon and other carrier gases such as carbon dioxide, hydrogen, methane, and helium escaping to the surface, leading to abnormal ionospheric electron concentrations [54]. These abnormal concentrations cause air ionization, leading to changes in electron density [55]. The Freund model of rock stress [56,57] indicates that a rock under stress activates the forward hole electric load flow to generate current, resulting in the flow of electrons between the ground and bottom of the ionosphere. This model has been verified by experimental measurements [58].
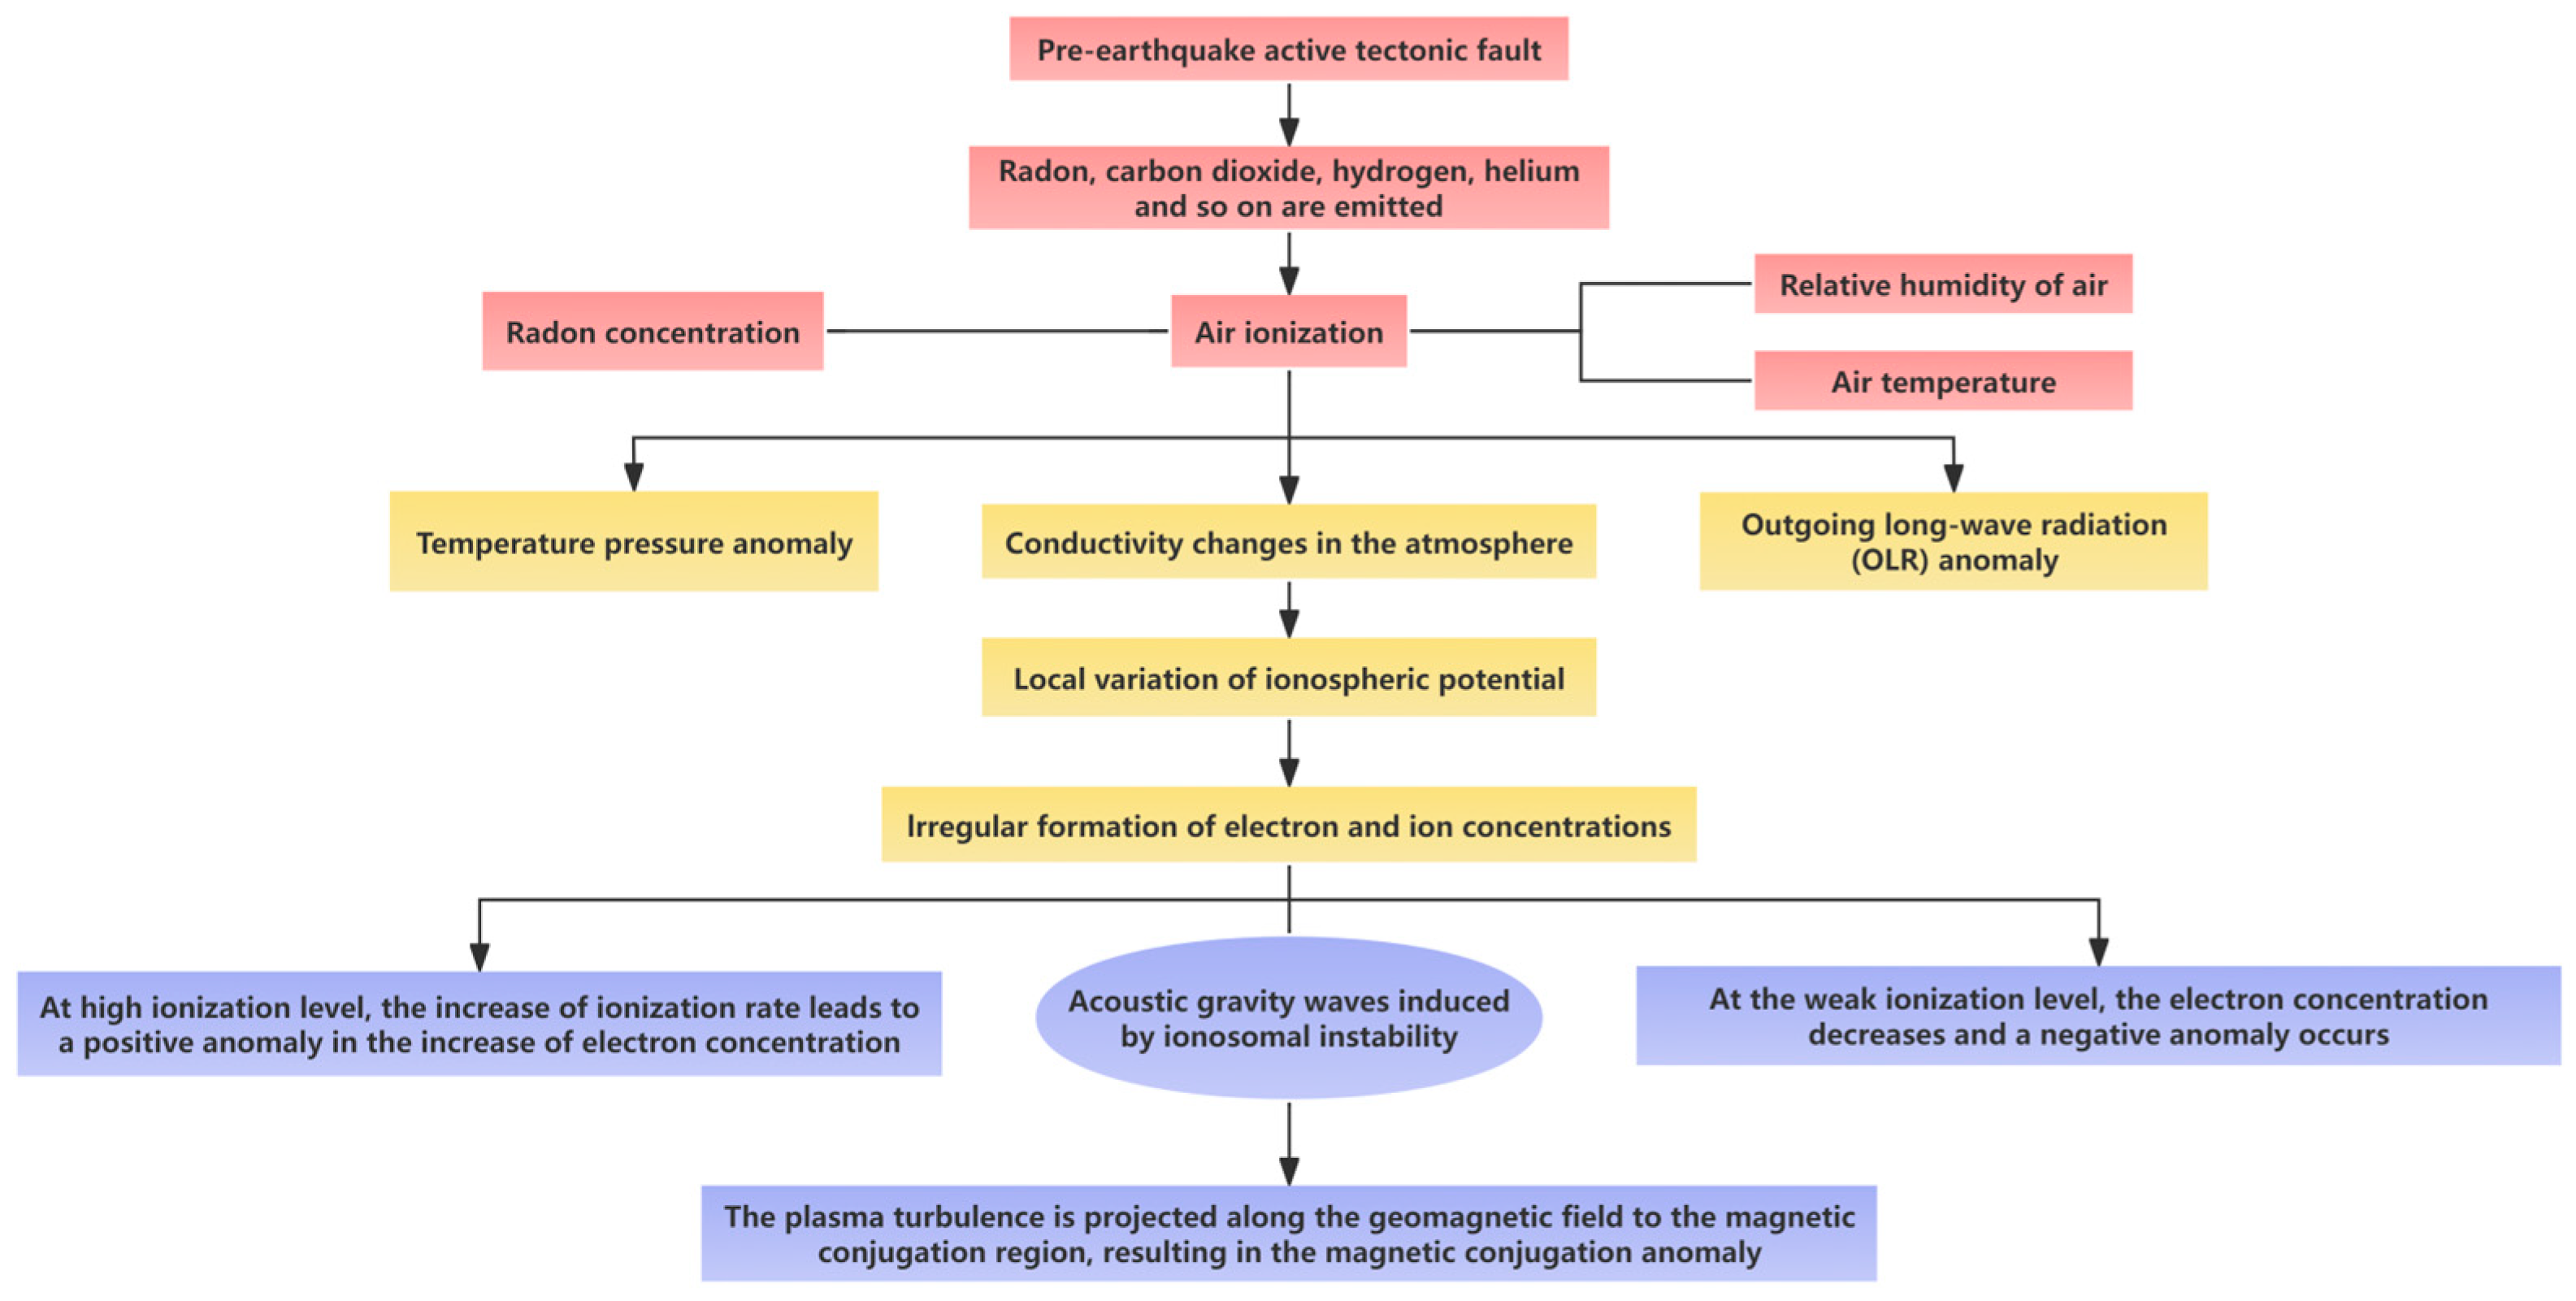
However, the disadvantage of the Freundian model is that it is not effective for earthquakes in high seas, where ionospheric anomalies are known to occur at least as often as terrestrial earthquakes [53]. At present, the lithosphere–atmosphere–ionospheric coupling (LAIC) model is widely used, and its process flowchart is shown in Figure 14. According to theory, the process observed in the ionospheric anomaly of large earthquakes is air ionization caused by an increase in the outflow of crustal gases (such as radon, helium, methane, and carbon dioxide) near the active tectonic fault before the earthquake. This process triggers a reaction from the ground to the ionosphere and the magnetosphere, resulting in changes in air conductivity and accompanied by rising temperatures. Temperature, pressure, and outgoing long-wave radiation (OLR) anomalies redistribute charges in the ionosphere [59], with local changes in ionospheric potential, leading to irregular electron and ion concentrations. In addition to radon concentration, atmospheric ionization is affected by the air temperature (temperature affects the movement speed of gas molecules and determines the probability of collision and ionization), air relative humidity (the water molecule concentration determines the size of newly formed ions), etc. Therefore, at high ionization levels, large heavy-ion clusters are easily formed at the atmospheric boundary above the seismogenic region before strong earthquakes. This process leads to higher ionization rates (with larger collision cross-sections) and increases electron concentrations in the atmosphere, resulting in positive ionospheric anomalies. In addition, light-ion aggregation occurs in the atmosphere at weak ionization levels in the early stages of ionization. This process decreases the electron concentration at the boundary and causes a negative ionospheric anomaly. Ionization instability leads to higher ion temperatures and increases acoustic gravity wave generation. In turn, plasma turbulence projects along the high conductivity of the geomagnetic field to the magnetic conjugation region, forming an anomaly.

5. Conclusions

In this study, the ionospheric anomalies of 20 Mw ≥ 6.5 earthquakes in Japan from 2011 to 2022 were studied and analyzed. The influence of solar activity on ionospheric TEC was quantitatively analyzed via the wavelet analysis method. The global wavelet power spectrum was used to detect TEC changes affected by solar activity over a period of 27 days in the global time domain. Subsequently, the solar and geomagnetic data of the selected earthquakes were processed via the sliding quartile method based on the 27-day window value. Periods of solar and geomagnetic activity were removed from the TEC anomaly period to exclude the possibility of solar and geomagnetic activities interfering with ionospheric abnormal changes. All TEC outliers from 30 days before the earthquake to 2 days after the earthquake were obtained, proving that abnormal TEC changes that exclude solar and geomagnetic activities may be caused by earthquakes. Through statistical analyses of the selected earthquakes, except for individual earthquakes, it was determined that the overall TEC anomaly amplitude is positively correlated with earthquake magnitude to a certain extent. The TEC anomaly duration tends to follow an increase in magnitude, but the relationship is not linear. Statistics show that 65% of earthquakes exhibit TEC anomalies before the earthquake, and some earthquakes exhibit multiple anomalies before the earthquake.
It is worth noting that TEC anomaly disturbance was also found on the 29th day before the 20th earthquake (15 February 2022), which is inconsistent with previous studies. Analysis of solar and geomagnetic activities showed that they were not significantly affected by solar activities at the time of TEC anomaly disturbances that day. Moreover, the geomagnetic environment is relatively calm on a global scale. Therefore, this disturbance is not due to solar or geomagnetic influences. The VTECmap observed global changes at the time the anomaly occurred, but no obvious regular TEC anomalies appeared in other regions of the world at that time. Seismic–ionospheric effects were also observed over the epicenter, and TEC anomalies appeared in the magnetic conjugate region corresponding to the epicenter. The subsequent analysis of the lithosphere–atmosphere–ionospheric coupling (LAIC) model confirms that this phenomenon is a characteristic of seismo-ionospheric coupling, thus proving that the ionospheric anomaly (15 February 2022) may be related to the earthquake.

Author Contributions

Z.L. and Z.T. designed the study and performed the experiments; Z.L. and Z.T. wrote the draft of the manuscript; L.C. supervised the research and revised the manuscript. All authors have read and agreed to the published version of the manuscript.

Funding

This research was funded by the State Key Laboratory of Geo-Information Engineering (NO. SKLGIE2023-M-1-1), Key Research Projects of Higher Education Institutions of Henan Provincial Education Department (NO. 24A420002), and Joint Fund of Collaborative Innovation Center of Geo-Information Technology for Smart Central Plains, Henan Province, and Key Laboratory of Spatiotemporal Perception and Intelligent Processing, Ministry of Natural Resources (NO. 232101).

Institutional Review Board Statement

Not applicable.

Informed Consent Statement

Not applicable.

Data Availability Statement

Sun and geomagnetic activity data were obtained from NASA’s space physical facilities (SPDF) (https://spdf.gsfc.nasa.gov/index.html (accessed on 27 January 2024) and the Solar Influences Data Analysis Center at the Royal Observatory of Belgium (https://www.sidc.be/ (accessed on 27 January 2024). TEC data were obtained from The Center for Orbit Determination in Europe (CODE) (https://www.aiub.unibe.ch/services/index_eng.html (accessed on 27 January 2024).

Acknowledgments

We are grateful to NASA’s Space Physics Data Facility (SPDF) and the Solar Influences Data Analysis Center at the Royal Observatory of Belgium for providing solar and geomagnetic activity data. We thank The Center for Orbit Determination in Europe (CODE) for providing TEC data.

Conflicts of Interest

The author declares no conflicts of interest.

References

  1. Davies, K.; Baker, D.M. Ionospheric effects observed around the time of the Alaskan earthquake of 28 March 1964. J. Geophys. Res. 1965, 70, 2251–2253. [Google Scholar] [CrossRef]
  2. Zhao, B.; Wang, M.; Yu, T.; Wan, W.; Lei, J.; Liu, L.; Ning, B. Is an unusual large enhancement of ionospheric electron density linked with the 2008 great wenchuan earthquake? J. Geophys. Res. Space Phys. 2008, 113, 148–227. [Google Scholar] [CrossRef]
  3. Li, J.; Meng, G.; You, X.; Zhang, R.; Shi, H.; Han, Y. Ionospheric total electron content disturbance associated with 12 May 2008, Wenchuan earthquake. Geod. Geodyn. 2015, 6, 126–134. [Google Scholar] [CrossRef]
  4. Liu, J.Y.; Tsai, Y.B.; Chen, S.W.; Lee, C.P.; Chen, Y.C.; Yen, H.Y.; Chang, W.Y.; Liu, C. Giant ionospheric disturbances excited by the M9.3 Sumatra earthquake of 26 December 2004. Geophys. Res. Lett. 2006, 33, 356–360. [Google Scholar] [CrossRef]
  5. Shah, M.; Jin, S. Pre-seismic ionospheric anomalies of the 2013 Mw = 7.7 Pakistan earthquake from GPS and COSMIC observations. J. Geod. Geodyn. 2018, 9, 378–387. [Google Scholar] [CrossRef]
  6. Li, Z.; Yang, B.; Huang, J.; Yin, H.; Yang, X.; Liu, H.; Zhang, H.; Lu, H. Analysis of Pre-Earthquake Space Electric Field Disturbance Observed by CSES. Atmosphere 2022, 13, 934. [Google Scholar] [CrossRef]
  7. Xu, T.; Hu, Y.L.; Wu, J.; Li, C.B.; Wu, Z.S.; Suo, Y.C.; Feng, J. Statistical analysis of seismo-ionospheric perturbation before 14 Ms ≥ 7.0 strong earthquakes in Chinese subcontinent. Chin. J. Radio Sci. 2012, 27, 507–512. [Google Scholar]
  8. Heki, K. Ionospheric disturbances related to earthquakes. Ionos. Dyn. App. 2021, 511–526. [Google Scholar] [CrossRef]
  9. Ulukavak, M.; Yalçınkaya, M.; Kayıkçı, E.T.; Öztürk, S.; Kandemir, R.; Karslı, H. Analysis of ionospheric TEC anomalies for global earthquakes during 2000–2019 with respect to earthquake magnitude (Mw ≥ 6.0). J. Geodyn. 2020, 135, 101721. [Google Scholar] [CrossRef]
  10. Saqib, M.; Şentürk, E.; Sahu, S.A.; Adil, M.A. Ionospheric anomalies detection using autoregressive integrated moving average (ARIMA) model as an earthquake precursor. Acta Geophys. 2021, 69, 1493–1507. [Google Scholar] [CrossRef]
  11. Pulinets, S.; Ouzounov, D. Lithosphere–Atmosphere–Ionosphere Coupling (LAIC) model—An unified concept for earthquake precursors validation. J. Asian Earth Sci. 2011, 41, 371–382. [Google Scholar] [CrossRef]
  12. Freund, F. Pre-earthquake signals: Underlying physical processes. J. Asian Earth Sci. 2011, 41, 383–400. [Google Scholar] [CrossRef]
  13. Freund, F. Earthquake forewarning—A multidisciplinary challenge from the ground up to space. Acta Geophys. 2013, 61, 775–807. [Google Scholar] [CrossRef]
  14. Freund, F. Toward a unified solid state theory for pre-earthquake signals. Acta Geophys. 2010, 58, 719–766. [Google Scholar] [CrossRef]
  15. Ouzounov, D.; Pulinets, S.; Romanov, A.; Romanov, A.; Tsybulya, K.; Davidenko, D.; Kafatos, M.; Taylor, P. Atmosphere-ionosphere response to the M 9 Tohoku earthquake revealed by multi-instrument space-borne and ground observations: Preliminary results. Earthq. Sci. 2011, 24, 557–564. [Google Scholar] [CrossRef]
  16. Ouzounov, D.; Pulinets, S.; Davidenko, D.; Rozhnoi, A.; Solovieva, M.; Fedun, V.; Dwivedi, B.N.; Rybin, A.; Kafatos, M.; Taylor, P. Transient effects in atmosphere and ionosphere preceding the 2015 M7.8 and M7.3 Gorkha–Nepal earthquakes. Front. Earth Sci. 2021, 9, 757358. [Google Scholar] [CrossRef]
  17. Pulinets, S.A. Physical mechanism of the vertical electric field generation over active tectonic faults. Adv. Space Res. 2009, 44, 767–773. [Google Scholar] [CrossRef]
  18. Pulinets, S.; Khachikyan, G. The Global electric circuit and global seismicity. Geosciences 2021, 11, 491. [Google Scholar] [CrossRef]
  19. Parrot, M.; Tramutoli, V.; Liu, T.J.; Pulinets, S.; Ouzounov, D.; Genzano, N.; Lisi, M.; Namgaladze, A. Atmospheric and ionospheric coupling phenomena associated with large earthquakes. Eur. Phys. J. Spec. Top. 2021, 230, 197–225. [Google Scholar] [CrossRef]
  20. Thomas, E.G.; Baker, J.B.H.; Ruohoniemi, J.M.; Coster, A.J.; Zhang, S.R. The geomagnetic storm time response of GPS total electron content in the North American sector. J. Geophys. Res. Space Phys. 2016, 121, 1744–1759. [Google Scholar] [CrossRef]
  21. Afraimovich, E.L.; Astafyeva, E.I.; Oinats, A.V.; Yasukevich, Y.V.; Zhivetiev, I.V. Global electron content: A new conception to track solar activity. In Annales Geophysicae; Copernicus Publications: Göttingen, Germany, 2008; Volume 26, pp. 335–344. [Google Scholar]
  22. Liu, J.Y.; Chen, Y.I.; Chen, C.H.; Liu, C.Y.; Chen, C.Y.; Nishihashi, M.; Li, J.Z.; Xia, Y.Q.; Oyama, K.; Hattori, K.; et al. Seismoionospheric GPS total electron content anomalies observed before the 12 May 2008 Mw7.9 Wenchuan earthquake. J. Geophys. Res. Space Phys. 2009, 114, 023–033. [Google Scholar] [CrossRef]
  23. Chen, H.; Han, P.; Hattori, K. Recent advances and challenges in the seismo-electromagnetic study: A brief review. Remote Sens. 2002, 14, 5893. [Google Scholar] [CrossRef]
  24. Guo, Y.; Zhang, X.; Liu, J.; Yang, M.; Yang, X.; Du, X.; Lu, J.; Xiao, J. Seismo-Ionospheric Effects Prior to Two Earthquakes in Taiwan Detected by the China Seismo-Electromagnetic Satellite. Atmosphere 2022, 13, 1523. [Google Scholar] [CrossRef]
  25. Chang, H.; Kil, H.; Sun, A.K.; Zhang, S.R.; Lee, J. Ionospheric disturbances in low-and midlatitudes during the geomagnetic storm on 26 August 2018. J. Geophys. Res. Space Phys. 2022, 127, 2. [Google Scholar] [CrossRef]
  26. Akahashi, H.; Wrasse, C.M.; Figueiredo, C.A.O.B.; Barros, D.; Abdu, M.A.; Otsuka, Y.; Shiokawa, K. Equatorial plasma bubble seeding by MSTIDs in the ionosphere. Prog. Earth Planet. Sci. 2018, 5, 32. [Google Scholar] [CrossRef]
  27. Pimenta, A.A.; Sahai, Y.; Bittencourt, J.A.; Abdu, M.A.; Takahashi, H.; Taylor, M.J. Plasma blobs observed by ground-based optical and radio techniques in the Brazilian tropical sector. Geophys. Res. Lett. 2004, 31, 12. [Google Scholar] [CrossRef]
  28. Pimenta, A.A.; Sahai, Y.; Bittencourt, J.A.; Rich, F.J. Ionospheric plasma blobs observed by OI 630 nm all-sky imaging in the Brazilian tropical sector during the major geomagnetic storm of 6–7 April 2000. Geophys. Res. Lett. 2007, 34, 1–5. [Google Scholar] [CrossRef]
  29. Miller, E.S.; Kil, H.; Makela, J.J.; Heelis, R.A.; Talaat, E.R.; Gross, A. Topside signature of medium-scale traveling ionospheric disturbances. Ann. Geophys. 2014, 32, 959–965. [Google Scholar] [CrossRef]
  30. Kil, H.; Paxton, L.J.; Jee, G.; Nikoukar, R. Plasma Blobs Associated with Medium-Scale Traveling Ionospheric Disturbances. Geophys. Res. Lett. 2019, 46, 3575–3581. [Google Scholar] [CrossRef]
  31. Wang, Z.; Liu, H.; Shi, J.; Wang, G.; Wang, X. Plasma Blobs Concurrently Observed with Bubbles in the Asian-Oceanian Sector During Solar Maximum. J. Geophys. Res. Space Phys. 2019, 124, 7062–7071. [Google Scholar] [CrossRef]
  32. Kil, H.; Lee, W.K.; Paxton, L.J. Origin and distribution of daytime electron density irregularities in the low-latitude Fregion. J. Geophys. Res. Space Phys. 2020, 125, 9. [Google Scholar] [CrossRef] [PubMed]
  33. Lee, W.K.; Kil, H.; Paxton, L.J. Global distribution of nighttime MSTIDs and its association with E region irregularities seen by CHAMP satellite. J. Geophys. Res. Space Phys. 2021, 126, 5. [Google Scholar] [CrossRef]
  34. Aa, E.; Zou, S.; Liu, S. Statistical analysis of equatorial plasma irregularities retrieved from Swarm 2013–2019 observations. J. Geophys. Res. Space Phys. 2020, 125, 4. [Google Scholar] [CrossRef]
  35. Huang, C.S. Continuous penetration of the interplanetary electric field to the equatorial ionosphere over eight hours during intense geomagnetic storms. J. Geophys. Res. Space Phys. 2008, 113, A11. [Google Scholar] [CrossRef]
  36. Cowling, D.H.; Webb, D.; Yeh, K.C. Group Rays of Internal Gravity Waves in a Wind-Stratified Atmosphere. J. Geophys. Res. 1971, 76, 213–220. [Google Scholar] [CrossRef]
  37. Vasseur, G. Dynamics of the F-region observed with Thomson scatter. J. Atmos. Terr. Phys. 1969, 31, 397–420. [Google Scholar] [CrossRef]
  38. Jonah, O.F.; Zhang, S.; Coster, A.J.; Goncharenko, L.P.; Erickson, P.J.; Rideout, W.; Eurico, R.; de Jesus, R. Understanding inter-hemispheric traveling ionospheric disturbances and their mechanisms. Remote Sens. 2020, 12, 228. [Google Scholar] [CrossRef]
  39. Frissell, N.A.; Baker, J.B.H.; Ruohoniemi, J.M.; Gerrard, A.J.; Miller, E.S.; Marini, J.P.; West, M.L.; Bristow, W.A. Climatology of medium-scale traveling ionospheric disturbances observed by the midlatitude Blackstone SuperDARN radar. J. Geophys. Res. Space Phys. 2014, 119, 7679–7697. [Google Scholar] [CrossRef]
  40. Zhang, Y.B.; Wu, J.; Guo, L.X.; Hu, Y.L.; Zhao, H.S.; Xu, T. Influence of solar and geomagnetic activity on sporadic-E layer over low, mid and high latitude stations. Adv. Space Res. 2015, 55, 1366–1371. [Google Scholar] [CrossRef]
  41. Zhou, C.; Tang, Q.; Song, X.X.; Qing, H.Y.; Liu, Y.; Wang, X.; Gu, X.D.; Ni, B.B.; Zhao, Z.Y. A statistical analysis of sporadic E layer occurrence in the midlatitude China region. J. Geophys. Res. 2017, 122, 3617–3631. [Google Scholar] [CrossRef]
  42. Zhou, C.; Tang, Q.; Huang, F.Q.; Liu, Y.; Gu, X.D.; Lei, J.H.; Ni, B.B.; Zhao, Z.Y. The simultaneous observations of nighttime ionospheric E region irregularities and F region medium-scale traveling ionospheric disturbances in midlatitude China. J. Geophys. Res. 2018, 123, 5195–5209. [Google Scholar] [CrossRef]
  43. Liu, Y.; Zhou, C.; Xu, T.; Wang, Z.K.; Tang, Q.; Deng, Z.X.; Chen, G.Y. Investigation of midlatitude nighttime ionospheric E-F coupling and interhemispheric coupling by using COSMIC GPS radio occultation measurements. J. Geophys. Res. 2020, 125, 3. [Google Scholar] [CrossRef]
  44. Mošna, Z.; Edemskiy, I.; Laštovička, J.; Kozubek, M.; Koucká; Knížová, P.; Kouba, D.; Siddiqui, T.A. Observation of the ionosphere in middle latitudes during 2009, 2018 and 2018/2019 sudden stratospheric warming events. Atmosphere 2021, 12, 602. [Google Scholar] [CrossRef]
  45. Pedatella, N.M. Impact of the lower atmosphere on the ionosphere response to a geomagnetic superstorm. Geophys. Res. Lett. 2016, 43, 9383–9389. [Google Scholar] [CrossRef]
  46. Zhu, F.; Zhou, Y.; Lin, J.; Su, F. A statistical study on the temporal distribution of ionospheric TEC anomalies prior to M7.0+ earthquakes during 2003–2012. Astrophys. Space Sci. 2014, 350, 449–457. [Google Scholar] [CrossRef]
  47. Zhu, F.; Wu, Y.; Zhou, Y.; Gao, Y. Temporal and spatial distribution of GPS-TEC anomalies prior to the strong earthquakes. Astrophys. Space Sci. 2013, 345, 239–246. [Google Scholar] [CrossRef]
  48. Poniatowski, M.; Nykiel, G.; Borries, C.; Szmytkowski, J. Patio-temporal validation of GNSS-derived global ionosphere maps using 16 years of jason satellites observations. Remote Sens. 2023, 15, 5053. [Google Scholar] [CrossRef]
  49. Collado-Villaverde, A.; Muñoz, P.; Cid, C. Classifying and bounding geomagnetic storms based on the SYM-H and ASY-H indices. Nat. Hazard. 2023, 120, 1141–1162. [Google Scholar] [CrossRef]
  50. Li, W.; Guo, J.; Yu, X.; Yu, H.; Chang, X.J. Analysis of spatiotemporal variations in the ionosphere detected by gps. Geomat. Sci. Technol. 2014, 31, 561–565. [Google Scholar]
  51. Shama, A. Spectrum compatible earthquake ground motions by morlet wavelet. In Proceedings of the 20th Analysis and Computation Specialty Conference, Chicago, IL, USA, 29–31 March 2012; Volume 2012, pp. 163–172. [Google Scholar]
  52. Kamogawa, M. Preseismic lithosphere-atmosphere-ionosphere coupling. Eos Trans. Am. Geophys. 2006, 87, 417–424. [Google Scholar] [CrossRef]
  53. Harrison, R.G.; Aplin, K.L.; Rycroft, M.J. Atmospheric electricity coupling between earthquake regions and the ionosphere. J. Atmos. Sol. Terr. Phys. 2010, 72, 376–381. [Google Scholar] [CrossRef]
  54. Rapoport, Y.; Grimalsky, V.; Hayakawa, M.; Ivchenko, V.; Juarez-R, D.; Koshevaya, S.; Gotynyan, O. Change of ionospheric plasma parameters under the influence of electric field which has lithospheric origin and due to radon emanation. Phys. Chem. Earth 2004, 29, 579–587. [Google Scholar] [CrossRef]
  55. Surkov, V.V.; Pilipenko, V.A. Estimate of ULF electromagnetic noise caused by a fluid flow during seismic or volcano activity. Ann. Geophys. 2014, 58, S0655. [Google Scholar]
  56. Scoville, J.; Sornette, J.; Freund, F.T. Paradox of Peroxy Defects and Positive Holes in Rocks Part II: Outflow of Electric Currents from Stressed Rocks. J. Asian Earth Sci. 2015, 114, 338–351. [Google Scholar] [CrossRef]
  57. Roger, F.; Jolivet, M.; Malavieille, J. The tectonic evolution of the Songpan-Garzê (North Tibet) and adjacent areas from Proterozoic to Present: A synthesis. J. Asian Earth Sci. 2010, 39, 254–269. [Google Scholar] [CrossRef]
  58. Liu, J.Y.; Chi-Kuang, C. An observing system simulation experiment for FORMOSAT-5/AIP detecting seismo-ionospheric precursors. Tao Terr. Atmos. Ocean. Sci. 2007, 28, 117–127. [Google Scholar] [CrossRef]
  59. Pulinets, S. Low-latitude atmosphere-ionosphere effects initiated by strong earthquakes preparation process. Geophys. J. Int. 2012, 2012, 131842. [Google Scholar] [CrossRef]
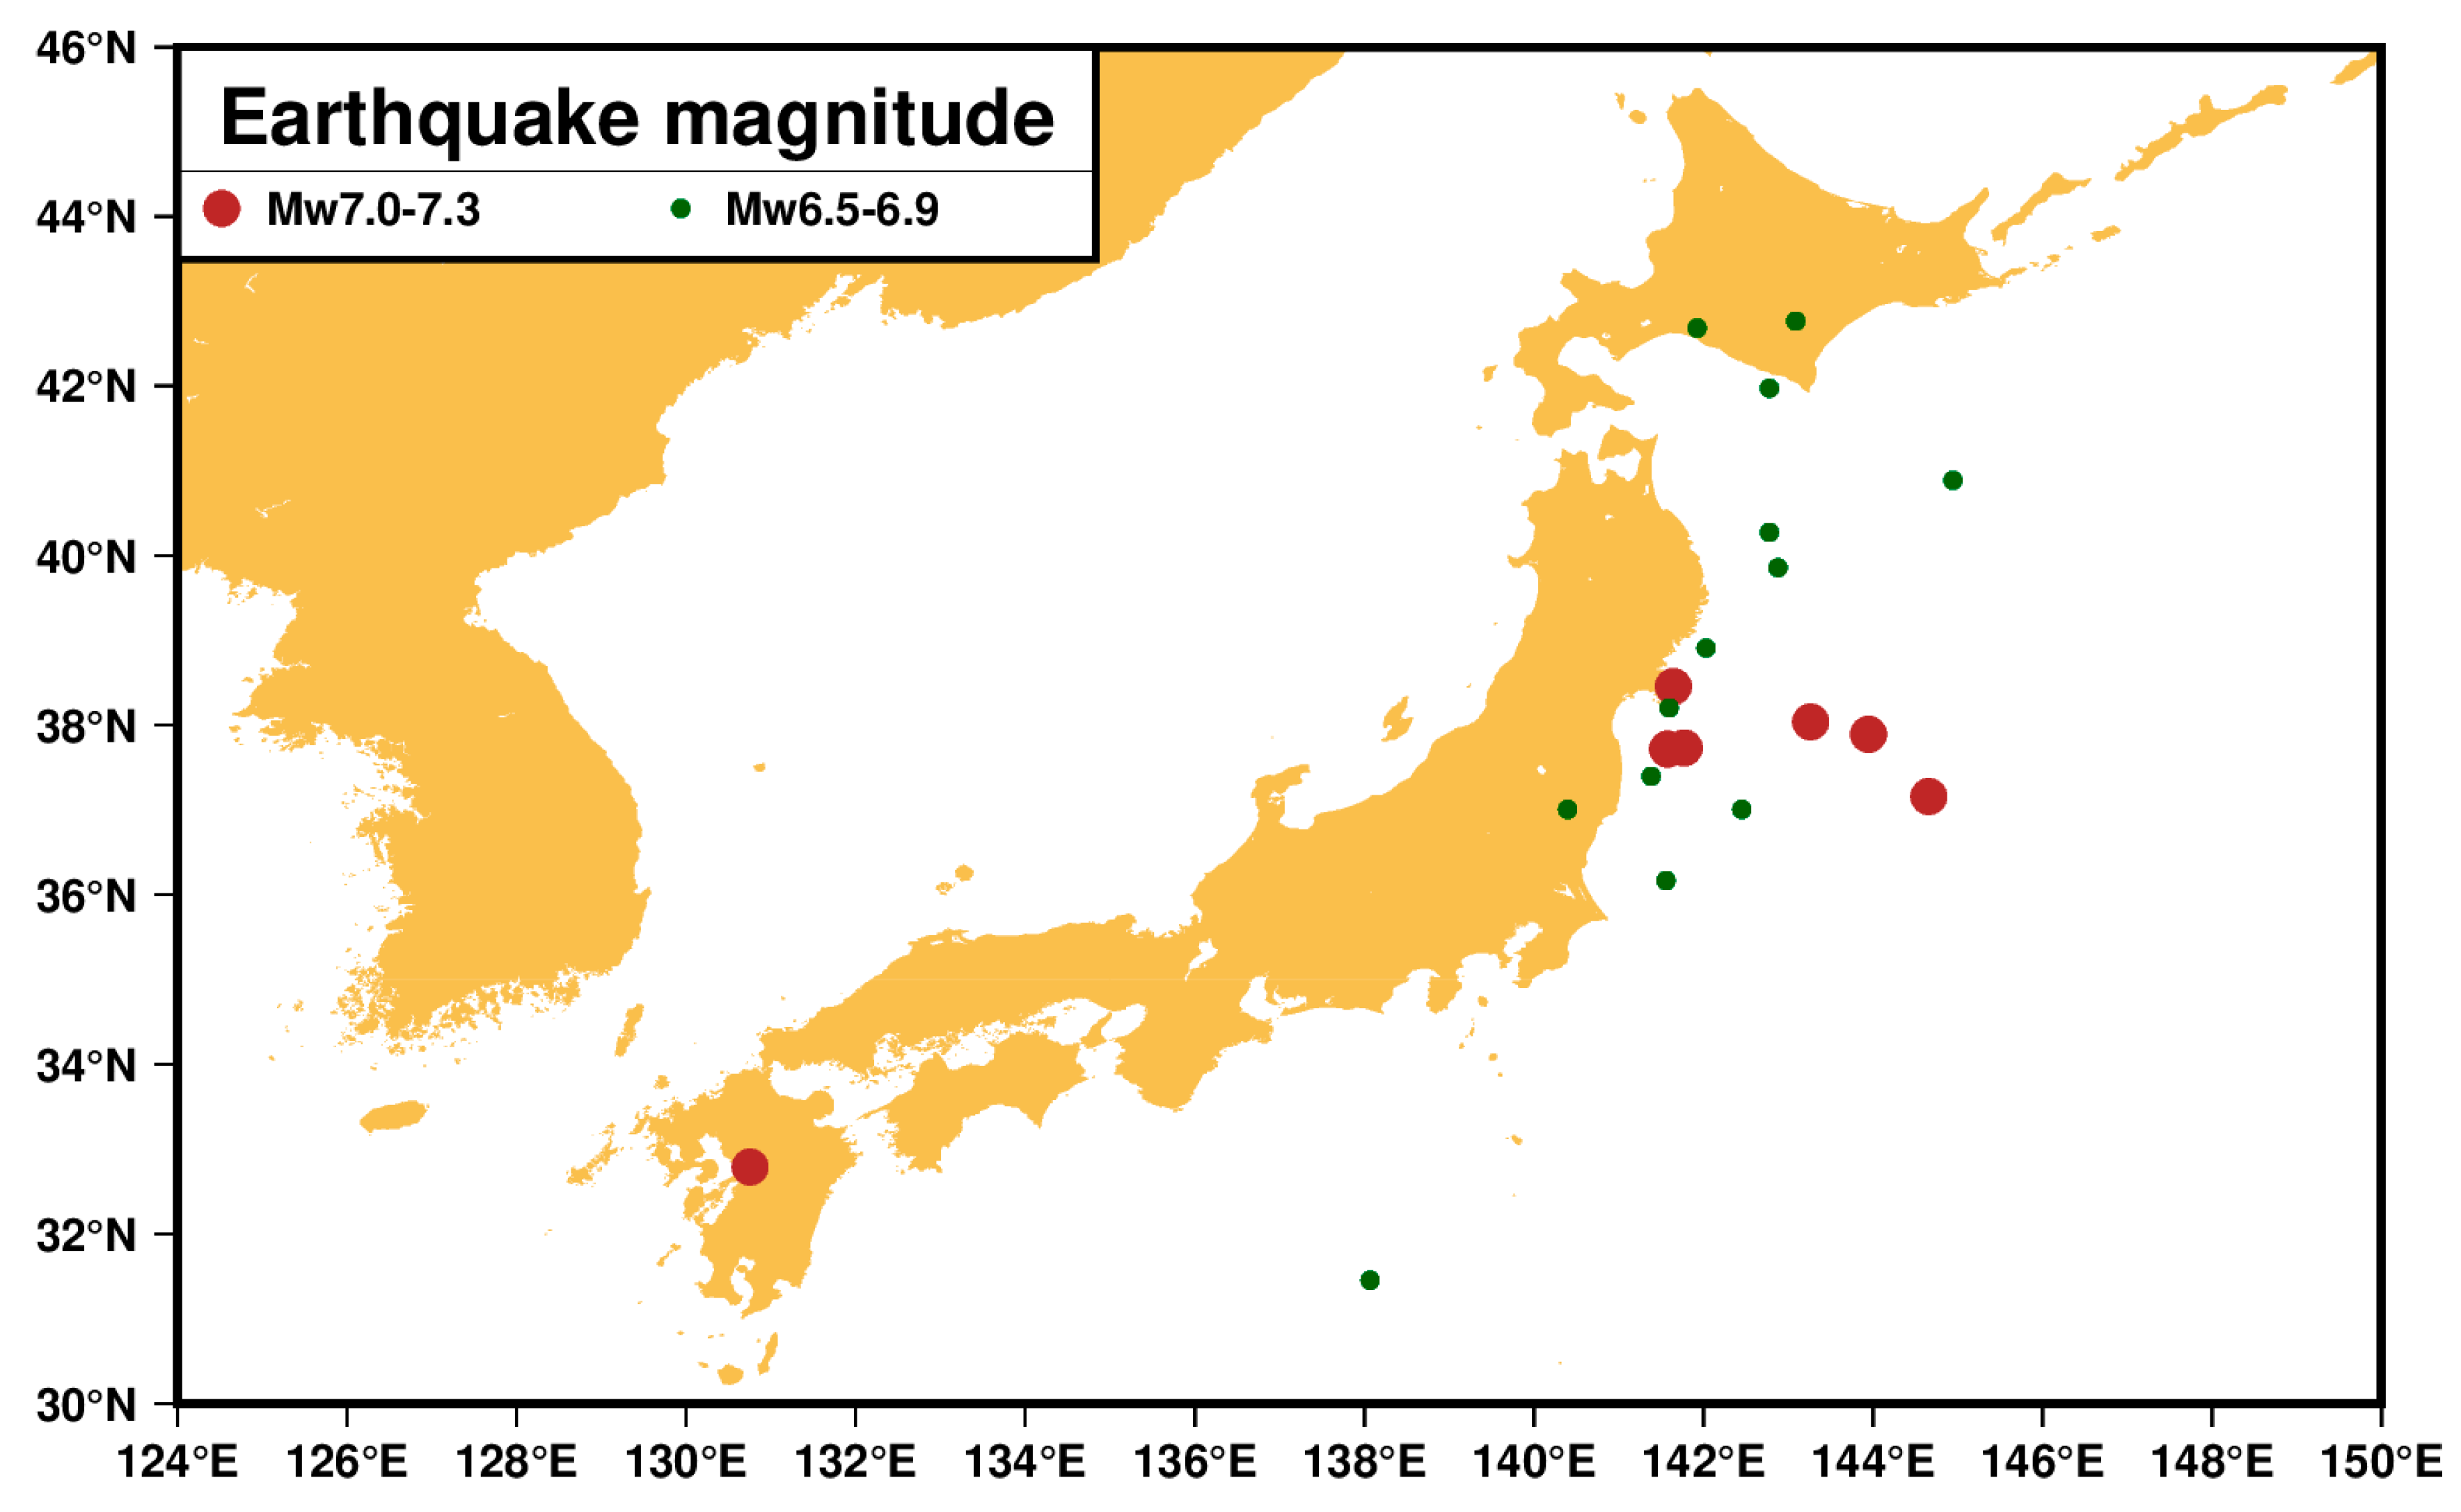
Figure 1. Geographical distribution of 20 earthquakes in Japan from 2011 to 2022. The red dots represent the epicenter of Mw7.0–7.3 earthquakes, and the green dots represent the epicenter of Mw6.5–6.9 earthquakes.
Atmosphere 15 00887 g001
Figure 2. TEC periodic spectrum analysis in 2005. (a) TEC time series; (b) TEC Morlet wavelet analysis power spectrum; (c) TEC overall periodic spectrum (The dashed blue line represents the 95% significance test curve).
Atmosphere 15 00887 g002
Figure 3. Sunspot (SSN) changes for Mw6.5+ earthquakes in Japan from 2011 to 2022.
Atmosphere 15 00887 g003
Figure 4. Changes in 10.7 cm radio flux (F10.7) for Mw6.5+ earthquakes in Japan from 2011 to 2022.
Atmosphere 15 00887 g004
Figure 5. Changes in total solar radiation (TSI) for Mw6.5+ earthquakes in Japan from 2011 to 2022.
Atmosphere 15 00887 g005
Figure 6. Variation in solar wind velocity (Vsw) for Mw6.5+ earthquakes in Japan from 2011 to 2022.
Atmosphere 15 00887 g006
Figure 7. Changes in the global geomagnetic activity index (KP) of Mw6.5+ earthquakes in Japan from 2011 to 2022.
Atmosphere 15 00887 g007
Figure 8. Changes in the geomagnetic activity index of the equatorial region (DST) of Mw6.5 + earthquakes in Japan from 2011 to 2022 (The red and blue areas respectively indicate positive and negative anomalies).
Atmosphere 15 00887 g008
Figure 9. TEC changes in Mw6.5+ earthquakes in Japan from 2011 to 2022 (The red and blue areas respectively indicate positive and negative anomalies. The green areas represent anomalies after excluding geomagnetic and solar activity).
Atmosphere 15 00887 g009
Figure 10. TEC anomaly amplitude at the epicenter before the earthquake. The colors represent earthquake magnitudes, with blue (earthquakes 2, 4, 5, 6, and 7) representing magnitudes 6.5 to 6.7, green (earthquakes 9, 11, 12, and 13) representing magnitudes 6.8–6.9, and red (earthquakes 14, 15, 16, and 20) representing magnitudes 7.0–7.3.
Atmosphere 15 00887 g010
Figure 11. TEC anomaly occurrence time before each earthquake (UTC).
Atmosphere 15 00887 g011
Figure 12. Solar and geomagnetic activity from 14 February to 18 March 2022 (UTC). (a) SSN time series; (b) F10.7 time series; (c) TSI time series; (d) Vsw time series; (e) DST time series; (f) KP time series. The thick green line represents the time when the earthquake occurred, and the thin green line represents the time when the ionospheric anomaly occurred.
Atmosphere 15 00887 g012
Figure 13. Global ionospheric changes from 00:00 to 7:00 on 15 February 2022; (a) UTC 00:00; (b) UTC 01:00; (c) UTC 02:00; (d) 03:00 UTC; (e) 04:00 UTC; (f) 05:00 UTC; (g) 06:00 UTC; (h) 07:00 UTC. The red five-pointed star represents the sky above the epicenter, and the black curve represents the magnetic equatorial line.
Atmosphere 15 00887 g013
Figure 14. Action flowchart of the lithosphere–atmosphere–ionospheric coupling (LAIC) model.
Atmosphere 15 00887 g014
Table 1. Information for Mw ≥ 6.5 earthquakes in Japan from 2011 to 2022.
Time of Earthquake OccurrenceEarthquake Location
No.YearMonthDayHourMinuteLatitudeLongitudeHypocenter Depth/kmMw
120140711192237.01142.45206.5
220110311081936.17141.5676.5
320180905180842.69141.93356.6
420110411081637.00140.40116.6
520150216230639.86142.88236.7
620160114032541.97142.78466.7
720110916192640.27142.78306.7
820120101052731.46138.073656.8
920150512211238.91142.03356.8
1020120314090840.89144.94126.9
1120130202141742.77143.091076.9
1220161121205937.39141.3996.9
132021050102738.20141.60436.9
1420160415162532.79130.75107
1520210320090938.45141.65437
1620110710075738.03143.26237
1720131025171037.16144.66357.1
1820210213140737.73141.78447.1
1920121207081837.89143.95317.3
2020220316143637.71141.58417.3
Disclaimer/Publisher’s Note: The statements, opinions and data contained in all publications are solely those of the individual author(s) and contributor(s) and not of MDPI and/or the editor(s). MDPI and/or the editor(s) disclaim responsibility for any injury to people or property resulting from any ideas, methods, instructions or products referred to in the content.