Abstract
This study analyzes drought conditions in the Aegean region using monthly precipitation data from nine stations between 1972 and 2020. The Standardized Precipitation Index (SPI) was calculated for 1-, 3-, 6-, 9-, and 12-month periods to evaluate drought conditions at different timescales and station-specific conditions. The results indicate that short-term droughts are more frequent but shorter in duration, while longer periods exhibit fewer but more prolonged droughts. The relative frequency of drought across all periods ranges between 9% and 27%. The İzmir and Denizli stations were highlighted due to their representation of coastal and inner regions, respectively. The findings show that coastal stations, like İzmir, experience more frequent wet years compared to inner stations like Denizli, which have more dry years. Time series linear autoregressive (AR) models, using SPI-12 data, were developed to represent long-term drought trends and forecasts. The best-fitting models were determined using AIC, AICC, FPE, and Var(e) criteria, with AR(2) generally being the most suitable, except for Denizli. This integrated analysis of SPI and AR models provides a robust basis for understanding regional precipitation regimes and predicting future droughts, aiding in the development of effective drought mitigation strategies and water resource management. Future research is anticipated to extend this analysis to encompass all of Turkey and explore various time series models’ applicability.
1. Introduction
Drought, a natural disaster, profoundly impacts living beings, occurring at any time due to a significant decrease or imbalance in local precipitation. Its severity escalates due to the influence of other climatic factors such as elevated temperatures, high wind speeds, and low humidity [1,2,3]. It damages agriculture and vegetation, humans, and wildlife [4,5,6]. Drought can have long-term negative impacts on the environment and water resources. As the severity and intensity of drought increases, impacts ranging from climate conditions and vegetation degradation to human mortality can occur [7]. Drought negatively affects the ecosystem, agriculture, and the environment. To prevent drought, detailed analysis and monitoring of the region is necessary. The Aegean region evaluated in this study has been the subject of many previous studies in the literature.
The future projections of drought characteristics in Greece indicate a significant increase in severity and duration, particularly under the RCP8.5 scenario, as evaluated using the Standardized Precipitation Index and the Standardized Precipitation–Evapotranspiration Index at a high resolution of 5 km [8]. This trend is corroborated by another study projecting a substantial decrease in annual precipitation and an increase in consecutive dry days under both the RCP4.5 and RCP8.5 scenarios [9]. The Mediterranean islands of Mykonos, Naxos, and Kos are experiencing significant increases in mean annual temperatures, which likely exacerbate water scarcity and drought conditions despite stable precipitation trends [10]. Similarly, the Ceyhan River Basin in Turkey has seen variable rainfall patterns and significant warming, leading to severe drought events [11]. In contrast, a Mediterranean oak forest ecosystem study revealed a shift towards wetter conditions, although more intense drought events were observed in the recent decade [12]. The Büyük Menderes Basin in Turkey has also experienced significant drought periods, emphasizing the importance of understanding regional drought patterns for effective water management [13]. Historical trends in the Aegean region of Turkey show significant increases in both temperature and precipitation, necessitating adaptive measures to mitigate climate impacts [14]. Enhanced drought modeling accuracy in this region, using hybrid boost regression models, further supports the need for precise and advanced drought monitoring techniques [15]. The use of ERA5 reanalysis data has proven valuable for assessing spatial variability and trends in drought severity across Greece, highlighting significant regional differences [16]. Finally, spatiotemporal assessments of drought in vulnerable agroecosystems, like those in Thessaly, underscore the critical need for resilience measures in agriculture [17]. Also, recent studies have provided significant insights into hydrological analyses using various probability distributions and parameter estimation methods [18,19,20]. These studies collectively underscore the relevance of using advanced statistical techniques and tailored probability distributions to improve the accuracy and reliability of hydrological analyses, particularly in regions susceptible to significant risks [21,22,23].
Researchers have used different drought severity parameters (e.g., Palmer, Erinch, Standardized Precipitation Indices, De Martonne, or Thornthwaite methods) to describe the interactions between hydrological events and drought. In addition, entropy, trend analysis, and statistical/stochastic evaluations are also used in drought analysis [24]. One of the sets of indices that is commonly used is the Standardized Precipitation Indices (SPIs). The calculation of this is dependent on the amount of precipitation and can be performed by taking into account different time intervals. The frequencies of drought events are consistent, because the SPI is normally distributed [25]. It is important to evaluate the SPI values of annual and monthly time scales.
In the literature, various stochastic models are applied to simulate and forecast the SPI series. Liu et al. [26] utilized the SPI-9 method to assess drought conditions at five monitoring stations across Shandong Province, located within the North China Plain. To address heteroskedasticity in the residuals of the ARMA model, they employed the GARCH model, ultimately combining both models into what they referred to as the ARMA–GARCH model. Rezaiy and Shabri [27] used SPI in 3-, 6-, 9-, 12-month time scales, and the results were analyzed. SPI12 time series was performed using a hybrid Wavelet ARIMA (W-ARIMA) model. Singh and Sharma [28] utilized the SPI to gauge drought severity in India. They applied the ARIMA model to forecast rainfall, assessing its performance against observed data. After comparing several candidate models, ARMA(2,0) emerged as the optimal choice based on maximum likelihood estimation and Mean Squared Error (MSE). The estimated rainfall’s drought severities aligned with those of observed rainfall. Mishra and Desai [29] used linear statistical models to forecast droughts in the Kansabat river of India. Nirmala and Sundaram [30] and Durdu [31] used Seasonal ARIMA and ARIMA models. Durdu developed predictive algorithms for forecasting droughts in Turkey, using the SPI series as a drought indicator. Moreira et al. [32] conducted a Fourier analysis to assess drought in the SPI time series in Portugal. Salahi et al. [33] predicted precipitation and future droughts in the Mashhad Plain of Iran using stochastic time series and SPI. Habibi et al. [34] investigated drought patterns in North Algeria’s Chéliff–Zahrez basin using SPI and Markov chain models, revealing a significant impact on agriculture, especially in semi-arid to arid regions.
As is evident in the literature review, there are few studies on drought assessment conducted on the Aegean region. This region is of great importance in terms of agricultural production and food security as it hosts important agricultural areas of Turkey. For this reason, it is very important to make a detailed drought analysis of the Aegean region and to provide recommendations that will guide decision makers in critical areas such as agriculture, water resources, and ecosystem management. Therefore, this study analyses drought dynamics in the Aegean region in detail using region-specific meteorological data. In this context, SPI values are calculated for different periods, such as 1-, 3-, 6-, 9- and 12-month periods, using monthly precipitation data from nine meteorological stations in the Aegean region (Afyonkarahisar, Aydın, Denizli, İzmir, Kütahya, Manisa, Muğla, Uşak, and Yatağan) for the period 1972–2020. The obtained SPI values are evaluated in detail on station-by-station basis, and drought analyses are performed. In addition, time series linear autoregressive (AR) models are constructed using SPI-12 data since they better represent long-term drought trends and predictions. In order to determine the most appropriate model, methods such as Adjusted Akaike Information Criterion (AICC), Akaike Information Criterion (AIC), Final Prediction Error Criterion (FPE), and Minimum Residual Variance (Var(e)) information criterion are used. As a result of these analyses, the aim is to contribute to the operational studies of the water structures in the region and to help optimize water storage and distribution strategies.
This study holds significant originality by enhancing our understanding of the precipitation regime in the Aegean region and predicting future precipitation. In doing so, it contributes to important issues such as the planning and improvement of agricultural production, the sustainability of water resources, and the reduction in drought risk.
The Study Area and Available Data
Turkey’s diverse topography leads to varying climates across its regions. The Aegean region extends over an area of approximately 79,000 km2 (Figure 1). The Aegean region benefits from a notably mild climate along its coastal plain due to perpendicular mountains and valleys, which allow the maritime climate to penetrate inland [35].
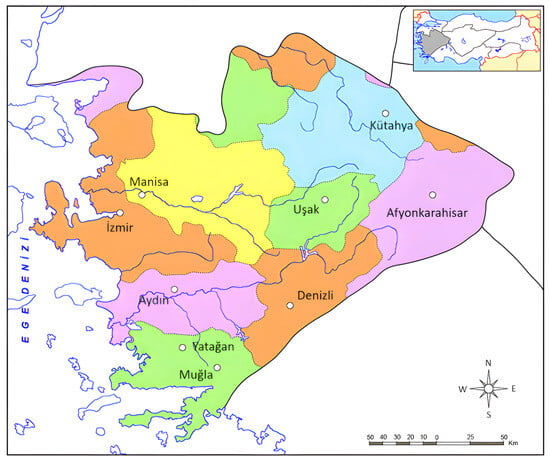
Figure 1.
Aegean region.
This study examines long-term precipitation data from nine meteorological stations in Turkey’s Aegean Anatolia regions from 1972 to 2020. Monthly precipitation data were used to calculate SPI drought indices. Table 1 presents the geographical coordinates of stations located in the Aegean regions. The data on precipitation and temperature for the time span between 1972 and 2020 are obtained from the DMI. Table 2 presents the statistical parameters of the data for the stations from 1972 to 2020. It shows that the average monthly precipitation ranges from 35.6 to 96.2 mm.

Table 1.
Statistical parameters of monthly precipitation series (data period from 1972 to 2020).

Table 2.
Statistical data of stations.
2. Methods
2.1. The Standardized Precipitation Index (SPI)
The SPI is widely used to describe meteorological drought. In the study of Mckee et al. [36], precipitation data were transformed into a standard normal probability distribution function with a mean of zero and a standard deviation of 1 over a specific period.
The SPI is derived for the assessment of drought duration, severity, and intensity [37,38]. The SPI classification is presented in Table 3.

Table 3.
Classification of SPI Values.
The data sets are organized for 1-, 3-, 6-, 9-, 12-month time periods. Suppose is the cumulated monthly precipitation in the time period under investigation which fits a gamma probability density function as follows:
where is the precipitation amount, is the Gamma function, and and β are the shape and scale parameter, respectively.
is the number of precipitation observations. The cumulative probability distribution function is defined as follows:
The Gamma function is not defined for , and the precipitation distribution can include values of zero. When this is the case, the cumulative probability distribution is defined as follows:
where represents the probability for a value of zero [36,39].
The principal strength of the SPI is that it can be calculated and compared for any geographical location and any number of time scales, as it is expressed in units of standard deviation from the long-term mean. Furthermore, the normalization of the SPI ensures its efficacy in analyzing both wet and dry cycles, providing a comprehensive approach to drought analysis. The simplicity of the SPI indicator, based on a single input parameter, distinguishes it from other drought indicators, including the Palmer Drought Severity Index, which incorporates changes in temperature, soil moisture, and evapotranspiration.
2.2. Time Series Modeling
In hydrologic time series analysis, the goal is to accurately describe the temporal evolution of a given quantification. A systematic approach to hydrologic time series modeling may consist of the following main phases: (1) identifying the model; (2) identifying the model type; (3) identifying the model form; and (4) evaluating uncertainties.
Linear AR Models
The general expression of Markov or linear AR models of order , denoted by AR can be defined as follows:
The equation represents a model where represents the precipitation in the tth year, represents the autoregressive coefficients (model parameters), represents a normally distributed random variable that is an independent process with a mean of zero, and a variance of (noise, error term), and represents the order of the model. The order Markov model, often known as the AR or simply AR model, represents the dependence of the precipitation in a given year on the precipitation data from the preceding years [40,41].
The AR model consists of unidentified parameters and ), which need to be estimated from the available data [41,42,43]. The AR(1) and AR(2) models, which are first and second order Markov models, are commonly employed in hydrology [44].
2.3. Test of Goodness of Fit Criterion
The suitability of the model for the observed series is assessed with statistical tests, and the decision to accept or not to accept the model is then made. The testing of goodness of fit in stochastic models was accomplished by using various methods.
2.3.1. Akaike Information Criterion
The AIC, introduced by Akaike [45], is a mathematical formulation that incorporates the principle of parsimony [40]. To compare AR models, Akaike suggests using the following equation:
where is the maximum likelihood estimate of the residual variance, is the number of AR coefficients, N is the sample size, and is the number of distribution parameters . The model which yields the minimum AIC number is the one to be selected.
2.3.2. Corrected Akaike Information Criterion
Hurvich and Tsai [46] proposed an adapted form of the AICC using Kullback–Leibler information alongside unbiased estimators. The formulation of this criterion is as follows:
It is best to use the model that shows the lowest AICC value.
2.3.3. Final Prediction Error Criterion
Another method for determining the order in AR modeling is the FPE developed by Akaike [47]. The fundamental concept is straightforward. The FPE Criterion is described as follows:
It is best to use the model that shows the lowest FPE value.
2.3.4. Minimum Residual Variance
The Minimum Residual Variance test assesses the accuracy of the model by calculating the value of Var(e), which is determined as follows:
where is the observed data, and is the estimated data for each model. The minimum value of the variance (Var(e)) helps in determining the appropriate model [48].
Akaike put forward several procedures aimed at adjusting the criterion to achieve a consistent estimator and identify its field of application. All criteria suggested by Akaike, including the AIC and AICC, are asymptotically equivalent [49,50,51]. The flow chart of the best model selection analysis with SPI and time series modeling is provided in Figure 2.
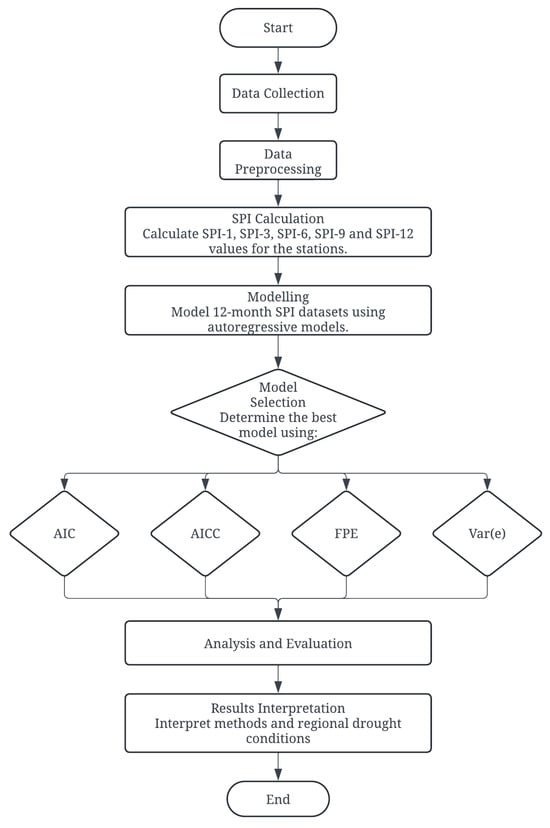
Figure 2.
Flowchart of SPI and time series modeling analysis.
3. Results
3.1. SPI Analysis Assessment
SPI values were calculated for 1-, 3-, 6-, 9-, and 12-month time scale conditions for the stations in the region. In the following, drought periods are determined by analyzing SPI values of 1-, 3-, 6-, 9-, and 12-month periods for each station.
3.1.1. SPI-1 Analysis
- Afyonkarahisar station: 1973–1979, 1985–1989, 1990–2012, and 2014–2019;
- Aydın station: 1972–1973, 1989–1992, 2001–2004, 2006, 2008, and 2016;
- Denizli station: 1977, 1989–1990, 2001, 1997, 2007–2008, 2001–2005, and 2014–2016;
- İzmir station: 1973–1974, 1977–1979, 1983–1984, 1987–1989, 1991, 1992, 2001–2008, and 2012–2018;
- Kütahya station: 1972–1974, 1982–1984, 1986–1989, 1990–1995, 1997–2001, 2002–2008, and 2013–2016;
- Manisa station: 1976–1984, 1986–1989, 1990–1993, 1995–2000, 2002–2006, 2010–2014, and 2016–2018;
- Muğla station: 1973–1976, 1981–1985, 1989–1992, 1995–2004, 2010–2016, and 2017;
- Uşak station: 1983–1992, 2001–2004, 2008–2011, 2014–2019, and 2020;
- Yatağan station: 1973–1974, 1977, 1984–1989, 1990–1995, 2000–2004, 2014–2020.
When these results are examined, it is seen that dry periods are observed more frequently, considering that the SPI period is 1-month. Due to the short analysis period, these results are not recommended for use in long-term planning of water structures. But it is effective in planning agricultural activities and short-term water management strategies.
3.1.2. SPI-3 Analysis
- Afyonkarahisar station: 1972–1975, 1983–1986, 1989–1994, 2000–2007, 2011–2012, and 2014–2017;
- Aydın station: 1972–1973, 1976–1978, 1986–1990, 1999, 2001, 2004, 2010–2016, and 2020;
- Denizli station: 1972–1977, 1982–1986, 1988–1989, 1994–1996, 2005–2008, and 2016–2018;
- İzmir station: 1972–1974, 1977, 1981–1984, 1987–1989, 1991–1992, 2004–2005, 2007–2010, 2012–2013, and 2017–2018;
- Kütahya station: 1973, 1978–1979, 1982–1986, 1990–1993, 1999–2008, and 2010–2014;
- Manisa station: 1973, 1979–1984, 1988–1994, 1999–2004, 2007–2008, 2012, and 2014;
- Muğla station: 1972–1973, 1977–1978, 1981–1989, 1990–1992, 1999–2004, and 2007–2012;
- Uşak station: 1978, 1986–1989, 1990–1993, 2001–2011, 2014–2019, and 2020;
- Yatağan station: 1973–1974, 1976–1977, 1985–1992, 1998–2004, 2014–2015, 2020.
The results show that the frequency of dry periods decreases according to SPI-1 analysis. These results can be used in planning more seasonal activities such as agricultural planning and management of water reservoirs.
3.1.3. SPI-6 Analysis
- Afyonkarahisar station: 1973–1975, 1983–1989, 1994, 2005–2007, and 2014–2017;
- Aydın station: 1972–1973, 1987–1992, 1999, 2004, 2007–2008, 2014, and 2016;
- Denizli station: 1974–1975, 1977, 1980–1983, 1986–1989, 1994–1997, 2002, 2005, 2007–2008, and 2014–2018;
- İzmir station: 1972–1977, 1981–1983, 1987–1992, 1999–2005, 2007–2008, and 2017–2018;
- Kütahya station: 1982–1985, 1988–1989, 2000–2006, 2007–2008, and 2012–2014;
- Manisa station: 1972–1973, 1984–1992, 1999–2004, and 2007–2008;
- Muğla station: 1973–1974, 1981, 1989–1992, 2000–2004, 2007–2010, and 2016–2017;
- Uşak station: 1988–1989, 1992–2001, 2004–2007, 2014–2017, and 2020;
- Yatağan station: 1973–1974, 1977, 1984–1992, 1999–2001, 2000–2004, 2020.
These results are suitable for assessing medium-term climate anomalies and water resources trends. It can be used in seasonal planning and water resources strategies.
3.1.4. SPI-9 Analysis
- Afyonkarahisar station: 1973–1975, 1983, 1989–1994, 2005, and 2017;
- Aydın station: 1973, 1976, 1988–1992, 1999, and 2016;
- Denizli station: 1974–1977, 1983–1989, 1991–1993, 2002–2005, 2008–2010, 2013–2014, and 2016–2019;
- İzmir station: 1972–1974, 1977, 1982–1984, 1987, 1990–1993, 2000, and 2005–2008;
- Kütahya station: 1982–1986, 1989–1992, 2001, 2005–2008, and 2013–2014;
- Manisa station: 1972–1973, 1986–1992, 2001–2008, and 2020;
- Muğla station: 1973–1974, 1989–1992, 2000–2008, 2010, and 2017;
- Uşak station: 1988–1989, 1992–2001, 2004–2005, 2014–2017, and 2020;
- Yatağan station: 1973–1974, 1988–1992, 1999–2000, 2020.
3.1.5. SPI-12 Analysis
- Afyonkarahisar station: 1973–1975, 1989, 1994, 2005, and 2017;
- Aydın station: 1973, 1990–1992, 2005, and 2007;
- Denizli station: 1973–1975, 1982–1997, 2002–2003, 2007–2008, 2010–2017, and 2018–2019;
- İzmir station: 1973–1974, 1978, 1983–1984, 1989–1993, 2000–2001, 2004–2007, and 2008–2009;
- Kütahya station: 1982–1989, 1990–1993, 2001–2008, and 2013–2014;
- Manisa station: 1985–1992, 2001–2007, 2008, and 2018;
- Muğla station: 1973–1974, 1989–1992, 2000–2001, 2007–2008, and 2017;
- Uşak station: 1988–1989, 2001–2005, 2019, and 2020;
- Yatağan station: 1973–1974, 1990–1992, and 2020.
These periods indicate significant drought events at each respective station. These results are important for monitoring long-term water resources and climate trends. They are used in long-term water management and climate change strategies.
The relative frequencies of the nine stations in the Aegean region for 1-, 3-, 6-, 9-, and 12-month time periods vary between 6% and 14% for moderate drought, 2% and 7% for severe drought, 1% and 6% for extreme drought, 26% and 40% for near-normal drought, 29% and 47% for normal drought, 7% and 17% for moderate wetness, 2% and 7% for precipitation, and 0% and 3% for extreme wetness.
Due to their locations in the Aegean region, the SPI values of İzmir station representing the coastal Aegean and Denizli station representing the inner Aegean for the periods of 1-, 3-, 6-, 9-, and 12-months are presented in Figure 3, Figure 4, Figure 5, Figure 6, Figure 7, Figure 8, Figure 9, Figure 10, Figure 11 and Figure 12. From the short-term period graphs (1 and 3 months) presented in Figure 3, Figure 4, Figure 8, and Figure 9, it is seen that droughts occur more frequently but their duration is shorter. As the duration of droughts increases, their frequency decreases. Likewise, the length of wet periods also decreases over these time periods. For the longer time periods presented in Figure 6, Figure 7, Figure 11, and Figure 12, i.e., periods of 9- and 12-months, the length of both wet and dry periods increases. The duration of these intervals can be extended using various methods depending on the intended use and water consumers. Especially in the analyses of SPI-6, SPI-9, and SPI-12; it is observed that the number of wet years is higher in İzmir station. In Denizli station, on the other hand, it is observed that the number of dry years is higher and wet years are less frequent compared to İzmir. These results reflect the climatic differences of the coastal and inner Aegean regions and the differences between these two stations provide important information for regional water management and agricultural planning. The spatial analysis of drought equips decision-makers with the necessary insights to optimize natural resource planning by evaluating the spatial sensitivity to drought conditions. This process identifies varying levels of regional susceptibility to drought, thus aiding in the formulation of strategic approaches for water resource management and agricultural practices. Consequently, it serves as a crucial instrument for mitigating spatial drought risks and promoting the sustainable utilization of resources.
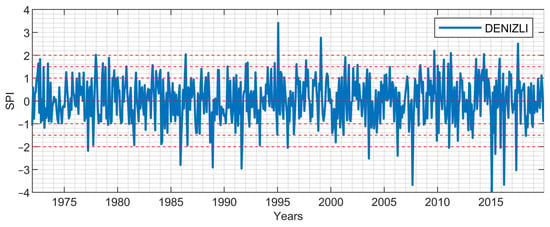
Figure 3.
1-month period SPI values: Denizli.
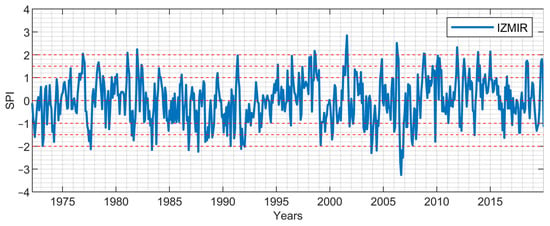
Figure 4.
3-month period SPI values: Denizli.
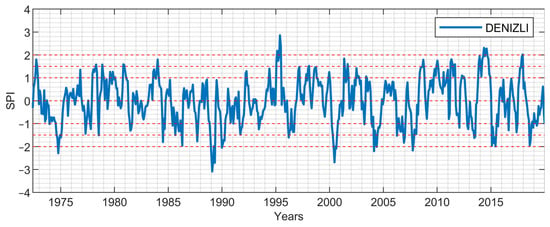
Figure 5.
6-month period SPI values: Denizli.
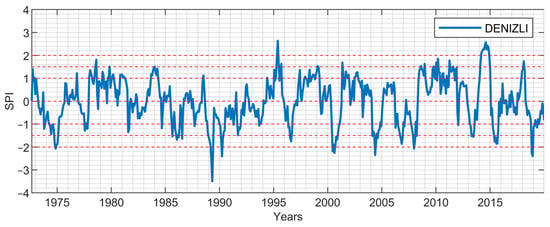
Figure 6.
9-month period SPI values: Denizli.
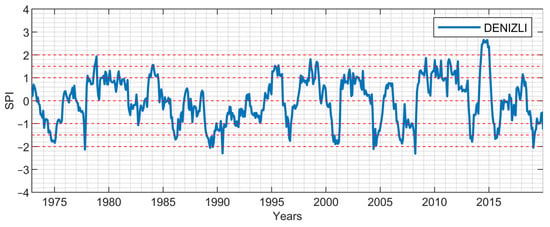
Figure 7.
12-month period SPI values: Denizli.
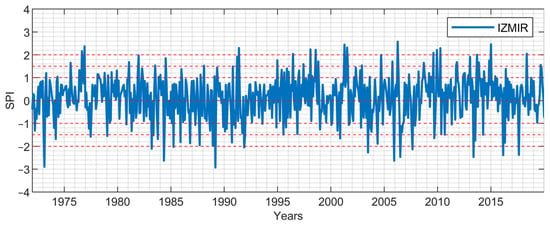
Figure 8.
1-month period SPI values: İzmir.
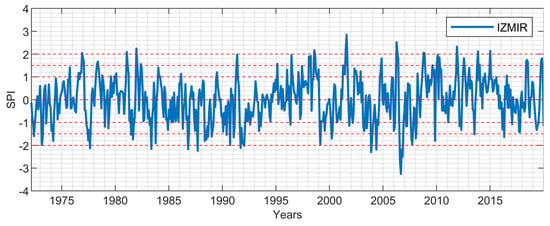
Figure 9.
3-month period SPI values: İzmir.
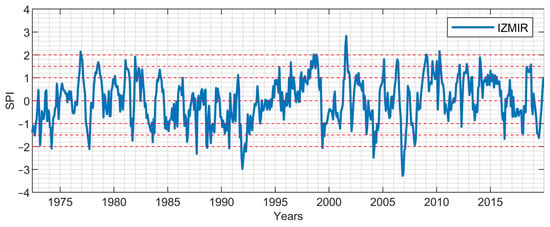
Figure 10.
6-month period SPI values: İzmir.
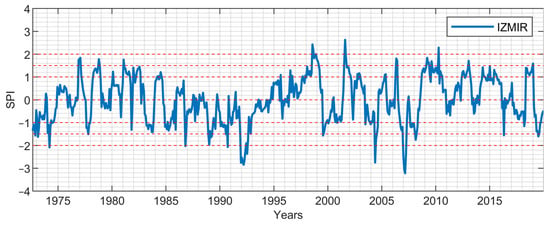
Figure 11.
9-month period SPI values: İzmir.
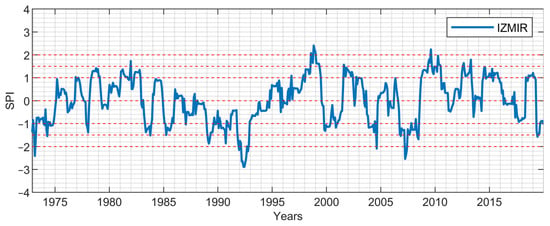
Figure 12.
12-month period SPI values: İzmir.
In addition, Table 4 and Table 5 present the relative frequencies for Denizli and İzmir stations for 1-, 3-, 6-, 9-, and 12-month time periods. An analysis of the results presented in Table 4 and Table 5 reveals that the cumulative relative frequencies of the drought classes—Moderately Dry, Severely Dry, and Extremely Dry—at both stations increase as the SPI periods extend. Given that the 9- and 12-month SPI periods reflect long-term effects, this observation suggests a tendency toward increasing drought conditions in the region where these two stations are located.

Table 4.
Relative frequencies for 1-, 3-, 6-, 9-, and 12-month time periods: Denizli.

Table 5.
Relative frequencies for 1-, 3-, 6-, 9-, and 12-month time periods: İzmir.
3.2. Time Series Analysis Assessment
During the process of establishing mathematical models for hydrological time series, the precise parameters of the model are often unknown and need to be estimated from a limited set of observed data. The population model that is produced as a consequence is only an estimate. Therefore, choosing the model that provides the greatest fit among several possibilities is the main difficulty in stochastic hydrology.
In this study, 12-month SPI drought index results (1972–2020) from nine stations were modeled. AR(1), AR(2), and AR(3) model parameters were obtained. The statistical properties of the observed data show that the probability distribution can be considered as normal. AIC, AICC, FPE, and Var(e) methods, which are commonly used as information criterion methods in stochastic models, were used. Goodness of fit test results were calculated for all stations. The results of the goodness of fit test parameters for the Denizli and İzmir stations are presented in Table 6 and Table 7. As can be seen from the goodness of fit results, the AR(2) model is considered appropriate for most of the stations. The results show that the AR(3) model is the best fitting model for the Denizli station, while the AR(2) model is the best fitting model for all other stations. This information is shown in Table 8. In addition to the fact that the model result is AR(2) throughout the region, the fact that the result for the Denizli station, another station in the region, is AR(3) reinforces the importance of spatial analyses instead of regional studies.

Table 6.
The best-fit model according to testing the goodness of fit methods (Denizli).

Table 7.
The best-fit model according to testing the goodness of fit methods (İzmir).

Table 8.
The results of goodness of fit for 12 monthly SPI series of all stations.
4. Discussion
The results of this study provide a comprehensive understanding of drought dynamics in the Aegean region, particularly through the application of the SPI and AR models. The temporal analysis across different SPI periods (1-, 3-, 6-, 9-, and 12-months) reveals a significant contrast in drought frequency and duration between short-term and long-term scales. This is consistent with the findings of previous studies, such as those by Laimighofer and Laaha [52], which emphasize the importance of observational period and distribution in meteorological drought modeling.
Short-term droughts, while more frequent, tend to be of shorter duration, reflecting the region’s responsiveness to immediate climatic variability. In contrast, long-term droughts, though less frequent, are more prolonged, indicating the persistent and possibly more severe impacts of climatic changes on the region. The variability observed between coastal stations like İzmir and inner stations like Denizli highlights the influence of geographic and climatic factors on drought characteristics. Coastal areas, with more frequent wet years, contrast sharply with the inner regions that experience more prolonged dry periods, aligning with the broader climatic differences between these zones.
The application of AR models, specifically using SPI-12 data, has proven to be an effective method for capturing long-term drought trends and providing reliable forecasts. The selection of AR(2) as the most suitable model for most stations, except Denizli, underscores the model’s robustness in representing the autocorrelation present in the time series data. However, it is important to note a limitation in our study: the observation period of 1972–2020 spans less than 60 years. According to Carbone et al. [53], models based on data spanning more than 30 but fewer than 60 years tend to exhibit greater uncertainty, while periods longer than 60 years significantly reduce this uncertainty. Therefore, applying this model to regions with more than 60 years of data could yield more reliable predictions with reduced uncertainty.
The implications of these findings are significant for regional water resource management and drought mitigation strategies. The precise modeling of drought conditions enables more informed decision-making, which is crucial in the context of the increasing variability and unpredictability of climate conditions. The alignment of this study with the broader discourse on drought prediction, as suggested by Aghakouchak et al. [54], emphasizes the need for models that improve forecasting accuracy by incorporating the inherent randomness of climate events.
This study’s use of SPI and AR models, based on an observation period from 1972 to 2020, provides a robust methodological foundation for future research. The findings not only enhance our understanding of drought behavior in the Aegean region but also offer a framework applicable to other areas facing similar climatic challenges. As climate change complicates drought prediction, integrating data fusion techniques or multiple modeling approaches could improve accuracy. Future research should extend these methods across Turkey and continue exploring diverse models to address the spatial and temporal complexities of drought prediction under changing climate conditions.
5. Conclusions
In this study, drought analysis was conducted with monthly precipitation data from nine stations located in the Aegean region between 1972 and 2020. For this purpose, SPI values were calculated for periods of 1-, 3-, 6-, 9-, and 12-months to contribute to the evaluation of drought conditions at different time scales for the region- and station-specific drought conditions. Throughout the region, drought is more frequent and of shorter duration in the short time periods. As the analyzed time period duration increases, the duration of drought increases but the frequency decreases. In all provinces, the total relative frequency of drought for the 1-, 3-, 6-, 9-, and 12-month periods varies between 9% and 27%. The graphs for the İzmir and Denizli stations are presented in the results section since they represent the Aegean region in two sections, namely inner and coastal. According to the short-term graphs, it can be seen that droughts occur more frequently but their duration is shorter. As the duration of droughts increases, their frequency decreases. Likewise, the length of rainy periods also decreases in these time periods. For longer periods, the lengths of both the wet and dry periods increase. The duration of these intervals can be extended using various methods depending on the intended use and water consumers. Especially in the long-period SPI analyses, it is determined that the number of wet years is higher for the İzmir station. It is observed that the number of dry years is higher and wet years are less frequent in the inner Aegean stations compared to the coastal Aegean stations. These results are in parallel with the climatic differences between the coastal and inner regions.
Time series linear AR models were constructed using SPI-12 data as they better represent long-term drought trends and forecasts. The models that best represent the stations were determined by using AIC, AICC, FPE, and Var(e) methods. The values of the information criterion methods are presented for Denizli and İzmir. The most appropriate models selected for all stations are presented. According to Var(e), AIC, AICC, and FPE, AR(2) is the best of all the models analyzed for all the stations except for Denizli. This study, in which SPI and autoregressive models are analyzed in combination, can provide a basis for future research by enabling us to understand the precipitation regime and drought in the region and to predict future precipitation.
These results provide an important finding for accurately modeling autocorrelation in time series data and more accurately predicting future drought trends. In addition to the short- and long-term drought results obtained in the SPI analysis, the parameters determined via the AR models allow more precise decisions to be made on issues such as drought mitigation strategies and water resources management. These results provide an important scientific basis for the development and implementation of drought reduction strategies at the regional level. Also, in future studies, it is envisaged that this drought analysis conducted for the Aegean region will be extended to cover the entire territory of Turkey. Furthermore, it is planned to investigate the applicability of various time series models.
Author Contributions
Conceptualization, A.T. and U.G.; methodology, A.T. and U.G.; software, E.B.; validation, A.T. and E.B.; formal analysis, A.T. and E.B.; investigation, A.T. and E.B.; resources, A.T. and U.G.; data curation, A.T. and E.B.; writing—original draft preparation, A.T. and E.B.; writing—review and editing, E.B. and U.G.; visualization, A.T. and E.B.; supervision, E.B. and U.G.; project administration, U.G.; funding acquisition, A.T. All authors have read and agreed to the published version of the manuscript.
Funding
This research was funded by the Pamukkale University Research Fund Unit grant number PAU-BAP-2021FEBE043 and The APC was funded by author A.T.
Institutional Review Board Statement
Not applicable.
Informed Consent Statement
Not applicable.
Data Availability Statement
The raw data supporting the conclusions of this article will be made available by the authors on request.
Acknowledgments
We would like to thank the Turkish State Meteorological Service for providing the data used in this study, and the reviewers for their valuable feedback, which contributed to the improvement of this manuscript.
Conflicts of Interest
The authors declare no conflict of interest.
References
- Fontaine, M.M.; Steinemann, A.C. Assessing Vulnerability to Natural Hazards: Impact-Based Method and Application to Drought in Washington State. Nat. Hazards Rev. 2009, 10, 11–18. [Google Scholar] [CrossRef]
- Sirdas, S.; Sen, Z. Meteorolojik kuraklık modellemesi ve Türkiye uygulaması. itüdergisi 2003, 2, 95–103. [Google Scholar]
- Chen, S.T.; Kuo, C.C.; Yu, P.S. Historical trends and variability of meteorological droughts in Taiwan. Hydrol. Sci. J. 2009, 54, 430–441. [Google Scholar] [CrossRef]
- Azarakhshi, M.; Mahdavi, M.; Arzani, H.; Ahmadi, H. Assessment of the Palmer drought severity index in arid and semi arid rangeland: (Case study: Qom province, Iran). Desert 2011, 16, 77–85. [Google Scholar]
- Dastorani, M.T.T.; Afkhami, H. Application of artificial neural networks on drought prediction in Yazd (Central Iran). Desert 2011, 16, 39–48. [Google Scholar]
- Nohegar, A.; Heydarzadeh, M.; Malekian, A. Assessment of Severity of Droughts Using Geostatistics Method(Case Study: Southern Iran). Desert 2013, 18, 79–87. [Google Scholar]
- Kallis, G. Droughts. Annu. Rev. Environ. Resour. 2008, 33, 85–118. [Google Scholar] [CrossRef]
- Politi, N.; Vlachogiannis, D.; Sfetsos, A.; Nastos, P.T.; Dalezios, N.R. High Resolution Future Projections of Drought Characteristics in Greece Based on SPI and SPEI Indices. Atmosphere 2022, 13, 1468. [Google Scholar] [CrossRef]
- Kostopoulou, E.; Giannakopoulos, C. Projected Changes in Extreme Wet and Dry Conditions in Greece. Climate 2023, 11, 49. [Google Scholar] [CrossRef]
- Stathi, E.; Kastridis, A.; Myronidis, D. Analysis of Hydrometeorological Trends and Drought Severity in Water-Demanding Mediterranean Islands under Climate Change Conditions. Climate 2023, 11, 106. [Google Scholar] [CrossRef]
- Darabi, H.; Danandeh Mehr, A.; Kum, G.; Sönmez, M.E.; Dumitrache, C.A.; Diani, K.; Celebi, A.; Torabi Haghighi, A. Hydroclimatic Trends and Drought Risk Assessment in the Ceyhan River Basin: Insights from SPI and STI Indices. Hydrology 2023, 10, 157. [Google Scholar] [CrossRef]
- Stefanidis, S.; Rossiou, D.; Proutsos, N. Drought Severity and Trends in a Mediterranean Oak Forest. Hydrology 2023, 10, 167. [Google Scholar] [CrossRef]
- Mersin, D.; Safari, M.J.S.; Vaheddoost, B.; Tayfur, G. Drought Assessment in Büyük Menderes Basin of Turkey. In Proceedings of the 5th International Congress of Developing Agriculture, Natural Resources, Environment and Tourism of Iran, Tabriz, Iran, 5–7 January 2021. [Google Scholar]
- Mersin, D.; Tayfur, G.; Vaheddoost, B.; Safari, M.J.S. Historical Trends Associated with Annual Temperature and Precipitation in Aegean Turkey, Where Are We Heading? Sustainability 2022, 14, 13380. [Google Scholar] [CrossRef]
- Gul, E.; Staiou, E.; Safari, M.J.S.; Vaheddoost, B. Enhancing Meteorological Drought Modeling Accuracy Using Hybrid Boost Regression Models: A Case Study from the Aegean Region, Türkiye. Sustainability 2023, 15, 11568. [Google Scholar] [CrossRef]
- Kourtis, I.M.; Vangelis, H.; Tigkas, D.; Mamara, A.; Nalbantis, I.; Tsakiris, G.; Tsihrintzis, V.A. Drought Assessment in Greece Using SPI and ERA5 Climate Reanalysis Data. Sustainability 2023, 15, 15999. [Google Scholar] [CrossRef]
- Sakellariou, S.; Spiliotopoulos, M.; Alpanakis, N.; Faraslis, I.; Sidiropoulos, P.; Tziatzios, G.A.; Karoutsos, G.; Dalezios, N.R.; Dercas, N. Spatiotemporal Drought Assessment Based on Gridded Standardized Precipitation Index (SPI) in Vulnerable Agroecosystems. Sustainability 2024, 16, 1240. [Google Scholar] [CrossRef]
- Ilinca, C.; Anghel, C.G. Flood-Frequency Analysis for Dams in Romania. Water 2022, 14, 2884. [Google Scholar] [CrossRef]
- Anghel, C.G.; Stanca, S.C.; Ilinca, C. Two-Parameter Probability Distributions: Methods, Techniques and Comparative Analysis. Water 2023, 15, 3435. [Google Scholar] [CrossRef]
- Ilinca, C.; Stanca, S.C.; Anghel, C.G. Assessing Flood Risk: LH-Moments Method and Univariate Probability Distributions in Flood Frequency Analysis. Water 2023, 15, 3510. [Google Scholar] [CrossRef]
- Ilinca, C.; Anghel, C.G. Flood Frequency Analysis Using the Gamma Family Probability Distributions. Water 2023, 15, 1389. [Google Scholar] [CrossRef]
- Anghel, C.G.; Ilinca, C. Evaluation of Various Generalized Pareto Probability Distributions for Flood Frequency Analysis. Water 2023, 15, 1557. [Google Scholar] [CrossRef]
- Anghel, C.G.; Ilinca, C. Predicting Flood Frequency with the LH-Moments Method: A Case Study of Prigor River, Romania. Water 2023, 15, 2077. [Google Scholar] [CrossRef]
- Baran, T.; Guner Bacanli, U.; Dikbas, F. Drought analysis with SPI index and entropy. Eur. Water 2017, 60, 263–270. [Google Scholar]
- Mishra, A.K.; Singh, V.P. A review of drought concepts. J. Hydrol. 2010, 391, 202–216. [Google Scholar] [CrossRef]
- Liu, Q.; Zhang, G.; Ali, S.; Wang, X.; Wang, G.; Pan, Z.; Zhang, J. SPI-based drought simulation and prediction using ARMA-GARCH model. Appl. Math. Comput. 2019, 355, 96–107. [Google Scholar] [CrossRef]
- Rezaiy, R.; Shabri, A. Drought forecasting using W-ARIMA model with standardized precipitation index. J. Water Clim. Chang. 2023, 14, 3345–3367. [Google Scholar] [CrossRef]
- Singh, U.; Sharma, P.K. Drought forecasting using the stochastic model in the Betwa river basin, India. Model. Earth Syst. Environ. 2022, 8, 1771–1786. [Google Scholar] [CrossRef]
- Mishra, A.K.; Desai, V.R. Spatial and temporal drought analysis in the kansabati river basin, india. Int. J. River Basin Manag. 2005, 3, 43–52. [Google Scholar] [CrossRef]
- Nirmala, M.; Sundaram, S.M. A Seasonal Arima Model for Forecasting Monthly Rainfall in Tamilnadu. Natl. J. Adv. Build. Sci. Mech. 2010, 1, 43–47. [Google Scholar]
- Durdu, Ö.F. Application of linear stochastic models for drought forecasting in the Büyük Menderes river basin, western Turkey. Stoch. Environ. Res. Risk Assess. 2010, 24, 1145–1162. [Google Scholar] [CrossRef]
- Moreira, E.E.; Martins, D.S.; Pereira, L.S. Assessing drought cycles in SPI time series using a Fourier analysis. Nat. Hazards Earth Syst. Sci. 2015, 15, 571–585. [Google Scholar] [CrossRef]
- Salahi, B.; Nohegar, A.; Behrouzi, M. The modeling of precipitation and future droughts of mashhad plain using stochastic time series and standardized precipitation index (SPI). Int. J. Environ. Res. 2016, 10, 625–636. [Google Scholar]
- Habibi, B.; Meddi, M.; Torfs, P.J.J.F.; Remaoun, M.; Van Lanen, H.A.J. Characterisation and prediction of meteorological drought using stochastic models in the semi-arid Chéliff–Zahrez basin (Algeria). J. Hydrol. Reg. Stud. 2018, 16, 15–31. [Google Scholar] [CrossRef]
- Guner Bacanli, U. Dryness characterization: A climatic water deficit approach in Turkey. Fresenius Environ. Bull. 2011, 20, 665–677. [Google Scholar]
- McKee, T.B.; Doesken, N.J.; Kleist, J. THE RELATIONSHIP OF DROUGHT FREQUENCY AND DURATION TO TIME SCALES. In Proceedings of the Eighth Conference on Applied Climatology, Anaheim, CA, USA, 17–22 January 1993. [Google Scholar]
- Ganguli, P.; Janga Reddy, M. Ensemble prediction of regional droughts using climate inputs and the SVM-copula approach. Hydrol. Process. 2014, 28, 4989–5009. [Google Scholar] [CrossRef]
- Zhang, Y.; Cai, W.; Chen, Q.; Yao, Y.; Liu, K. Analysis of changes in precipitation and drought in Aksu River Basin, Northwest China. Adv. Meteorol. 2015, 2015, 215840. [Google Scholar] [CrossRef]
- Guttman, N.B. Accepting the Standardized Precipitation Index: A Calculation Algorithm. J. Am. Water Resour. Assoc. 1999, 35, 311–322. [Google Scholar] [CrossRef]
- Salas, J.D.; Delleur, J.W.; Yevjevich, V.; Lane, W.L. Applied Modeling of Hydrologic Time Series; Water Resources Publications (First Printing 1980): Littleton, CO, USA, 1985. [Google Scholar]
- Salas, J.D.; Smith, R.A. Physical basis of stochastic models of annual flows. Water Resour. Res. 1981, 17, 428–430. [Google Scholar] [CrossRef]
- Box, G.E.P.; Jenkins, G.M. Time Series Analysis, Forecasting and Control; Holden Day: San Francisco, CA, USA, 1976. [Google Scholar]
- Salas, J.D. Analysis and modeling of hydrologic time series. In Handbook of Hydrology; Maidment, D.R., Ed.; McGraw-Hill: New York, NY, USA, 1993; pp. 19.1–19.72. [Google Scholar]
- Bayazıt, M. Statistical Methods in Hydrology; İTÜ: Istanbul, Turkey, 1981. [Google Scholar]
- Akaike, H. A New Look at the Statistical Model Identification. IEEE Trans. Automat. Contr. 1974, 19, 716–723. [Google Scholar] [CrossRef]
- Hurvich, C.M.; Tsai, C.L. Regression and time series model selection in small samples. Biometrika 1989, 76, 297–307. [Google Scholar] [CrossRef]
- Akaike, H. Fitting autoregressive model for prediction. Ann. Inst. Stat. Math. 1969, 21, 243–247. [Google Scholar] [CrossRef]
- Hayes, M.; Svoboda, M.; Wall, N.; Widhalm, M. The lincoln declaration on drought indices: Universal meteorological drought index recommended. Bull. Am. Meteorol. Soc. 2011, 92, 485–488. [Google Scholar] [CrossRef]
- Keyantash, J.; Dracup, J.A. The Quantification of Drought: An Evaluation of Drought Indices. Am. Meteorol. Soc. 2002, 83, 1167–1180. [Google Scholar] [CrossRef]
- Morid, S.; Smakhtin, V.; Moghaddasi, M. Comparison of seven meteorological indices for drought monitoring in Iran. Int. J. Climatol. 2006, 26, 971–985. [Google Scholar] [CrossRef]
- Livada, I.; Assimakopoulos, V.D. Spatial and temporal analysis of drought in Greece using the Standardized Precipitation Index (SPI). Theor. Appl. Climatol. 2007, 89, 143–153. [Google Scholar] [CrossRef]
- Laimighofer, J.; Laaha, G. How standard are standardized drought indices? Uncertainty components for the SPI & SPEI case. J. Hydrol. 2022, 613, 128385. [Google Scholar] [CrossRef]
- Carbone, G.J.; Lu, J.; Brunetti, M. Estimating uncertainty associated with the standardized precipitation index. Int. J. Climatol. 2018, 38, e607–e616. [Google Scholar] [CrossRef]
- Aghakouchak, A.; Pan, B.; Mazdiyasni, O.; Sadegh, M.; Jiwa, S.; Zhang, W.; Love, C.A.; Madadgar, S.; Papalexiou, S.M.; Davis, S.J.; et al. Status and prospects for drought forecasting: Opportunities in artificial intelligence and hybrid physical-statistical forecasting. Philos. Trans. R. Soc. A 2022, 380, 20210288. [Google Scholar] [CrossRef]
Disclaimer/Publisher’s Note: The statements, opinions and data contained in all publications are solely those of the individual author(s) and contributor(s) and not of MDPI and/or the editor(s). MDPI and/or the editor(s) disclaim responsibility for any injury to people or property resulting from any ideas, methods, instructions or products referred to in the content. |
© 2024 by the authors. Licensee MDPI, Basel, Switzerland. This article is an open access article distributed under the terms and conditions of the Creative Commons Attribution (CC BY) license (https://creativecommons.org/licenses/by/4.0/).