Abstract
This study investigates the predictability of downslope windstorms located in Santa Barbara County, California, locally referred to as Sundowner winds, from both observed relationships and a high-resolution, operational numerical weather prediction model. We focus on April 2022, during which the Sundowner Winds Experiment (SWEX) was conducted. We further refine our study area to the Montecito region owing to some of the highest wind measurements occurring at or near surface station MTIC1, situated on the coast-facing slope overlooking the area. Fires are not uncommon in this area, and the difficulty of egress makes the population particularly vulnerable. Area forecasters often use the sea-level pressure difference (SLP) between Santa Barbara Airport (KSBA) and locations to the north such as Bakersfield (KBFL) to predict Sundowner windstorm occurrence. Our analysis indicates that SLP by itself is prone to high false alarm rates and offers little information regarding downslope wind onset, duration, or magnitude. Additionally, our analysis shows that the high-resolution rapid refresh (HRRR) model has limited predictive skill overall for forecasting winds in the Montecito area. The HRRR, however, skillfully predicts KSBA-KBFL SLP, as does GraphCast, a machine learning weather prediction model. Using a logistic regression model we were able to predict the occurrence of winds exceeding 9 m with a high probability of detection while minimizing false alarm rates compared to other methods analyzed. This provides a refined and easily computed algorithm for operational applications.
1. Introduction
In recent years, the frequency of wildfires has increased significantly, particularly in regions prone to dry and windy conditions, e.g., [1], especially those subjected to downslope windstorms [2], which are common occurrences in many places around the world [3,4,5,6,7,8,9,10,11,12]. Santa Barbara County, situated along the coast of California with the Santa Ynez Mountains (SYM) running parallel to the coast, is one such region that faces a growing vulnerability to wildfires. This vulnerability is exacerbated by the prevalence of Sundowner winds, a local downslope windstorm that strongly influences fire behavior and poses a significant threat to the region’s residents and natural resources [13,14,15,16]. Several major fires in Santa Barbara County, including the Painted Cave (1990), Tea (2008), Sherpa (2016), and Cave (2019) fires, were all influenced by Sundowners [16,17,18,19,20,21]. Commonly, humans are responsible for wildfire ignitions in the region, which are then exacerbated by the hot and dry downslope winds [16,22].
Sundowners were named for their typical onset time in the late afternoon and evening hours [13,14,15,21]. The National Weather Service (NWS) office responsible for the Santa Barbara area defines a Sundowner as when winds have a northerly direction in the SYM foothills with sustained winds (gusts) exceeding 13.4 (15.6) m [17] but significantly faster gusts (exceeding 30–35 m ) have been reported [23,24]. The winds are influenced by the complex interaction of local topography and atmospheric conditions, making it challenging to accurately predict them using current numerical weather prediction (NWP) models [15,18,23]. Case studies and climatologies of Sundowner wind events using NWP have identified three prevailing types [21], including the western “Gaviota” and eastern “Montecito” types (named for coastal towns located west and east of Santa Barbara, respectively), which have some differences with respect to wind direction and timing, and the hybrid or “Santa Barbara” type possessing strong winds all along the SYM. The synoptic scale mean sea-level pressure (SLP) gradients between Santa Barbara Airport (KSBA) and Santa Maria (KSMX) or Bakersfield airports (KBFL) are often used as a forecasting tool for Sundowners [13,17,21]. Previous research on Sundowners and SLP gradients has suggested that the magnitude of the KSBA-KSMX and KSBA-KBFL SLP differences are related to stronger winds in the western SYM or eastern SYM, respectively [13,17].
The Sundowner Winds Experiment (SWEX) was conducted in the Santa Barbara area between 1 April and 15 May 2022, to advance our understanding of the mechanisms controlling, and predictability of, the Sundowner winds [24]. While Sundowners can appear throughout the year, prior research established that strong events were most frequent in the March through May timeframe and these events persist for 1–3 days [21,25]. The campaign included 10 intensive operation periods (IOPs) to investigate Sundowner conditions, and 3 enhanced operation periods (EOPs) designed to sample more quiescent intervals. SWEX allowed for 21 additional surface observation sites as well as the collection of upper air observations from radiosonde launches, active remote sensing, aircraft dropsondes, and additional surface observations from a mobile platform.
The purpose of this study is to evaluate model forecasts of winds in the Montecito area during the April phase of SWEX made by NOAA’s operational 3-km high-resolution rapid refresh (HRRR) model, version 4. Fires are not uncommon along the ridge of the SYM and its south-facing slope in this area (Figure 1), and Sundowner winds can help expand these fires and push them toward the heavily populated and vulnerable coastal area. However, as we shall see, there are not many meteorological stations on the slopes where winds can become intense, making forecasts from NWP models and observations taken during field programs like SWEX more important. During this month, this area experienced two notably strong Sundowner events: IOPs 1 and 2 extended between April 4 and 6, and IOP 5 occurred on April 23 and 24. These events featured the two highest sustained wind speeds recorded by stations in the Montecito region throughout the entire month. We will make use of routine and SWEX-specific surface observations for winds in the Montecito area.

Figure 1.
Fire ignition points in the Santa Barbara/Montecito area from 1992–2020 from the US Forest Service Research Data Archive [26]. The final fire size is suggested by the marker size.
The structure of this paper is as follows. Section 2 presents the data sources used in this analysis. Section 3 discusses the climatology of winds and pressure gradients from April 2022 in the Montecito area. Section 4 focuses on the winds at Montecito and their relationship to SLP differences from the aforementioned strong IOPs 1 and 2 as well as IOP 5. Section 5 evaluates the HRRR model performance for all of April 2022, as well as for the IOP foci. Section 6 explores the role of model resolution on forecast skill. Section 7 presents a simple statistical model for predicting downslope wind speeds exceeding a specified threshold for the Montecito region. The final section provides a summary and conclusions.
2. Materials and Methods
For this study, we made use of the HRRR gridded surface fields available hourly and on the hour from Amazon Web Services. The HRRR version 4 is based on the Weather Research and Forecasting (WRF) model’s Advanced Research WRF (ARW) core [27,28] and operates on a CONUS-encompassing domain using 3 km grid spacing. Refs. [29,30] provided comprehensive model descriptions. New HRRR runs were initialized hourly although only the 00, 06, 12, and 18 UTC runs extended as far as 48 h. Figure 2a shows the topography of southwestern California, as rendered in the HRRR. We also used the GraphCast [31] machine learning weather prediction model (MLWP) to make six-hourly forecasts of SLP during SWEX. GraphCast (hereafter GC) was trained on 39 years of ERA5 reanalyses [32] between 1979 and 2017 and can be initialized with operational products from ECMWF.
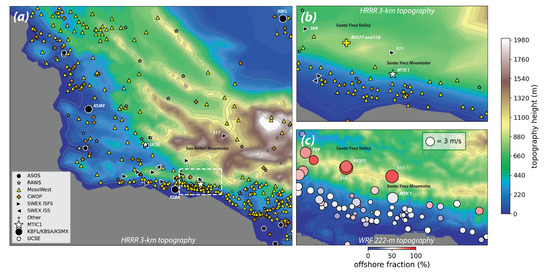
Figure 2.
(a) The HRRR 3 km topography with surface weather station locations. The white box identifies the region shown in (b,c). (b) The HRRR 3 km topography and stations in the Montecito area; (c) 222 m topography derived from Shuttle Radar Topography Mission data and created using the WRF Geogrid program. Marker size indicates average sustained winds for April 2022 and color fill represents a fraction of offshore wind observations from April 2022.
Wind observations for the ≈400 stations shown in Figure 2a came from three sources: the Meteorological Assimilation Data Ingest System (MADIS), the National Centers for Environmental Information (NCEI), and the SWEX field program page maintained by NCAR’s Earth Observing Laboratory. The MADIS observations represented these networks: ASOS (automated surface observing system) and AWOSs (automated weather observing stations), primarily located at airports, including KSBA Santa Barbara, KSMX Santa Maria, and KBFL Bakersfield; RAWSs (remote automated weather stations), sited mainly on mountain slopes; and CWOP (Citizen Weather Observer Program), contributed by private citizens and corporations. The MADIS stations labeled “MesoWest” [33] were dominated by public utility installations placed by Southern California Edison and Pacific Gas and Electric. Observations from the MARITIME network, mainly buoys, were removed. The ASOS data from MADIS were replaced with one-minute observations retrieved from the NCEI archive. We also have 21 ISFS (Integrated Surface Flux System) and ISS (Integrated Sounding System) sites that were erected for the SWEX program. The observations were examined for obviously bad and flagged readings. When possible, observations from the top of the hour were used, otherwise, the record closest to that time was chosen.
It should be appreciated that different observing networks have varying measurement practices for winds and gusts, which may or may not conform with World Meteorological Organization (WMO) guidelines [34]. Winds averaged over time periods of a minute or more are typically referred to as “sustained winds”. Averaging intervals in use include 2 min for ASOS and 10 min for RAWS and most public utilities. Intervals used for some observations are unknown but, as emphasized by [35], all produce “equivalent measures of the true mean wind”. The gust is typically the highest discrete sample recorded in a specified period. However, gust periods vary enormously among networks—examples being 1 min for ASOS and 1 h for RAWS—making gust speeds and quantities such as gust factors (the ratio of gust to sustained wind) difficult to compare [36]. Anemometer mounting heights and exposures also vary tremendously. In this paper, “winds” is used as a synonym for sustained winds.
The SWEX campaign was conducted between 1 April and 15 May 2022 [24]. Confining the study to April simplifies the analysis somewhat while still yielding a very reasonable sample size of observations and events. All times are in UTC. Local time during the project was Pacific Daylight Saving Time (PDT), which was UTC-7 h.
3. Montecito-Area Winds during April 2022
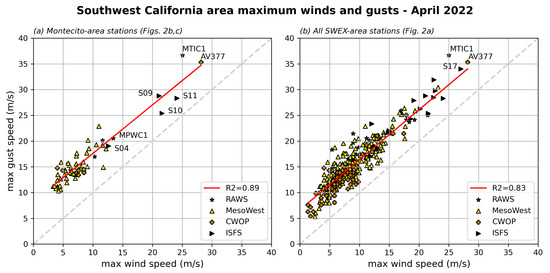
This study focuses on the eastern Santa Barbara area, identified by the white box centered around the town of Montecito in Figure 2a and being the area shown in the other two panels. Of the 61 regularly reporting surface stations in that zone, the fastest sustained wind reports for April 2022 came from CWOP station AV377 (28.2 m ) and RAWS station MTIC1 (25.0 m ). The former is situated near the ridge of the SYM at 1210 m MSL and the latter on its south-facing slope at 494 m elevation (Figure 2b,c). The month’s fastest gusts also involved those two stations, being 36.7 m at MTIC1 and 35.3 m at AV377, respectively. We note that AV377 observations were missing during IOPs 1 and 2 early in the month, so potentially faster winds and gusts might have occurred at that location during that time period.
The zone also had 5 special SWEX (ISFS and ISS) installations, which reported winds every 1 s (Figure 2b,c). Among those, the fastest 5-min average wind speed (24.1 m ) was at ISFS site S11, located on the ridge directly north of MTIC1, and the fastest 3-s gust (28.8 m ) was recorded at S09, another ridge-top installation. ISFS station S10, located about 1 km west of AV377, reported a 3-s gust maximum of 25.4 m for the month. The scatter plot of monthly maximum sustained winds vs. largest gusts for the Montecito area (Figure 3a) emphasizes the fact that MTIC1 and AV377 were the only permanent sites that were particularly windy during the month. Indeed, as shown in Figure 3b, those two stations contributed the fastest legitimate wind and gust observations among the stations shown in Figure 2a, with only SWEX station S17, located well inland in the San Rafael Mountains (see Figure 2a), being comparable. The MTIC1 and AV377 readings appear to be of reasonable quality and this emphasizes their role in providing situational awareness regarding the wind threat in the Montecito area, particularly during Sundowner events.
The 3-km HRRR (panel b) does not render the topography of the narrow SYM or the Santa Ynez Valley (SYV) located to the north very well, especially compared to the higher-resolution rendition shown in panel (c). Both MTIC1 and AV377 possess local features that could strongly influence the winds measured there. Satellite imagery (not shown; see Google Earth) reveals that AV377 appears to be placed near some trees that might be providing some sheltering but also with a slope that might help accentuate the northerly winds. In contrast, ISFS station S10 was installed at a more clearly exposed site at a comparable elevation. Despite reporting faster gusts than S10, AV377’s average sustained wind for the month, 4.8 m , was considerably slower than its better-exposed neighbor (7.1 m ). MTIC1’s location is particularly favorable for offshore-directed Sundowner winds, not only due to its location on the slope but also because of its sitting atop a small hill (not shown) that cannot be resolved even on the much finer grid (Figure 2c). At 4.6 m , MTIC1 had the second-fastest average sustained wind of the regularly reporting stations shown in Figure 2b,c.
Sundowners consist of offshore, downslope winds that, owing to the generally west–east orientation of the SYM and coastline in the Santa Barbara area, represent northerly flow at stations like MTIC1 and AV377. An examination of the meridional component (V) of the observed sustained winds at MTIC1 and AV377 (Figure 4a) revealed that offshore-directed flow () was not uncommon during April 2022. Like other RAWS stations, MTIC1 reports hourly, and of the 698 observations available for the month, 44% were offshore. Figure 2c, which also identifies Montecito-area stations by mean monthly sustained wind speed (marker size) and offshore wind frequency (color shading), shows that most of the south-facing slope and coastal plain stations experienced a northerly wind component about half the time. In contrast, 78% of the 5353 observations taken at AV377, and about 84% of the 8640 readings at ISFS stations S10 and S11, represented offshore-directed winds. Generally, stations located closer to the ridge reported northerly wind components more frequently.
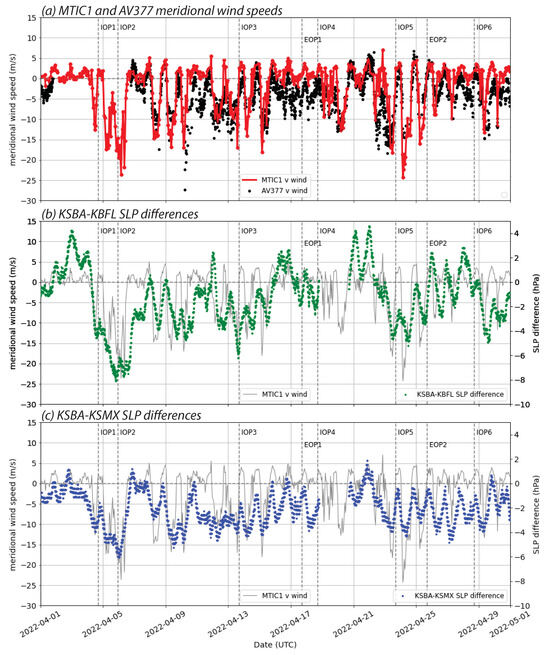
Figure 4.
(a) Meridional components of the wind speed (m ) at MTIC1 (red) and AV377 (black) for April 2022. (b) MTIC1 meridional winds (gray; left axis) with KSBA-KBFL SLP differences (green; hPa; right axis). (c) MTIC1 meridional winds (gray; left axis) with KSBA-KSMX SLP differences (blue; right axis). Vertical dash lines indicate official IOP and EOP start times.
Figure 5 examines MTIC1 daytime observations, defined by when solar radiation recorded at the site was nonzero. Of the 698 available reports, 402 (58%) were daytime, and 298 (74%) of those were not offshore (including 10 calm reports). Figure 5a suggests a modest linear correlation (r = 0.65) existed between downward shortwave (SW) radiation and onshore flow speed, as might be expected for a near-coastal location experiencing a sea breeze. Many of the less common daylight offshore observations came when SW was non-zero but quite small, i.e., near sundown, in keeping with the name “Sundowners” and previous studies, e.g., [21].

Figure 5.
MTIC1 meridional winds (m ) observations during daylight hours. (a) Onshore wind speed vs. downward SW radiation (W ). (b) Offshore wind speed against SW radiation. (c,d), as in (a,b) but using HRRR-forecasted onshore and offshore wind speed and solar radiation interpolated to MTIC1’s location. Black lines represent least squares fits.
The National Weather Service office in Oxnard, CA, which is responsible for the Santa Barbara area, uses sea-level pressure differences between ASOS stations KBFL and KSBA and KSMX and KSBA to inform regarding Sundowner development, strength, and behavior [13]. These stations are identified in Figure 2a. Note that relative to [13], our SLP differences are reversed—calculating KSBA-KBFL and KSBA-KSMX—to conveniently associate offshore meridional winds () with offshore-directed SLP differences (SLP ). Figure 4b,c demonstrate that offshore-directed SLP differences are even more common than offshore-directed winds at MTIC1 and on the coastal plain; 72% of the 8044 available KSBA-KBFL SLP values were negative, as were 94% of the 8044 available SLP differences between KSBA and KSMX. A close examination of these panels, especially (b), appears to support the expected positive association between meridional wind direction and SLP sign but with the suggestion of a temporal phase difference at least in the case of KSBA-KBFL.
In Figure 6, we consider the skill of using the SLP sign and magnitude in informing the strength of the meridional winds at MTIC1, motivated by [17] and related studies. Each available MTIC1 observation, taken 13 min before the hour, was matched with pressure differences computed at the top of the nearest hour, resulting in 651 comparisons with both KSBA-KBFL and KSBA-KSMX (Figure 6a,b). What is also shown is a comparison with SLP calculated between KSBA and Sedgwick Reserve (UCSE), a station operated by the University of California, Santa Barbara, and also identified in Figure 2a, which resulted in 638 successful matches. Each dot is colored red or blue for day and night hours, respectively, based on MTIC1 SW readings. Standard skill measures of the probability of detection (POD), false alarm rate (FAR), and the critical success index (CSI) [37] are also reported. For each, the slash-separated numbers represent values for all, night, and day hours. Accurately anticipating the sign of the MTIC1 meridional flow via contemporaneous SLP values is confirmed when the dots fall in the lower left (offshore) and upper right (onshore) quadrants. The upper left and lower right quadrants respectively represent false alarms and missed events.
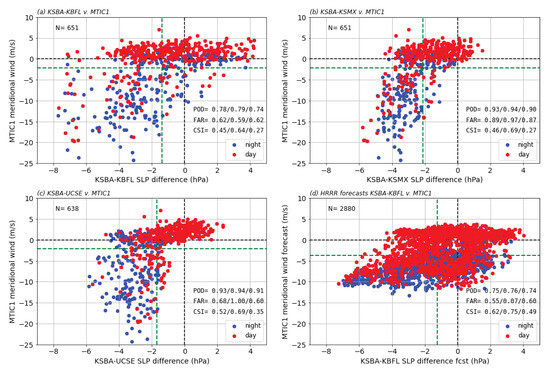
Figure 6.
(a–c) Scatter plots of MTIC1 meridional wind component (m ) vs. SLP difference (hPa) for KSBA-KBFL, KSBA-KSMX, and KSBA-UCSE, respectively. (d) HRRR-forecasted meridional wind component at MTIC1 and KSBA-KBFL SLP difference. Dashed green lines indicate mean values. Markers are red for daytime (SW radiation > 0) and blue for nighttime (SW radiation = 0) observations. Values provided for POD, FAR, and CSI represent all/night/day hours.
For the KBFL SLP, there is a modest POD (0.78/0.79/0.74 for all/night/day hours) but also a very sizable FAR (≈0.60). Additionally, the quantitative relationship between the strength of the downslope flow and the magnitude of the SLP pressure difference is quite weak, evidenced by the wide scattering. For KSMX (Figure 6b), the POD is much higher but false alarms are even more common, making the CSI no better there than for Bakersfield. There is less scatter in the lower left (offshore) quadrant, but again a clear indication that the magnitude of this pressure difference is not very informative, at least in the hour-to-hour comparison. The best relationship is found with the KSBA-UCSE pressure difference, having the highest POD and CSI of the three SLP calculations. However, false alarm rates are very high, which occurs because offshore pressure differences were much more common than downslope flows at MTIC1.
Figure 7 renders the data from the last figure into composites vs. time of the day (UTC), having been constructed from between 25–28 samples for each April 2022 hour, superimposed on MTIC1-recorded SW. The daily average meridional component at MTIC1 was −2.1 m with mean offshore flow occurring between 01–16 UTC, inclusive. The ±1 standard deviations (gray vertical lines) demonstrate that either offshore or onshore flow was possible at every hour of the day although onshore flow was least common between 08–10 UTC (1–3 AM PDT) and offshore flow rarest around 18 UTC (11 AM PDT). (Obviously, Sundowner wind events were included in this composite).
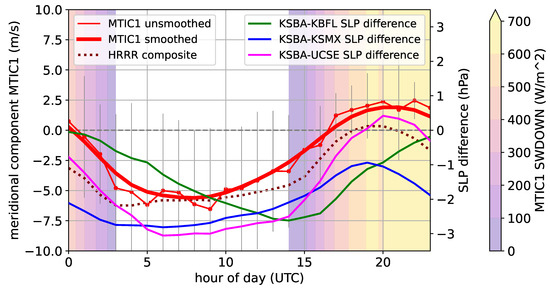
Figure 7.
Monthly composites of observed and HRRR-forecasted MTIC1 meridional wind component (m ) and SLP differences (hPa) between KSBA and KBFL, KSMX, and UCSE. Vertical lines represent ±1 standard deviation for the MTIC1 meridional wind. Color fill represents the monthly composite of SW radiation.
The average SLP is offshore-directed for KSBA-KSMX and KSBA-KBFL for all hours of the day, which helps to explain the large FARs seen in Figure 6. The composite KSBA-UCSE pressure difference does have onshore-directed gradients between 19 and 22 UTC, likely contributing to its relatively higher POD and CSI among station pairings (Figure 6). The KSBA-UCSE and KSBA-KSMX composites were most in phase with MTIC1’s meridional winds. In contrast, the KSBA-KBFL SLP was clearly out of phase, lagging the winds by about 6 h, which was not expected. Note also the diurnal SLP amplitudes were large (3.5 hPa for UCSE, 2.6 hPa for KBFL, and 1.9 hPa for KSMX) relative to the magnitudes of the day-to-day variations seen in Figure 4.
For Figure 8, the hourly composites have been subtracted from the meridional winds and SLP values shown in Figure 6, creating diurnal deviations and SLP′. For KSBA-KBFL, this has dramatically improved the skill, raising POD to 0.90 at night and reducing FAR to 0.30. The differences in diurnal phasing between this pressure difference and the winds were limiting its skill in identifying the meridional wind direction. However, for the other two station pairs, removing the diurnal cycle made the relationship weaker. At least as far as offshore vs. onshore wind direction is concerned, the KSBA-KBFL station pair appears to be the best, as long as the substantial diurnal variations are adjusted. There remains, however, little information regarding the magnitude of the Montecito offshore flow relative to its mean cycle with this pressure difference.

Figure 8.
As in Figure 6, but expressing meridional wind components (m ) and SLP differences (hPa) as deviations from their respective monthly means.
4. MTIC1 Winds and KSBA-KBFL Pressure Differences during IOPs 1, 2, and 5
The strongest offshore winds in the Montecito area during April 2022 occurred during IOPs 1, 2, and 5, periods that are examined in Figure 9 and Figure 10. Together, IOPs 1 and 2 constituted an extended, multi-day event during which the winds at MTIC1 remained directed offshore for 33 consecutive hours. MTIC1 V (thick red line) became stronger offshore than expected from the composite (thin red line) around 00 UTC on April 5, just before sundown as is characteristic for Sundowners [15,17,21]. The Montecito winds remained offshore through the daylight hours of April 5 and 6 did not return to near-average conditions until around 11 UTC on April 6, and did not turn onshore until a few hours later. At 04 UTC on April 6, the offshore wind component reached 23.6 m of a total wind speed of 24.6 m , with both representing the second fastest of such observations at MTIC1 for April 2022. KSBA-KBFL SLP values became large and negative, both in raw values (gray) and relative to its hourly composite (blue), starting well before the offshore flow developed at MTIC1 and continuing long after onshore flow was re-established, although negative deviation values peaked prior to the offshore flow maximum. Therefore, this pressure difference was suggesting an even more prolonged event at Montecito than actually transpired.
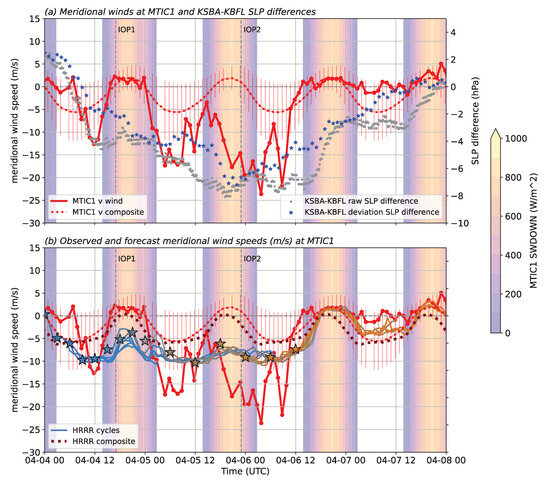
Figure 9.
Time series for period including IOPs 1 and 2 showing MTIC1 meridional wind component (m ) in thick red, with diurnal composite MTIC1 meridional winds and standard deviations (thin red, from Figure 7). (a) Markers show raw and deviation KSBA-KBFL SLP differences (hPa). (b) HRRR forecasts in blue to orange lines, with each star, color fill, and line color representing a different cycle (the star being the cycle’s initialization time). HRRR meridional wind monthly composite (from Figure 7) is depicted as the maroon dotted line. Background color fill in both panels shows observed SW at MTIC1 (W ).
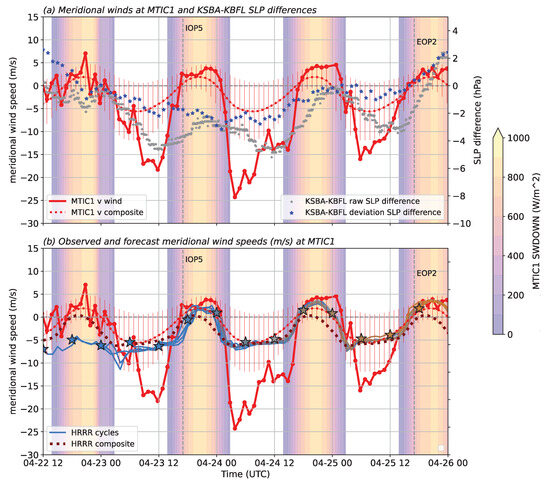
Figure 10.
As in Figure 9, but focusing on the period spanning IOP5.
IOP 5 occurred late in the month (Figure 10). The winds shifted sharply offshore as of the 01:47 UTC observation on 24 April, just before sunset, again characteristic of Sundowners, and remained directed downslope for a total of 16 h, until the 17:47 UTC reading. The offshore wind component reached 24.3 m , of a total wind speed of 25.0 m , representing the station’s fastest values of both quantities for the month. As was the case with IOPs 1 and 2, the KSBA-KBFL SLP values were negative through the downslope episode, starting before the onset of northerly winds at MTIC1 and continuing after onshore flow returned. However, the raw and deviation pressure differences were smaller than during the early April episode, despite the winds becoming stronger during the event peak, and the MTIC1 winds followed the diurnal composite more closely in phase (if not in magnitude).
5. HRRR Forecasts during April 2022
Figure 7 also reveals that the HRRR (maroon dotted line) successfully captured the diurnal variation of meridional winds at MTIC1 during April 2022 with a correlation of r = 0.93. This composite made use of a total of 60 simulations starting at 00 and 12 UTC for forecast hours 1 through 24, inclusive, even though for those cycles the HRRR was integrated for 48 h. HRRR 10-m V forecasts were interpolated to the station location and a neutral log wind profile employing the relevant grid box’s surface roughness was used to compensate for the station’s anemometer mounting height of 6.1 m AGL [6].
This left a forecast bias of about −1.5 m (offshore). The composite possesses mean northerly winds for all but 2 h of the day, so simulated winds at MTIC1 were directed downslope too frequently. This is consistent with Figure 5c,d, which demonstrates that daytime offshore flow was significantly more common in the model than in the observations. Onshore flow, when it occurred, was weaker in magnitude than expected from the wind-SW relationship seen in the station data (Figure 5a) but apparently with the correct timing.
Figure 5c,d also appear to suggest that solar radiation received at MTIC1 was being overpredicted by the HRRR, by an amount exceeding the time difference between the HRRR forecasts (on the hour) and the RAWS observations (13 min before the hour) could explain. Solar radiation can be expected to be influenced by the slope of the surface [38], but MTIC1 appears to be situated atop a hill and the HRRR model does not incorporate slope or terrain shading effects in its radiation calculations (Joseph Olson, personal communication, 2023). We note that [39,40] found positive biases in downward shortwave radiation in HRRR versions 3 and 4, respectively, even on relatively clear days. That being said, the accuracy of the station observations is not known and the combination of positive shortwave and offshore wind biases seems odd.
More importantly, Figure 9b and Figure 10b reveal the HRRR had a relatively limited ability to anticipate the observed evolution of the winds, especially during strong downslope events. For these figures, many different HRRR cycles are superimposed, with the initialization time for each cycle denoted by the large star. Strikingly, there was little variation of the winds, not only with respect to the hour of the day during the offshore events but also among HRRR cycles.
During IOPs 1 and 2 (Figure 9b), for example, the HRRR forecasted persistently offshore winds over an extended period, even during daytime hours for which onshore flow was observed at Montecito. At night, the offshore flow was predicted to be stronger than the diurnal composite (maroon dashed line) but was still not as strong as was observed. For the IOP 5 period (Figure 10b), the model captured the daytime onshore flow well but failed to provide guidance regarding the strength of the offshore flow that appeared during the night. For most of the event, the HRRR did not signal the development of northerly winds any faster than would have been anticipated from the diurnal composite (maroon dotted line), thus failing to identify the strongest downslope winds of the entire month. Again, successive cycles of the HRRR provided very similar forecasts.
For Figure 11a–c, HRRR forecasts from 00 and 12 UTC cycles were merged with MTIC1 hourly observations and KSBA-KBFL pressure differences. MTIC1 observations (13 min prior to the hour) were matched with SLP difference forecasts valid at the top of the hour. Only hours with complete data were retained, numbering 2536 records. For most hours, there were 4 forecasts for each observation, two each from the 00 and 12 UTC cycles, as both extended out to 48 h.
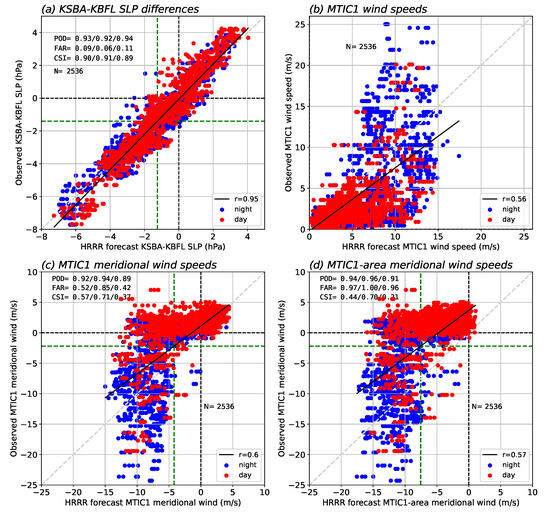
Figure 11.
(a) KSBA-KBFL observed vs. HRRR forecast SLP differences (hPa) for April 2022. (b) MTIC1 observed vs. HRRR forecast wind speeds (m ). (c) MTIC1 observed vs. HRRR forecast meridional wind components. (d) MTIC1 observed vs. HRRR “Montecito area” (region depicted in Figure 2b) forecast meridional wind components. Dashed green lines represent mean values, with black lines representing least squares fits. Markers are red for daytime (SW radiation > 0) and blue for nighttime (SW radiation = 0) values. Values provided for POD, FAR, and CSI represent all/night/day hours.
Figure 11a reveals that the HRRR was very skillful (r = 0.95) at anticipating the KSBA-KBFL raw SLP, both during day (red) and night (blue) hours. Regarding the sign of the SLP difference, the POD was 0.93 for all hours with a FAR of less than 10%. This skill did not extend to anticipating wind speeds at MTIC1 (Figure 11b), however. While there is a modest positive relationship overall, forecasts exceeding about 5 m demonstrate no useful association with observed wind speed. The HRRR predicted wind speeds in the range 7–14 m irrespective of the actual values, which varied over a much larger range. This is consistent with what was seen in Figure 9b and Figure 10b for IOPs 1,2, and 5.
The large observed wind speeds were mainly offshore-directed and at night (Figure 11c). However, the model did not provide much useful quantitative guidance regarding wind speeds during downslope wind periods, again consistent with Figure 9b and Figure 10b. A clear negative (offshore) bias is also seen in that the mean HRRR offshore flow was stronger than observed, despite not capturing any of the fastest downslope winds. This is in agreement with the model diurnal composite presented in Figure 7. Model performance at AV377 was even more disappointing (not shown).
An issue with pointwise forecasts is that they can miss small but potentially irrelevant shifts in spatial patterns, and this concern has motivated verification strategies such as the Fractions Skill Score [41]. To assess this, we elected to create an “MTIC1-area” forecast in the following fashion. If the HRRR predicted −5 m at Montecito, the prediction was replaced with the most strongly offshore V forecast found in the area marked by the white rectangle in Figure 2a and shown in the figure’s other two panels, based on the idea that the strongest offshore flow could have been spatially misplaced. This resulted in only a slightly improved forecast, as seen in Figure 11d.
6. Influence of Resolution on MTIC1 Forecasts
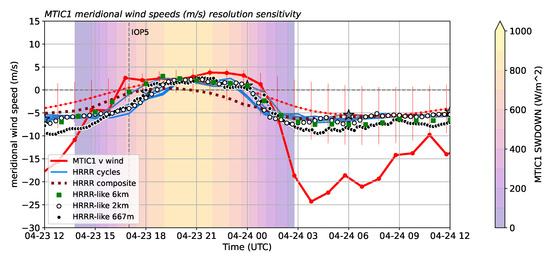
The HRRR forecasts for MTIC1 shown above do not exhibit much skill with respect to identifying periods of particularly strong winds at the Montecito RAWS (e.g., Figure 11). During IOP5 (Figure 10), for instance, the winds predicted for MTIC1 did not deviate much from the month-long composites, which included many non-windstorm hours. A possible explanation is the model’s 3 km grid spacing, which is coarse relative to the spatial scale of the SYM, but [15,18,23], in particular, have demonstrated that higher-resolution simulations can still have difficulty making accurate forecasts of Sundowner strength and structure. Nevertheless, in this section, we examine simulations of IOP5 conducted with a near-clone of the HRRR, made using its same WRF configuration. Our WRF simulations used version 4.2.2, employed physics options consistent with HRRR version 4, were focused on the U.S. West Coast, and featured domains with grid spacings of 6, 2, and 0.667 km (Figure 12). They were initialized with HRRR forecasts on native model levels from the 12 UTC 22 April 2022 cycle, and this cycle also provided the boundary conditions.
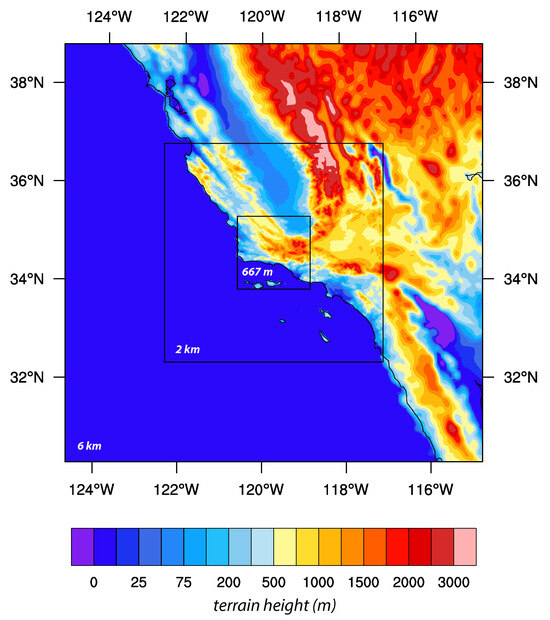
Figure 12.
Telescoping WRF model domain configuration of 3 nested domains at 6, 2, 0.667 km horizontal resolution respectively with terrain height shaded.
Figure 13 shows vertical cross-sections oriented south-north across MTIC1 representing the 16 h forecast valid 04 UTC on 24 April, during IOP5 and at the time of peak winds observed at MTIC1 (e.g., Figure 10). Panels (a), (c), and (d) represent clone runs while (b) is the operational HRRR forecast interpolated onto our 2 km domain. All four panels reveal a substantial downslope windstorm in progress, as evidenced by strong winds (colored field) and downward-sloping isentropes (black contours). When only the outermost (6 km) domain was active (Figure 13a), the terrain shape was quite smooth but downslope winds were still predicted across MTIC1. With progressively finer grid spacing, the SYV emerged and the south-facing slope of the SYM became steeper. The flow also started following the contour of the SYM more closely but did not become particularly faster.
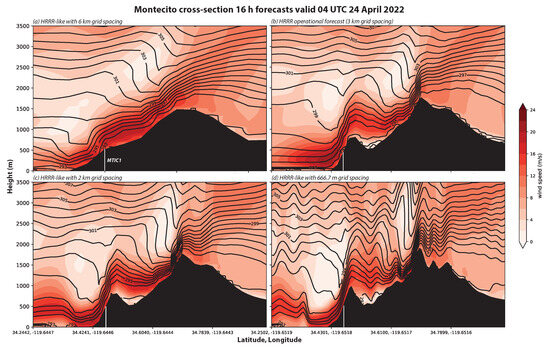
Figure 13.
North−south vertical cross section across MTIC1 of 16 h forecasts from WRF HRRR clone simulations at (a) 6 km (c) 2 km, and (d) 0.667 km horizontal resolution and (b) operational HRRR forecast valid at 04 UTC 24 April 2022. Wind speed is shown in color fill and potential temperature in contours (isentropes). The model terrain is shown in black with the white vertical line denoting the location MTIC1 along the cross-section.
The latter statement is demonstrated in Figure 14, a modified version of Figure 10b with MTIC1 meridional wind speed forecasts from the resolution experiments superimposed. The 6 and 2 km runs (green squares and white circles, respectively) generated very similar predictions as the operational HRRR cycle that provided the initialization. Decreasing the grid spacing to 666.7 m (black circles), as was employed in our prior WRF-based windstorm studies, e.g., [6,42,43], allowed for finer detail in the wind and temperature fields to be resolved in the downslope flow (Figure 13d) but did not result in significantly stronger winds above the Montecito RAWS. Again, and importantly, the predicted speeds did not differ much from the HRRR composite of all hours and, as a consequence, did not raise alarms. Substantially further refined grid spacing might be able to render the topography around the station better and may lead to more accurate forecasts, but such fine grid spacing is currently unfeasible for an operational CONUS-scale model. In the next section, we pursue a different path towards obtaining useful forecasts from real-time forecasts.
7. A Statistical Model for Strong Offshore Flow at Montecito
The documented difficulty of numerical models in representing strong winds in the Montecito area motivates a closer examination of using SLP differences to anticipate Sundowner wind episodes. As noted above, the National Weather Service office that covers the Santa Barbara area uses these pressure differences in their Sundowner wind forecasting, and Figure 11a shows that the HRRR is very skillful in predicting them. We will soon show that MLWPs, such as GraphCast [31], are also good at prognosing SLPs and their gradients. As noted above, GC provides six-hourly forecasts of SLP (among other variables) on a global 0.25° latitude/longitude grid, and it can generate 10-day forecasts in a matter of minutes.
Thus, we reconsider Figure 6a’s naive classification of offshore flow at MTIC1 based on the sign of the KSBA-KBFL pressure difference with logistic regression, one of many strategies that could be applied, emphasizing hours having faster northerly winds. Results are summarized in Table 1. For Model no. 1, the binary variable STRONG was defined as zero unless the offshore component at MTIC1 for the hour exceeded 9 m , representing a sustained wind of at least 20 mph and associated with gusts averaging about 17 m or 38 mph. This threshold isolated 98 (15%) of the 651 available hours during April 2022, which seems a reasonable balance between the strength of winds and the frequency of events. The logistic regression model predicting STRONG from observed values of KSBA-KBFL SLP, SW radiation recorded at MTIC1, and UTC hour of day (HOD), yielded the receiver operating characteristic (ROC) curve shown in Figure 15, which had an area under the curve of 0.90 (from a maximum value of 1.0). All three regressors were found to be highly significant by the standard Wald test.

Table 1.
Results of logistic regression model for strong offshore flow at MTIC1. ROC = receiver operating characteristics; POD = probability of detection; FAR = false alarm rate; CSI = critical success index; PC = proportion correct; and F1 = F1 score.
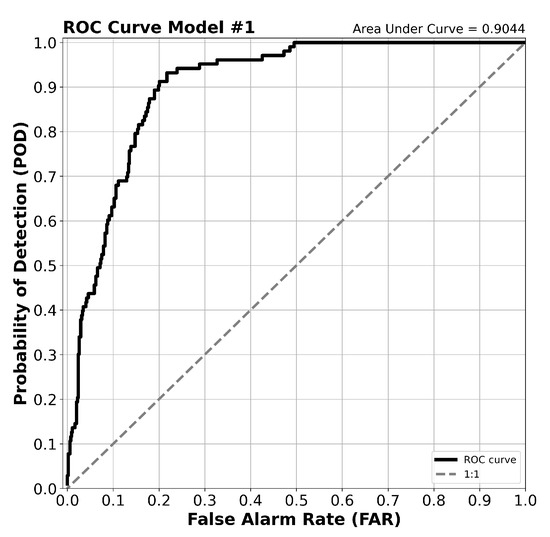
Figure 15.
ROC (receiver operating characteristic) curve showing the performance of Model no. 1. y-axis represents true positives (“Sensitivity”), and the x-axis represents false positives (“1-Specificity”). Each step in the curve represents a different threshold value for the model.
The predicted values of STRONG are probabilities ranging between 0 and 100%. At this point, a threshold probability is selected to assess POD, FAR, and other skill measures. There is no single choice for the optimal threshold, as it depends on one’s need for awareness (high POD) vs. tolerance for false alarms. We adopted the frequently employed Youden index [44], which tends to penalize missed events and false alarms. For Model no. 1, the Youden cutoff of ≈18% resulted in a POD of 0.93 and a FAR of 0.22. This model applies to all hours and is thus superior to the naive classification (Figure 6a) based solely on SLP difference and is more useful as it focuses on the most concerning offshore winds. The common “top left” criterion yielded very similar cutoffs (not shown); other metrics such as the Critical Success Index (or threat score), F1 score [45], and proportion correct, pointed to thresholds yielding lower values of both POD and FAR (not shown).
Of the three independent variables in this model, obviously the most important is KSBA-KBFL SLP. A model with this term alone produced an ROC area of 0.83, a POD of 0.92, and a FAR of 0.38 at the Youden-identified threshold of 13%. However, about 64% of that version’s false alarms occurred during daytime, versus 38% for the full model. Adding either the HOD or SW variables to the model increased the POD to 0.96 and reduced the FAR to ≈0.28, both yielding ROC areas of about 0.89. As one would suspect, HOD and SW are moderately correlated (r = 0.57). Thus, the Model no. 1 result shows that incorporating one or both terms serves mainly to suppress the false alarm rate, especially during daylight hours, at least for the model employing the Youden cutoff probability. A case could be made for excluding one of the non-SLP variables from the model if POD is to be prioritized.
Model no. 2 predicts meridional deviations () from the month’s diurnal composite instead, and the STRONG threshold was redefined to be −5 m , which also occurred for 98 h (15%) during the month. Stepwise regression selected deviation SLP′ and SW, excluding HOD, which did not contribute significantly to the 3-regressor model. The results were quite similar to Model no. 1, yielding a nearly identical ROC area (0.91) and curve (not shown), along with POD = 0.95 and FAR = 0.22 for the Youden-identified threshold (15%). Without SW in the model, the FAR was considerably higher (0.42). Recall from Figure 7 that the KSBA-KBFL SLP and MTIC1 V were out of phase. The HOD term in Model no. 1 appears to have adequately compensated for this phase difference in Model no. 1, resulting in an equally skillful but more easily applied algorithm.
Table 1 also presents versions of Models no. 1 and no. 2 employing HRRR-generated forecasts for SLP and SW at MTIC1 in place of observed values. The predictions are only slightly less skillful than their counterparts using observations, indicating that the HRRR’s forecasts can provide useful guidance regarding the development of strong offshore flow in the Montecito area via either logistic model. At this writing, HRRR forecasts only extend as far as 48 h but we note the algorithm could also be applied to longer-range forecasts from other operational NWP models (such as the GFS and GEFS) and even machine learning models like GC to gain situational awareness. Model resolution is a potential limiting factor but, given the ≈130 km distance between Bakersfield and Santa Barbara, it is probably not a very serious one.
Indeed, Figure 16 demonstrates that GC provides KSBA-KBFL SLP differences that are just as skillful as those from the HRRR. One GC run per day was created at 12 UTC, initialized with operational analyses from the ECMWF IFS, and integrated for 60 h, resulting in the overlapping forecasts shown in the figure. While the MLWP model does not capture the very largest differences this did not severely impact the logistic model’s performance, as revealed in Table 1, which shows that the algorithm applied to GC forecasts is competitive with the other models and data sources. That being said, there are limitations. In addition to only providing forecasts at 6 h intervals, GC neither predicts SW radiation received at the ground nor provides sufficient fields to estimate it, so radiation information must be provided by another source. For the predictions evaluated herein, we used the SW forecasts provided by the HRRR.
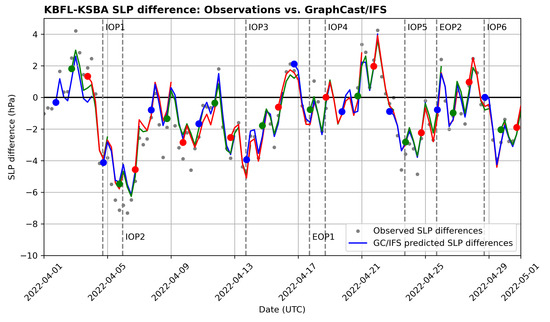
Figure 16.
Time series of observed (gray markers) and GraphCast-predicted KSBA-KBFL SLP differences, at a temporal spacing of 6 h. GC forecasts commenced daily at 12 UTC with IFS analyses and were integrated for 60 h. Colored circles indicate each GC run’s first forecast. Vertical dash lines indicate official IOP and EOP start times.
To assess the robustness of this approach, and recognize that Sundowners are year-round phenomena, including severe summer and winter events [13,14], we applied Model no. 1 to observations collected during other months and years. Included were the months of November in 2008 (Tea fire), 2019 (Cave fire), 2022, and Sundowner peak (March-May) months from other years, among others. Among the approximately 6000 additional hours tested, the logistic model predictions attained a still-reasonable POD of about 0.76 against a similar FAR of 0.22 (not shown). An even more skillful statistical model could likely have been obtained had it been trained against observations other than April 2022 and/or through the incorporation of other variables suspected to be relevant (i.e., cold air advection, winds aloft, and/or the presence and character of temperature inversions; [13]) to Sundowners. For our purposes, it suffices to demonstrate this procedure we have outlined has merit, and the KSBA-KBFL SLP difference, as modulated by solar radiation and hour-of-day information, yields a skillful model for anticipating strong offshore wind threats at this RAWS station.
8. Summary and Conclusions
Sundowner winds in the Santa Barbara, California, area are associated with substantially elevated fire danger [16,18]. Predicting the onset of these potentially hot, dry, and strong downslope winds is crucial for fire preparedness and risk mitigation [16]. In particular, the fire-prone Montecito area of the eastern Santa Ynez Mountain (SYM) experiences Sundowners that start just after sunset [17,21]. The fastest recorded sustained winds and gusts in that area during the SWEX campaign were about 28 and 37 m , respectively, the latter being reported from RAWS station MTIC1, located on the coast-facing slope of the SYM. Both occurred during April 2022, the focus of this study.
In Montecito, owing to the west–east orientation of the SYM, downslope Sundowner winds are north to northeasterly. At MTIC1, which reports hourly, 44% of the winds were from the north, mainly at night and around sunset in keeping with the “Sundowner” name. About 15% of the time, the sustained offshore flow exceeded 9 m , which we adopted as a threshold for wind speeds of particular interest.
In the past, SLP gradients between coastal Santa Barbara (KSBA) and inland locations—such as Bakersfield (KBFL)—have been used by skilled NWS forecasters to anticipate Sundowner occurrence and intensity. However, we have shown that these gradients by themselves offer only modest predictive skills at MTIC1 with a high false alarm rate (FAR) for offshore wind occurrence and limited information relating to wind magnitude. For the two strong Sundowner events we examined in detail, the temporally extensive IOPs 1 and 2 and also IOP 5, the offshore KSBA-KBFL SLP gradients preceded the onset of downslope winds and/or extended well past their cessation. As could be expected, SLP gradients manifested a pronounced diurnal cycle, and in the monthly composite, the peak offshore KSBA-KBFL differences also trailed the maximum northerly winds by roughly 6 h.
We also analyzed wind forecasts for MTIC1 from the operational High-Resolution Rapid Refresh (HRRR) model. Although the HRRR reproduced the diurnal variation of the meridional flow at this RAWS station quite well (albeit with a small tendency towards excessive offshore flow), we found the model’s skill in predicting the magnitude of the winds at MTIC1 for individual hours and the timing of downslope flow onset and cessation there to be limited. The HRRR model largely failed to differentiate between a strong windstorm with sustained wind speeds exceeding 22.5 m (50 mph) and an average windstorm with sustained winds at approximately 10 m . Improving upon the HRRR’s spatial resolution with WRF-based simulations configured similarly to the HRRR did not improve the wind forecasts. Additionally, and of some concern, the HRRR forecasts of the windstorm exhibited surprisingly minor variations among initialization times, with trivial improvement in forecast skill with decreased lead time. However, while the HRRR does not predict wind speeds at MTIC1 well, it does provide skillful forecasts of KSBA-KBFL SLP gradients, with high Probability of Detection (POD) and low FAR over April.
Finally, to help provide better situational awareness regarding the development of strong Sundowner winds, we developed a simple logistic regression model predicting meridional wind components exceeding a set threshold at MTIC1 using observed KSBA-KBFL SLP gradients, downward shortwave radiation (SW), and hours of the day (HOD). This easily applied algorithm (“Model no. 1”) yielded high POD (>0.93) and acceptable FAR (≈0.22), even when applied to HRRR forecasts of the independent variables, significantly improving on the use of the SLP gradient alone. The two additional terms helped suppress false alarms during the daytime and compensated for the temporal phase difference between the SLP gradient and the offshore flow noted above. We also successfully used SLP forecasts from the machine learning model GraphCast [31], which can efficiently make skillful medium-range predictions, although an independent source of solar radiation information is necessary.
The robustness of this algorithm was tested against an additional 6000 h, representing other years and seasons, still yielding reasonable POD (0.76) and FAR (0.22) values. This represents a proof of concept that, with further refinement, could provide even better awareness regarding strong Sundowner episodes using either observations or skillfully forecasted model variables.
Author Contributions
Both authors contributed to all aspects of the manuscript. All authors have read and agreed to the published version of the manuscript.
Funding
This research was supported by National Science Foundation grant no. 1921546.
Institutional Review Board Statement
Not applicable.
Informed Consent Statement
Not applicable.
Data Availability Statement
HRRR model outputs were obtained from Amazon Web Services; see https://registry.opendata.aws/noaa-hrrr-pds/ (accessed 1 June 2022). ECMWF IFS analyses were downloaded from the Research Data Archive at the National Center for Atmospheric Research (https://rda.ucar.edu/ (accessed 1 February 2024). MADIS observations were obtained via https://madis-data.ncep.noaa.gov (accessed 1 June 2022). SWEX observations were provided by the field program’s catalog hosted by NCAR’s Earth Observing Laboratory (http://catalog.eol.ucar.edu/swex) (accessed 1 June 2022–1 August 2023). The WRF model homepage is (https://www.mmm.ucar.edu/models/wrf). The GraphCast package was obtained from https://github.com/google-deepmind/graphcast (accessed 1 December 2023). The fire information shown in Figure 1 can be found at https://catalog.data.gov/dataset/national-interagency-fire-occurrence-sixth-edition-1992-2020-feature-layer (accessed 1 April 2024).
Conflicts of Interest
The authors declare no conflicts of interest.
Abbreviations
The following abbreviations and acronyms are used in this manuscript:
| AGL | Above Ground Level |
| ARW | Advanced Research WRF |
| ASOS | Automated Surface Observing System |
| AWOS | Automated Weather Observing System |
| CONUS | Conterminous United States |
| CSI | Critical Success Index |
| CWOP | Citizen Weather Observer Program |
| ECMWF | European Centre for Medium-range Weather Forecasts |
| FAR | False Alarm Rate |
| GC | GraphCast |
| GFS | Global Forecast System |
| GEFS | Global Ensemble Forecast System |
| HOD | Hour of day |
| HRRR | High-Resolution Rapid Refresh model |
| IFS | Integrated Forecast System |
| MADIS | Meteorological Assimilation Data Ingest System |
| MLWP | Machine learning weather prediction |
| MSL | Mean Sea Level |
| NCEI | National Centers for Environmental Information |
| NOAA | National Oceanic and Atmospheric Administration |
| NWS | National Weather Service |
| PC | Proportion Correct |
| POD | Probability of Detection |
| RAWS | Remote Automated Weather Stations |
| ROC | Receiver Operating Characteristics |
| SLP | Sea Level Pressure |
| SW | Shortwave radiation |
| SYM | Santa Ynez Mountains |
| SYV | Santa Ynez Valley |
| WRF | Weather Research and Forecasting |
| WMO | World Meteorological Organization |
References
- Abatzoglou, J.T.; Williams, A.P. Impact of anthropogenic climate change on wildfire across western US forests. Proc. Natl. Acad. Sci. USA 2016, 113, 11770–11775. [Google Scholar] [CrossRef]
- Durran, D.R. Downslope winds. In Encyclopedia of Atmospheric Sciences; North, G.R., Pyle, J.A., Zhang, F., Eds.; Elsevier Science: Amsterdam, The Netherlands, 2003; pp. 644–650. [Google Scholar]
- Zängl, G.; Chimani, B.; Häberli, C. Numerical simulations of the foehn in the Rhine Valley on 24 October 1999 (MAP IOP 10). Mon. Weather Rev. 2004, 132, 368–389. [Google Scholar] [CrossRef]
- Conil, S.; Hall, A. Local regimes of atmospheric variability: A case study of Southern California. J. Clim. 2006, 19, 4308–4325. [Google Scholar] [CrossRef]
- Sharples, J.J.; Mills, G.A.; McRae, R.H.D.; Weber, R.O. Foehn-like winds and elevated fire danger conditions in Southeastern Australia. J. Appl. Meteor. Climatol. 2010, 49, 1067–1095. [Google Scholar] [CrossRef]
- Cao, Y.; Fovell, R.G. Downslope windstorms of San Diego County. Part I: A case study. Mon. Weather Rev. 2016, 144, 529–552. [Google Scholar] [CrossRef]
- Rolinski, T.; Capps, S.B.; Zhuang, W. Santa Ana winds: A descriptive climatology. Weather Forecast. 2019, 34, 257–275. [Google Scholar] [CrossRef]
- McClung, B.; Mass, C.F. The strong, dry winds of Central and Northern California: Climatology and synoptic evolution. Weather Forecast. 2020, 35, 2163–2178. [Google Scholar] [CrossRef]
- Mass, C.F.; Ovens, D. The synoptic and mesoscale evolution accompanying the 2018 Camp Fire of Northern California. Bull. Am. Meteor. Soc. 2021, 10, 168–192. [Google Scholar] [CrossRef]
- da Rosa, C.E.; Stefanello, M.; Facco, D.S.; Roberti, D.R.; Rossi, F.D.; Nascimento, E.D.L.; Degrazia, G.A. Regional-scale meteorological characteristics of the Vento Norte phenomenon observed in Southern Brazil. Environ. Fluid Mech. 2022, 22, 819–837. [Google Scholar] [CrossRef]
- Fovell, R.G.; Brewer, M.J.; Garmong, R.J. The December 2021 Marshall fire: Predictability and gust forecasts from operational models. Atmosphere 2022, 13, 765. [Google Scholar] [CrossRef]
- Mass, C.; Ovens, D. The meteorology of the August 2023 Maui wildfire. Weather Forecast. 2024, in press. [CrossRef]
- Ryan, G. Downslope Winds of Santa Barbara, California. National Weather Service, NOAA Tech. Doc. WR-240, p. 44. Available online: https://repository.library.noaa.gov/view/noaa/14746 (accessed on 1 April 2023).
- Blier, W. The Sundowner winds of Santa Barbara, California. Weather Forecast. 1998, 13, 702–716. [Google Scholar] [CrossRef]
- Carvalho, L.; Duine, G.J.; Jones, C.; Zigner, K.; Clements, C.; Kane, H.; Gore, C.; Bell, G.; Gamelin, B.; Gomberg, D.; et al. The Sundowner Winds Experiment (SWEX) pilot study: Understanding downslope windstorms in the Santa Ynez Mountains, Santa Barbara, California. Mon. Weather Rev. 2020, 148, 1519–1539. [Google Scholar] [CrossRef]
- Zigner, K.; Carvalho, L.M.V.; Jones, C.; Benoit, J.; Duine, G.J.; Roberts, D.; Fujioka, F.; Moritz, M.; Elmquist, N.; Hazard, R. Wildfire risk in the complex terrain of the Santa Barbara wildland–urban interface during extreme winds. Fire 2022, 5, 138. [Google Scholar] [CrossRef]
- Sukup, S. Extreme northeasterly wind events in the hills above Montecito, California. Western Region Tech. Attachment NWS WR-1302, p. 21. National Weather Service Western Region: Salt Lake City, UT, USA. Available online: https://www.weather.gov/media/wrh/online_publications/talite/talite1302.pdf (accessed on 1 April 2023).
- Cannon, F.; Carvalho, L.M.V.; Jones, C.; Hall, T.; Gomberg, D.; Dumas, J.; Jackson, M. WRF simulation of downslope wind events in coastal Santa Barbara County. Atmos. Res. 2017, 191, 57–73. [Google Scholar] [CrossRef]
- Smith, C.; Hatchett, B.; Kaplan, M. Characteristics of Sundowner winds Near Santa Barbara, CA, from a dynamically downscaled climatology: Environment and effects aloft and offshore. J. Geophys. Res. Atmos. 2018, 123, 13092–13110. [Google Scholar] [CrossRef]
- Smith, C.; Hatchett, B.; Kaplan, M. Characteristics of Sundowner winds near Santa Barbara, California, from a dynamically downscaled climatology: Environment and effects near the surface. J. Appl. Meteor. Clim. 2018, 57, 589–606. [Google Scholar] [CrossRef]
- Jones, C.; Carvalho, L.M.V.; Duine, G.J.; Zigner, K. Climatology of Sundowner winds in coastal Santa Barbara, California, based on 30 yr high resolution WRF downscaling. Atmos. Res. 2021, 249, 105305. [Google Scholar] [CrossRef]
- Keeley, J.M.; Syphard, A.D. Historical patterns of wildfire ignition sources in California ecosystems. Int. J. Wildland Fire 2018, 27, 781–799. [Google Scholar] [CrossRef]
- Duine, G.-J.; Jones, C.; Carvalho, L.M.V.; Fovell, R.G. Simulating Sundowner winds in coastal Santa Barbara: Model validation and sensitivity. Atmosphere 2019, 10, 155. [Google Scholar] [CrossRef]
- Carvalho, L.M.; Duine, G.J.; Clements, C.; De Wekker, S.F.; Fernando, H.J.; Fitzjarrald, D.R.; Fovell, R.G.; Jones, C.; Wang, Z.; White, L.; et al. The Sundowner Winds Experiment (SWEX) in Santa Barbara, CA: Advancing understanding and predictability of downslope windstorms in coastal environments. Bull. Am. Meteor. Soc. 2024, 105, E532–E558. [Google Scholar] [CrossRef]
- Hatchett, B.J.; Smith, C.M.; Nauslar, N.J.; Kaplan, M.L. Brief Communication: Synoptic-scale differences between Sundowner and Santa Ana wind regimes in the Santa Ynez Mountains, California. Nat. Hazards Earth Syst. Sci. 2018, 2, 419–427. [Google Scholar] [CrossRef]
- Short, K.C. Spatial Wildfire Occurrence Data for the United States, 1992–2020, 6th ed.; FPA_FOD_20221014; Forest Service Research Data Archive: Fort Collins, CO, USA, 2022. [Google Scholar] [CrossRef]
- Skamarock, W.C.; Klemp, J.B.; Dudhia, J.; Gill, D.O.; Barker, D.M.; Duda, M.G.; Huang, X.-Y.; Wang, W.; Powers, J.G. A Description of the Advanced Research WRF Version 3; NCAR Tech. Note NCAR/TN-475+STR; National Center for Atmospheric Research: Boulder, CO, USA, 2008; p. 113. [Google Scholar] [CrossRef]
- Skamarock, W.C.; Klemp, J.B.; Dudhia, J.; Gill, D.O.; Liu, Z.; Berner, J.; Wang, W.; Powers, J.G.; Duda, M.G.; Barker, D.M.; et al. A Description of the Advanced Research WRF Version 4; NCAR Tech. Note NCAR/TN-556+STR; National Center for Atmospheric Research: Boulder, CO, USA, 2019; p. 145. [Google Scholar] [CrossRef]
- Dowell, D.C.; Alexander, C.R.; James, E.P.; Weygandt, S.S.; Benjamin, S.G.; Manikin, G.S.; Blake, B.T.; Brown, J.M.; Olson, J.B.; Hu, M.; et al. The High-Resolution Rapid Refresh (HRRR): An hourly updating convection-allowing forecast model. Part 1: Motivation and system description. Weather Forecast. 2022, 37, 1371–1395. [Google Scholar] [CrossRef]
- James, E.P.; Alexander, C.R.; Dowell, D.C.; Weygandt, S.S.; Benjamin, S.G.; Manikin, G.S.; Brown, J.M.; Olson, J.B.; Hu, M.; Smirnova, T.G.; et al. The High-Resolution Rapid Refresh (HRRR): An hourly updating convection-allowing forecast model. Part II: Forecast performance. Weather Forecast. 2022, 37, 1397–1417. [Google Scholar] [CrossRef]
- Lam, R.; Sanchez-Gonzalez, A.; Willson, M.; Wirnsberger, P.; Fortunato, M.; Alet, F.; Ravuri, S.; Ewalds, T.; Eaton-Rosen, Z.; Hu, W.; et al. Learning skillful medium-range global weather forecasting. Science 2023, 382, 1416–1421. [Google Scholar] [CrossRef] [PubMed]
- Hersbach, H.; Bell, B.; Berrisford, P.; Hirahara, S.; Horányi, A.; Muñoz-Sabater, J.; Nicolas, J.; Peubey, C.; Radu, R.; Schepers, D.; et al. The ERA5 global reanalysis. Quart. J. Roy. Meteor. Soc. 2020, 146, 1999–2049. [Google Scholar] [CrossRef]
- Horel, J.; Splitt, M.; Dunn, L.; Pechmann, J.; White, B.; Ciliberti, C.; Lazarus, S.; Slemmer, J.; Zaff, D.; Burks, J. MesoWest: Cooperative mesonets in the western United States. Bull. Am. Meteor. Soc. 2002, 83, 211–226. [Google Scholar] [CrossRef]
- World Meteorological Organization. Guide to Meteorological Instruments and Methods of Observation; WMO Tech. Doc. 8; WMO: Geneva, Switzerland, 2018; p. 573. Available online: https://library.wmo.int/idurl/4/41650 (accessed on 1 September 2021).
- Harper, B.A.; Kepert, J.D.; Ginger, J.D. Guidelines for Converting between Various Wind Averaging Periods in Tropical Cyclone Conditions; WMO Tech. Doc. TD-1555; WMO: Geneva, Switzerland, 2010; p. 64. Available online: https://www.wmo.int/pages/prog/www/tcp/documents/WMO_TD_1555_en.pdf (accessed on 15 August 2018).
- Fovell, R.G.; Gallagher, A. An evaluation of surface wind and gust forecasts from the High-Resolution Rapid Refresh model. Weather Forecast. 2022, 37, 1049–1068. [Google Scholar] [CrossRef]
- Wilks, D.S. Statistical Methods in the Atmospheric Sciences; International Geophysics Series; Academic Press: Cambridge, MA, USA, 2011; Volume 100, 704p. [Google Scholar]
- Whiteman, C.D.; Allwine, K.J. Extraterrestrial solar radiation on inclined surfaces. Environ. Softw. 1986, 1, 164–169. [Google Scholar] [CrossRef]
- Min, L.; Fitzjarrald, D.R.; Du, Y.; Rose, B.E.J.; Hong, J.; Min, Q. Exploring sources of surface bias in HRRR using New York State Mesonet. J. Geophys. Res. Atmos. 2021, 126, e2021JD034989. [Google Scholar] [CrossRef]
- Lee, T.R.; Leeper, R.D.; WIlson, T.; Fiamond, H.J.; Meyers, T.P.; Turner, D.D. Using the U.S. Climate Reference Network to identify biases in near- and subsurface meteorological fields in the High-Resolution Rapid Refresh (HRRR) weather prediction model. Weather Forecast. 2023, 38, 879–900. [Google Scholar] [CrossRef]
- Roberts, N.M.; Lean, H.W. Scale-selective verification of rainfall accumulations from high-resolution forecasts of convective events. Mon. Weather Rev. 2008, 136, 78–97. [Google Scholar] [CrossRef]
- Cao, Y.; Fovell, R.G. Downslope windstorms of San Diego County. Part II: Physics ensemble analyses and gust forecasting. Weather Forecast. 2018, 33, 539–559. [Google Scholar] [CrossRef]
- Fovell, R.G.; Gallagher, A. Winds and gusts during the Thomas fire. Fire 2018, 1, 47. [Google Scholar] [CrossRef]
- Youden, W.J. Index for rating diagnostic tests. Cancer 1950, 3, 32–35. [Google Scholar] [CrossRef]
- Ting, K.M. Precision and recall. In Encyclopedia of Machine Learning; Sammut, C., Webb, G.I., Eds.; Springer: Berlin/Heidelberg, Germany, 2010; p. 781. [Google Scholar] [CrossRef]
Disclaimer/Publisher’s Note: The statements, opinions and data contained in all publications are solely those of the individual author(s) and contributor(s) and not of MDPI and/or the editor(s). MDPI and/or the editor(s) disclaim responsibility for any injury to people or property resulting from any ideas, methods, instructions or products referred to in the content. |
© 2024 by the authors. Licensee MDPI, Basel, Switzerland. This article is an open access article distributed under the terms and conditions of the Creative Commons Attribution (CC BY) license (https://creativecommons.org/licenses/by/4.0/).
