Article

The Construction and Application of a Model for Evaluating Tourism Climate Suitability in Terraced Agricultural Cultural Heritage Sites: A Case Study of Longji Terraced Fields in China

1
Guilin Tourism University, Guilin 541004, China
2
Guilin University of Electronic Technology, Guilin 541004, China
*
Author to whom correspondence should be addressed.
Atmosphere 2024, 15(7), 756; https://doi.org/10.3390/atmos15070756
Submission received: 25 May 2024 / Revised: 19 June 2024 / Accepted: 20 June 2024 / Published: 24 June 2024
(This article belongs to the Section Climatology)

Abstract

:
As one of the globally significant agricultural cultural heritages, Longji Terraced Fields in Longsheng, Guangxi, China, attract numerous tourists. This study aims to describe the weather phenomena and climate change characteristics of Longji Terraced Fields in recent years to reveal their impact on the tourism economy. Utilizing meteorological station data and considering the actual situation in Longsheng, Guilin, the existing models for evaluating tourism climate comfort are improved. The tourism climate comfort of Longji Terraced Fields from 2002 to 2022 is discussed. The results show that the improved model can better reflect the local situation. The results show that the current Holiday Climate Index and Modified Climate Index for Tourism are not suitable for evaluating the Longji Terraces. Adjustments were made to these indices to account for the high annual precipitation and relative humidity of Longsheng. Combining extensive questionnaire surveys, it was found that the improved evaluation model better reflects tourists’ perceptions of climate comfort. Analysis indicates that when the modified model value is above 70, tourist satisfaction exceeds 80%. The most comfortable tourism periods for the Longji Terraces are August, September, and October, while the least comfortable periods are January, February, and March. This study helps to understand the seasonal variations in tourism climate comfort at Longji Terraced Fields and provides a scientific basis for local tourism industry responses to climate change, thereby increasing tourism revenue.

1. Introduction

As one of the regions in China that pioneered agricultural cultural heritage tourism, Longji Terraced Fields in Guilin, Guangxi, China, was awarded the title of “National Important Agricultural Cultural Heritage” in 2018. Longji Terraced Fields attract a large number of tourists with its unique landforms and rich historical culture, setting an early example for tourism development [1]. This area, characterized by its subtropical monsoon climate with distinct seasons and rugged terrain, possesses abundant ecological and tourism resources [2]. As one of the globally significant agricultural cultural heritages, the ecological tourism development of Longji Terraced Fields not only dynamically protects agricultural cultural heritage but also promotes rural revitalization and poverty alleviation [3].
Weather and climate conditions are important factors influencing tourists’ destination choices and travel seasons [4,5]. In ecological and cultural tourism at agricultural cultural heritage sites, it is essential to fully understand the local climate conditions. The evaluation of climate comfort serves as a crucial indicator for measuring human thermal comfort and plays a significant role in tourism development. Therefore, evaluating the tourism climate comfort of Longji Terraced Fields can not only provide a scientific basis for the tourism industry but also help tourism operators better plan tourism activities, thus achieving better economic and social benefits [6].
Currently, research on the evaluation of tourism climate comfort in Longji Terraced Fields is relatively scarce, especially the analysis of its tourism development suitability from a climatic perspective. This study aims to comprehensively and accurately assess the tourism climate comfort of Longji Terraced Fields by optimizing and analyzing typical models for evaluating tourism climate comfort and considering the actual situation of Longji Terraced Fields. It aims to provide stronger support and a basis for the full utilization of local tourism resources, the scientific planning of the tourism industry, the protection of agricultural cultural heritage, and rural revitalization [7]. This research will also lay a theoretical foundation for future studies on the climate comfort of Longji Terraced Fields tourism areas.

2. Materials and Methods

2.1. Study Location

The Longji Terraced Fields, also known as the Longsheng Terraced Fields, are located in Longji Town, Longsheng County, Guilin City, Guangxi Zhuang Autonomous Region, China. With a history of over 650 years, these terraced fields reach an altitude of up to 1100 m and have a maximum slope of 50 degrees, as shown in Figure 1. Named “Longji” because the mountain ridges resemble a dragon’s backbone, the Longji Terraced Fields have become a popular tourist destination.

2.2. Data Collection

The data required for this study include temperature, precipitation, wind speed, sunshine hours, total cloud cover, and relative humidity. These data were sourced from the daily surface climate data set of the Longsheng observation station, provided by the China Meteorological Data Sharing Service. The time span covers 2002 to 2022, totaling 7120 daily samples. The Longsheng meteorological observation station collects data for the entire Longsheng Terraced Fields area, which is mostly situated at altitudes between 500 and 900 m, where meteorological factors show minimal variation. This study uses monthly intervals and does not conduct a spatial differentiation analysis [8].
To verify the accuracy of the climate evaluation model, tourist perception sampling is necessary. During 2023, questionnaires were administered every three days, covering children, teenagers, and middle-aged and elderly individuals. Since most respondents are tourists, the questionnaire was kept concise and straightforward, focusing on their acceptance of the day’s tourism climate. Respondents only needed to answer “acceptable” or “unacceptable”. This binary response format quickly collected results and improved the reliability of the data [9].

2.3. Data Analysis

For days with missing climate data, a linear growth rate method was used to interpolate and complete the data. For example, if data for 1 October 2003 were missing, values for 1 October from the past 20 years were fitted to estimate the value for that date in 2003. Invalid values were first removed and then completed using the linear growth rate method [10]. Climate comfort evaluation models typically use months as the time unit. Monthly averages of meteorological data over the 20-year period were calculated to determine the mean values of meteorological factors for each month of different years [11].
Daily meteorological data were recorded for the questionnaire dates to calculate the climate comfort index (rounded to the nearest integer). The questionnaire data for days with the same climate comfort index were aggregated to determine the tourist acceptance rate corresponding to different climate comfort index values.

3. Tourism Climate Suitability Models and Optimization

3.1. Model Selection Criteria

Via a review and summary of past literature, typical and widely applied models for evaluating tourism climate comfort were identified, including the Tourism Climate Index (TCI) [12], Climate Index for Tourism (CIT) [13], Beach Climate Index (BCI) [14], Holiday Climate Index (HCI) [15], and Modified Climate Index for Tourism (MCIT) [16]. Table 1 summarizes and organizes the basic formulas, required parameters, difficulty levels, application fields, and scopes of various models. A comparison revealed that different models not only cater to different types of tourist activities but also have their own applicable ranges and required parameters. For example, TCI is suitable for general tourism activities over a large area, while BCI is more applicable to beach tourism, and CIT is suitable for 3S (sun, sand, sea) tourism. MCIT is suitable for some specific tourism activities, whereas HCI is suitable for large-scale holiday tourism activities. Furthermore, different models require different parameters and time scales; for instance, TCI requires meteorological data at monthly or daily scales, including average temperature, maximum temperature, and average relative humidity, whereas CIT requires daily-scale meteorological data, including visual perceptions related to tourism experiences.
In summary, each model for evaluating tourism climate comfort has certain requirements in terms of theory and application regarding the research area and relevant parameters. Therefore, when selecting a model, the actual situation and needs of the research must be fully considered.

3.2. Construction and Analysis of MTCI and MHCI Models

3.2.1. Establishment of Mathematical Models

The main activities conducted at Longji Terraced Fields are outdoor sightseeing activities [17,18]; therefore, the selected models for evaluating climate comfort need to consider not only human thermal comfort but also the potential impacts on physical and aesthetic aspects due to climate conditions. These three factors include thermal comfort, physical aspects, and aesthetic aspects [19,20]. The Tourism Climate Index (TCI), initially proposed by Mieczkowski, integrates these three dimensions of meteorological variables into the evaluation of tourism climate comfort and has become one of the most widely used models to date. However, some scholars have pointed out certain deficiencies in TCI, such as its limited applicability to sightseeing tourism and its subjective nature. Hence, Scott et al. retained the basic structure of TCI and constructed the Holiday Climate Index (HCI) to more accurately assess the climate comfort of tourist destinations [21,22].
A comparison revealed that BCI, CIT, and MCIT indices require some data to be obtained via field observations, making their applicability relatively weak. Considering the above analysis, the TCI and HCI models are more suitable, and the required parameters are easier to obtain with relatively straightforward calculations. Although HCI is more suitable for holiday tourism, holiday tourism and sightseeing tourism both fall under the category of tourism activities primarily for leisure, entertainment, and vacation purposes. Therefore, this study attempts to base its analysis on HCI and improve upon it to explore whether the improved HCI is also suitable for evaluating tourism climate comfort within a small spatial range.
In summary, building on the TCI and HCI models, this study locally refined them and selected the optimal model via comparison to more reasonably evaluate the tourism climate comfort of the Longji Terraced Fields scenic area. The original expressions of TCI and HCI are as follows:
T C I = 2 × ( 4 × C I D + C I A + 2 × P + 2 × S + W )
H C I = T × 4 + A × 2 + P × 3 + W
In Equation (1), CID and CIA represent variables related to thermal comfort, calculated based on temperature (°C) and humidity (%). Specifically, CID represents the Daytime Comfort Index, derived from the maximum temperature and minimum relative humidity, while CIA represents the Daily Comfort Index, calculated from the average temperature and average relative humidity. P represents the total precipitation for the day (mm), S represents the average sunshine duration (h), and W represents the average wind speed (m/s). In Equation (2), T represents the Thermal Comfort Index, also known as the Daytime Comfort Index, and A denotes the average cloud cover percentage (%) [23].
Considering computational simplicity, this study substitutes the Temperature Humidity Index (THI) for the Comfort Index (CI) calculation. The expression for the Temperature Humidity Index THI [24] is as follows:
T H I = T 0.55 ( 1 0.04 R H ) ( T 14.5 )
In Equation (3), T and RH, respectively, represent the average temperature (°C) and relative humidity (%). Finally, the formulas for the improved Tourism Climate Comfort Index (MTCI) and the improved Holiday Climate Comfort Index (MHCI) are as follows:
M T C I = 2 × ( 4 × T H I D + T H I A + 2 × P + 2 × S + W )
M H C I = T H I D × 4 + A × 2 + P × 3 + W
In Equations (4) and (5), THID represents the Daytime Comfort Index, calculated from the maximum temperature and minimum relative humidity. THIA represents the overall Comfort Index (including daytime and nighttime), calculated from the average temperature and average relative humidity.

3.2.2. Model Applicability Analysis

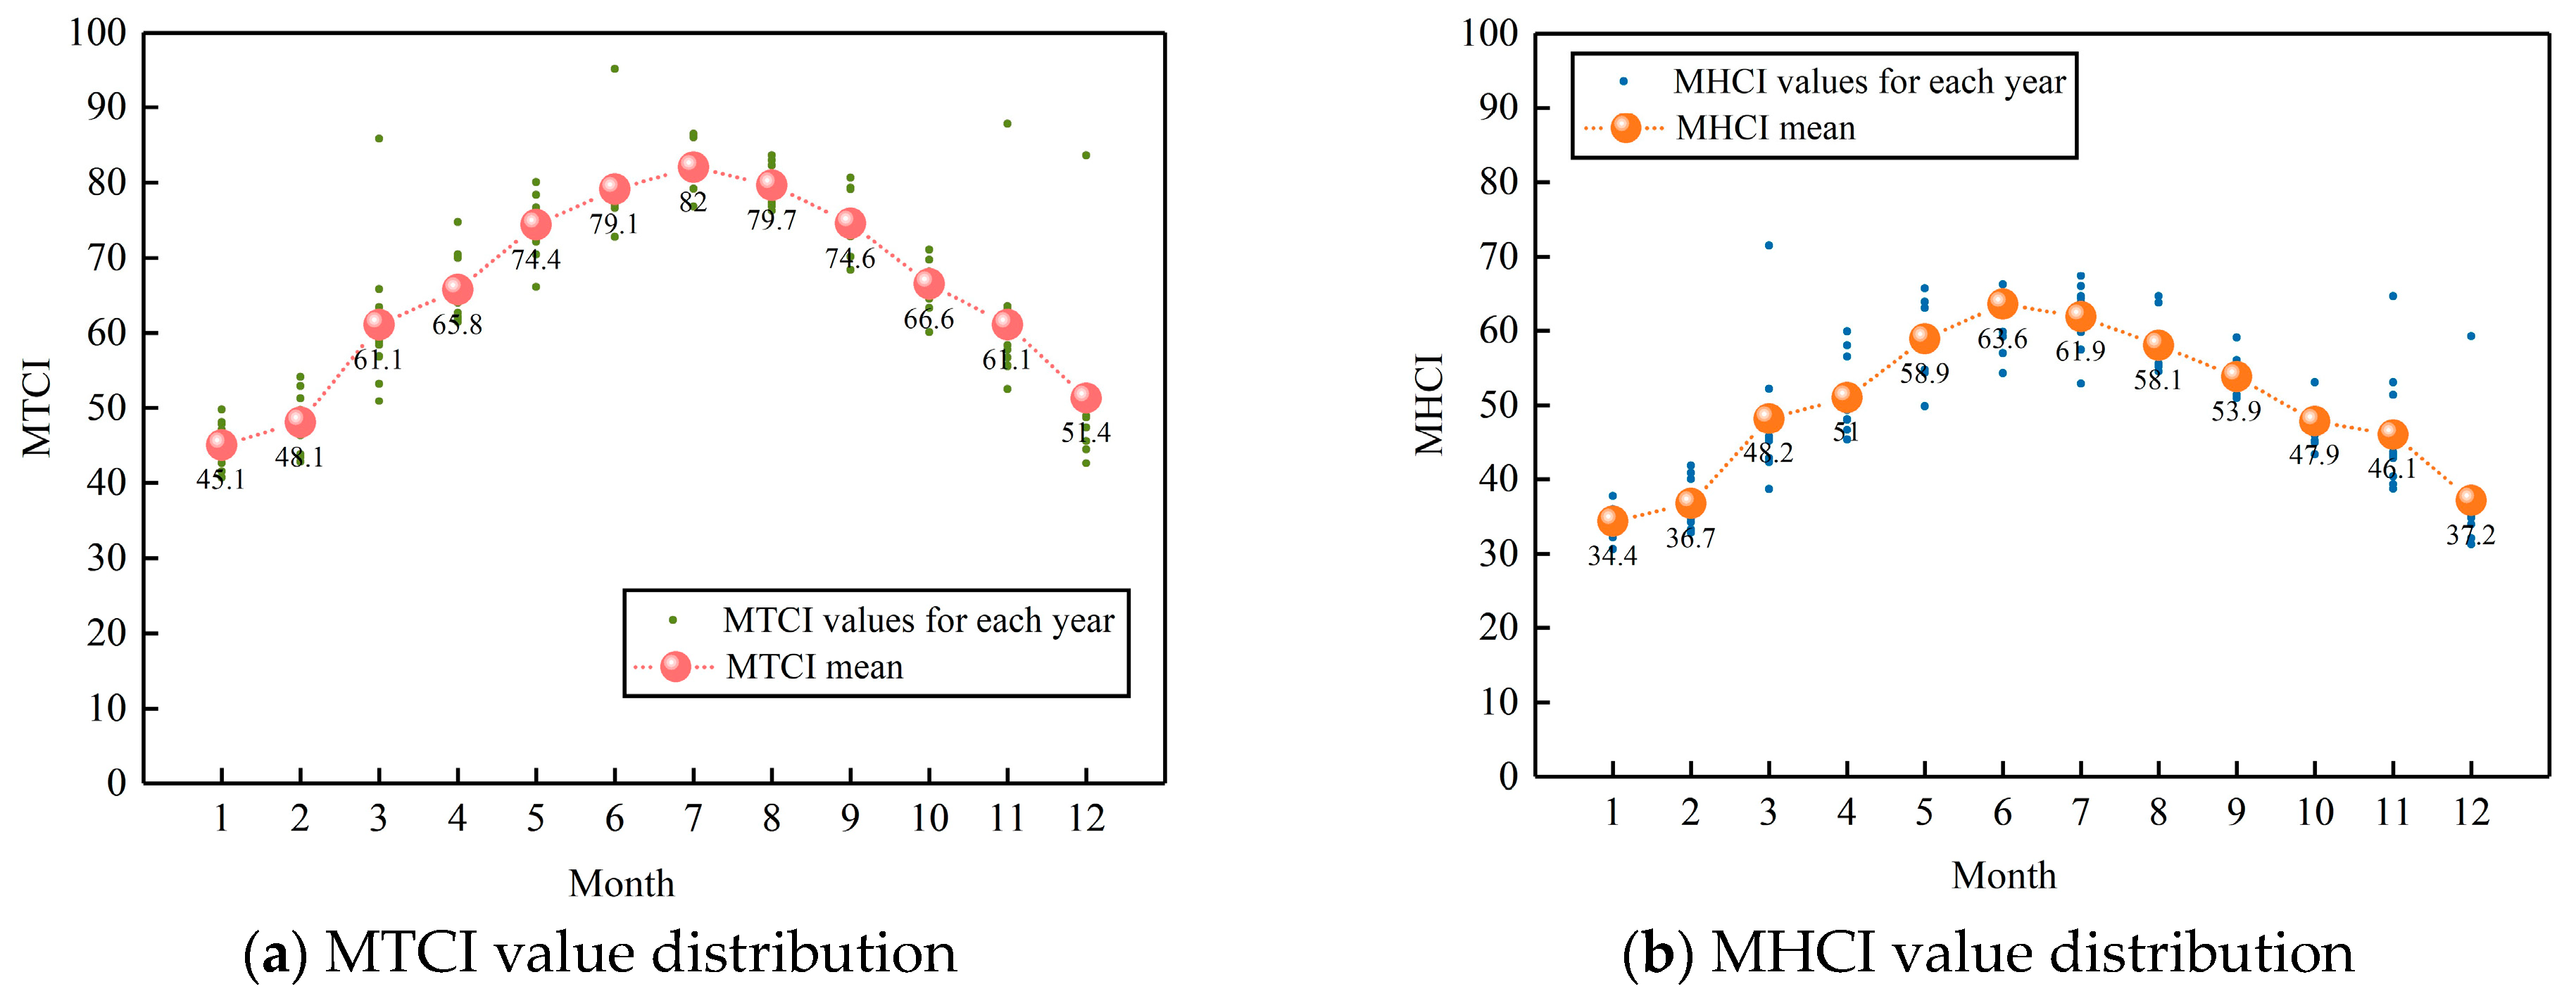
The results of the calculation of the Longsheng tourism climate comfort using the MTCI and MHCI mathematical models are shown in Figure 2. The monthly tourism climate comfort and average tourism climate comfort of Longsheng Rice Terraces are represented by the mean values of MTCI and MHCI, along with their historical values. Overall, the distribution of monthly tourism climate comfort in the Longsheng Rice Terraces, as calculated by MTCI and MHCI, exhibits a unimodal trend with an overall inverted “V” shape. Additionally, the MHCI values consistently exceed the MTCI values, with the MTCI values showing lower dispersion over the 20-year period. During the winter months (January, February, and December), MHCI values range between 34 and 37, while MTCI values range between 45 and 51. These months exhibit the lowest tourism climate comfort throughout the year, indicating the poorest tourism climate comfort during the winter season in Longsheng Rice Terraces. In the spring months (March, April, and May), MHCI values gradually increase, ranging between 44 and 59, while MTCI values show a steeper upward trend, ranging between 60 and 75. Considering the original classification standards of MHCI and MTCI, this suggests relatively comfortable climate conditions during the spring season in Longsheng Rice Terraces. During the summer months (June, July, and August), MHCI values reach their peak, with the highest value occurring in June at 63.6, after which the climate comfort gradually declines. In contrast, MTCI values peak at 82 in July, indicating optimal climate comfort during the summer months in Longsheng Rice Terraces. Both MHCI and MTCI values gradually decline in the autumn months (September, October, and November), compared to spring, yet the overall climate comfort during these months is higher than in spring, indicating that autumn is more suitable for tourism and sightseeing in Longsheng Rice Terraces.
However, according to the research results of previous scholars and online evaluations, it was found that the tourism ratings for May and June are relatively low. In addition, investigations into tourism at Longsheng Rice Terraces revealed that May and June mark the onset of the rainy season, with humid and rainy weather, high daily temperatures, and poor visitor experiences, which contradicts the model results. Unlike previous studies focused on typical cities in mainland China, this study’s spatial scale is limited to the Longsheng Rice Terraces scenic area, which is smaller in scope [25,26,27]. Additionally, Longsheng is situated in a subtropical monsoon climate zone at a relatively high altitude, leading to discrepancies between research results and actual conditions.
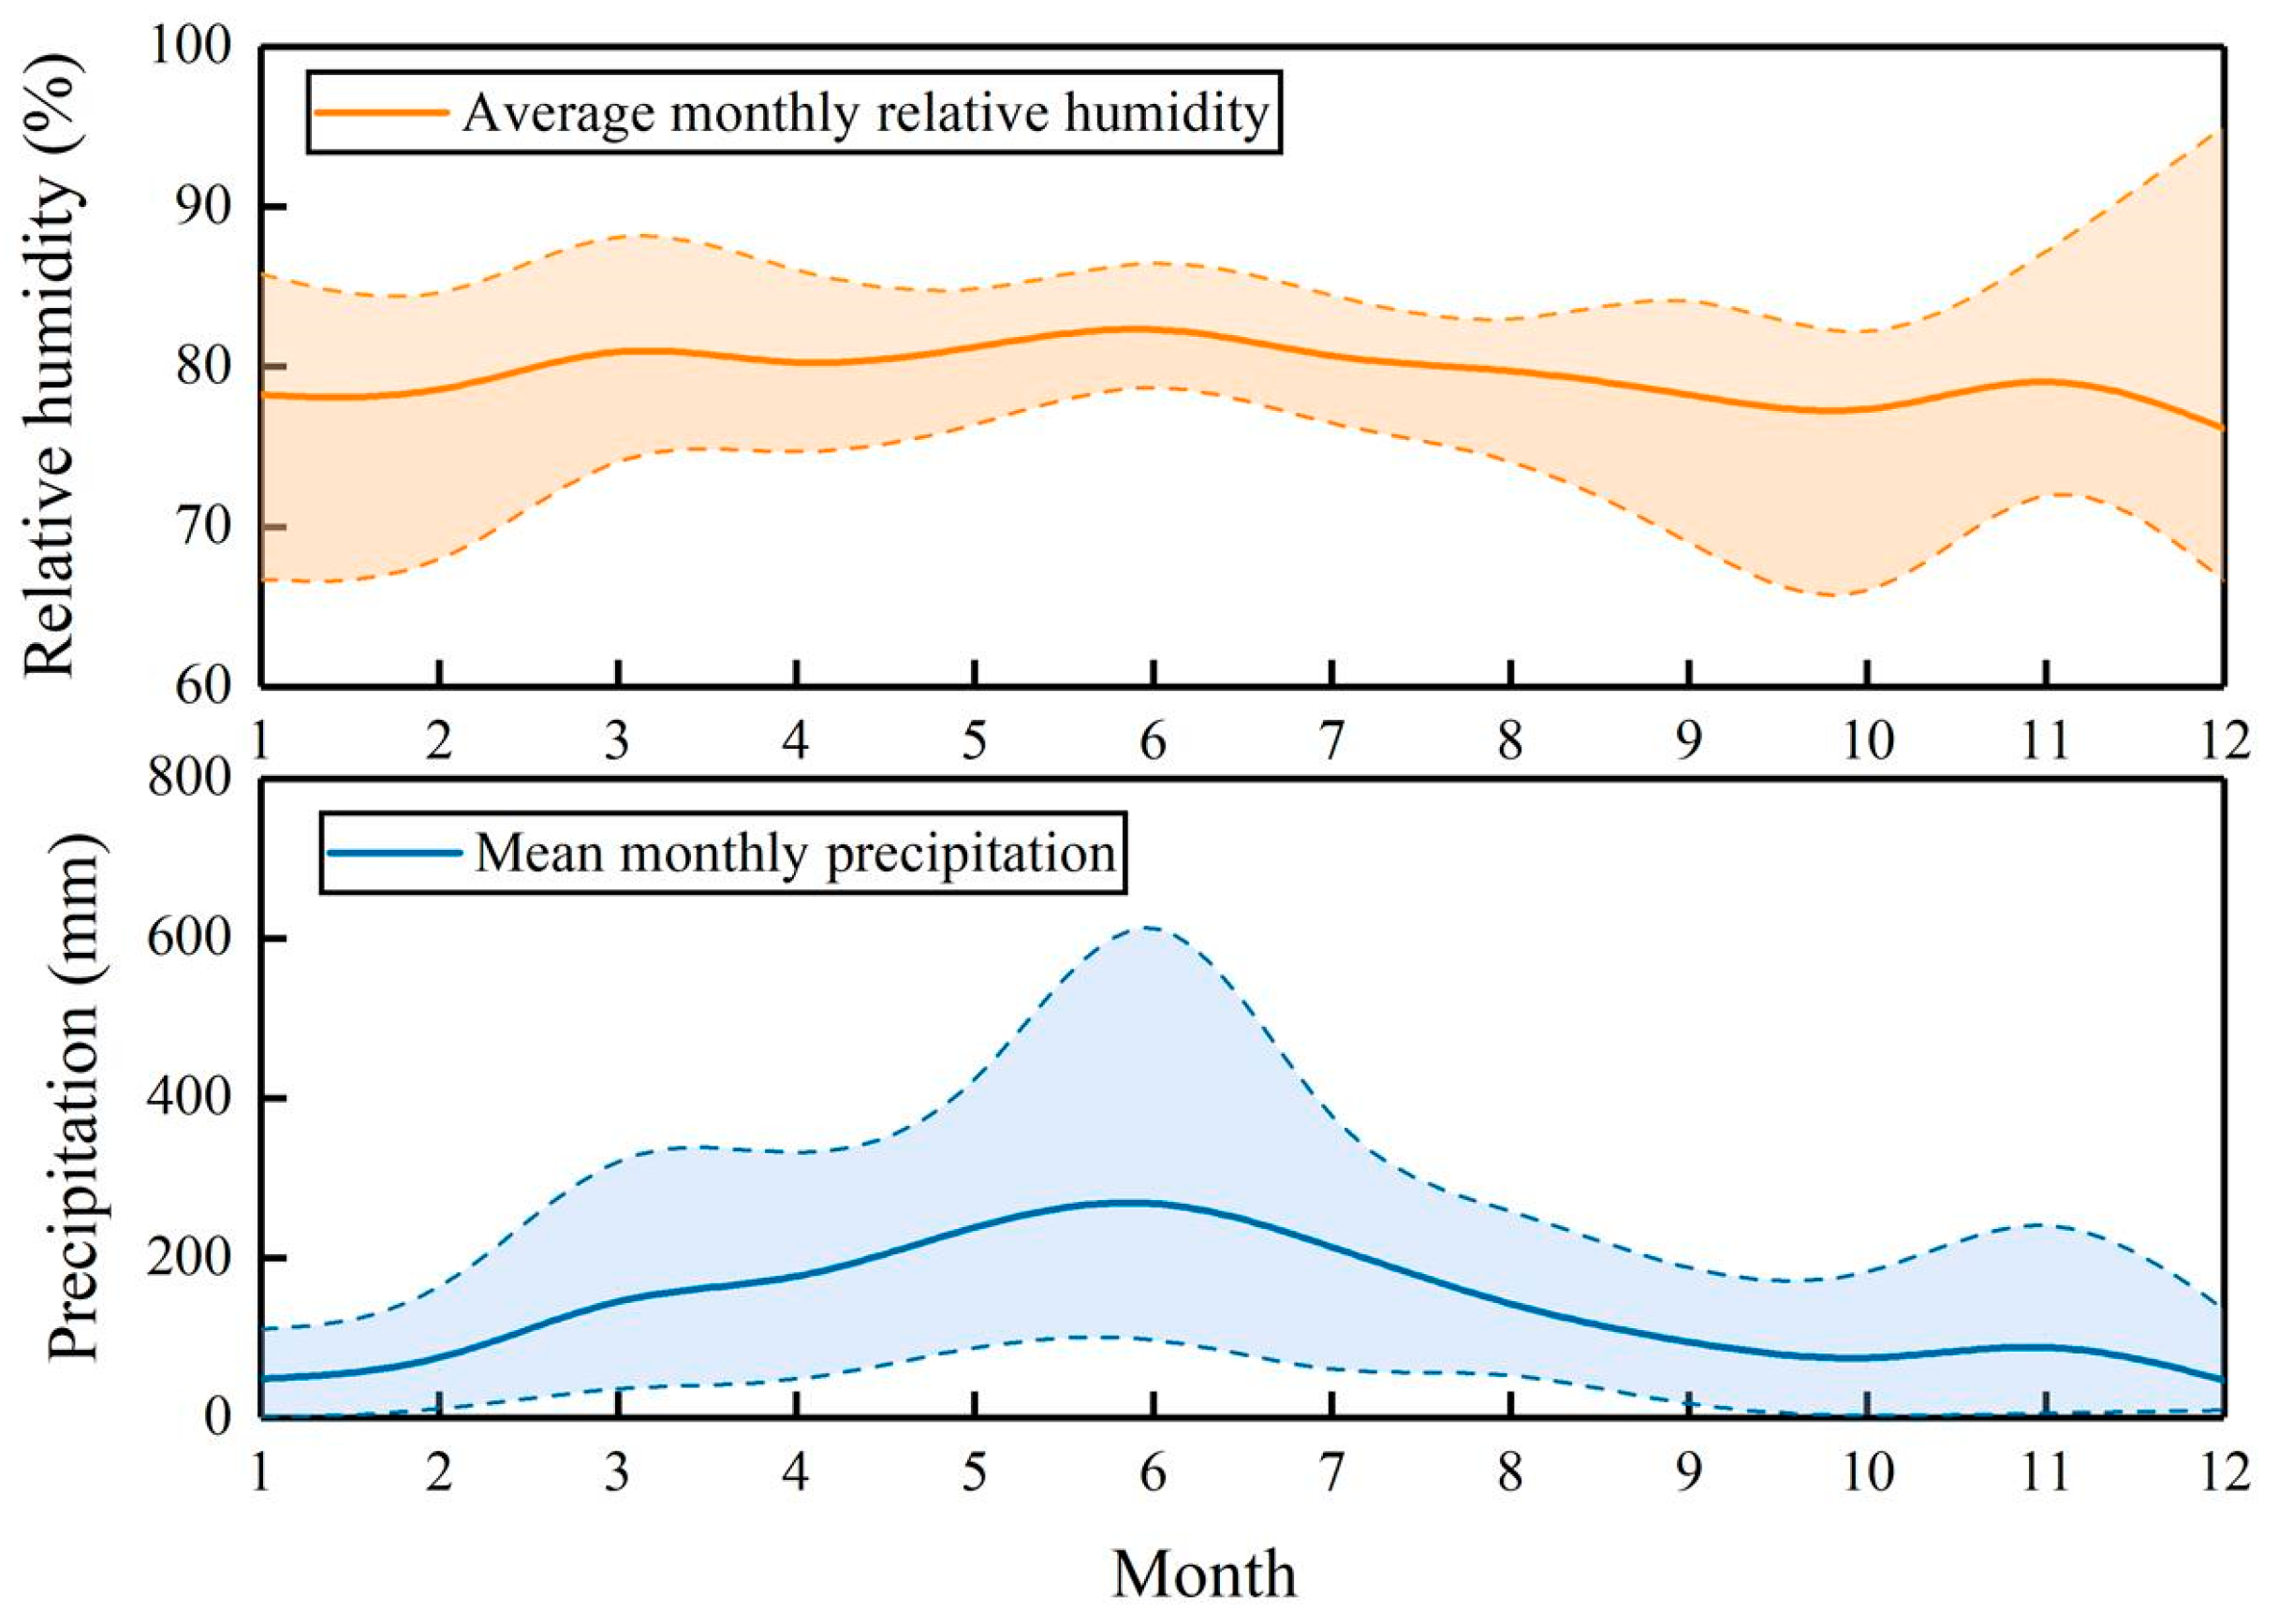
Therefore, partial adjustments need to be made to the current model. Firstly, an analysis should be conducted from the perspectives of precipitation and relative humidity. Monthly average relative humidity data for the Longsheng region indicate that relative humidity remains around 80% throughout the year, with minimal variation due to Longsheng’s location in the low latitudes and subtropical monsoon climate. Secondly, an analysis of monthly average precipitation data for the Longsheng region reveals a peak approaching 600 mm in June. The ample precipitation during the summer months in Longsheng significantly impacts tourism activities [28].
To further analyze the parameters of relative humidity and precipitation, which exhibit significant differences from other regions in the MTCI and MHCI models, monthly average relative humidity and precipitation data from Longsheng County from 2002 to 2022 were extracted and statistically analyzed, as shown in Figure 3. The solid thick line in the graph represents the mean meteorological data over the past 20 years, while the thin solid lines represent the extreme values for each month during this period, with shaded areas indicating the range of extreme values.
The relative humidity remains relatively stable throughout the year, fluctuating between 0% and 160% each month, with the average relative humidity stabilizing around 70%. According to previous research, optimal human comfort is typically achieved when outdoor relative humidity ranges from 40% to 60%. However, the average humidity in Longsheng County exceeds the maximum suitable humidity, and extremely humid weather with humidity levels exceeding 100% occurs every month. During the winter months in Longsheng (January, February, and December), the average monthly temperatures range between 11 °C and 17 °C. According to the thermal comfort threshold levels defined by HCI and MHCI, these temperatures fall into the cold category, and excessive humidity can lead to a damp and cold sensation, reducing the comfort of tourists. Additionally, the summer season brings hot and rainy weather, resulting in a humid and uncomfortable feeling, which is also unfavorable for outdoor activities. Therefore, the positive correlation of relative humidity with factors in the MTCI and MHCI models does not align with the meteorological conditions in Longsheng [29].
The curve of the upper limit deviation of precipitation generally exhibits a unimodal pattern, with the peak occurring in June with rainfall reaching up to 900 mm. The trend of precipitation increases continuously from January to June, with significant fluctuations in the maximum monthly precipitation throughout the year, reaching a maximum deviation of around 650 mm in June. The curve of the minimum monthly precipitation fluctuates between 0 and 200 mm, with the highest average monthly precipitation occurring in June. The curves of the minimum precipitation from January to February and from August to December overlap with the average monthly precipitation line in June. This indicates that summer rainfall is the highest throughout the year, followed by spring, while autumn and winter receive the least rainfall. Excessive rainfall can affect tourist travel and safety, thereby reducing tourism comfort. Hence, it is necessary to adjust the relationship between precipitation and MTCI and MHCI values based on actual conditions.

3.3. Optimization and Solution of MTCI and MHCI Models

Based on the research conclusion that outdoor relative humidity is optimal between 40% and 60%, RH is set as positive within the range of 40% to 60%. When RH is at 50%, it is considered the most comfortable relative humidity. In other ranges, RH is negatively correlated with climate comfort, with the degree of discomfort increasing as the absolute difference from 50% RH increases. Therefore, the correction value for relative humidity ( R H ) is rewritten as a parabolic function of RH. Since relative humidity ranges from 0% to 100%, a weighted solution can be obtained, as shown in Equation (6):
R H = ( R H 40 ) ( R H 60 ) 2400 × 100
Substituting Equation (6) into Equation (3) allows for the correction of the Temperature Humidity Index ( T H I ):
T H I = T 0.55 [ 1 + ( R H 40 ) ( R H 60 ) 2400 ] ( T 14.5 )
The Longsheng Terrace Scenic Area combines natural landscapes with ethnic minority cultural landscapes, making it a renowned tourist destination. A small amount of rainfall is favorable for visitors to appreciate the misty terrace scenery. Based on relevant research, it has been found that monthly precipitation below 30 mm indicates relatively dry weather, while precipitation exceeding 150 mm is considered rainy. Therefore, during outdoor travel, no rainfall or minimal rainfall has a positive impact on tourists’ comfort, while excessive rainfall is unfavorable for travel. Setting the median value of suitable precipitation at 90 mm as the optimal precipitation value, the range from 0 to 90 mm increases monotonically, while the range above 90 mm decreases monotonically. Consequently, the monthly precipitation correction value ( P ) can be derived as follows:
P = 1 90 P 2 + 2 P
By substituting Equations (7) and (8) into the original formulas, the corrected MTCI and MHCI models are obtained:
M T C I 2 = 2 × [ 4 × T H I D + T H I A + 2 × ( 2 P 1 90 P 2 ) + 2 × S + W ]
M H C I 2 = T H I D × 4 + A × 2 + 3 × ( 2 P 1 90 P 2 ) + W
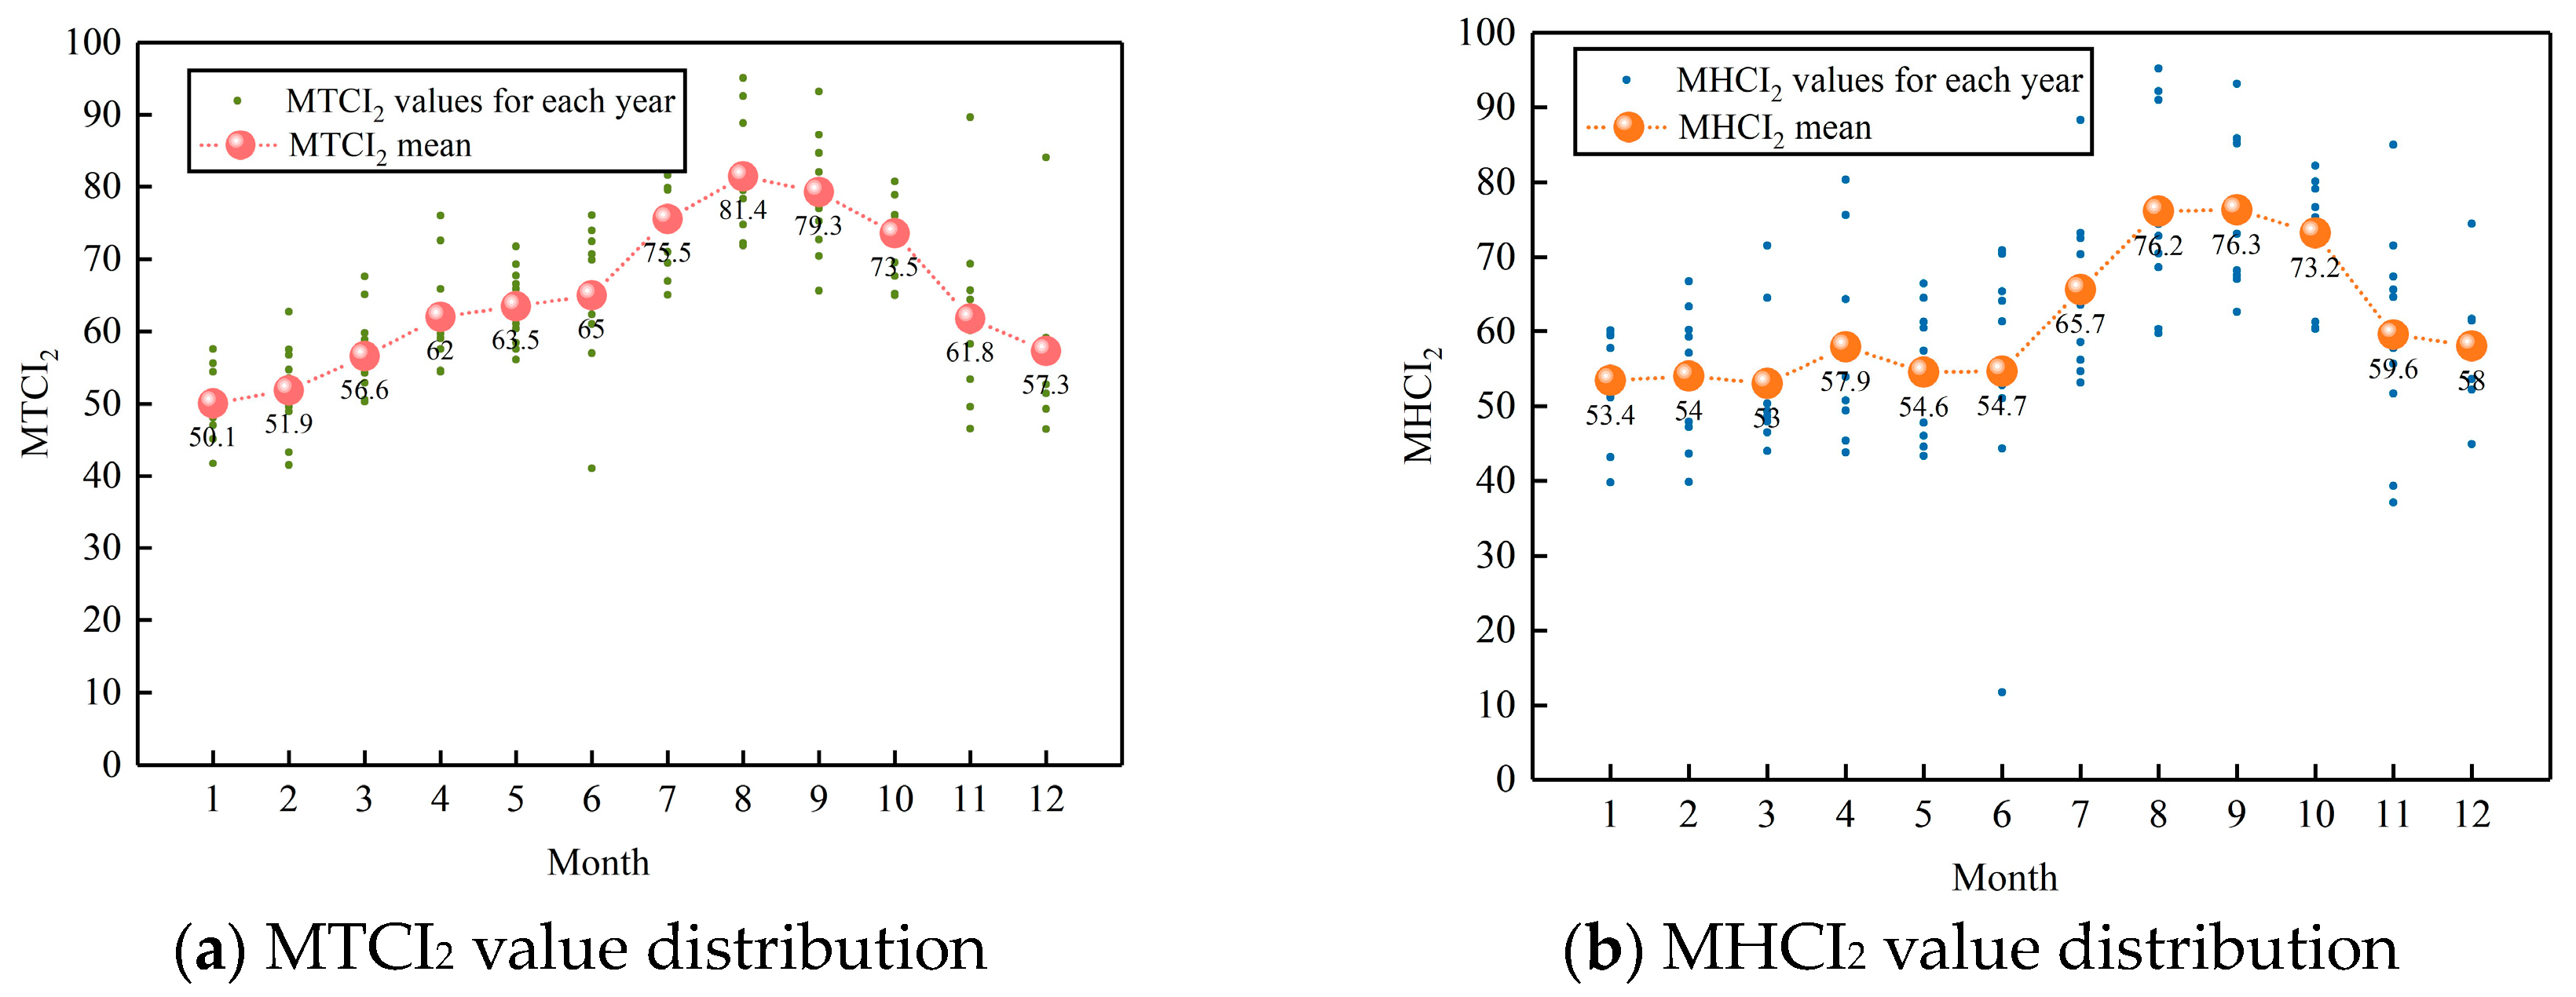
The climate comfort evaluation model, revised with the updated climate data, was employed for analysis. As depicted in Figure 4, the monthly distribution of tourism climate comfort in the Longji Rice Terraces, calculated using the MTCI and HTCI models, exhibits a similar pattern. Peaks in comfort are observed in July, August, and September. However, the values of MTCI2 and MHCI2 in the graph show considerable dispersion along the vertical axis. From January to June, MTCI2 gradually rises, ranging between 56 and 65, while MHCI2 shows a very slight fluctuation, varying between 53 and 58. According to the original classification standards of MTCI and MHCI, the climate in the Longji Rice Terraces is relatively comfortable in the first half of the year. From June to October, MTCI2 sharply rises, reaching its peak of 81.4 in August before gradually declining. Simultaneously, MHCI2 peaks at 76.3 in September. During autumn (August, September, and October), MHCI2 remains nearly at its peak level. With the end of the rainy season in Longji, the climate becomes cooler, rendering it more comfortable for visitors. In November and December, MTCI2 gradually decreases, ranging between 57 and 62, while MHCI2 follows a similar pattern, ranging between 58 and 60, indicating relatively poor climate comfort.

3.4. Model Optimization Evaluation and Determination

3.4.1. Climate Suitability Questionnaire Survey

Following the improvement in the models, it is essential to validate the effectiveness of these two models and select the optimal one as the tourism climate comfort evaluation model for this study. Therefore, this study first calculates the average MTCI2 and MHCI2 values for each month in the Longji Rice Terraces tourism area over the past 20 years (2002–2022). Simultaneously, during the year 2023, questionnaire surveys were conducted at three-day intervals to determine the proportion of acceptable climate conditions for each month. A total of 3247 valid responses were collected after screening to ensure the credibility and effectiveness of the survey. The survey population included children, teenagers, and middle-aged to elderly individuals in moderate proportions, ensuring the universality of the survey. The survey questions only involved two response options: satisfied or dissatisfied, facilitating subsequent result calculations. The survey was conducted randomly to ensure the universality of the results. Specific elements of the survey are outlined in Table 2:

3.4.2. Model Determination

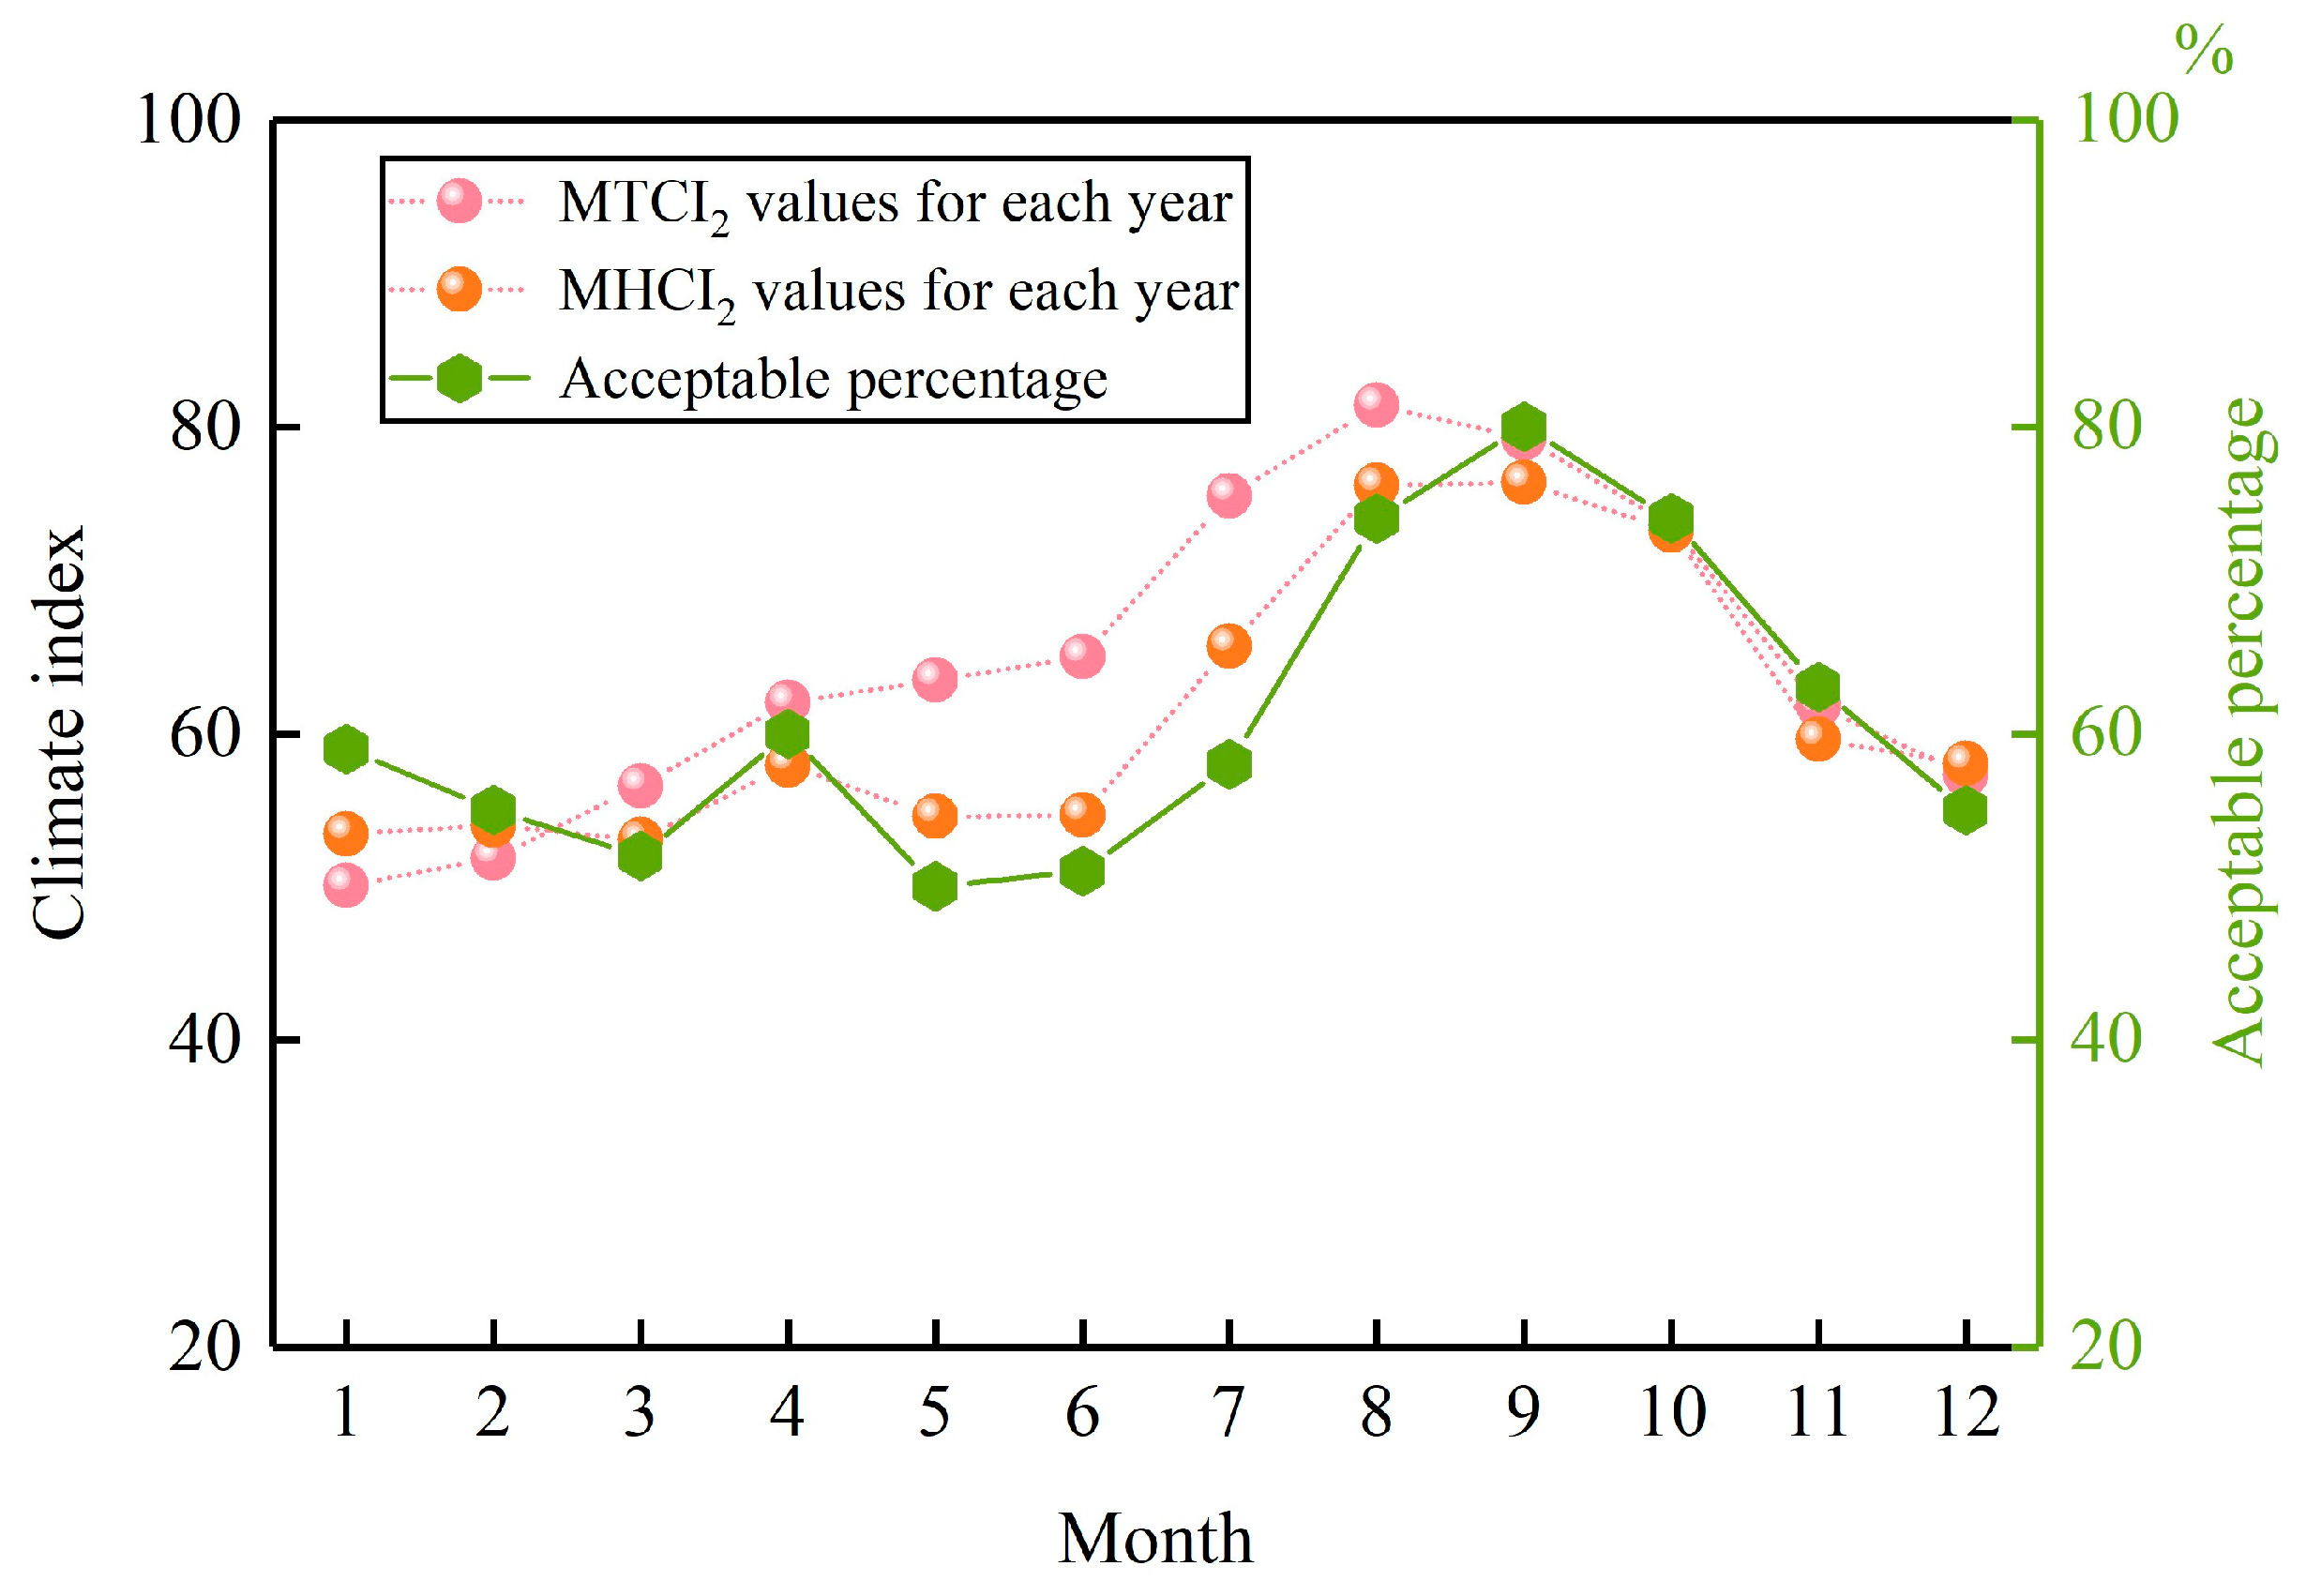
After integrating and analyzing the survey data, we obtained the acceptability rates of tourism climate comfort for each month, as shown in Figure 5. The figure indicates that the overall trend of average MTCI2 and MHCI2 values, as well as the acceptability rates of tourism climate, are generally consistent. From January to April and September to December, these three factors almost completely overlap. However, notable differences occur from May to August, where the acceptability rates are significantly lower than the climate index data, indicating that excessive rainfall has a considerable negative impact on tourism suitability, leading to lower tolerance among visitors. Conversely, in September and October, the acceptability rates surpass the MTCI2 and MHCI2 values, suggesting that when climatic conditions are favorable, visitor satisfaction significantly increases.
Upon comprehensive comparison, we chose MHCI2 as the tourism climate comfort evaluation model for the subsequent research in this paper. This decision is based on the improvement in the MHCI2 model over the TCI model, specifically addressing issues such as an excessive focus on thermal comfort, overlooking the potentially overriding influence of physical factors, and low temporal resolution. The MHCI2 model more accurately reflects the tourism climate comfort in the Longji Rice Terraces scenic area.

4. Analysis of Climate Suitability for Longsheng Tourism

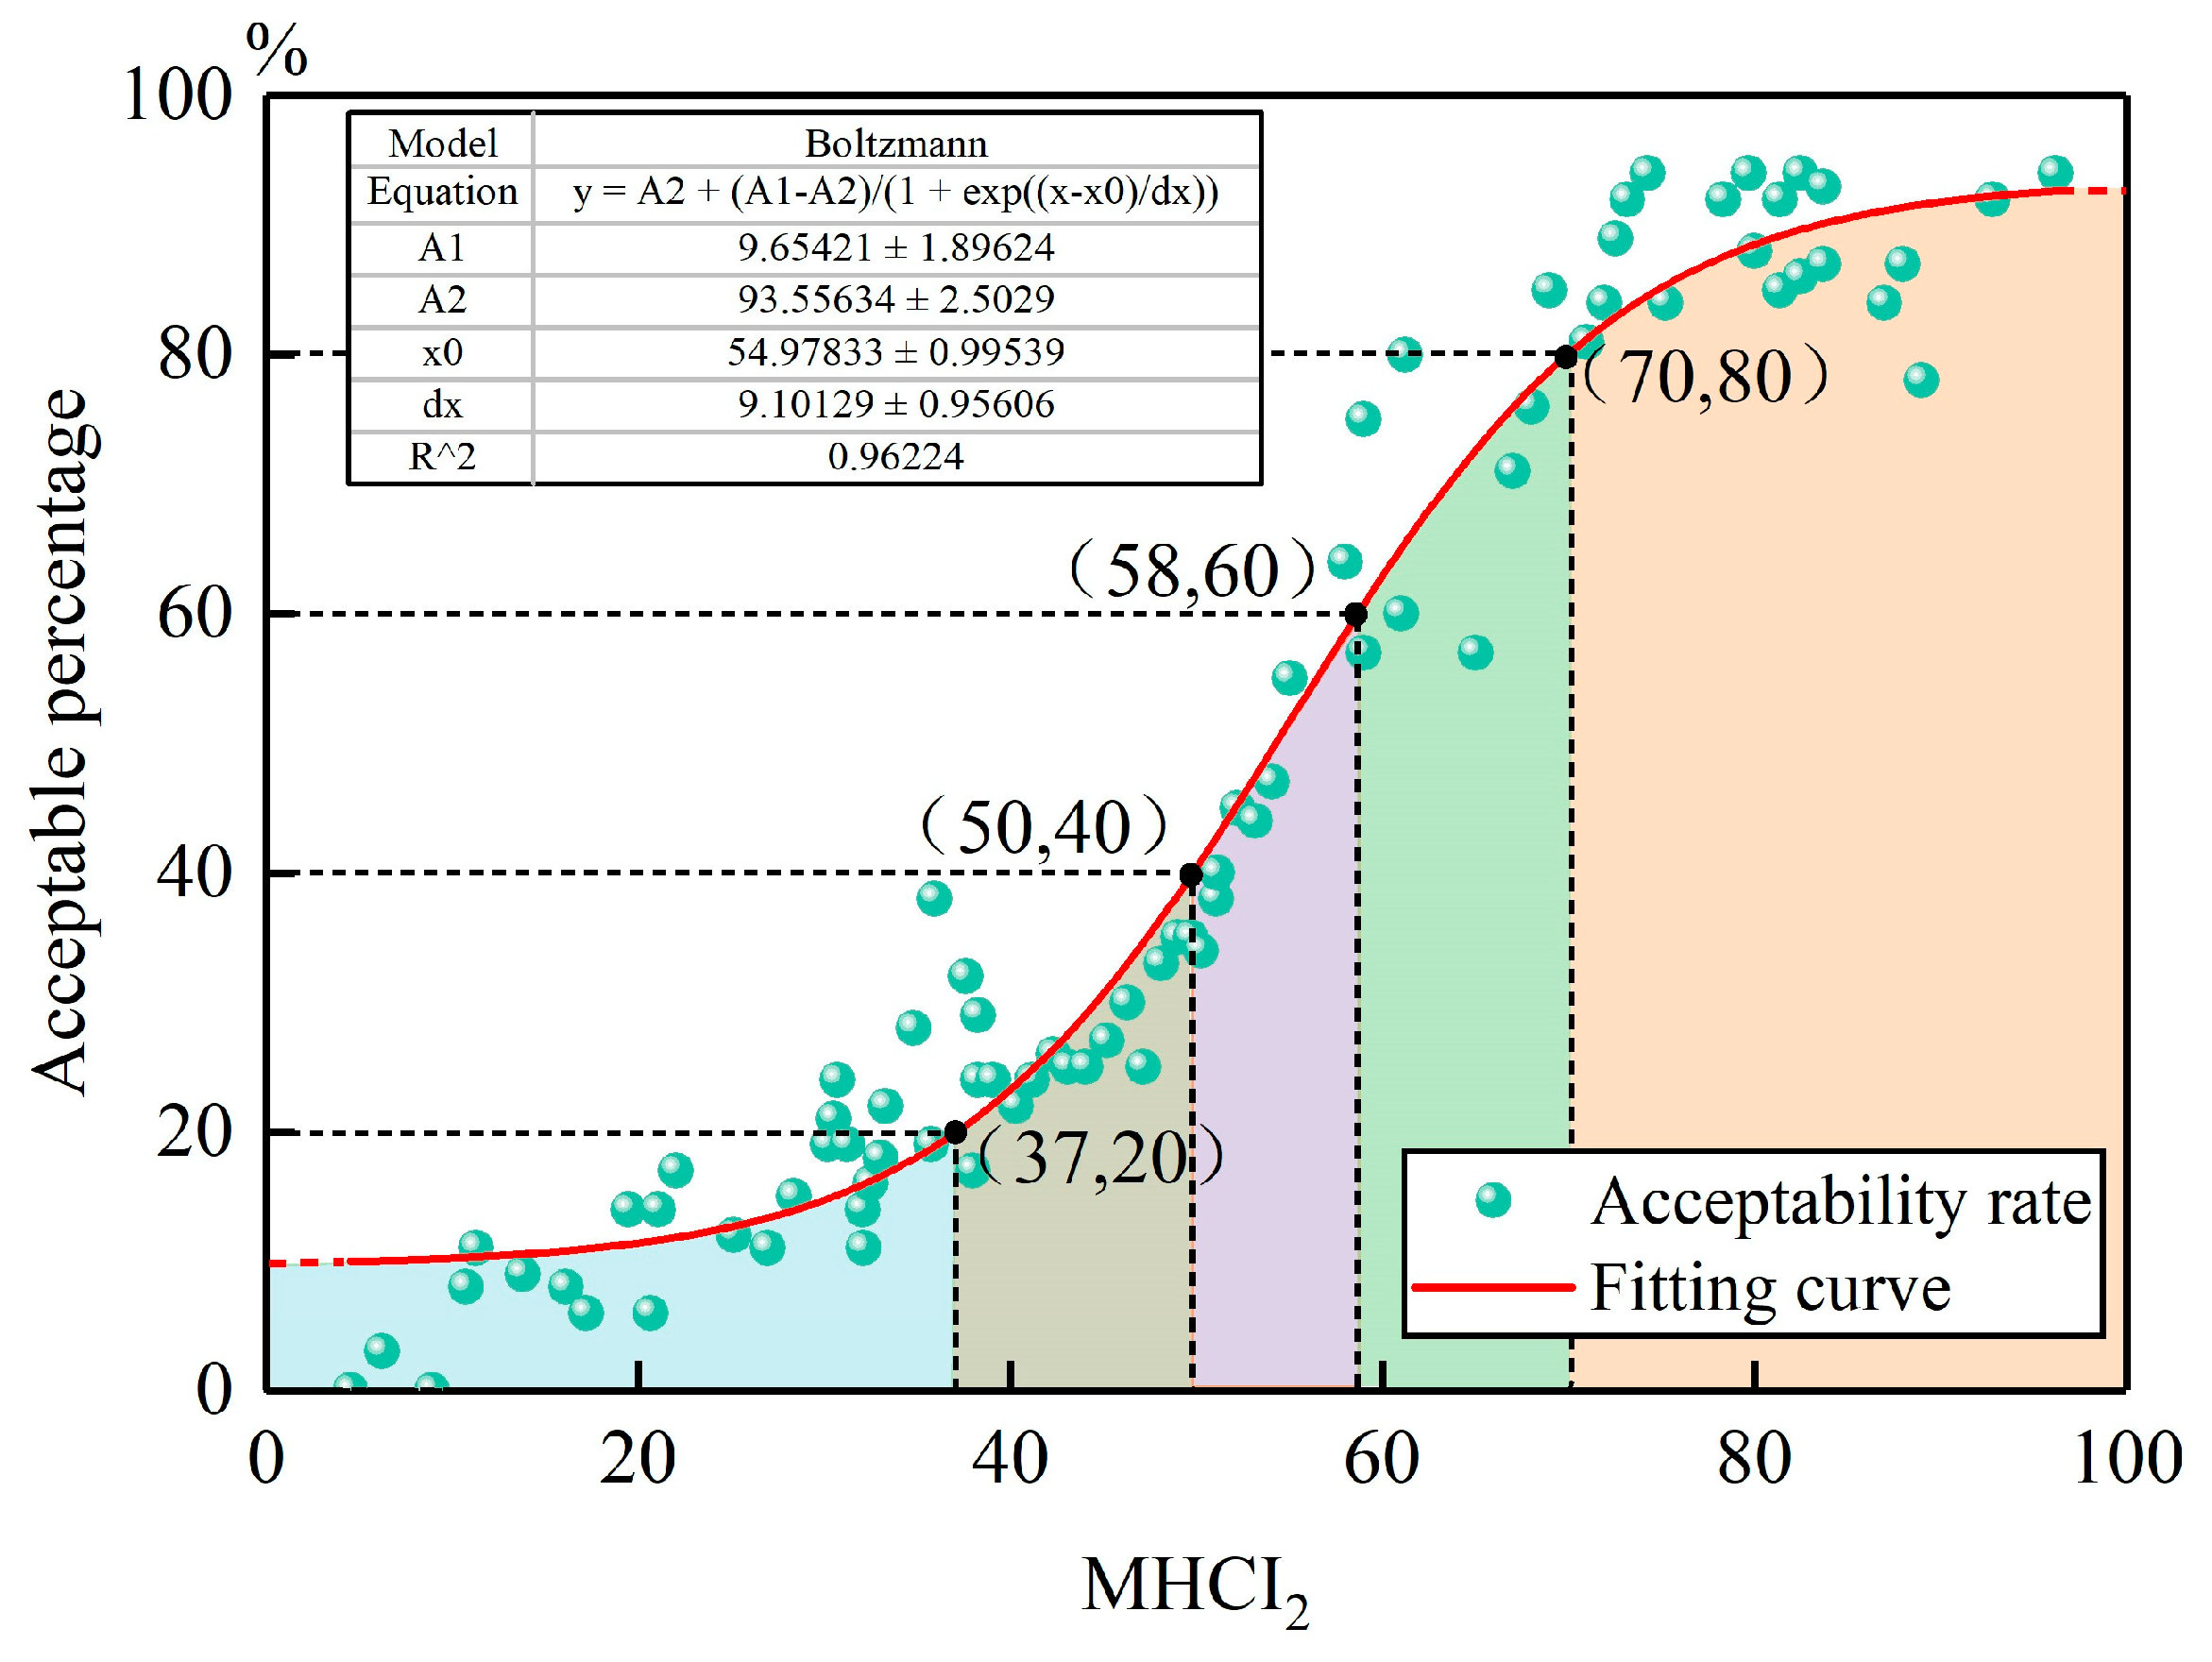
Based on the survey statistics of visitor acceptability rates derived from MHCI2 values, we fitted the sample points using the Boltzmann model. The fitting equation is as follows y = 93.6 83.9 / [ 1 + exp ( x 55.0 ) / d x ] , R 2 = 0.96 , as shown in Figure 6. The color blocks in the figure are used to distinguish different comfort intervals. When the discrete MHCI2 values are below 45, the percentage of visitor acceptability is generally below 30%, with a slow growth rate as MHCI2 values increase, indicating poor climatic conditions unsuitable for tourism. When the discrete MHCI2 values range from 58 to 70, the percentage of visitor acceptability rises rapidly, indicating that visitors are highly sensitive to climate comfort within this range. Combined with meteorological factors, this range mostly corresponds to mildly cold and humid or hot and humid weather conditions. When the discrete MHCI2 values exceed 70, the percentage of visitor acceptability stabilizes at over 80%, indicating high satisfaction among visitors under favorable climatic conditions.
Furthermore, considering the relationship between acceptability rates and MHCI2 values, we divide the entire year in Longsheng into four periods: Extremely Uncomfortable Period, Uncomfortable Period, Comfortable Period, and Extremely Comfortable Period.
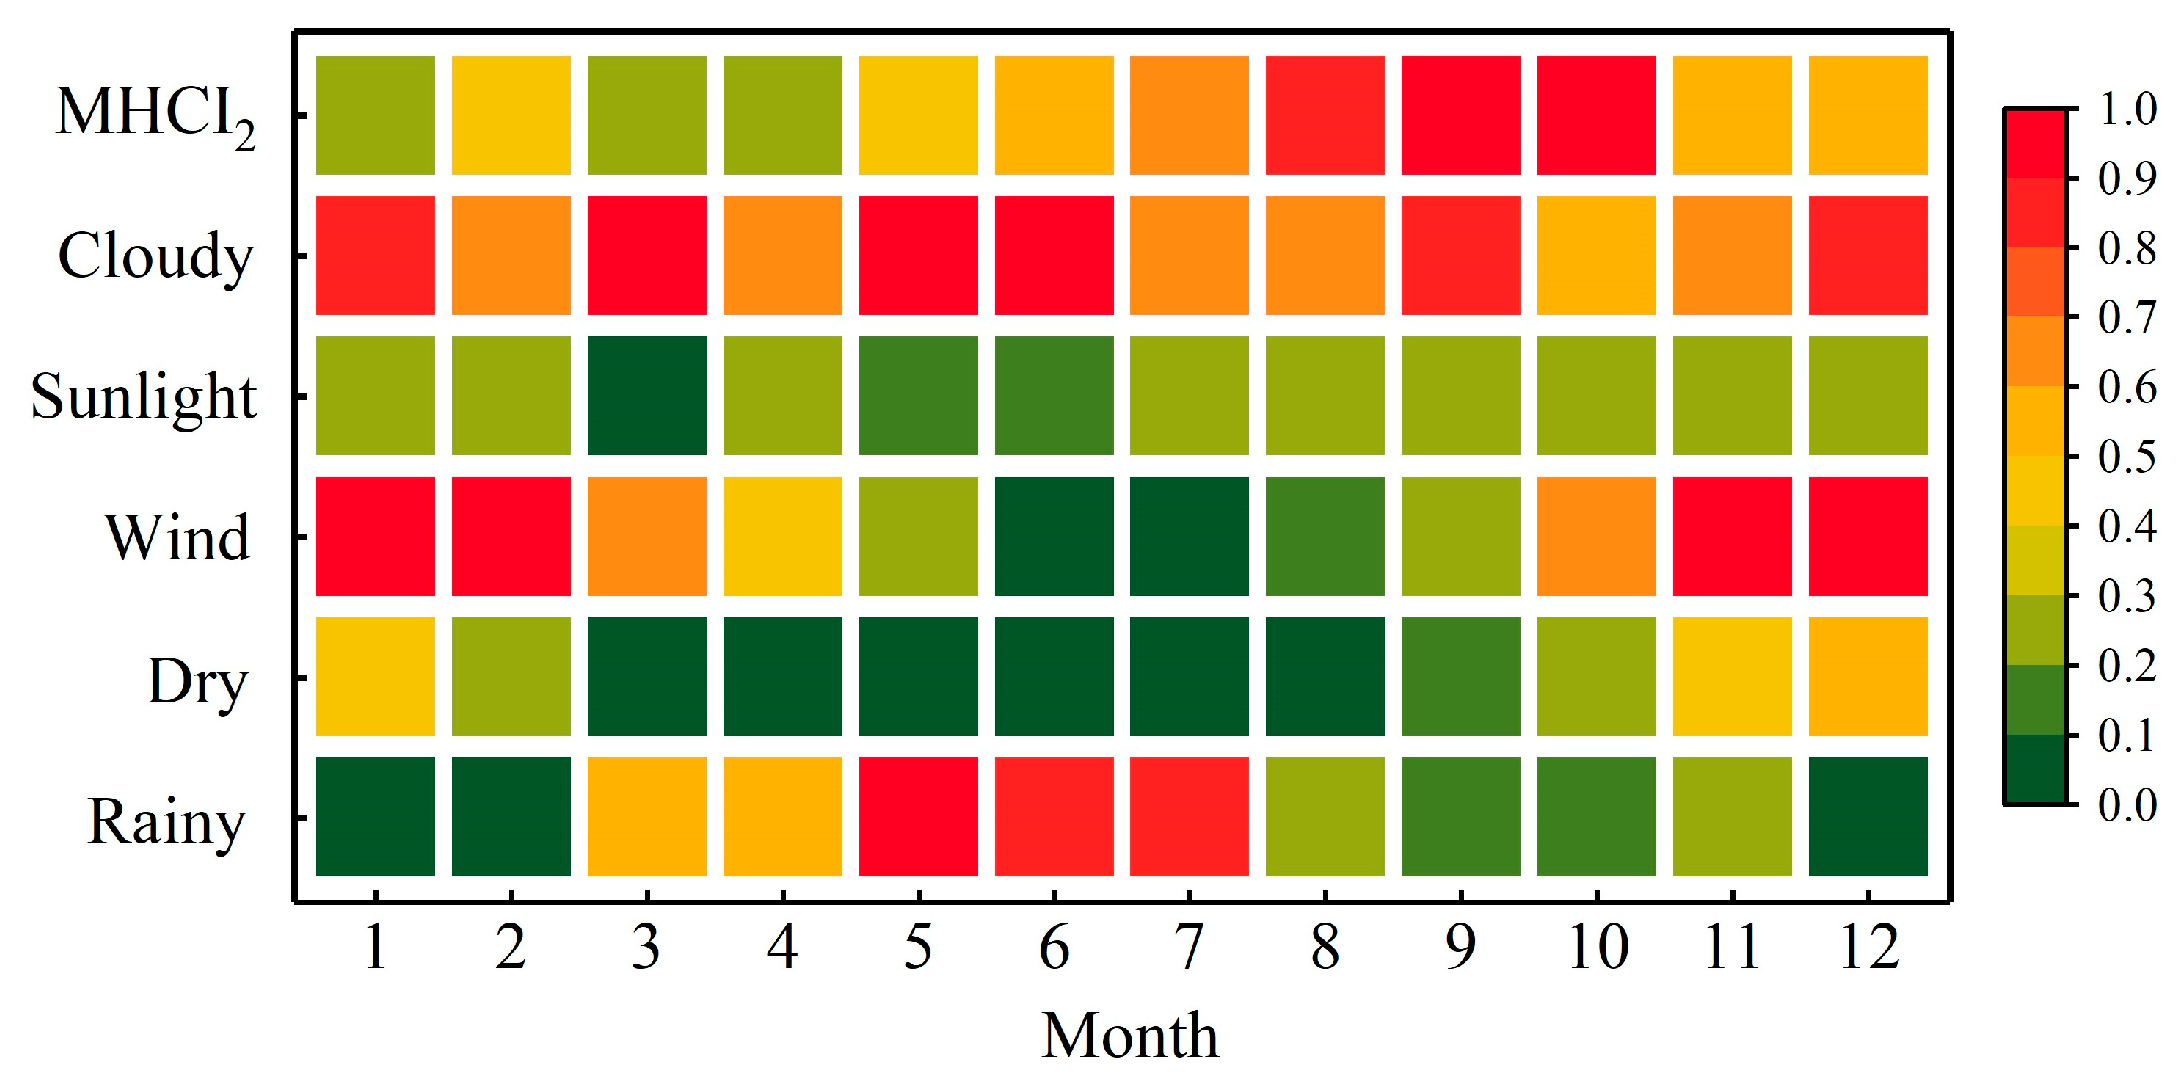
Additionally, this study combines the Climate Tourism Information Scheme (CTIS) to analyze the climate suitability for tourism in Longsheng. CTIS provides detailed climate information for tourists to plan their holidays, including aesthetic and physical weather conditions [30,31]. The evaluation criteria are as follows [32]:
(1)
Comfort (MHCI2 value > 60);
(2)
Cloudiness (Cloud cover > 0.6);
(3)
Sunshine (Cloud cover < 5/8);
(4)
Windy (Wind speed > 8 m/s);
(5)
Dry (Precipitation < 1 mm);
(6)
Rainy (Precipitation > 5 mm).
CTIS is a high-resolution graphical representation of tourism climate, providing detailed climate information every 10 days, integrating and simplifying tourism climate information, and providing important support for tourists and tourism development departments [33]. In addition to climate comfort, conditions such as sunshine, fog, wind, and rain also affect tourists’ mood and travel experience. Moreover, the 10-day interval is almost equal to the average holiday duration, offering strong flexibility and allowing the selection of specific climate parameters to provide customized support for specific regions and related tourism departments. To provide more specific tourism climate information, we present the CTIS for Longji Rice Terraces on a 30-day scale, as shown in Figure 7. Different colors represent the frequency of occurrence of various meteorological elements.
In the Longji Rice Terraces, cloudy conditions are highly suitable, with a frequency exceeding 70% overall. Sunshine conditions mainly occur from July to February of the following year, with a frequency of approximately 30%, enhancing the pleasure of sightseeing. Windy conditions primarily occur from October to February of the following year, with a frequency of around 90%. Visitors need to be cautious about wind protection, especially as severe conditions may lead to meteorological disasters such as landslides, ensuring their safety. Dry conditions are generally below 30%, as Longsheng belongs to a subtropical monsoon climate, with rainy weather mostly occurring from May to July, during the rainy season, which may cause some inconvenience to travel and tourism activities, affecting tourists’ mood and the appreciation of scenery [34].
In summary, based on the analysis in Figure 7, we divide the entire year in Longsheng into four periods: Extremely Uncomfortable Period (January, February, March), Uncomfortable Period (April, May, June), Comfortable Period (July, November, December), and Extremely Comfortable Period (August, September, October). During the Extremely Uncomfortable Period, MHCI2 values are all below 54, indicating the poorest climate comfort and not recommended for visiting the Longji Rice Terraces for sightseeing. In the Uncomfortable Period, MHCI2 values range from 54 to 58, characterized by prevalent cloudy and windy conditions, while terraces are being irrigated and planted, making it difficult to appreciate the unique landscape. During the Comfortable Period, MHCI2 values range from 57 to 70, with moderate rainfall and mild climate, suitable for tourism. In the Extremely Comfortable Period, MHCI2 values exceed 70, presenting picturesque scenery and providing an excellent opportunity for enjoying the beauty of the terraces.

5. Conclusions and Discussion

This study systematically reviewed relevant models for evaluating tourism climate comfort, drawing on existing research findings and combining them with the actual conditions of the Longsheng scenic area. Improvements were made to the Tourism Climate Index (TCI) and the Holiday Climate Index (HCI). Via field research and inquiries into the real feelings of tourists, we obtained the distribution of the acceptability rates of climate comfort for each period and conducted corresponding validations. Ultimately, the improved HCI was selected as the model for evaluating climate comfort in this paper. Using the improved HCI and employing the Boltzmann model, we linearly analyzed the percentage of acceptability of different HCI values among tourists. An empirical study was conducted based on daily meteorological data from several benchmark meteorological stations in the Longsheng area between 2002 and 2022, analyzing the tourism climate conditions of the Longji Rice Terraces from the perspective of climate comfort periods.
The main findings are as follows:
(1) Specific models for evaluating tourism climate comfort in particular regions should be adopted rather than generic models. Improvements to specialized models for evaluating tourism climate comfort should be based on the selection of several typical factors for analysis according to actual conditions. In this study, we selected two indicators: monthly average relative humidity and monthly average precipitation. When calculating the tourism climate evaluation model, data covering as detailed a range as possible should be selected to obtain more accurate results. After preliminary validation, the adjusted HCI can better reflect the tourism climate comfort of the Longji Rice Terraces.
(2) Based on the calculation results of MHCI2, the distribution of tourism climate comfort periods in Longsheng is as follows: Extremely Comfortable Periods are in August, September, and October; Comfortable Periods are in July, November, and December; Uncomfortable Periods are in April, May, and June; Extremely Uncomfortable Periods are in January, February, and March. Longsheng County is located at a low latitude and belongs to a subtropical monsoon climate. Unlike most inland provinces, the climate here is mild, with abundant rainfall, a long frost-free period, ample sunlight, abundant heat, a long summer, a short winter, distinct four seasons, and rain and heat occurring in the same season.
This paper analyzed the mainstream international tourism climate evaluation models and selected the more mature Holiday Climate Index (HCI), optimizing and improving it according to the local conditions in Longsheng. This model is suitable for terraced areas with high humidity and precipitation, but the parameter ratio of the model needs to be revised according to the local meteorological values. However, the current improvements still do not take into account some other important meteorological elements, such as the influence of air pressure and various extreme weather events. Therefore, establishing a more comprehensive model of the relationship between climate and tourism requires further comprehensive and in-depth research. In addition, this study did not consider the adaptability of the human body to the climate environment, as well as the impact of factors such as gender, age, and ethnicity on human comfort, which reduces the practical value of the research results.
Future research directions should include the following:
(1) Incorporating Additional Meteorological Factors: Integrating other significant meteorological elements like atmospheric pressure and extreme weather events to enhance the comprehensiveness of the climate–tourism relationship model.
(2) Human Adaptation and Demographic Factors: Examining how human adaptation to climate and factors such as gender, age, and ethnicity affect climate comfort perceptions to improve the practical value of the findings.
(3) Longitudinal and Spatial Analysis: Conducting longitudinal studies and spatial differentiation analyses to better understand the temporal and regional variations in tourism climate comfort.

Author Contributions

L.H. and X.G. contributed to the conceptualization, execution, data compilation, and draft writing of this research, and P.Y. and X.L. contributed to the conceptualization as well as supervising, reviewing, and editing the manuscript. All authors have read and agreed to the published version of the manuscript.

Funding

This study was funded by the National Social Science Foundation of China project “Experience Research on the Harmonious coexistence between terraced people and Nature in Southwest Ethnic Areas” (Project Number: 23XMZ024).

Institutional Review Board Statement

Not applicable.

Informed Consent Statement

Informed consent was obtained from all subjects involved in the study.

Data Availability Statement

All relevant data are included in the paper.

Conflicts of Interest

The authors declare no conflict of interest.

References

  1. Chen, D.; Wei, W.; Chen, L.D. History and distribution of terraced landscapes and typical international cases analysis. J. Appl. Ecol. 2017, 28, 689–698. [Google Scholar]
  2. Yang, X.-G.; Li, Y.; Dai, S.-W.; Liu, Z.-J.; Wang, W.-F. Changes of China agricultural climate resources under the background of climate change: IX. Spatiotemporal change characteristics of China agricultural climate resources. J. Appl. Ecol. 2011, 22, 3177–3188. [Google Scholar]
  3. Su, M.M.; Dong, Y.; Wall, G.; Sun, Y. A value-based analysis of the tourism use of agricultural heritage systems: Duotian Agrosystem, Jiangsu Province, China. J. Sustain. Tour. 2020, 28, 2136–2155. [Google Scholar] [CrossRef]
  4. Ahmadi, M.A. Evaluation of tourism climate comfort in order to attract more tourists–Case study: Sanandaj city in Iran. Life Sci. J. 2012, 9, 623–629. [Google Scholar]
  5. Liu, W.-Y.; Yu, H.-W.; Hsieh, C.-M. Evaluating forest visitors’ place attachment, recreational activities, and travel intentions under different climate scenarios. Forests 2021, 12, 171. [Google Scholar] [CrossRef]
  6. Zhong, L.; Chen, D. Progress and prospects of tourism climate research in China. Atmosphere 2019, 10, 701. [Google Scholar] [CrossRef]
  7. Cheng, Q.-P.; Zhong, F.-L. Evaluation of tourism climate comfort in the Grand Shangri-La region. J. Mt. Sci. 2019, 16, 1452–1469. [Google Scholar] [CrossRef]
  8. Wu, F.; Yang, X.; Shen, Z.; Yi, Z. Long-term trends and spatiotemporal variations of climate comfort in China during 1966–2016. Therm. Sci. 2020, 24, 2445–2453. [Google Scholar] [CrossRef]
  9. Cai, S.; Fan, J.; Yang, W. Flooding Risk Assessment and Analysis Based on GIS and the TFN-AHP Method: A Case Study of Chongqing, China. Atmosphere 2021, 12, 623. [Google Scholar] [CrossRef]
  10. Junyuan, Z.; Shengjie, W. Spatio-temporal evolution and prediction of tourism comprehensive climate comfort in Henan province, China. Atmosphere 2021, 12, 823. [Google Scholar] [CrossRef]
  11. Gungor, S.; Cetin, M.; Adiguzel, F. Calculation of comfortable thermal conditions for Mersin urban city planning in Turkey. Air Qual. Atmos. Health 2021, 14, 515–522. [Google Scholar] [CrossRef]
  12. Mieczkowski, Z. The tourism climatic index: A method of evaluating world climates for tourism. Can. Geogr. 1985, 29, 220–233. [Google Scholar] [CrossRef]
  13. De Freitas, C.R.; Scott, D.; McBoyle, G. A second generation climate index for tourism (CIT): Specification and verification. Int. J. Biometeorol. 2008, 52, 399–407. [Google Scholar] [CrossRef] [PubMed]
  14. Morgan, R.; Gatell, E.; Junyent, R.; Micallef, A.; Özhan, E.; Williams, A.T. An improved user-based beach climate index. J. Coast. Conserv. 2000, 6, 41–50. [Google Scholar] [CrossRef]
  15. Scott, D.; Rutty, M.; Amelung, B.; Tang, M. An inter-comparison of the holiday climate index (HCI) and the tourism climate index (TCI) in Europe. Atmosphere 2016, 7, 80. [Google Scholar] [CrossRef]
  16. Yu, G.; Schwartz, Z.; Walsh, J.E. A weather-resolving index for assessing the impact of climate change on tourism related climate resources. Clim. Chang. 2009, 95, 551–573. [Google Scholar] [CrossRef]
  17. Gössling, S.; Bredberg, M.; Randow, A.; Sandström, E.; Svensson, P. Tourist perceptions of climate change: A study of international tourists in Zanzibar. Curr. Issues Tour. 2006, 9, 419–435. [Google Scholar] [CrossRef]
  18. Rutty, M.; Scott, D. Comparison of climate preferences for domestic and international beach holidays: A case study of Canadian travelers. Atmosphere 2016, 7, 30. [Google Scholar] [CrossRef]
  19. De Freitas, C.R. Recreation climate assessment. Int. J. Climatol. 1990, 10, 89–103. [Google Scholar] [CrossRef]
  20. De Freitas, C.R. Tourism climatology: Evaluating environmental information for decision making and business planning in the recreation and tourism sector. Int. J. Biometeorol. 2003, 48, 45–54. [Google Scholar] [CrossRef]
  21. Scott, D.; McBoyle, G.; Schwartzentruber, M. Climate change and the distribution of climatic resources for tourism in North America. Clim. Res. 2004, 27, 105–117. [Google Scholar] [CrossRef]
  22. Perkins, D.R., IV; Debbage, K.G. Weather and tourism: Thermal comfort and zoological park visitor attendance. Atmosphere 2016, 7, 44. [Google Scholar] [CrossRef]
  23. Monteith, J.L. Light distribution and photosynthesis in field crops. Ann. Bot. 1965, 29, 17–37. [Google Scholar] [CrossRef]
  24. Thom, E.C. The discomfort index. Weatherwise 1959, 12, 57–61. [Google Scholar] [CrossRef]
  25. Zhong, L.; Yu, H.; Zeng, Y. Impact of climate change on Tibet tourism based on tourism climate index. J. Geogr. Sci. 2019, 29, 2085–2100. [Google Scholar] [CrossRef]
  26. Yu, D.-D.; Li, S.; Guo, Z.-Y. Evaluating the tourist climate comfortable period of China in a changing climate. Adv. Meteorol. 2020, 2020, 8886316. [Google Scholar] [CrossRef]
  27. Wang, H.; You, Q.; Liu, G.; Wu, F. Climatology and trend of tourism climate index over China during 1979–2020. Atmos. Res. 2022, 277, 106321. [Google Scholar] [CrossRef]
  28. Li, Y.; Zhang, S.; Han, J.; Zhao, Y.; Han, Q.; Wu, L.; Wang, X.; Qiu, Z.; Zou, T.; Fan, C. A study of the temporal and spatial variations in the suitability of the environment in Chinese cities for tourism and in strategies for optimizing the environment. Int. J. Digit. Earth 2022, 15, 527–552. [Google Scholar] [CrossRef]
  29. Ying, Z. Analysis and Evaluation of Tourism Climate Resources in Turpan Region. Adv. Mater. Res. 2014, 869, 80–83. [Google Scholar] [CrossRef]
  30. Li, R.; Chi, X. Thermal comfort and tourism climate changes in the Qinghai–Tibet Plateau in the last 50 years. Theor. Appl. Climatol. 2014, 117, 613–624. [Google Scholar] [CrossRef]
  31. Matzarakis, A.; Fröhlich, D.; Bermon, S.; Adami, P.E. Visualization of Climate Factors for Sports Events and Activities–The Tokyo 2020 Olympic Games. Atmosphere 2019, 10, 572. [Google Scholar] [CrossRef]
  32. Lin, T.-P.; Matzarakis, A. Tourism climate information based on human thermal perception in Taiwan and Eastern China. Tour. Manag. 2011, 32, 492–500. [Google Scholar] [CrossRef]
  33. Sahabi Abed, S.; Matzarakis, A. Quantification of the Tourism Climate of Algeria Based on the Climate-Tourism-Information-Scheme. Atmosphere 2018, 9, 250. [Google Scholar] [CrossRef]
  34. Li, X.; Wang, Y.; Tang, J.; Shi, L.; Zhao, T.; Chen, J. Emotional wellbeing in intercity travel: Factors affecting passengers’ long-distance travel moods. Front. Public Health 2022, 10, 1046922. [Google Scholar] [CrossRef]
Figure 1. Location analysis chart.
Atmosphere 15 00756 g001
Figure 2. Distribution of monthly average MTCI and MHCI values in Longsheng (2002–2022).
Atmosphere 15 00756 g002
Figure 3. Average monthly relative humidity and precipitation in Longsheng (2002–2022).
Atmosphere 15 00756 g003
Figure 4. Distribution of monthly average MTCI2 and MHCI2 values in Longsheng (2002–2022).
Atmosphere 15 00756 g004
Figure 5. Fitting climate index with acceptable percentage.
Atmosphere 15 00756 g005
Figure 6. Acceptable percentage of MHCI2 value for tourists.
Atmosphere 15 00756 g006
Figure 7. Probability distribution of tourism climate in Longsheng every month.
Atmosphere 15 00756 g007
Table 1. Comparison of some typical thermal indexes.
DimensionTCIBCICITMCITHCI
FormulaTCI = 4CID + CIA + 2P + 2S + WBCT = 0.18Ts + 0.26W + 0.27S + 0.29P + 0.28TwCIT = f [(T,B) × P] M C I T = 0 i f x M C I T X = 0 1 i f x 0 < M C I T X < 16 2 i f x M C I T X = 16 HCI = 4TC + 3P + 2A + W
Number of Variables79745
Concrete indicatorsprecipitation factor (P), daylight factor son (S), wind speed factor (W)Skin temperature (Ts), average wind speed, sunshine ratio, cumulative precipitation, bath water temperature ( T w )Thermal comfort (T), beauty (A), precipitation factorPerceived temperature (PT), wind speed, significant weather (SW), visibility (V)Thermal comfort (TC), physical effects, beauty (A)
Data GranularityMonthlyMonthlyDailyHourlyDaily
Model FormWeighted sumWeighted sumComposite assignmentMultiplicationWeighted sum
Average Classification10 levels5 levels7 levels3 levels10 levels
Applicable RangeLocal/regionalLocalLocalLocalLocal/regional
Table 2. Climate suitability questionnaire elements.
QuestionAre You Satisfied with Today’s Tourism Climate
Total number of respondents3247
genderMale51.3%
Female48.7%
Age range of respondentsChildren28.9%
Teenagers37.8%
Middle-aged and elderly33.3%
Identity of respondentsLocal tourists48.3%
Out-of-town tourists51.7%
Disclaimer/Publisher’s Note: The statements, opinions and data contained in all publications are solely those of the individual author(s) and contributor(s) and not of MDPI and/or the editor(s). MDPI and/or the editor(s) disclaim responsibility for any injury to people or property resulting from any ideas, methods, instructions or products referred to in the content.