Article

Evaluating the Performance and Applicability of Satellite Precipitation Products over the Rio Grande–San Juan Basin in Northeast Mexico

by
Dariela A. Vázquez-Rodríguez
1,
Víctor H. Guerra-Cobián
1,*,
José L. Bruster-Flores
1,
Carlos R. Fonseca
2 and
Fabiola D. Yépez-Rincón
1
1
Facultad de Ingeniería Civil, Universidad Autónoma de Nuevo León, Av. Universidad s/n, Ciudad Universitaria, San Nicolás de los Garza 66455, Mexico
2
Instituto Interamericano de Tecnología y Ciencias del Agua, Universidad Autónoma del Estado de México, km 14.5, Carretera Toluca-Atlacomulco, Toluca 50120, Mexico
*
Author to whom correspondence should be addressed.
Atmosphere 2024, 15(7), 749; https://doi.org/10.3390/atmos15070749
Submission received: 17 May 2024 / Revised: 5 June 2024 / Accepted: 20 June 2024 / Published: 22 June 2024
(This article belongs to the Topic Hydrology and Water Resources Management)

Abstract

:
Accurate observation of precipitation data is crucial for hydrometeorological applications, requiring temporal and spatial precision. Satellite precipitation products offer a promising solution for obtaining precipitation estimates, facilitating long-term observations from global to local scales. However, assessing their accuracy compared to rain gauge observations is essential. This study aims to assess the accuracy and applicability of precipitation data from CMORPH, IMERG, and PERSIANN CCS in the Rio Grande–San Juan Basin in northeast Mexico. The evaluation of estimated precipitation was assessed using the Pearson and Spearman correlations, RMSE, MAE, and BIAS for both monthly and yearly averages. CMORPH showed minimal errors and low underestimation, while IMERG exhibited high correlations with consistent underestimation. PERSIANN CCS had lower correlations, significant overestimation, and higher errors. The Mann–Kendall (MK) test was used to determinate the precipitation trends of observed and estimated data. The observed data showed a significant positive trend in monthly averages, which is not reflected in the annual trend. Furthermore, negative annual trends were found in at least 10 stations across the basin. The application of satellite precipitation data yielded mixed outcomes, with CMORPH showing the highest level of agreement with the trend analysis results from rain gauge data. This demonstrates its reliability for weather and climate studies and suggests the potential for CMORPH to be used as an input in hydrological modeling.

1. Introduction

Comprehending the temporal and spatial dynamics of rainfall holds vital importance for a wide range of hydrological and environmental applications. It is crucial to collect precipitation data that has both temporal and spatial resolutions to meet different requirements effectively. Precipitation data serves crucial purposes, including forecasting extreme flooding events, facilitating continuous hydrological simulations to estimate streamflow for dam reservoir management and water supply systems operation, issuing landslide warnings, and providing input for irrigation models, particularly in semiarid environments where agricultural activities are prevalent [1,2]. Through obtaining precise and comprehensive precipitation data, stakeholders can make informed decisions and implement strategies to manage water resources effectively and mitigate potential risks associated with hydrological events. Consequently, the study of precipitation has acquired relevance in recent decades, specifically precipitation trend analysis, due to the increased awareness of global climate change and its impacts [3]. However, measuring precipitation is challenging due to the high precipitation variability and limited measuring capacity. Nowadays, measuring and estimating precipitation can be obtained in three ways: ground-based observation stations, model simulation, and remote sensing observation as satellite precipitation products [4].
Networks of rainfall observation ground stations often encounter challenges with data reliability and coverage, stemming from limitations in the distribution and operational functionality of rain gauges. These limitations may arise due to socioeconomic constraints or the complex physical regional topography. In response to this issue, several studies have investigated the possibility of leveraging satellite precipitation products to estimate precipitation on both global and regional scales [5,6,7,8]. While satellite precipitation products offer the advantage of providing spatially consistent measurements at high resolutions, the accuracy and performance of estimated precipitation can vary regionally. This variability is attributed to differences in retrieval algorithms, instrument characteristics, and the diverse topographical features across regions [9]. Principal and commonly used satellite precipitation products for this purpose are Precipitation Estimation from Remotely Sensed Information using Artificial Neural Networks (PERSIANN), the Climate Prediction Center (CPC), the morphing technique product [10], the Tropical Rainfall Measuring Mission (TRMM), multi-sensor precipitation analysis (TMPA) [11], and, more recently, The Integrated Multi-satellitE Retrievals for GPM (IMERG). Assessment of the accuracy of satellite rainfall estimates compared to precipitation observations from gauges has been conducted across various spatial and temporal resolutions in numerous regions and basins worldwide [1].
Globally, in latitudes between 10° N and 35° N, performance evaluation analyses for some precipitation products were conducted. Some CMORPH analyses found that the product possesses the ability to detect precipitation events [12], and the possibility of being used in time series for precipitation and drought analysis [13]. Furthermore, in some cases, high levels of error and bias in seasonality analyses were found [2]. Recently, GPM IMERG has attracted attention, and their analyses obtained correlations approaching, low errors, and bias in arid and semiarid regions [14,15] as well as presenting estimation problems over mountain regions. Some studies suggest CMORPH is the best product over mountainous regions with tropical weather. On the other hand, IMERG has obtained good correlation and performance over arid and semiarid regions but has problems over mountainous regions [2,16,17,18,19].
The relevance of the products is also crucial. Usman [20] analyzed precipitation trends using satellite products over Nigeria and concluded that satellite rainfall estimates could obtain such information, especially since we observed high spatial variability in rainfall distribution and trends. Hussein [21] analyzed the reliability of IMERG, CMOPRH, and PERSIANN CCS over the UAE, and concluded that satellite products have great potential for improving the spatial aspect of rainfall frequency, being a good option for using data to complement rain gauges in IDF curves analysis and precipitation trend analysis.
Mexico is located between the same latitudes, and some studies have evaluated the performance of satellite precipitation products over the country [22,23,24] and over specific regions [25,26]. A few have concluded that the products performed better in humid tropical and sub-humid tropical areas, due to the highest accumulated rainfall heights and the highest number of rainy days over these regions. Otherwise, studies have analyzed trends over time and space in recent decades using the national rain gauge stations and meteorological station networks [27,28,29,30,31]. Studies from Alvarez-Olguin [32] and Campos-Aranda [33] have found that trends, apart from increasing or decreasing, are mostly non-significant, which could indicate the presence of variability in the study period. Also, this means that precipitation has not been constant enough to determine if they have been significant in recent years. None of these studies have analyzed the applicability of satellite products for hydrological purposes.
This study aims to evaluate the performance of three satellite precipitation products and use them to identify and analyze precipitation trends over the Rio Grande–San Juan Basin located in Northeast Mexico. The Rio Grande–San Juan basin is an intriguing area to study precipitation products due to its unique features. It is characterized by complex terrain, including mountains, and semiarid weather. In recent years, the basin has faced issues with water resources, such as low precipitation and drought periods [34,35]. Analyzing this phenomenon is complicated due to limited awareness of the rain gauge station network. The study of precipitation is essential for this region, as it is situated in the Metropolitan Zone of Monterrey—one of the most urbanized areas in the country, with a population of 5 million in 2020 [36], which has been experiencing water supply problems [37].
The main objectives of this study are (1) to evaluate the precipitation estimation by satellite products in a semiarid mountainous basin, (2) to analyze monthly and annual precipitation trends over 14 years (2005–2018) using the Mann–Kendall test, and (3) to analyze both spatial and temporal variability trends over the 14 years.

2. Materials and Methods

2.1. Study Area

The study area is the Rio Grande–San Juan basin, with 34,000 km2 of area, which comprises the states of Coahuila, Nuevo Leon, and Tamaulipas, located in the northeast of Mexico. The basin has a complicated orography and is located between the eastern mountainous range the “Sierra Madre” and the Gulf Coastal Plain in Mexico. The range of elevations is between 28 m and 3700 m, as shown in Figure 1.
The yearly average precipitation in the basin is 600 mm. However, some regions exhibit a lesser average of 400 mm per year in the north and west of the basin. Otherwise, the south, east, and mountainous regions receive an average of over 900 mm annually. Furthermore, most of the precipitation falls from June to September, with temperatures varying between 25 °C and 35 °C. During this time, the region is susceptible to extraordinary events such as hurricanes, tropical storms, and tropical depressions. In winter, from December to March, temperatures vary from −3 °C to 20 °C with low precipitation [38,39].

2.2. Datasets and Data Processing

The 14 years included in this study are from 1 January 2005, to 31 December 2018, based on the climatological records from 30 selected weather stations instituted by The National Meteorology Service (known as SMN according to its initials in Spanish) and The National Water Commission (known as CONAGUA according to its initials in Spanish). The stations are located around the basin at different elevations and in different regions, as shown in Figure 1.
All of the selected stations have at least 85% of the daily accumulated precipitation records for the study period. Table 1 shows the selected stations by region and their identification ID. The range of elevations is from 100 m to 2500 m. Although 60% of the stations are located between 100 and 550 m. Nine stations have an above average annual rainfall and are mostly located at elevations not higher than 550 m, except for stations 19,002 and 19,033.
Three satellite precipitation products were selected to analyze their estimates and performance in the basin for a future complement and to improve the national precipitation data records. The satellite products are CMORPH V.01, IMERG GPM Final V6, and PERSIANN CCS, and the characteristics of the downloaded and used files are in Table 2.
CMORPH: The Climate Prediction Center (CPC) morphing technique (CMORPH) [42] is a satellite precipitation estimate with reprocessed and bias-corrected data on an initial 8 × 8 km grid over the globe (60° S–60° N) and in a 30 min temporal resolution for an 18-year period from January 1998 to December 2019 that forms a climate data record (CDR) for high-resolution global precipitation analysis. CMORPH V 1.0 uses five geostationary satellites and seven PMW-derived precipitation estimates to improve estimates; V 1.0 uses high-quality rain gauge data over the United States and Australia and radar data over the United States [10].
IMERG: The Integrated Multi-satellitE Retrievals for GPM (*IMERG*) is a unified U.S. algorithm that provides a multi-satellite precipitation product for the U.S. Global Precipitation Measurement team. The precipitation estimates are obtained from various precipitation-relevant PMW sensors comprising the GPM constellation and are computed using the Goddard Profiling Algorithm (GPROF2017). The products are gridded and intercalibrated to the GPM Combined Radar Radiometer Analysis product (with GPCP climatological calibration) and combined into half-hourly 0.1° × 0.1° fields [43,44].
PERSIANN CCS: The Precipitation Estimation from Remotely Sensed Information using Artificial Neural Networks (PERSIANN) system developed by the Center for Hydrometeorology and Remote Sensing (CHRS) as version Cloud Classification System (CCS) is a real-time global high-resolution satellite precipitation product that enables the categorization of cloud-patch features based on cloud height, areal extent, and variability of texture estimated from satellite imagery [45,46].
Table 2. Satellite precipitation file information characteristics.
Product FileSpatial
Resolution
Temporal
Resolution
ReferenceData Source
CMORPHBin0.25° Daily[47]https://ftp.cpc.ncep.noaa.gov/precip/CMORPH_V1.0/ (accessed on 23 June 2022)
IMERGTif0.1° [48]https://arthurhouhttps.pps.eosdis.nasa.gov/gpmdata/ (accessed on 21 February 2022)
PERSIANN—CCSArcGrid0.04° [46]https://chrsdata.eng.uci.edu/ (accessed on 15 January 2022)
The precipitation data obtained from the stations and SPPs was accumulated daily and compressed into two different accurate time series for a major examination of estimation, performance, and trend analysis. Each time series was analyzed at two levels. The first one is “station level”, which analyzes the precipitation amounts from the observed station value versus the estimated station value. Furthermore, the second level was the “basin level”, in which trait the average precipitation of the study area was analyzed in terms of the observed values versus the estimated values. For this purpose, were calculated amounts and averages at monthly and yearly scales.
The time series used in this research were on a monthly and yearly scale. Each time series was analyzed at each level of analysis. The monthly time series comprises the amount or average of the 156 months in the study period. Meanwhile, the yearly time series is composed of the amount or average of the 13 years of the study period.
It is important to mention that, given the lack of information collected by most of the weather stations for the year 2007, this year was omitted in both evaluations (estimations and trends) for the time series and both level analyses (basin and stations). According to this, the monthly analysis was comprehended from January 2005 to December 2006 and from January 2008 to December 2018. Consequently, the total number of months in the series was 156 months.

2.3. Statistical Evaluation

To analyze the performance and accuracy of the selected satellite products, precipitation was evaluated by comparing it with records from weather stations. For this purpose, we applied four parametric statics (Table 3) including Pearson linear correlation (CP) (Equation (1)); mean absolute error (MAE) (Equation (2)) to measure the average absolute magnitude of errors by equal weight; root mean square error (RMSE) (Equation (2)), which gives importance to more significant errors and tends to be more sensitive and influenced by outliers; and bias (Equation (4)), which quantifies how much the predicted values systematically deviate from the true values and positive values indicate an overestimation while negatives an underestimation.
In addition, one non-parametric method was used for correlation: the Spearman rho test (CS) (Equation (5)), which differs from Pearson in the systematic rank correlation. Spearman correlation assumes that variables have a monotonic relationship, with no assumptions regarding distribution [49].
In Equations (1)–(4), the variable Xi denotes estimated precipitation values and Y i represents the volume of observed precipitation values. X ¯ is the mean precipitation of the estimated values and Y ¯ is the mean volume of precipitation observed in stations at an “n” occurrence. “n” denotes occurrence. For Equation (5), di is the difference between the ranks of the corresponding rainfall values.

2.4. Trend Analysis: Mann–Kendall Test

The Mann–Kendall (MK) test [50,51] is a non-parametric test commonly used to analyze trends in hydroclimatic series [52,53]. The test assumes that observations are independent and random, with no serial correlation between observations [54]. The MK test is calculated using the significance test Z and statistic test S as:
S = i = 1 n 1 j = i + 1 n s i g n ( x j x i )
s i n g x j x i = + 1   x j x i > 0 0   x j x i = 0 1   x j x i < 0
V a r S = n n 1 2 n + 5 i = 1 m t i ( t i 1 ) ( 2 t i + 5 ) 18
Z = S ± 1 V a r ( S )
In Equations (6) and (7) the number of observations is denoted by n, while xj and xi are represented as the rank of i (i = 1, 2, 3, …., n − 1) and j (j = i + 1, 2, 3, …, n) observations. Meanwhile, in Equation (8), n is the number of data points, m is the number of tied groups, and variable ti denotes the number of ties of the extended i. For Equation (9), it uses S−1 if S > 0, S + 1 if S < 0, and Z is 0 when S = 0 [55].
In this test, Z denotes the significance and direction of the trend based on the designed value of alpha. There is an increasingly significant trend at the 95% significance level if Z is no less than 1.96; whereas, if Z is no greater than −1.96, there is a significant decreasing trend. At the same time, a positive or negative value of Z determines the direction of the trend, increasing or decreasing, respectively.

3. Results

3.1. Monthly Estimation Evaluation

3.1.1. Basin Analysis

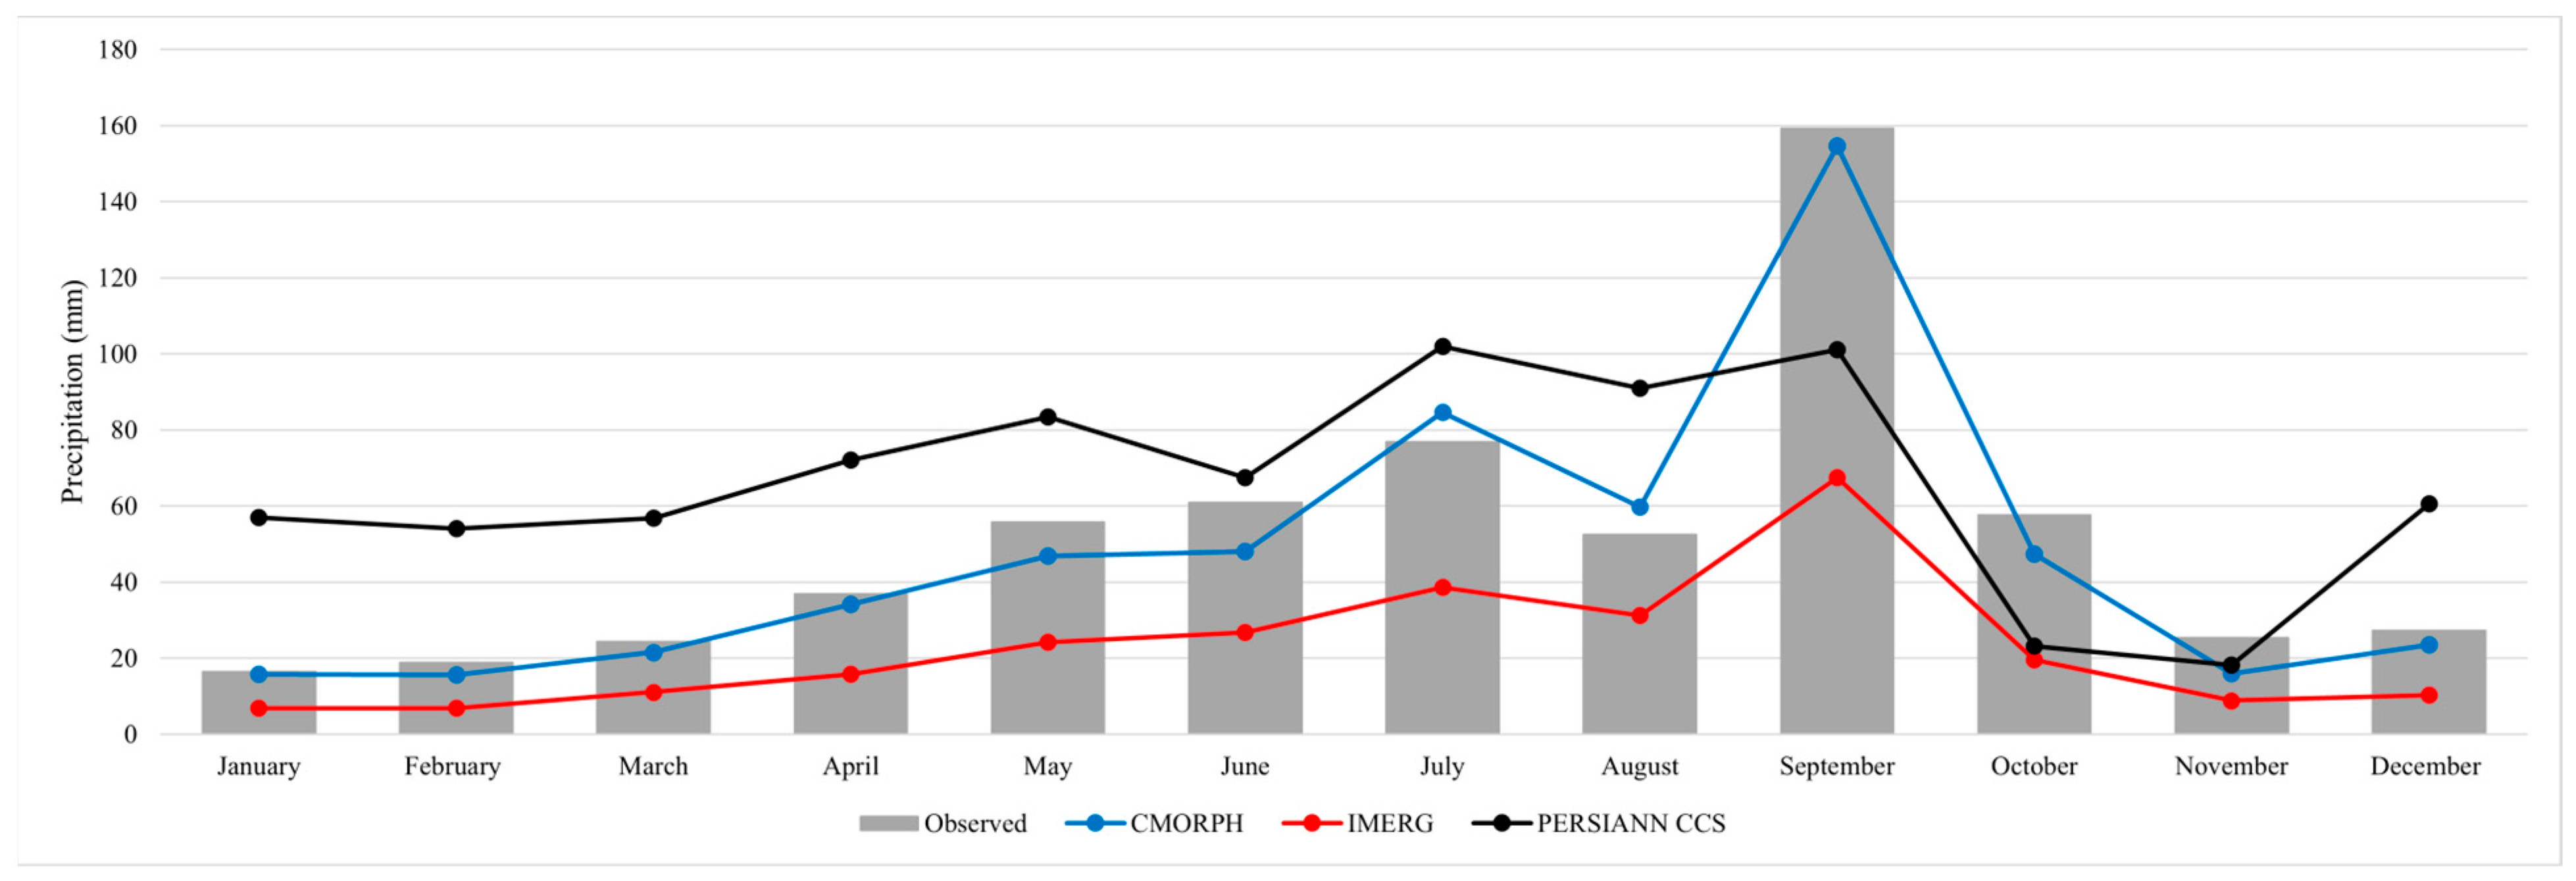
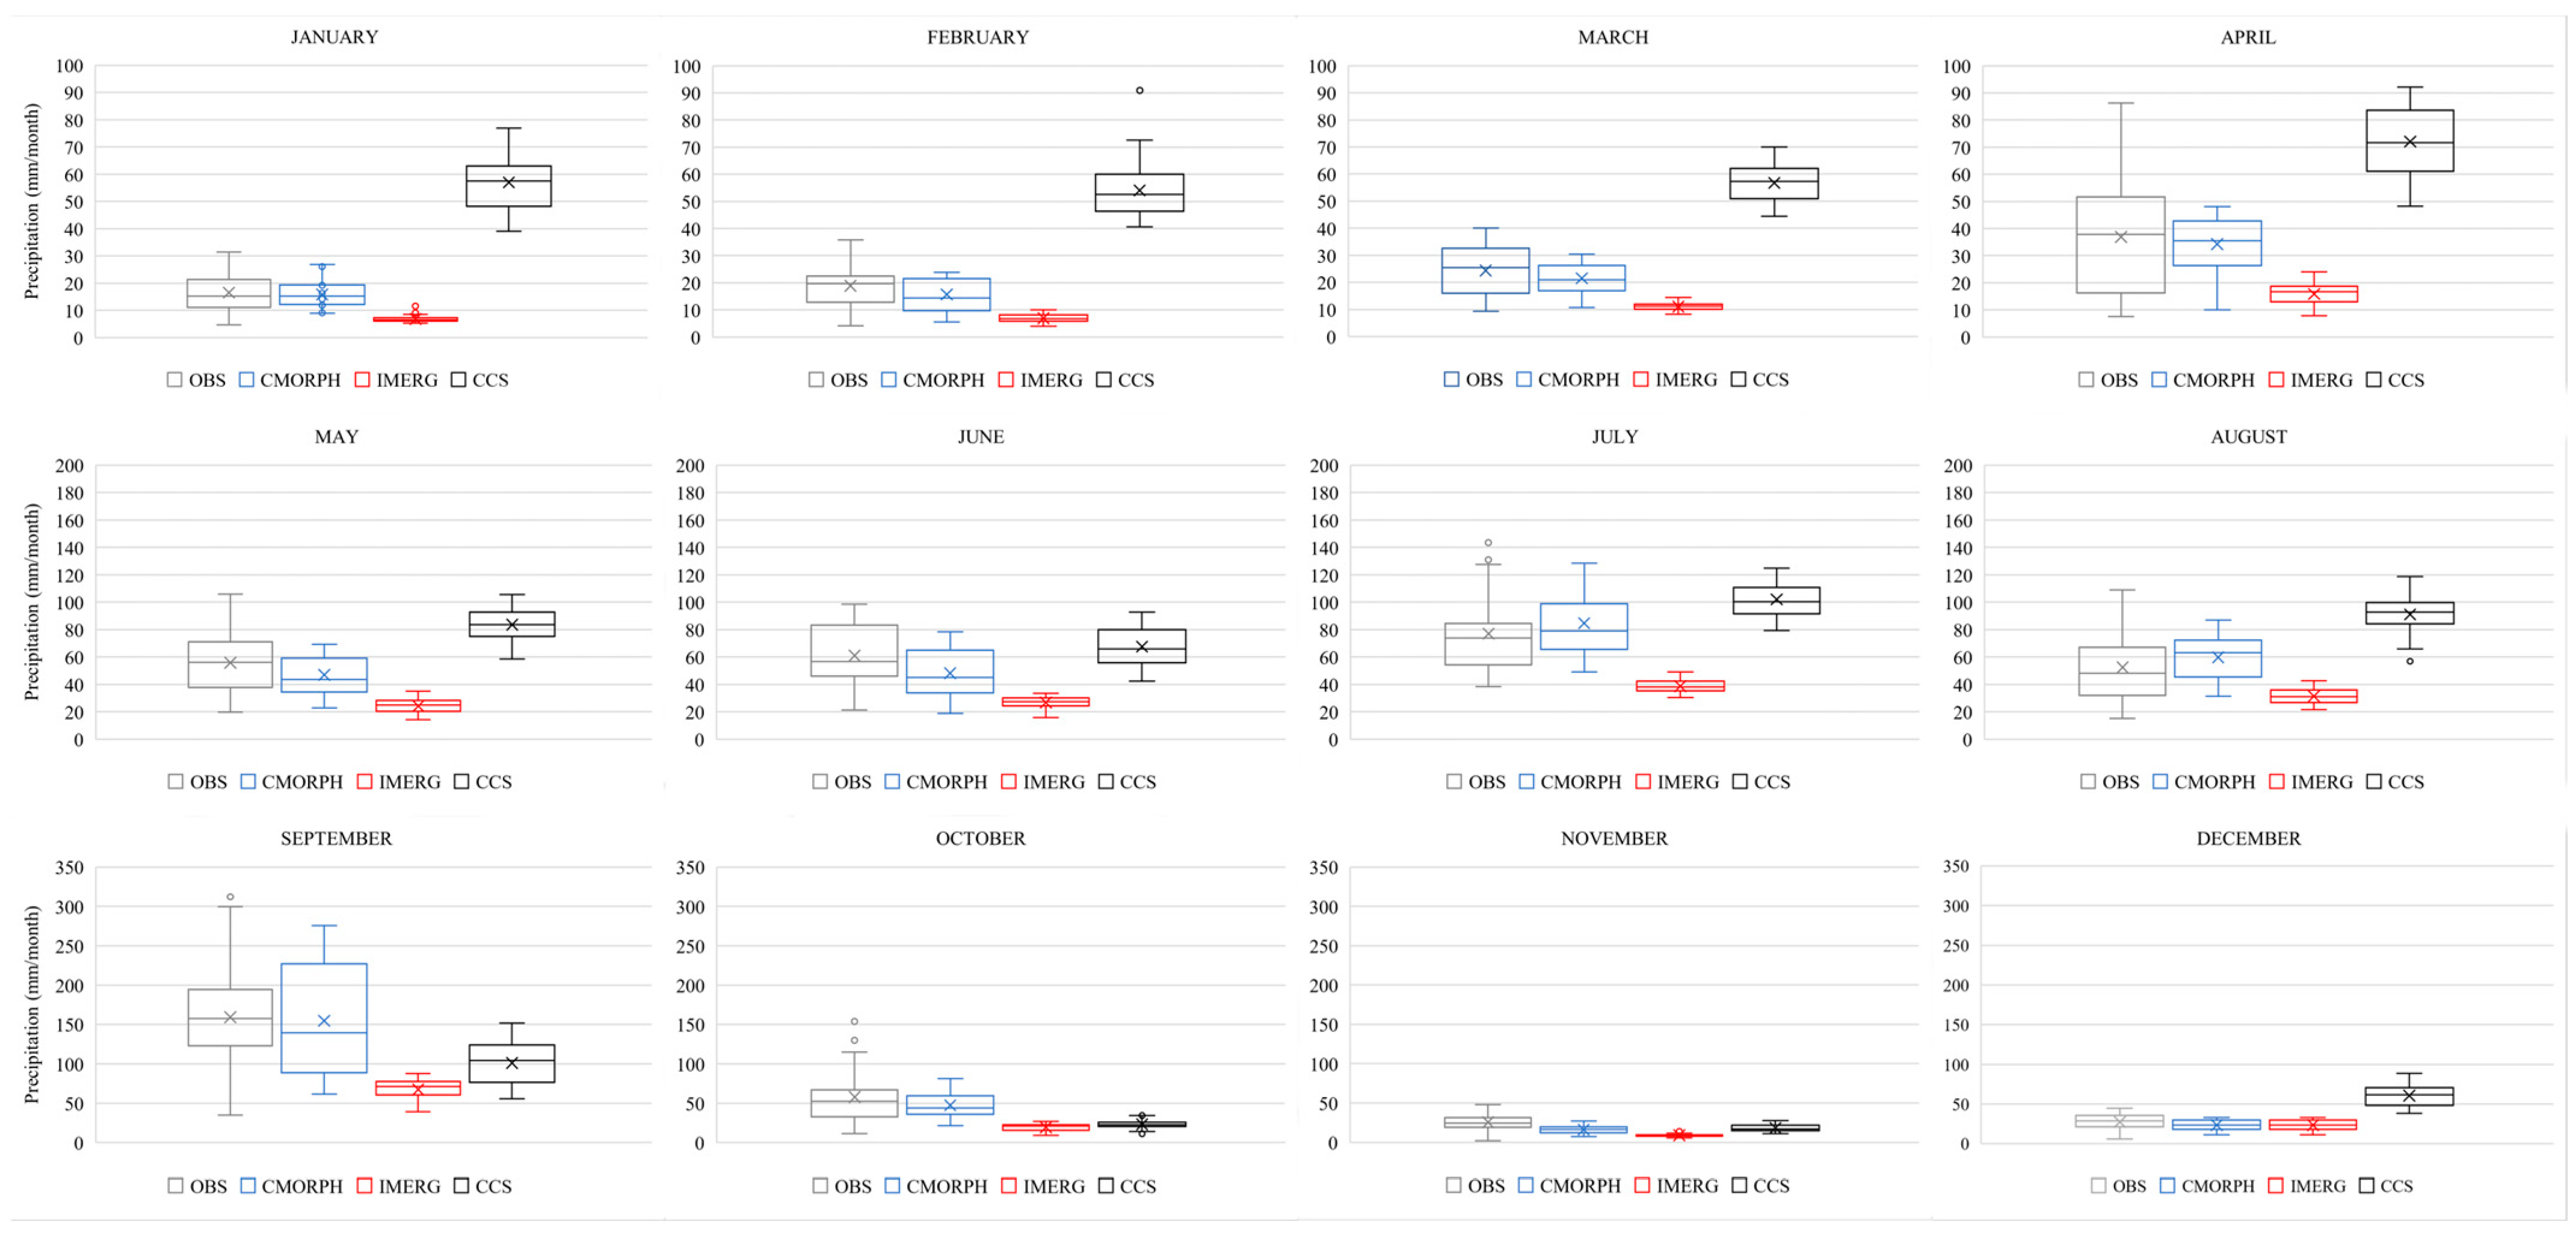
The average per month for each product is visualized in Figure 2 and Figure 3. The conducted analysis demonstrated that the monthly average precipitation is 51.04 mm, but it differs from the standard derivation. In Figure 2, it is evident that the humid period extends from June to October, except for August. On the other hand, September is the month with the highest precipitation average in the basin. Furthermore, January and February have the lowest average precipitation. In Figure 3, it is appreciable that IMERG presents an underestimation in the monthly average independently of the monthly average. In contrast, it is also noticeable that PERSIANN CCS has an overestimation in nine months of the year, months with a higher average precipitation present an underestimation.
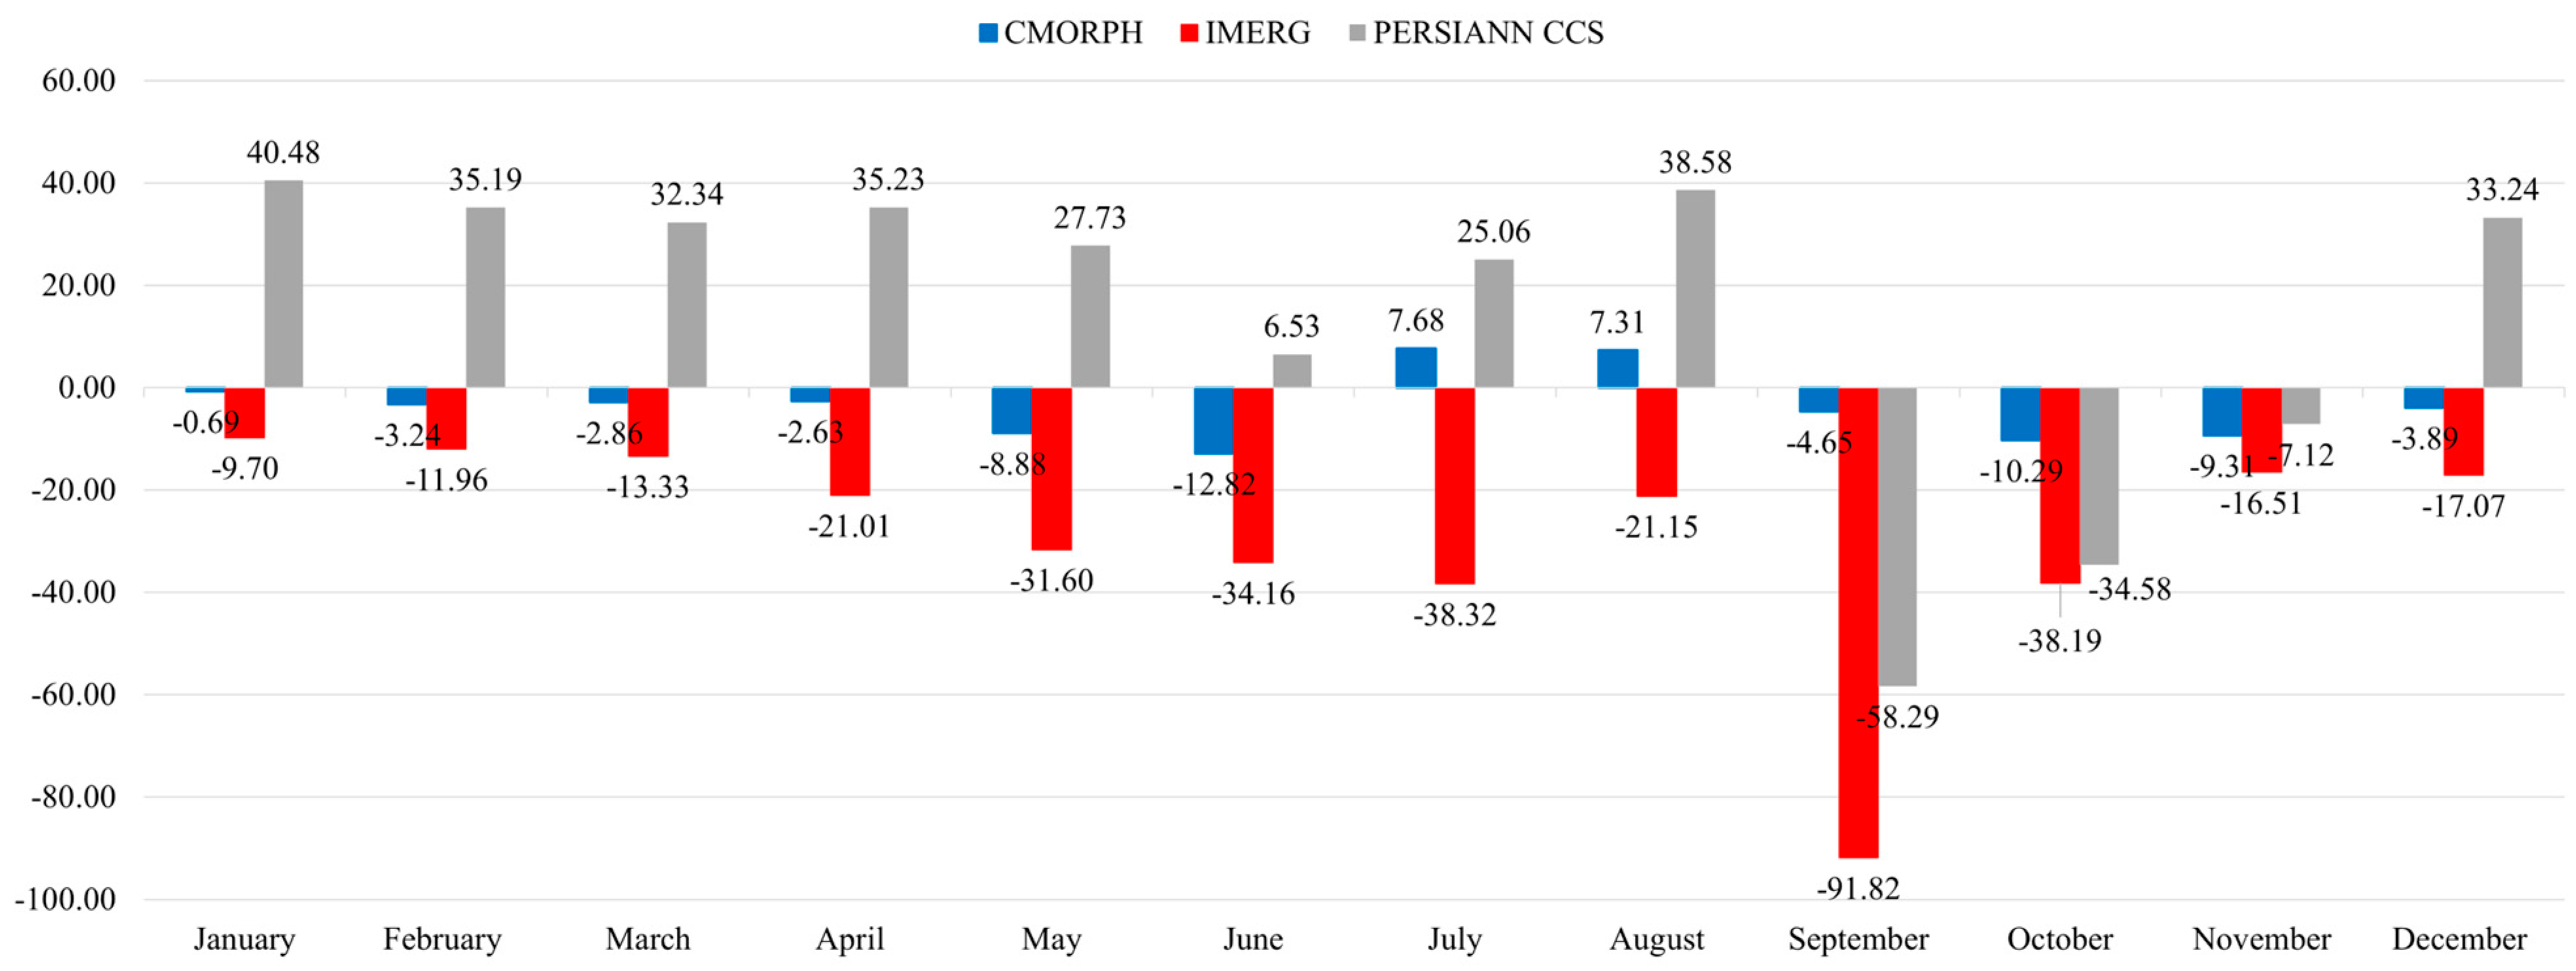
For correlation analysis, both tests have similar results for each product, as shown in Table 4, and Figure 4. For the Pearson and Spearman correlations, IMERG obtained the highest values, while PERSIANN CCS obtained the lowest. The MAE and RMSE tests showed that IMERG and PERSIANN CCS have the highest errors. In contrast, the bias test revealed that PERSIANN CCS overestimates precipitation instead of underestimating, like CMORPH and IMERG. To clarify the performance of the products, Figure 3 shows the evaluation metrics for each satellite product by month.
Starting with correlation analysis, the performance of the products in both tests is very similar. August has low correlation values, above 0.5 for all products and tests. PERSIANN CCS and CMORPH have July as the lowest correlated month, with values less than 0.10 for CMORPH and negative values around 0.25 for PERSIANN. In contrast, IMERG has January as its second low-correlated month.
Figure 4a,b show that each product’s best correlation months vary. April and May for CMORPH by 0.8, September and October for IMERG by 0.7, and PERSIANN CCS set February for the Pearson correlation and April and March for the Spearman correlation.
Error tests identify September as the month with the highest values in all products and PERSIANN CCS as the product with the highest error values by month in both error tests. The performance of PERSIANN CCS indicates that the product is not estimating the values correctly regardless of the monthly precipitation average, which can be seen in Figure 5a,b. In contrast, the errors of CMORPH and IMERG are mostly above the average monthly precipitation for each month. This indicates that errors tend to depend on the magnitude of the average precipitation.
The bias performance displayed in Table 4 is further illustrated in the monthly analysis depicted in Figure 6. IMERG consistently underestimates values across all months, while CMORPH and PERSIANN CCS underestimate values during July and August, and September to November, respectively. The overestimated values of PERSIANN CCS are between 25 and 40 mm, with an exception in June with 6 mm. This performance is similar to that obtained by error test. The bias values are independent of average precipitation in the case of overestimation.

3.1.2. Station Analysis

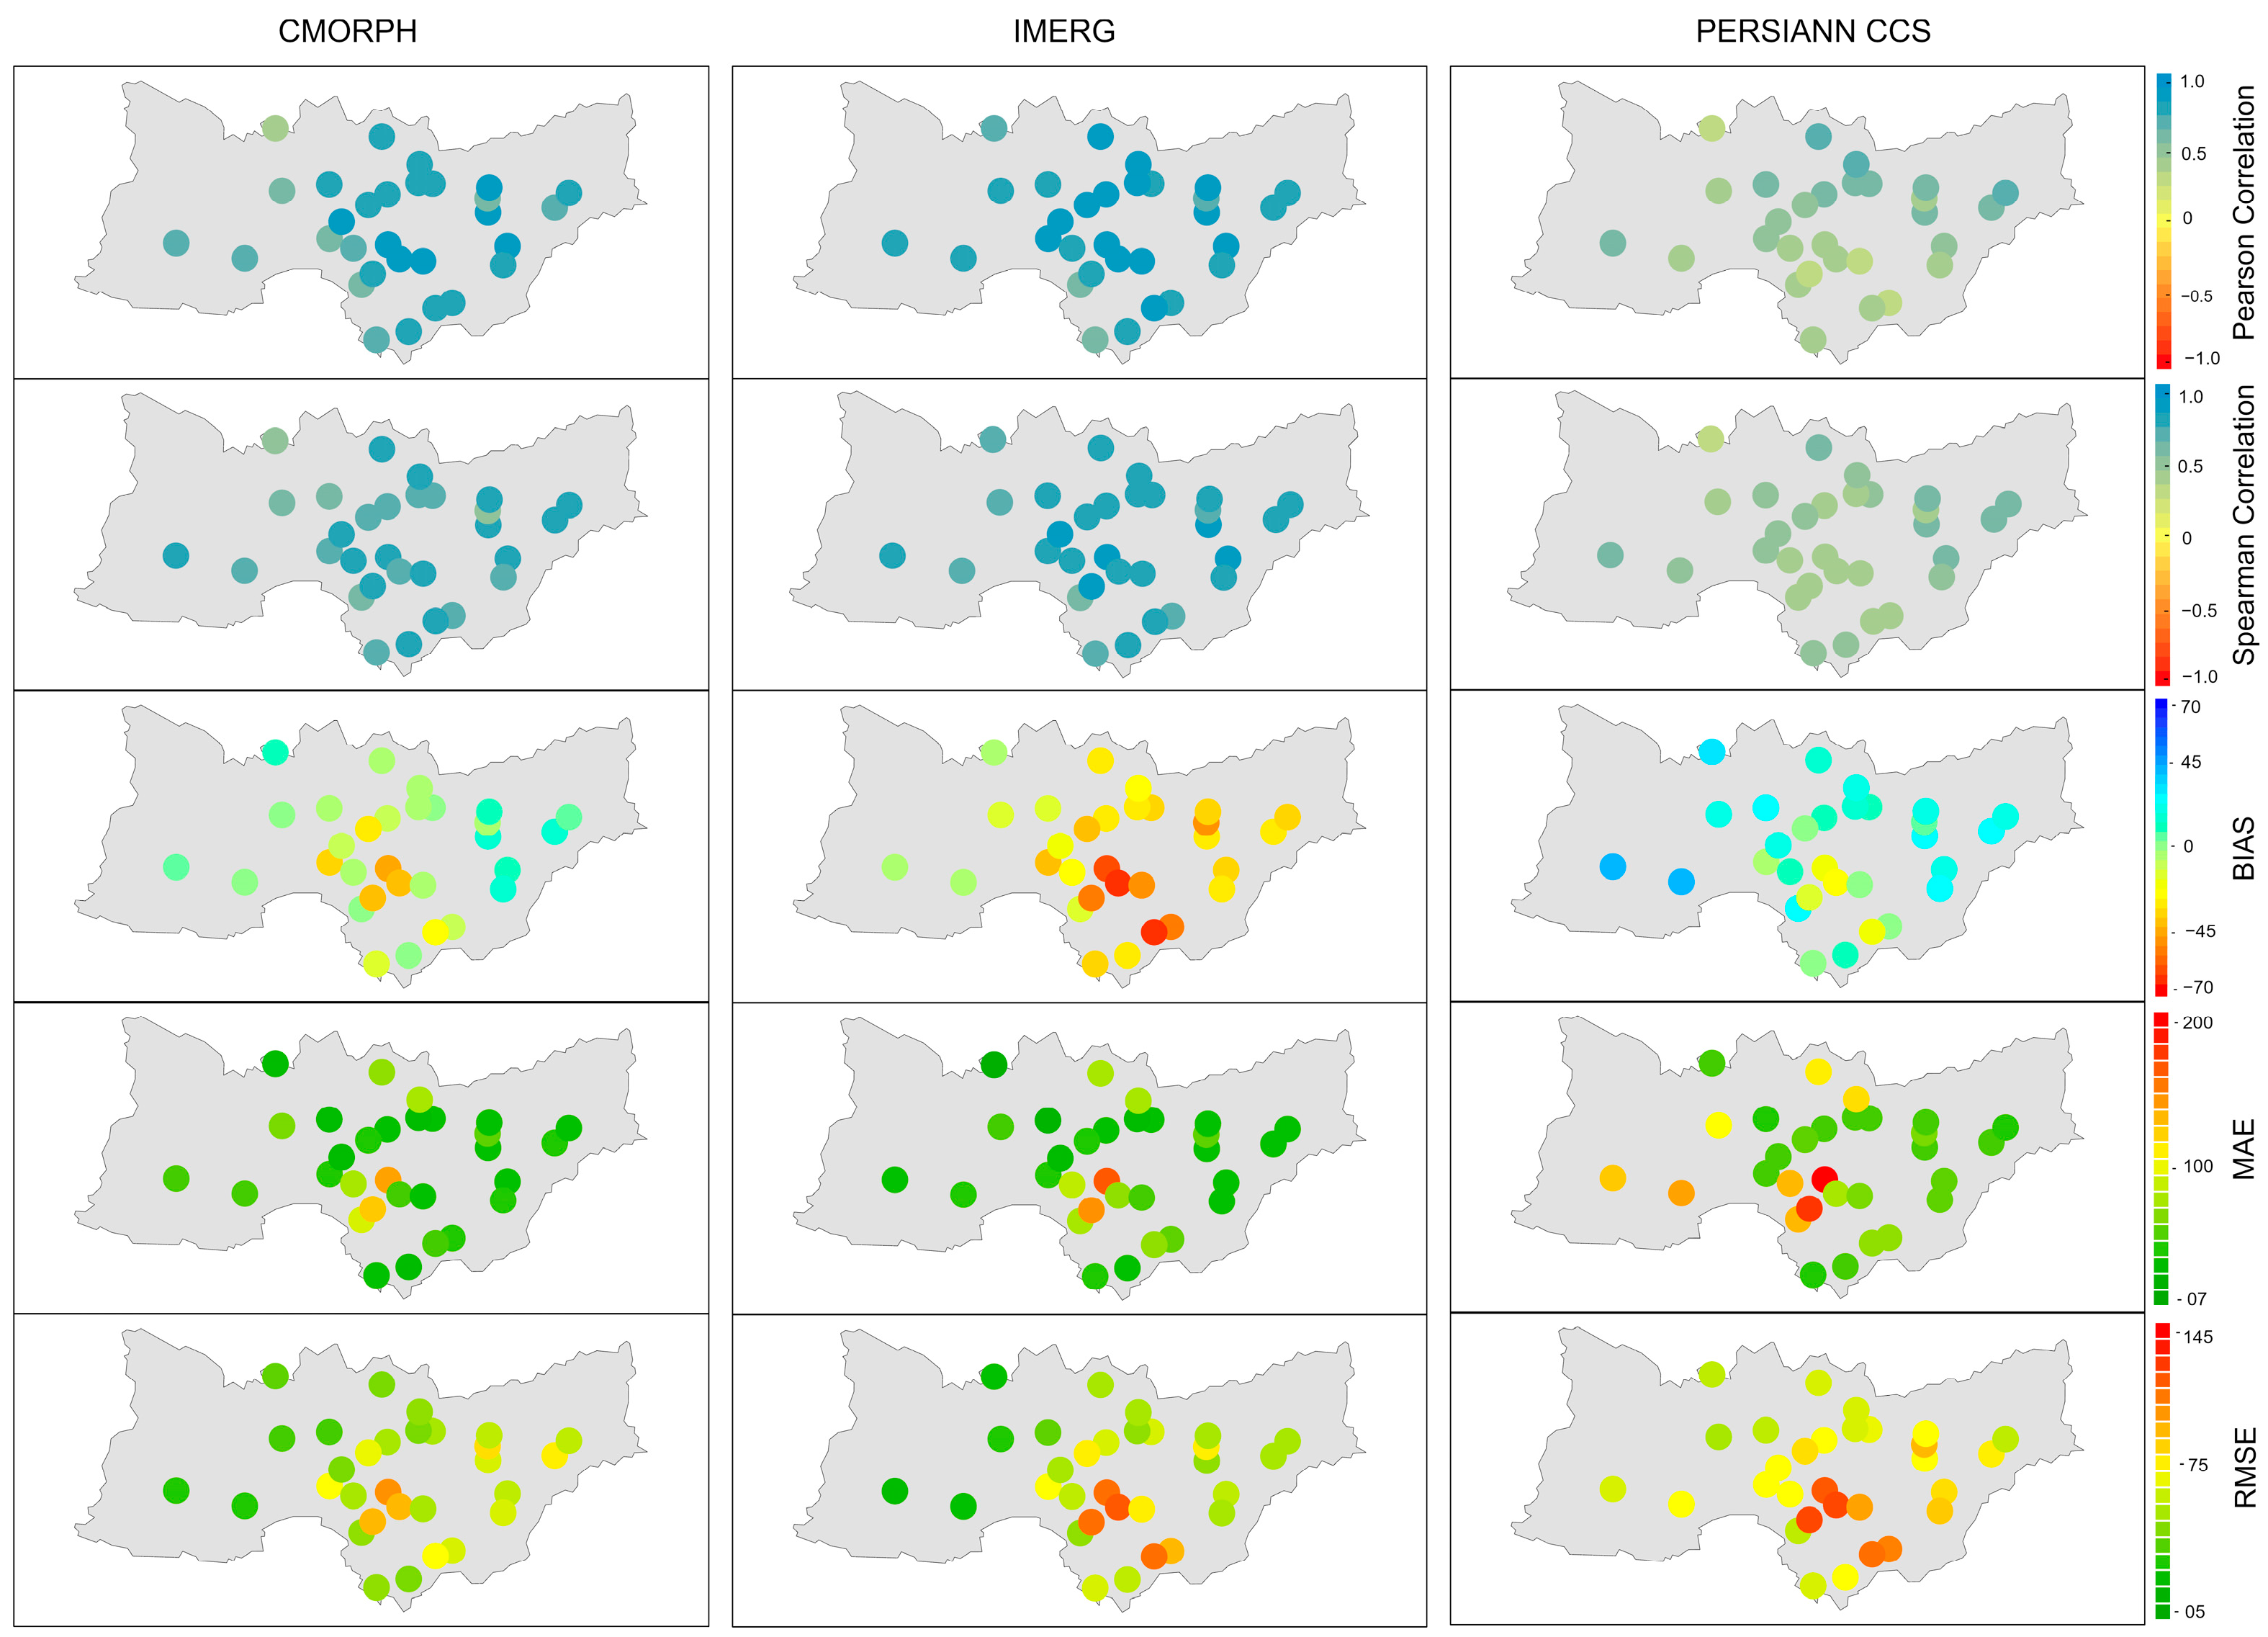
The evaluation of the estimation performance results of the satellite products by station is shown in Figure 7. The evaluations show that PERSIANN CCS tends to have the lowest correlation values, although error values are higher than 70 mm per station and tend to overestimate values. IMERG and CMORPH are well correlated in both tests. The precipitation estimation by IMERG tends to underestimate values regardless of the station, while CMORPH tends to change bias depending on the station. In the case of errors, values are usually lower than 75 mm and IMERG and CMORPH showed a strong dependence on station location.
Being more detailed in terms of correlation results, IMERG is the most highly correlated product, with values higher than 0.8 for 18 stations using Pearson’s and 12 stations using Spearman’s tests. Most of these stations are in the center and east regions. However, there is no correlation above 0.5 in any station for either test.
Notably, PERSIANN CCS exhibits the lowest correlation among the products, with none of the stations achieving a correlation coefficient of 0.8 or higher. Specifically, 19 stations have correlation coefficients below 0.5 for the Pearson correlation and 23 stations for the Spearman correlation. Notably, half of the stations in both cases are in the mountainous and southern regions.
Regarding CMORPH, a correlation coefficient of 0.8 or higher is present in only eight stations. These stations are mostly located in the center and east regions, with two exceptions in the south region. This correlation coefficient is only applicable to the Pearson correlation. On the other hand, the Spearman correlation shows no stations with correlation values higher than 0.8. However, two stations have correlation coefficients above 0.5.
The MAE and RMSE tests show that PERSIANN CCS has the highest errors by station, while CMORPH obtained the lowest values above the monthly precipitation average in the center and east regions. There were errors above 100 mm in the El Cerrito station, which is in the center region, and the Laguna de Sanchez station in the mountainous region. Furthermore, despite PERSIANN CCS not obtaining values above 51 mm for RMSE, the mountainous, south, and north stations have the highest MAE and RMSE values for all products.
The results in the per-station level of bias, CMORPH, and PERSIANN CCS presented a mixture of over- and underestimation. CMORPH underestimated values in 14 stations, half of them with values around –30 mm, and most located in the center, mountainous, and south regions. PERSIANN CCS overestimated precipitation levels in 25 stations. The west region experienced an overestimation of 40 mm, while the east region overestimated of 20 mm. The five stations that underestimated precipitation are not located in any specific region or elevation. The IMERG underestimation was present at all stations, with the lowest values in the west region and higher values exceeding –50 mm in the south region.

3.2. Annual Estimation Evaluation

3.2.1. Basin Analysis

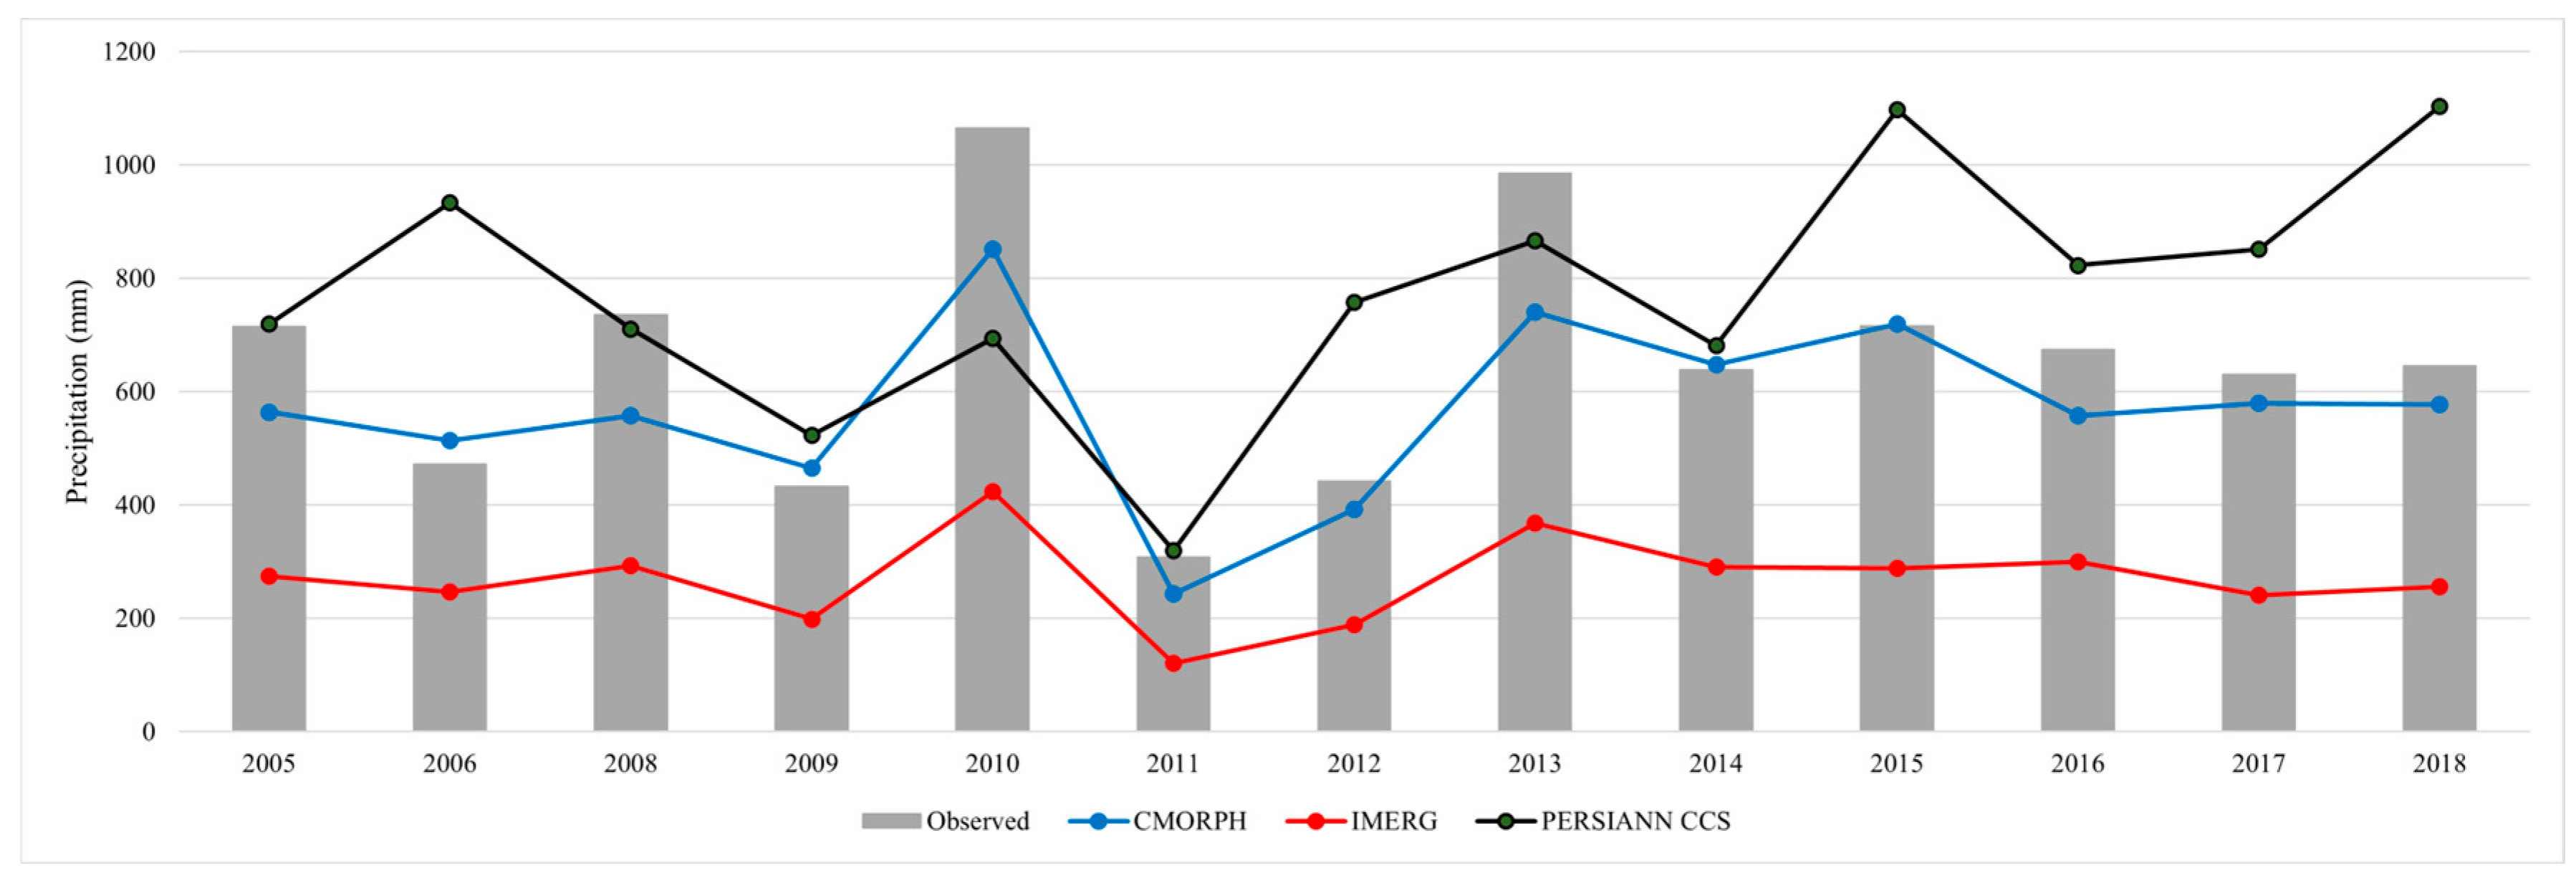
Figure 8 shows the average annual precipitation for each satellite product, compared with the averages from the weather stations (observed). By conducting a comparison of the performance of the satellite products, it is easy to appreciate that satellite products overestimate or underestimate the annual average precipitation. To appreciate the performance of each product, Table 5 shows the results of the statistics evaluation.
The correlation test indicates that CMORPH and IMERG are the best-correlated products with values higher than 0.85 for CP and CS. In contrast, PERSIANN CCS obtained the lowest values in both correlation analyses, in which the Pearson correlation has the lowest value of 0.24.
Error tests show the magnitude and type of errors for each satellite product. IMERG has higher error values, with rates higher than 390 mm. In contrast, CMORPH obtained values between 99 and 126 mm. At the same time, PERSIANN CCS presented lower values than IMERG but higher than CMORPH. Its values were between 200 and 300 mm.
The error and correlation tests indicate that satellite products have estimation problems. To measure and categorize them, the bias test shows that CMORPH and IMERG have a negative result, which indicates an underestimation, as is shown in Table 5. In contrast, PERSIANN CCS obtained a positive bias, which indicates an overestimation of the annual values.

3.2.2. Station Analysis

Each station was evaluated using five statistics tests for the station analysis level. Figure 9 shows the obtained results for the Pearson and Spearman correlations, bias, mean absolute error (MAE), and root mean square error (RMSE). As expected with the basin-level results, each correlation test shows higher values with CMORPH and IMERG. Additionally, PERSIANN CCS obtained the lowest and negative values, as observed in Figure 8.
The results of the Pearson correlation for CMORPH show that most of the stations with values higher than 0.60 are distributed around the basin independently of their elevation. This product also obtained higher values in stations between 100 and 510 m, most in the east part of the basin. IMERG, on the other hand, obtained 26 stations with correlations higher than 0.7 in the Pearson correlation test. In addition, stations with 0.90 or higher are located mostly in the center, with elevations around 200 to 550 m. In the case of Spearman’s results, only 21 stations have values greater than 0.7.
The PERSIANN CCS correlations are not higher than 0.73 in both tests. Instead, the lowest correlations are in the south area in low elevations; however, the two stations with elevations above 1800 m obtained the lowest and most negative values.
The error test results for MAE and RMSE by station are shown in Figure 8, in which the product’s behavior is like that observed at the basin level of analysis. Once again, CMORPH obtained the lowest values for both error tests, with rates lower than 550. However, mountainous regions show higher values for both tests in Laguna de Sanchez and Potrero de Abrego stations.
IMERG values are distributed between 100 and 850. These distributions also happen regionally. Furthermore, the highest values are in the south region at four stations. Only one station presented values less than 100, and this is the La Popa station in the north region at an elevation of 925 m. In the case of PERSIANN CCS, most of the values for both tests are between 200 and 500. In contrast, the highest values are in the west and mountainous regions, at similar elevations between 1600 and 1800 m, and with values higher than 700. Additionally, only two stations in the MAE test resulted in values lower than 200, despite similarities in region or elevation.
The bias tests clarify the performance of satellite products in each station. In these, once again, PERSIANN CSS presented an overestimated value. Conversely, CMORPH obtained overestimated values for some stations and underestimated them in general at the basin level. In contrast, IMERG stations present a general underestimation.
The bias for CMORPH indicates an underestimation at 29 stations and an overestimation at 11 stations. The overestimated values are in the center and south regions, with two exceptions in the west and east regions, and all stations have common elevations of less than 500 m. The stations that presented underestimation are mostly at high elevations (more than 900 m), with some exceptions in low elevations (less than 500 m).
As with the basin level, IMERG presents an underestimation. All the stations in this product presented an underestimation, with higher values in the west and mountainous regions at elevations above 1600 m. Lastly, PERSIANN CCS-obtained bias had mostly positive values, which indicated an overestimation at 22 stations. The range of overestimated values is from 15 to 456 mm. All stations in the north and south presented these results. Additionally, most of the other regions presented overestimation values. Conversely, stations with underestimation values are at elevations above 1680 m in the west and mountainous regions.

3.3. Trend Analysis

3.3.1. Monthly

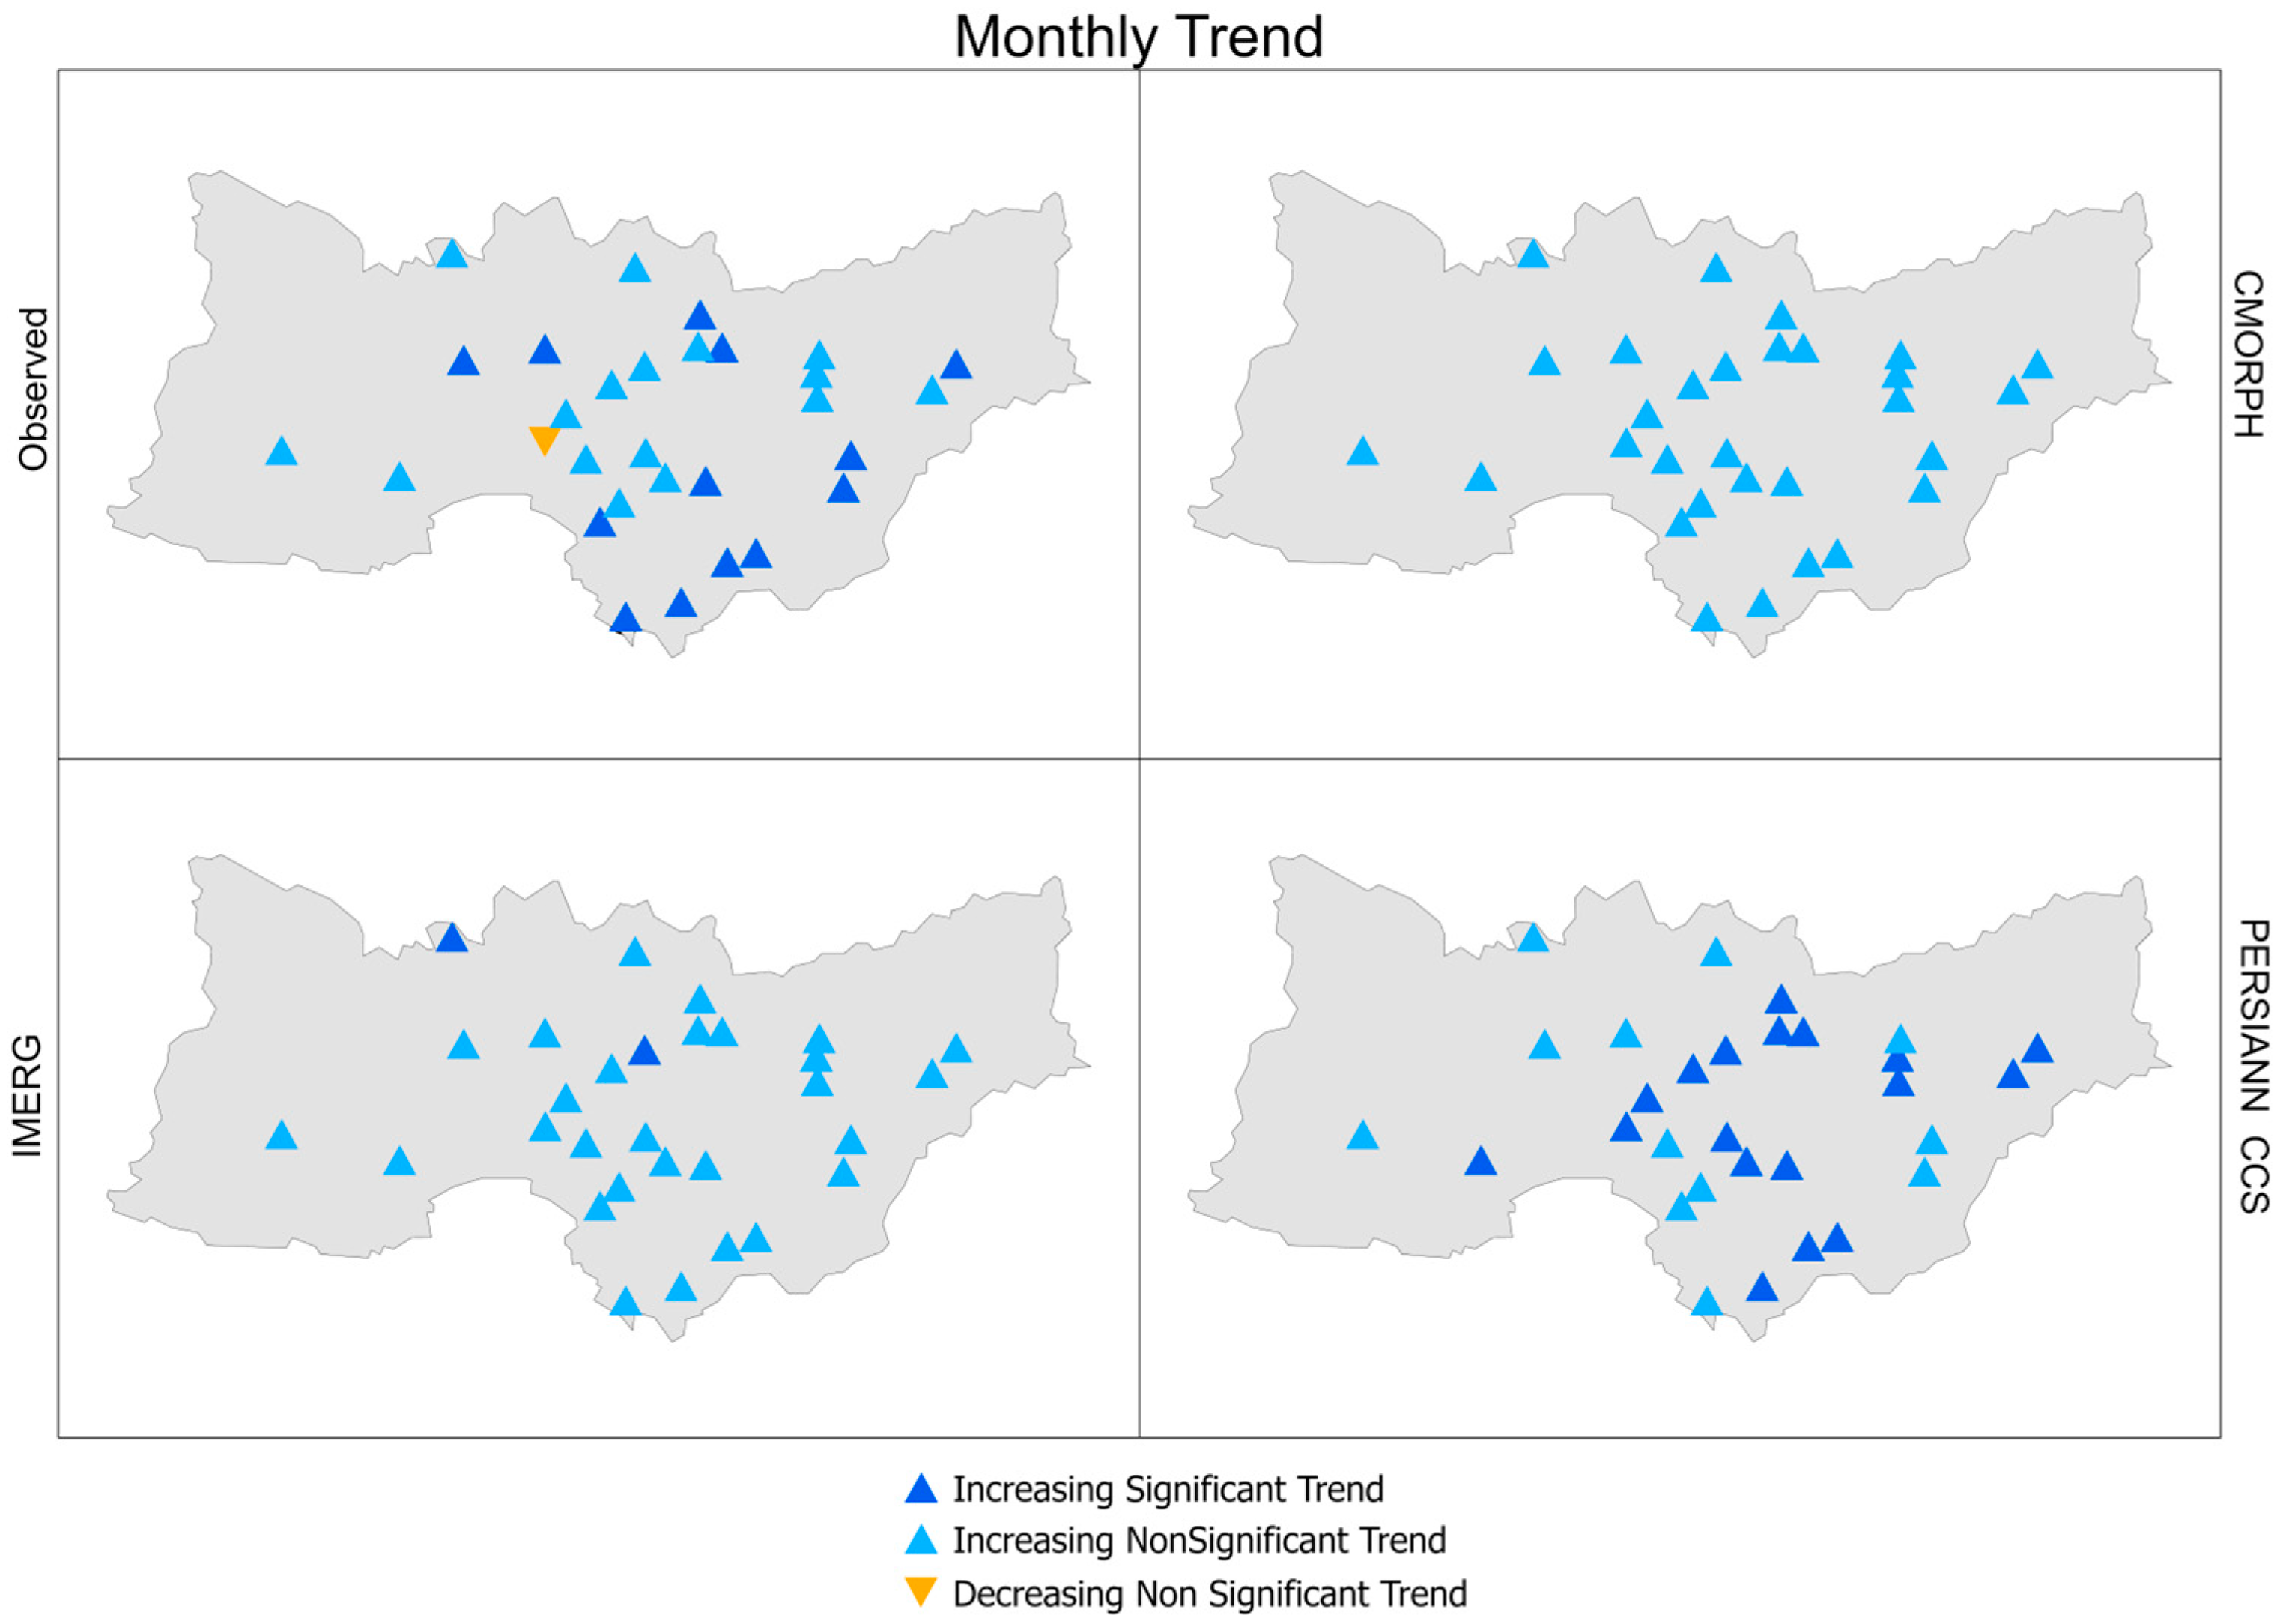
The monthly trend analyses were significantly different between the observed and estimated data. This was predictable given the estimation vs. evaluation results. The station level shows a more notable difference between the observed data and the satellite data than the basin level.
On the basin level, the observed data reflects the actual trend in the Rio Grande–San Juan Basin. The results show an increasingly significant trend. On the other hand, all satellite data shows an increasing trend that is not statistically significant, while all related products yield similar results, as shown in Table 6.
The per-station trend analysis shows an increasingly significant trend in 14 stations, an increasingly non-significant trend in 15 stations, and one station shows a decreasingly non-significant trend, as shown in Figure 10, in which the results by station for all products can be appreciated. Furthermore, the difference between the satellite products and the observed values is noticeable.
IMERG and PERSIANN CCS have stations with increasingly significant trends, but only PERSIANN CSS has some stations with the same trend as the observed values. Otherwise, CMORPH does not have any stations with an increasingly significant trend. Furthermore, no satellite products have stations with a decreasing trend.
As mentioned previously, PERSIANN CCS has 13 stations with the same trend as the weather stations, seven of which have an increasingly significant trend. These stations have similar low elevations between 100 and 500 m and an average annual precipitation of at least 680 mm. In contrast, the other stations with increasingly non-significant trends do not share similarities among them.
IMERG has 14 stations coinciding with an increasingly non-significant trend. Despite their similar trends, these stations do not share characteristics such as elevation, region, or annual average precipitation. A similarity is evident with the CMORPH trend analysis, in which the 15 stations with the same trend as the observed values do not share any similar physical characteristics.

3.3.2. Annually

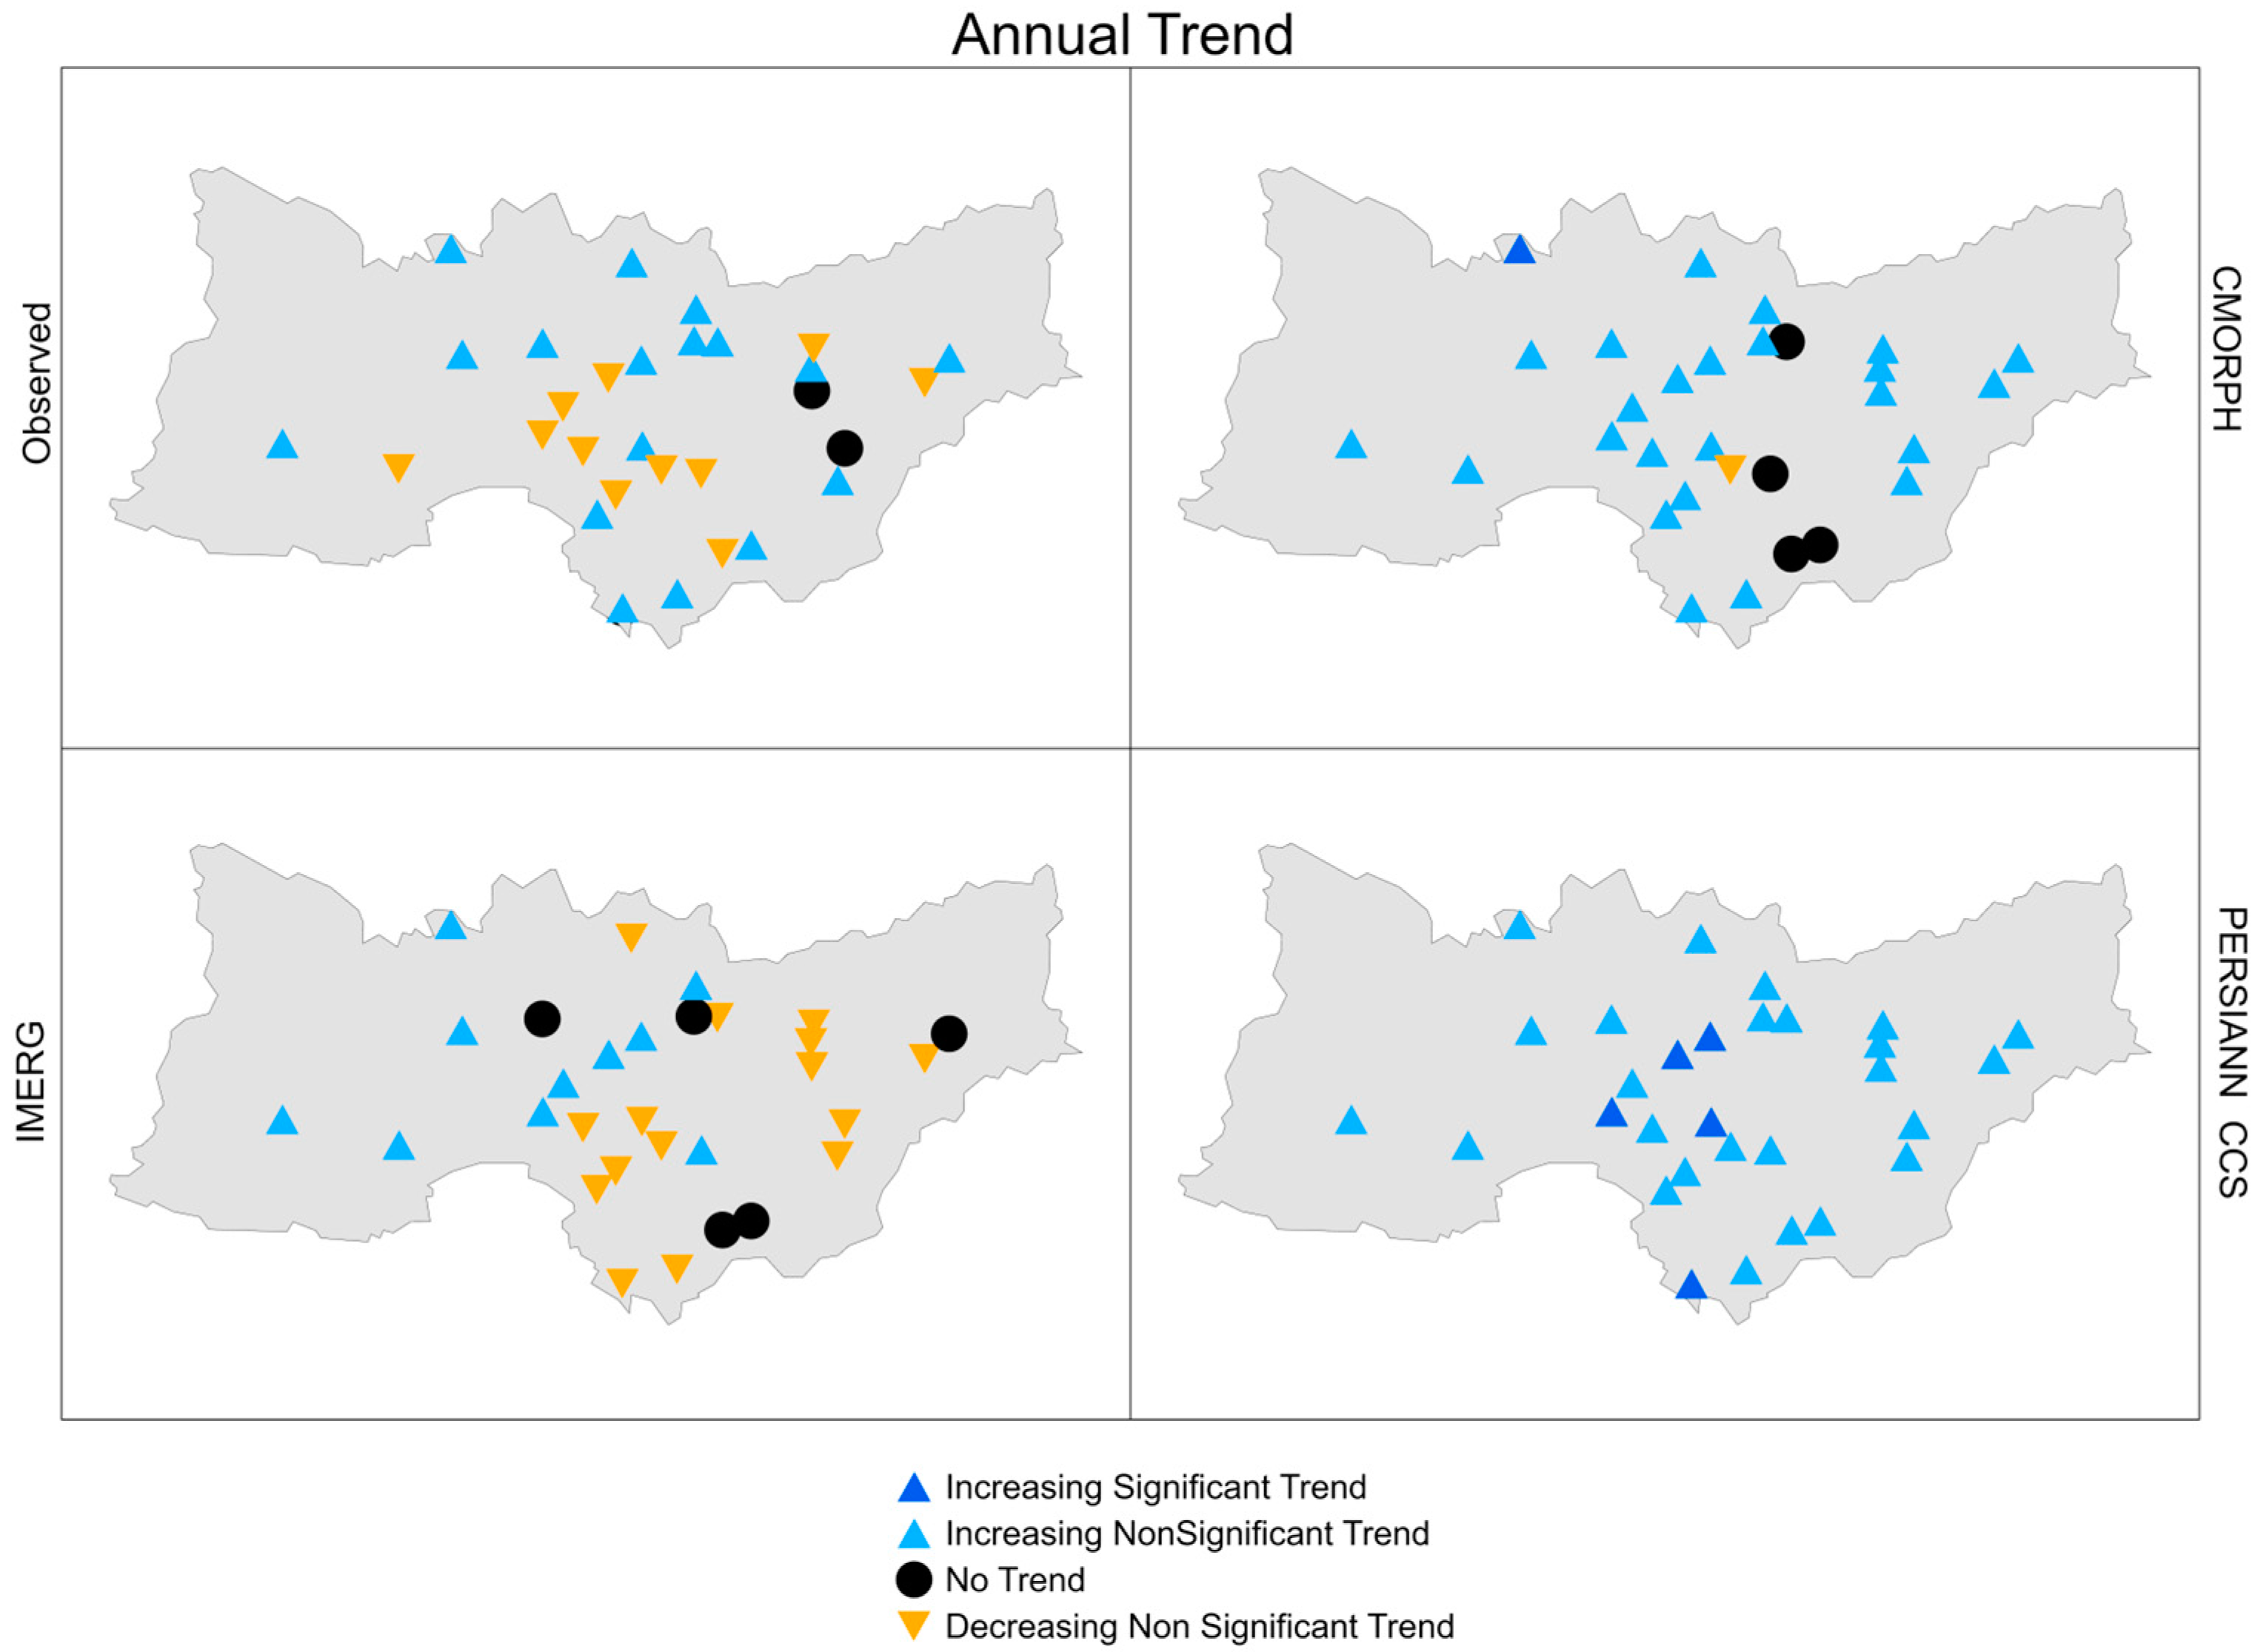
The results of the annual trend of precipitation at the basin level indicate an “increasingly non-significant annual trend” according to the observed values. At this level of analysis, the satellite products CMORPH and PERSIANN CCS show a higher value of Z than the observed values, but the trend is still non-significant. Furthermore, IMERG results with “no trend”, as shown in Table 7.
According to Figure 8, it is appreciable that the years 2005, 2008, 2010, and 2013 have the highest annual averages due to the occurrence of at least one hurricane [39]. This figure also shows that the year following a hurricane event experiences the lowest annual precipitation average. After 2013, the basin did not experience hurricanes or tropical storms. Therefore, in the later years of the period, the average annual precipitation remained within the normal range of 600 to 700 mm.
Mann–Kendall trends for all products in the annual station analysis are shown in Figure 11. The observed values indicated 17 stations with an “increasingly non-significant annual trend”, 11 stations have a “decreasingly non-significant annual trend”, and two stations with “no trend”. Figure 11 shows that most stations with positive trends are located at the north and south of the basin, at different elevations and climates. However, stations with decreasingly non-significant trends are in the center of the basin at high elevations, except for two stations located in the eastern part of the basin with low elevations.
Moreover, the results for the satellite products at the station level were hardly different from those observed in Figure 11. CMORPH and IMERG have stations with “no trend”. However, these stations are different from the observed ones, and only two stations are the same for both satellite products, both located in the south region.
The product CMORPH obtained one station with a decreasingly non-significant trend, one with an increasingly significant trend, four with “no trend”, and 24 stations with an increasingly non-significant trend. Moreover, half of the stations exhibit similar trends despite elevation, region, or average annual precipitation differences.
On the other hand, IMERG only has nine stations with results like those of the ground observations. These stations do not share similar elevations, regions, or annual precipitation averages. In the case of PERSIANN CCS, there is an increasingly non-significant trend in 25 stations and an increasingly significant trend in 5 stations. In contrast to the other products, PERSIANN CCS does not show “no trend” stations, but five stations with increasingly significant trends have decreasing non-significantly trends according to the ground observations.

4. Discussion

Among the three satellite products evaluated, CMORPH presented the best performance, while PERSIANN CCS and IMERG showed problems estimating precipitation by overestimation and underestimation, respectively.
Published studies [2,19,24,56,57] have found that IMERG and CMORPH correlations are influenced by elevation. Consistent with these findings, our results indicate that correlations above 0.7 are observed at elevations between 200 and 600 m a.s.l. However, these correlations decrease at higher elevations, which are affected by mountainous terrain, irrespective of the time series.
The analysis conducted on PERSIANN CCS revealed unexpected results. It found low correlations over the basin regardless of precipitation and elevation. This was true in both monthly and annual analyses. High correlations are expected during months with little precipitation, regardless of elevation and topography [58,59,60]. However, this was not the case in the study.
The ranking of errors, mostly between 10 and 100 mm, is consistent in this study following previous monthly analyses [2,17,56]. However, these are deemed insignificant, as the monthly precipitation average is at least 300 mm. This was contrary to the monthly precipitation average in the Rio Grande–San Juan basin, which settled at 50 mm. Due to these results, the ranking of errors is considered significant. The annual analysis obtained results over 300 mm for most stations, while other studies reported minimum errors close to zero by PERSIANN CCS [61,62] and IMERG [56,57] irrespective of elevation and average precipitation. Otherwise, most error values by CMORPH were from 50 to 300 mm in elevations above 400 m and high precipitation averages; this was calculated to obtain errors less than 150 mm in terms of general performance. To enhance this, the obtained bias was settled between ±200 mm in 80% of the stations at a general bias of 80 mm.
The performance shown by IMERG in this study differs from what has been reported in other studies, where the product usually tends to overestimate values for monthly and annual assessments [19,57]; the results obtained in this study present underestimation in both time analyses. This tends to be related to the presence of precipitation and not by elevation, which means that the higher the precipitation, the higher the bias.
Regarding PERSIANN CCS, the performance of the product over the Rio Grande–San Juan Basin reflects that proposed before by other authors, which concludes that the PERSIANN family of products does not assess the real conditions in study areas regardless of topography, elevation, and the presence of precipitation, as conducted by their IR-based precipitation estimation algorithm [45,60,62,63].
The application of the Mann–Kendall tests determined two trends over the basin: a statistically significant positive trend for the monthly average and a non-statically significant positive trend for the yearly average. This suggests that, at a monthly scale, precipitation has exhibited a consistent increase over the years. Still, as the average of yearly precipitation is more influenced by extreme events, yearly average fluctuations are more pronounced.
Some studies that examined trends over different regions in Mexico have found similar results [28,64,65]. According to most of them, variability across time series is the principal factor in the significance of the trends. Studies indicate that precipitation patterns have shifted in recent years, with separate but more intense occurrences in arid and semiarid zones of Mexico [28,31]. This, combined with extreme events during the time series, increases the variability, causing non-significant trends.
Moreover, the trends observed across different zones reveal noteworthy patterns. Specifically, the center and mountainous zones exhibit a non-statistically significant positive trend in the monthly analysis. In contrast, these zones display a non-statistically significant negative trend in the yearly analysis. They risk transitioning into statistically significant negative trends in the coming years. This dual dynamic suggests that both these zones are more vulnerable. This is possibly caused by the impacts of urbanization in the center region and fires over the mountainous regions.
On the other hand, the south and east regions exhibit similar trends. Their monthly significant positive trends converge into non-significant positive or negative trends. And two stations in the east region have a yearly trend with a “no trend” result. This means that variability in these regions is increasing over time. As both regions have less urbanization and are mostly plane regions, the increase in variability could be related to climate change.
The performance assessment of the satellite products in terms of trends using the Mann–Kendall test obtained a similar type of trend but different z and s values for the basin-level analysis, as shown in Table 6 and Table 7. Otherwise, the station-level analysis shows inconsistencies between the satellite products and the ground observations for the monthly and annual trends. The bias and correlation results were as expected. The relationship between the correlations and bias with the trends is more noticeable in the yearly trends. According to Wang F., gridded precipitation data from satellite precipitation products provide average values for a region, while station observation data provide single-point observation values [13]. This explains why the basin analysis yielded better results than the station analysis. Most studies conclude that even if products obtain high correlations and lower bias, it is necessary to implement regional correction to decrease systematical errors before using the data for specific hydrological subjects [13,66,67,68,69].

5. Conclusions

The analysis of the reliability of satellite products has shown that CMORPH has superior performance, closely resembling observed precipitation data, both in magnitude and the pattern of precipitation events. However, the bias associated with elevation is noteworthy as it presents a higher underestimation of precipitation in areas with higher elevations and an annual average precipitation over 600 mm.
IMERG’s performance suggests that the product consistently captures the general trend or pattern of the observed data but has substantial discrepancies between the values predicted by the product and the actual observations that tend to underestimate the data.
The PERSIANN CCS product is less reliable due to its lack of accuracy and precision. The results obtained from this product significantly diverge from the observed data and tend to exaggerate the magnitude of precipitation events. This suggests that there may be systematic issues in the product algorithm.
The Mann–Kendall analysis revealed distinct trends in the basin’s precipitation patterns. Monthly averages showcased a statistically significant positive trend, reflecting a gradual increase in precipitation over time. In contrast, yearly averages exhibited non-statistically significant positive trends. The spatial distribution of trends shows that 99% of stations have an increasing monthly trend, while only 57% of stations indicate an increasing trend annually.
The annual analysis shows that the central and mountainous regions are the most vulnerable, being marked by decreasing trends. This suggests a fluctuating and variable precipitation pattern in these areas. The observed behavior can be attributed to factors such as the impact of forest fires in the mountainous region and the escalating urbanization, particularly in the central area. The expansion of urbanization toward the southern region raises concerns, indicating a potential for decreasing trends in the upcoming years.
The applicability of satellite products in trend analysis showed discrepancies. Even though the general assessment has a similar trend in terms of the monthly analysis, the other analysis has considerable differences. Only CMORPH tends to have similar monthly and annual trends for most stations. However, the S and Z values are considerably different compared to the observed data.
Given these results, it may be necessary to apply bias corrections to the satellite data or explore alternative time-accumulated precipitation data, such as hourly or monthly measurements, for both rain gauge and satellite precipitation data.
Although CMORPH does not align with the observed trends, it can still be an optimal product for the study area. It can be used and evaluated for various purposes such as hydrological modeling, flood prediction, extreme events, and hydrological balance.

Author Contributions

Conceptualization, D.A.V.-R. and V.H.G.-C.; methodology, D.A.V.-R. and C.R.F.; software, D.A.V.-R., J.L.B.-F. and F.D.Y.-R.; validation, V.H.G.-C., C.R.F., J.L.B.-F. and F.D.Y.-R.; formal analysis, D.A.V.-R. and C.R.F.; investigation, D.A.V.-R. and V.H.G.-C.; data curation, D.A.V.-R.; writing—original draft preparation, D.A.V.-R. and V.H.G.-C.; writing—review and editing, C.R.F., J.L.B.-F. and F.D.Y.-R.; visualization, D.A.V.-R.; supervision, V.H.G.-C., C.R.F., J.L.B.-F. and F.D.Y.-R.; project administration, V.H.G.-C., C.R.F. and J.L.B.-F. All authors have read and agreed to the published version of the manuscript.

Funding

This research was funded by the Consejo Nacional de Humanidades, Ciencia y Tecnología (CONAHCYT), with the scholarship number 1149951.

Institutional Review Board Statement

Not applicable.

Informed Consent Statement

Not applicable.

Data Availability Statement

The original contributions presented in the study are included in the article, further inquiries can be directed to the corresponding author.

Acknowledgments

The authors are thankful to the General Coordination of the National Meteorological Service, and the National Commission of Water for providing precipitation data. The IMERG V06 1Day Final Run data were provided by the NASA/Goddard Space Flight Center’s and PPS, which develop and compute the IMERG V06 1Day Final Run as a contribution to GPM, and archived at the NASA GES DISC (https://arthurhouhttps.pps.eosdis.nasa.gov/gpmdata/2005/01/01/gis/) (accessed on 21 February 2022). The CMORPH daily 0.25 degree products were downloaded from the NCEI direct download (https://ftp.cpc.ncep.noaa.gov/precip/CMORPH_V1.0/CRT/0.25deg-DLY_00Z/2005/) (accessed on 23 June 2022). The PERSIANN CCS products were downloaded from the CHRS Data Portal (https://chrsdata.eng.uci.edu) (accessed on 15 January 2022). NOAA and NCEI cannot provide any warranty as to the accuracy, reliability, or completeness of furnished data. Users assume responsibility to determine the usability of these data. The user is responsible for the results of any application of this data for other than its intended purpose.

Conflicts of Interest

The authors declare no conflicts of interest and the funders had no role in the design of the study; in the collection, analyses, or interpretation of the data; in the writing of the manuscript; or in the decision to publish the results.

References

  1. Yu, L.; Leng, G.; Python, A.; Peng, J. A Comprehensive Evaluation of Latest GPM IMERG V06 Early, Late and Final Precipitation Products across China. Remote Sens. 2021, 13, 1208. [Google Scholar] [CrossRef]
  2. Dezfooli, D.; Abdollahi, B.; Hosseini-Moghari, S.M.; Ebrahimi, K. A Comparison between High-Resolution Satellite Precipitation Estimates and Gauge Measured Data: Case Study of Gorganrood Basin, Iran. J. Water Supply Res. Technol. 2018, 67, 236–251. [Google Scholar] [CrossRef]
  3. Kazemzadeh, M.; Hashemi, H.; Jamali, S.; Uvo, C.B.; Berndtsson, R.; Huffman, G.J. Linear and Nonlinear Trend Analyzes in Global Satellite-Based Precipitation, 1998–2017. Earths Future 2021, 9, e2020EF001835. [Google Scholar] [CrossRef]
  4. Wu, X.; Zhao, N. Evaluation and Comparison of Six High-Resolution Daily Precipitation Products in Mainland China. Remote Sens. 2022, 15, 223. [Google Scholar] [CrossRef]
  5. Degefu, M.A.; Bewket, W.; Amha, Y. Evaluating Performance of 20 Global and Quasi-Global Precipitation Products in Representing Drought Events in Ethiopia I: Visual and Correlation Analysis. Weather Clim. Extrem. 2022, 35, 100416. [Google Scholar] [CrossRef]
  6. Tadesse, K.E.; Melesse, A.M.; Abebe, A.; Lakew, H.B.; Paron, P. Evaluation of Global Precipitation Products over Wabi Shebelle River Basin, Ethiopia. Hydrology 2022, 9, 66. [Google Scholar] [CrossRef]
  7. Ray, R.L.; Sishodia, R.P.; Tefera, G.W. Evaluation of Gridded Precipitation Data for Hydrologic Modeling in North-Central Texas. Remote Sens. 2022, 14, 3860. [Google Scholar] [CrossRef]
  8. Reda, K.W.; Liu, X.; Haile, G.G.; Sun, S.; Tang, Q. Hydrological Evaluation of Satellite and Reanalysis-Based Rainfall Estimates over the Upper Tekeze Basin, Ethiopia. Hydrol. Res. 2022, 53, 584–604. [Google Scholar] [CrossRef]
  9. Kim, J.; Jung, I.; Park, K.; Yoon, S.; Lee, D. Hydrological Utility and Uncertainty of Multi-Satellite Precipitation Products in the Mountainous Region of South Korea. Remote Sens. 2016, 8, 608. [Google Scholar] [CrossRef]
  10. Joyce, R.J.; Janowiak, J.E.; Arkin, P.A.; Xie, P. CMORPH: A Method That Produces Global Precipitation Estimates from Passive Microwave and Infrared Data at High Spatial and Temporal Resolution. J. Hydrometeorol. 2004, 5, 487–503. [Google Scholar] [CrossRef]
  11. Huffman, G.J.; Adler, R.F.; Bolvin, D.T.; Nelkin, E.J. The TRMM Multi-Satellite Precipitation Analysis (TMPA). In Satellite Rainfall Applications for Surface Hydrology; Springer: Dordrecht, The Netherlands, 2010; Volume 1, pp. 3–22. [Google Scholar] [CrossRef]
  12. Helmi, A.M.; Abdelhamed, M.S. Evaluation of CMORPH, PERSIANN-CDR, CHIRPS V2.0, TMPA 3B42 V7, and GPM IMERG V6 Satellite Precipitation Datasets in Arabian Arid Regions. Water 2022, 15, 92. [Google Scholar] [CrossRef]
  13. Wang, F.; Yang, H.; Wang, Z.; Zhang, Z.; Li, Z. Drought Evaluation with CMORPH Satellite Precipitation Data in the Yellow River Basin by Using Gridded Standardized Precipitation Evapotranspiration Index. Remote Sens. 2019, 11, 485. [Google Scholar] [CrossRef]
  14. Rahman, K.U.; Shang, S.; Zohaib, M. Assessment of Merged Satellite Precipitation Datasets in Monitoring Meteorological Drought over Pakistan. Remote Sens. 2021, 13, 1662. [Google Scholar] [CrossRef]
  15. Alsumaiti, T.S.; Hussein, K.; Ghebreyesus, D.T.; Sharif, H.O. Performance of the CMORPH and GPM IMERG Products over the United Arab Emirates. Remote Sens. 2020, 12, 1426. [Google Scholar] [CrossRef]
  16. Liu, Z.; Di, Z.; Qin, P.; Zhang, S.; Ma, Q. Evaluation of Six Satellite Precipitation Products over the Chinese Mainland. Remote Sens. 2022, 14, 6277. [Google Scholar] [CrossRef]
  17. Wei, X.; Yu, Y.; Li, B.; Liu, Z. Representativeness of Two Global Gridded Precipitation Data Sets in the Intensity of Surface Short-Term Precipitation over China. Remote Sens. 2023, 15, 1856. [Google Scholar] [CrossRef]
  18. Retalis, A.; Katsanos, D.; Tymvios, F.; Michaelides, S. Comparison of GPM IMERG and TRMM 3B43 Products over Cyprus. Remote Sens. 2020, 12, 3212. [Google Scholar] [CrossRef]
  19. Ramadhan, R.; Yusnaini, H.; Marzuki, M.; Muharsyah, R.; Suryanto, W.; Sholihun, S.; Vonnisa, M.; Harmadi, H.; Ningsih, A.P.; Battaglia, A.; et al. Evaluation of GPM IMERG Performance Using Gauge Data over Indonesian Maritime Continent at Different Time Scales. Remote Sens. 2022, 14, 1172. [Google Scholar] [CrossRef]
  20. Usman, M.; Nichol, J.E.; Ibrahim, A.T.; Buba, L.F. A Spatio-Temporal Analysis of Trends in Rainfall from Long Term Satellite Rainfall Products in the Sudano Sahelian Zone of Nigeria. Agric. For. Meteorol. 2018, 260–261, 273–286. [Google Scholar] [CrossRef]
  21. Hussein, K.A.; Alsumaiti, T.S.; Ghebreyesus, D.T.; Sharif, H.O.; Abdalati, W. High-Resolution Spatiotemporal Trend Analysis of Precipitation Using Satellite-Based Products over the United Arab Emirates. Water 2021, 13, 2376. [Google Scholar] [CrossRef]
  22. Mayor, Y.G.; Tereshchenko, I.; Fonseca-Hernández, M.; Pantoja, D.A.; Montes, J.M. Evaluation of Error in IMERG Precipitation Estimates under Different Topographic Conditions and Temporal Scales over Mexico. Remote Sens. 2017, 9, 503. [Google Scholar] [CrossRef]
  23. Bruster-Flores, J.L.; Ortiz-Gómez, R.; Ferriño-Fierro, A.L.; Guerra-Cobián, V.H.; Burgos-Flores, D.; Lizárraga-Mendiola, L.G. Evaluation of Precipitation Estimates CMORPH-CRT on Regions of Mexico with Different Climates. Water 2019, 11, 1722. [Google Scholar] [CrossRef]
  24. Rincón-Avalos, P.; Khouakhi, A.; Mendoza-Cano, O.; López-De la Cruz, J.; Paredes-Bonilla, K.M. Evaluation of Satellite Precipitation Products over Mexico Using Google Earth Engine. J. Hydroinform. 2022, 24, 711–729. [Google Scholar] [CrossRef]
  25. Morales-Velázquez, M.I.; Herrera, G.D.S.; Aparicio, J.; Rafieeinasab, A.; Lobato-Sánchez, R. Evaluating Reanalysis and Satellite-Based Precipitation at Regional Scale: A Case Study in Southern Mexico. Atmósfera 2021, 34, 189–206. [Google Scholar] [CrossRef]
  26. Muñoz de la Torre, E.; González Trinidad, J.; González Ramírez, E.; Bautista Capetillo, C.F.; Júnez Ferreira, H.E.; Badillo Almaraz, H.; Rivas Recendez, M.I. Estimation of Rainfall via IMERG-FR and Its Relationship with the Records of a Rain Gauge Network with Spatio-Temporal Variation, Case of Study: Mexican Semi-Arid Region. Remote Sens. 2024, 16, 273. [Google Scholar] [CrossRef]
  27. Magallanes-Quintanar, R.; Blanco-Macías, F.; Galván-Tejada, E.C.; Galván-Tejada, J.; Márquez-Madrid, M.; Valdez-Cepeda, R.D.; Magallanes-Quintanar, R.; Blanco-Macías, F.; Galván-Tejada, E.C.; Galván-Tejada, J.; et al. Negative Regional Standardized Precipitation Index Trends Prevail in the Mexico’s State of Zacatecas. Terra Latinoam. 2019, 37, 487–499. [Google Scholar] [CrossRef]
  28. Méndez González, J.; De Jesús Návar Cháidez, J.; Ontiveros, V.G. Análisis de Tendencias de Precipitación (1920–2004) En México. Investig. Geográficas 2008, 38–55. Available online: https://www.scielo.org.mx/scielo.php?pid=S0188-46112008000100004&script=sci_abstract&tlng=pt (accessed on 20 June 2023).
  29. Ruiz-Alvarez, O.; Singh, V.P.; Enciso-Medina, J.; Ontiveros-Capurata, R.E.; dos Santos, C.A.C. Observed Trends in Daily Extreme Precipitation Indices in Aguascalientes, Mexico. Meteorol. Appl. 2020, 27, e1838. [Google Scholar] [CrossRef]
  30. Rocha-Escalante, H.; Jaimes-Arredondo, A.; Cardona-Benavides, A.; Rodríguez-Cuevas, C.; Giácoman-Vallejos, G.; Aceves-de Alba, J.; García-Arreola, M.E.; Cisneros-Almazán, R. Rainfall and Temperature Trends in the Altiplano Potosino Region, Mexico (1975–2015). Tecnología y Ciencias del Agua 2022, 13, 75–126. [Google Scholar] [CrossRef]
  31. Núñez-González, G. Analysis of the Trends in Precipitation and Precipitation Concentration in Some Climatological Stations of Mexico from 1960 to 2010. Nat. Hazards 2020, 104, 1747–1761. [Google Scholar] [CrossRef]
  32. Alvarez-Olguin, G.; Escalante-Sandoval, C. Modes of Variability of Annual and Seasonal Rainfall in Mexico. J. Am. Water Resour. Assoc. 2017, 53, 144–157. [Google Scholar] [CrossRef]
  33. Campos Aranda, F.D. Búsqueda de Tendencias En La Precipitación Anual Del Estado de Zacatecas, México; En 30 Registros Con Más de 50 Años. Ingeniería Investigación y Tecnología 2015, 16, 355–368. [Google Scholar] [CrossRef]
  34. Comisión Nacional del Agua; Coordinación General del Servicio Meteorológico Nacional. Reporte Del Clima En México: Reporte Anual 2020; Coordinacion General del Servicio Meteorologico Nacional: Ciudad de México, Mexico, 2021.
  35. Comisión Nacional del Agua; Servicio Meteorológico Nacional; Secretaría del Medio Ambiente. Reporte Del Clima En México: Reporte Anual 2021; Coordinacion General del Servicio Meteorologico Nacional: Ciudad de México, Mexico, 2022.
  36. INEGI. Censo de Población y Vivienda (2020); INEGI: Mexico City, Mexico, 2023.
  37. Esparza-Hernandez, L.G.; Valdés-Lozano, C.G.S.; Cantú-Martínez, P.C.; de la Mora, G. Historia de las crisis del agua en el área metropolitana de Monterrey (AMM), previa a la llegada de las grandes represas (1597–1955). Cienc. UANL 2014, 17, 37–51. [Google Scholar]
  38. INEGI; CLIMAS. Datos del Mapa Raster de Climas (1950–200); 2021. Available online: https://cuentame.inegi.org.mx/mapas/pdf/nacional/tematicos/climas.pdf (accessed on 20 June 2023).
  39. NOAA Office for Coastal Management Historical Hurricane Tracks. Available online: https://coast.noaa.gov/hurricanes/#map=4/32/-80 (accessed on 11 June 2023).
  40. CNA; SMN; CG; GMC; SMAA Climatología Diaria. Información Estadística Climatológica: Base de Datos Climatologica; 2020. Available online: https://smn.conagua.gob.mx/es/climatologia/informacion-climatologica/informacion-estadistica-climatologica (accessed on 25 November 2021).
  41. Comisión Nacional del Agua (CONAGUA); Servicio Meteorológico Nacional (SMN) Estaciones Climatológicas|Comisión Nacional Del Agua|Gobierno|Gob.Mx. Available online: https://www.gob.mx/conagua/acciones-y-programas/estaciones-climatologicas (accessed on 19 November 2021).
  42. Xie, P.; Joyce, R.; Wu, S.; Yoo, S.-H.; Yarosh, Y.; Sun, F.; Lin, R. Reprocessed, Bias-Corrected CMORPH Global High-Resolution Precipitation Estimates from 1998. J. Hydrometeorol. 2017, 18, 1617–1641. [Google Scholar] [CrossRef]
  43. NASA. IMERG: Integrated Multi-SatellitE Retrievals for GPM|NASA Global Precipitation Measurement Mission. Available online: https://gpm.nasa.gov/data/imerg (accessed on 27 August 2022).
  44. Huffman, G.J.; Bolvin, D.T.; Nelkin, E.J.; Tan, J. Integrated Multi-SatellitE Retrievals for GPM (IMERG) Technical Documentation; 2020. Available online: https://gpm.nasa.gov/resources/documents/imerg-gis-geotiff-documentation (accessed on 1 February 2022).
  45. Sadeghi, M.; Nguyen, P.; Naeini, M.R.; Hsu, K.; Braithwaite, D.; Sorooshian, S. PERSIANN-CCS-CDR, a 3-Hourly 0.04° Global Precipitation Climate Data Record for Heavy Precipitation Studies. Sci. Data 2021, 8, 157. [Google Scholar] [CrossRef] [PubMed]
  46. Nguyen, P.; Shearer, E.J.; Tran, H.; Ombadi, M.; Hayatbini, N.; Palacios, T.; Huynh, P.; Braithwaite, D.; Updegraff, G.; Hsu, K.; et al. The CHRS Data Portal, an Easily Accessible Public Repository for PERSIANN Global Satellite Precipitation Data. Sci. Data 2019, 6, 1–10. [Google Scholar] [CrossRef]
  47. Xie, P.; Joyce, R.; Wu, S.; Yoo, H.; NOAA. NOAA Climate Data Record (CDR) of CPC Morphing Technique (CMORPH) High Resolution Global Precipitation Estimates, V1.0 Daily Data (0.25 Degree Resolution). In Research Data Archive at the National Center for Atmospheric Research, Computational and Information Systems Laboratory; 2017. Available online: https://www.ncei.noaa.gov/access/metadata/landing-page/bin/iso?id=gov.noaa.ncdc:C00948 (accessed on 23 June 2022).
  48. Huffman, G.J.; Stocker, E.F.; Bolvin, D.T.; Nelkin, E.J.; Tan, J. NASA Final IMERG 24-Hour Precipitation Estimate on Global 0.1 × 0.1 Degree Grid Stored in the GeoTIFF Format V06. In Precipitation Processing System (PPS); 2019; pp. 2005–2018. Available online: https://arthurhou.pps.eosdis.nasa.gov/gpmdata/ (accessed on 21 February 2022).
  49. Ahmad, I.; Tang, D.; Wang, T.; Wang, M.; Wagan, B. Precipitation Trends over Time Using Mann-Kendall and Spearman’s Rho Tests in Swat River Basin, Pakistan. Adv. Meteorol. 2015, 2015, 431860. [Google Scholar] [CrossRef]
  50. Mann, H.B. Nonparametric Tests Against Trend. Econometrica 1945, 13, 245. [Google Scholar] [CrossRef]
  51. Kendall, M.G. Rank Correlation Methods. Biometrika 1957, 44, 298. [Google Scholar] [CrossRef]
  52. Lauren, C.; Macdonald, A.; Turner, K.W.; Mcdonald, I. Rainfall Trend Analysis Using Mann-Kendall and Sen’s Slope Estimator Test in West Kalimantan. IOP Conf. Ser. Earth Environ. Sci. 2021, 893, 012006. [Google Scholar] [CrossRef]
  53. Mallick, J.; Talukdar, S.; Alsubih, M.; Salam, R.; Ahmed, M.; Kahla, N.B.; Shamimuzzaman, M. Analysing the Trend of Rainfall in Asir Region of Saudi Arabia Using the Family of Mann-Kendall Tests, Innovative Trend Analysis, and Detrended Fluctuation Analysis. Theor. Appl. Clim. 2021, 143, 823–841. [Google Scholar] [CrossRef]
  54. Hu, M.; Sayama, T.; Try, S.; Takara, K.; Tanaka, K. Trend Analysis of Hydroclimatic Variables in the Kamo River Basin, Japan. Water 2019, 11, 1782. [Google Scholar] [CrossRef]
  55. Sa’adi, Z.; Shahid, S.; Ismail, T.; Chung, E.S.; Wang, X.J. Trends Analysis of Rainfall and Rainfall Extremes in Sarawak, Malaysia Using Modified Mann–Kendall Test. Meteorol. Atmos. Phys. 2019, 131, 263–277. [Google Scholar] [CrossRef]
  56. Duarte, L.V.; Formiga, K.T.M.; Costa, V.A.F. Analysis of the IMERG-GPM Precipitation Product Analysis in Brazilian Midwestern Basins Considering Different Time and Spatial Scales. Water 2022, 14, 2472. [Google Scholar] [CrossRef]
  57. Li, Y.; Pang, B.; Ren, M.; Shi, S.; Peng, D.; Zhu, Z.; Zuo, D.; Li, Y.; Pang, B.; Ren, M.; et al. Evaluation of Performance of Three Satellite-Derived Precipitation Products in Capturing Extreme Precipitation Events over Beijing, China. Remote Sens. 2022, 14, 2698. [Google Scholar] [CrossRef]
  58. Hong, Y.; Gochis, D.; Cheng, J.; Hsu, K.; Sorooshian, S. Evaluation of PERSIANN-CCS Rainfall Measurement Using the NAME Event Rain Gauge Network. J. Hydrometeorol. 2007, 8, 469–482. [Google Scholar] [CrossRef]
  59. Varouchakis, E.A.; Hristopulos, D.T.; Karatzas, G.P.; Perez, G.A.C.; Diaz, V. Spatiotemporal Geostatistical Analysis of Precipitation Combining Ground and Satellite Observations. Hydrol. Res. 2021, 52, 804–820. [Google Scholar] [CrossRef]
  60. Zhang, L.; Xin, Z.; Zhou, H. Assessment of TMPA 3B42V7 and PERSIANN-CDR in Driving Hydrological Modeling in a Semi-Humid Watershed in Northeastern China. Remote Sens. 2020, 12, 3133. [Google Scholar] [CrossRef]
  61. Anjum, M.N.; Irfan, M.; Waseem, M.; Leta, M.K.; Niazi, U.M.; Rahman, S.U.; Ghanim, A.; Mukhtar, M.A.; Nadeem, M.U. Assessment of PERSIANN-CCS, PERSIANN-CDR, SM2RAIN-ASCAT, and CHIRPS-2.0 Rainfall Products over a Semi-Arid Subtropical Climatic Region. Water 2022, 14, 147. [Google Scholar] [CrossRef]
  62. Baig, F.; Abrar, M.; Chen, H.; Sherif, M. Evaluation of Precipitation Estimates from Remote Sensing and Artificial Neural Network Based Products (PERSIANN) Family in an Arid Region. Remote Sens. 2023, 15, 1078. [Google Scholar] [CrossRef]
  63. Baig, F.; Abrar, M.; Chen, H.; Sherif, M. Rainfall Consistency, Variability, and Concentration over the UAE: Satellite Precipitation Products vs. Rain Gauge Observations. Remote Sens. 2022, 14, 5827. [Google Scholar] [CrossRef]
  64. García Ramírez, E.I.; Aguiar García, P.; Toledo Ramírez, V.M. Estudio retrospectivo para mostrar la tendencia de la precipitación pluvial en la región sureste del estado de Nayarit. Ateliê Geográfico 2014, 8, 6–21. [Google Scholar] [CrossRef]
  65. Martínez Austria, P.F.; Irula Luztow, F. Tendencias de precipitación y cambio climático en la cuenca del río Conchos, México. Aqua-LAC 2016, 8, 79–88. [Google Scholar] [CrossRef]
  66. Abdollahipour, A.; Ahmadi, H.; Aminnejad, B. Evaluating the Hydrological Utility of Satellite-Based Rainfall Products Using Neural Network Models over the Ghare Ghieh River Basin, Iran. J. Water Clim. Chang. 2021, 12, 3018–3044. [Google Scholar] [CrossRef]
  67. Görner, C.; Kronenberg, R.; Bernhofer, C. Applicability of Satellite-Based Rainfall Algorithms for Estimating Flood-Related Rainfall Events in the Mid-Latitudes. Part II: Temporal Integration. J. Flood Risk Manag. 2012, 5, 175–186. [Google Scholar] [CrossRef]
  68. Kimani, M.; Hoedjes, J.; Su, Z. An Assessment of Satellite-Derived Rainfall Products Relative to Ground Observations over East Africa. Remote Sens. 2017, 9, 430. [Google Scholar] [CrossRef]
  69. Tam, T.H.; Abd Rahman, M.Z.; Harun, S.; Hanapi, M.N.; Kaoje, I.U. Application of Satellite Rainfall Products for Flood Inundation Modelling in Kelantan River Basin, Malaysia. Hydrology 2019, 6, 95. [Google Scholar] [CrossRef]
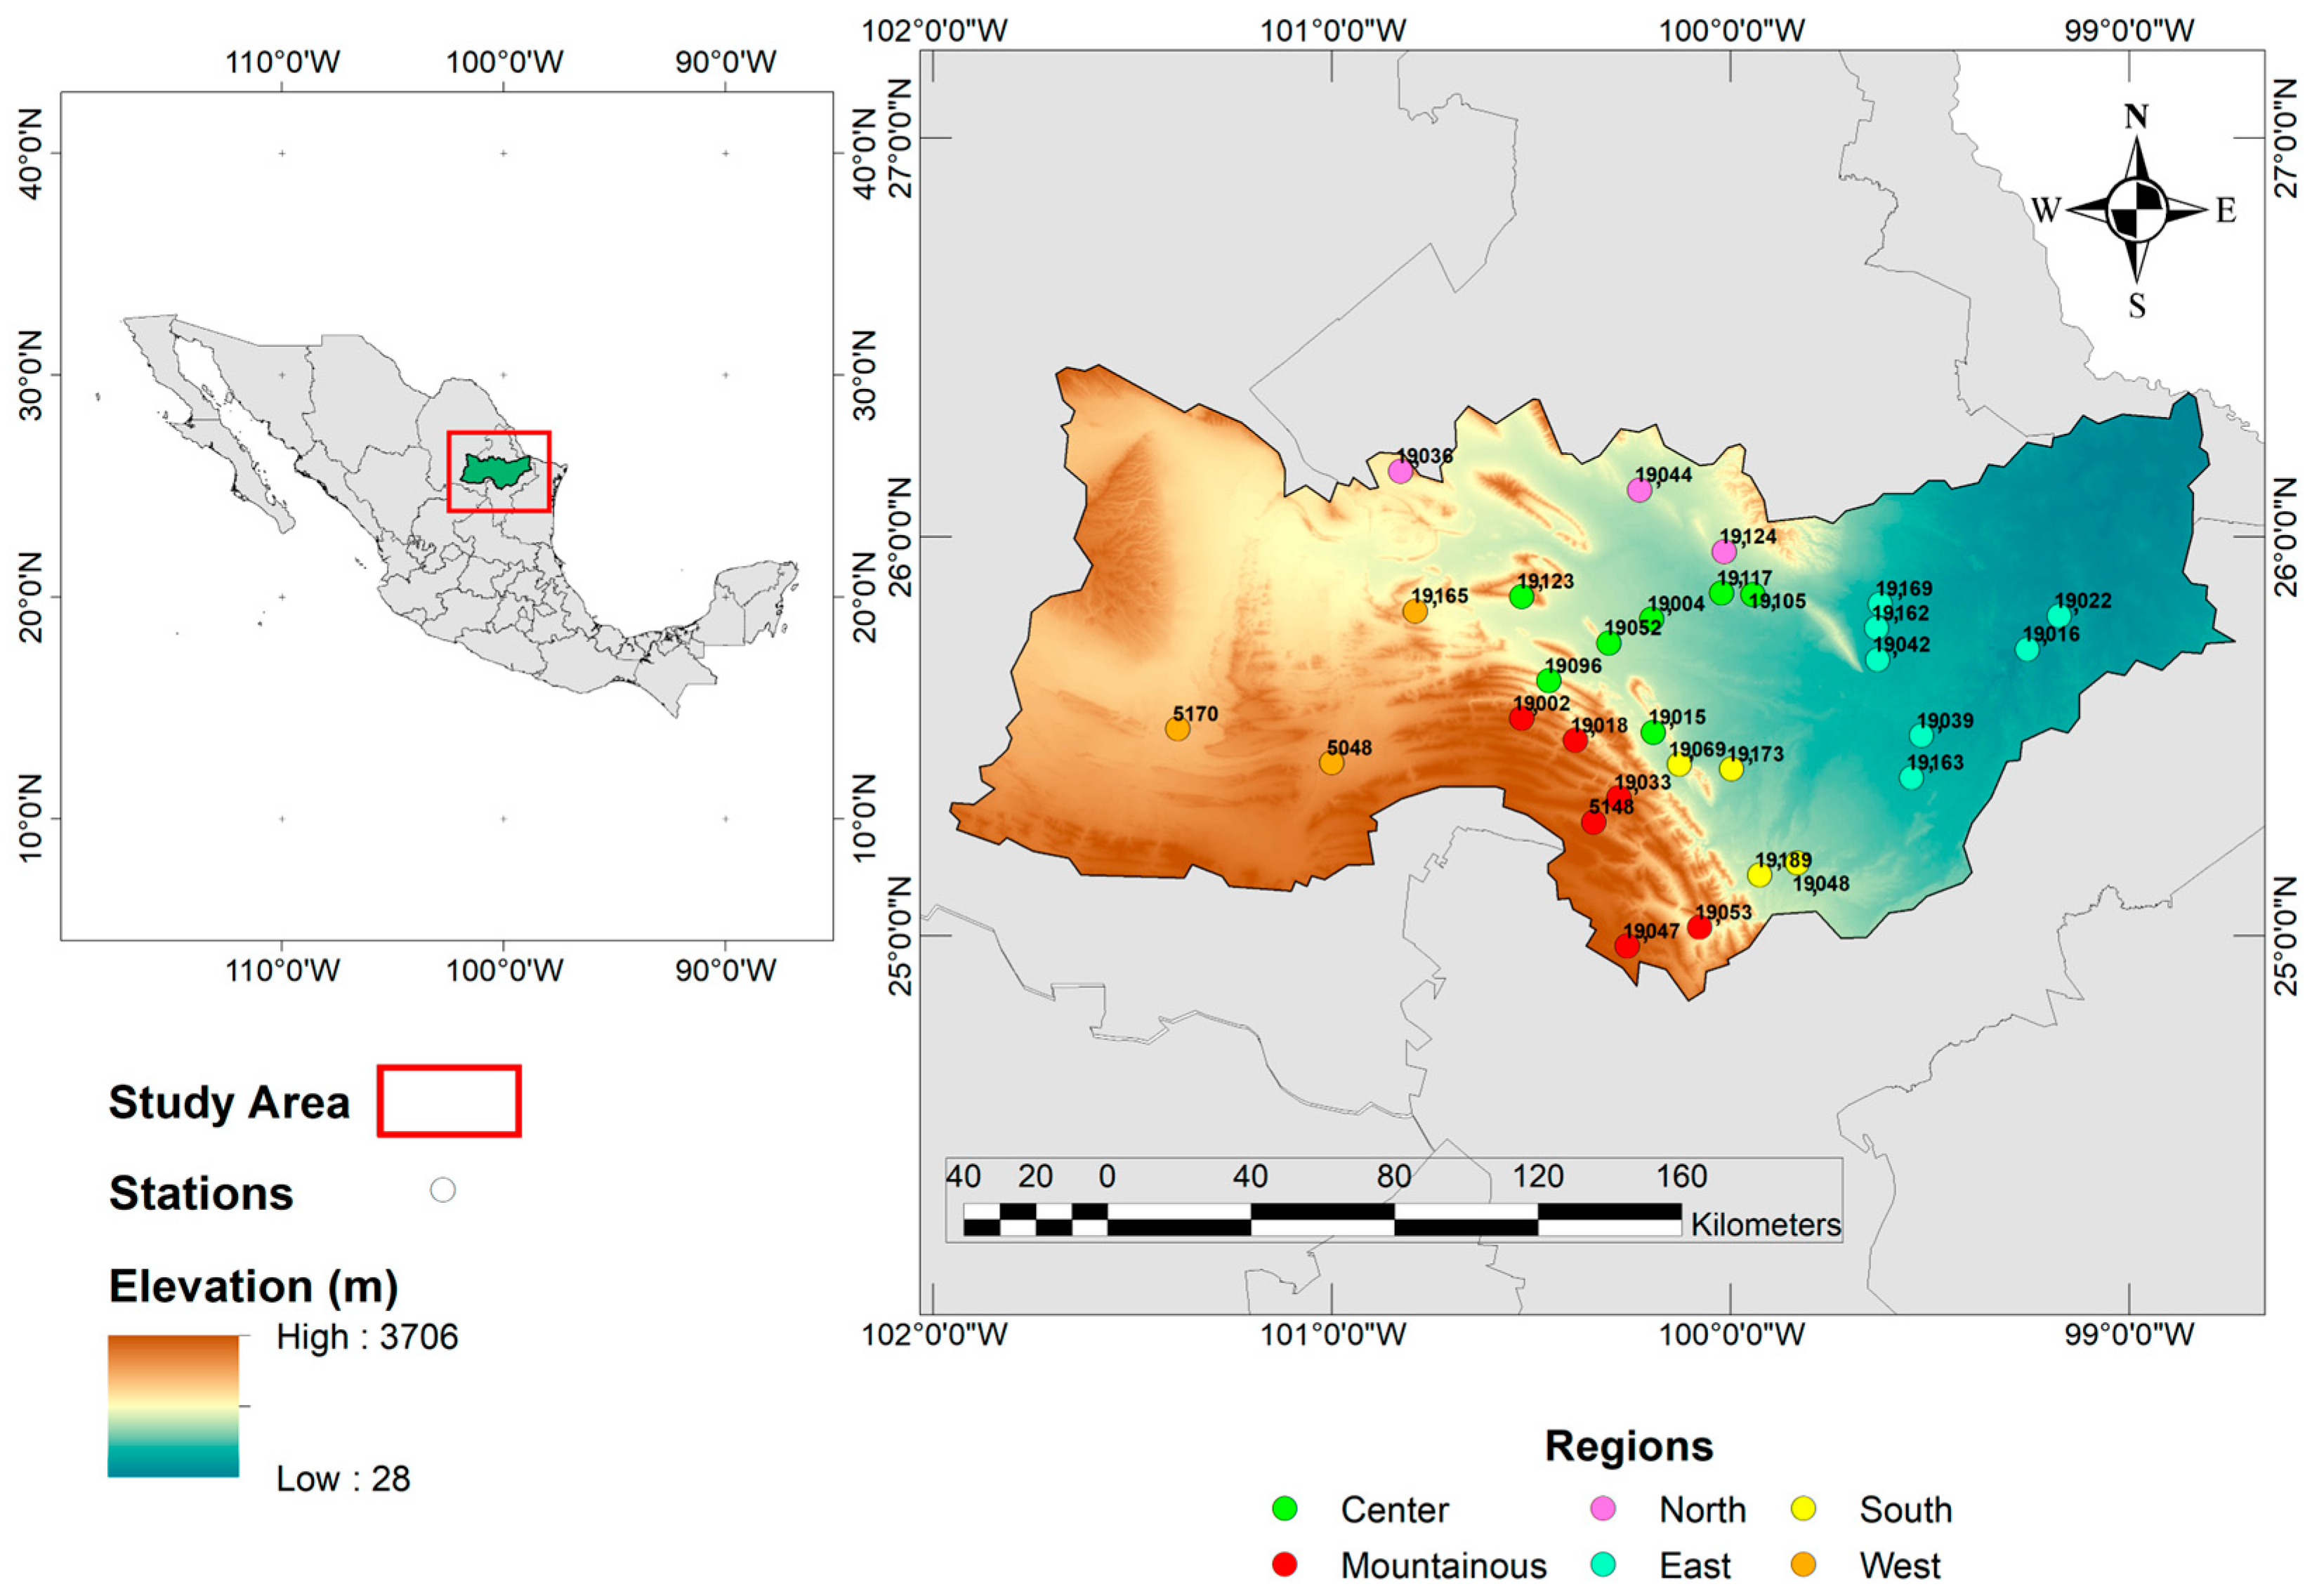
Figure 1. Location of the Rio Grande–San Juan basin in northeast Mexico, and stations (whose colors represent denote the region).
Atmosphere 15 00749 g001
Figure 2. Monthly Precipitation Averages: Observed vs. Satellite Products.
Atmosphere 15 00749 g002
Figure 3. Distribution comparison of monthly precipitation: observed vs. values estimated from satellite products.
Atmosphere 15 00749 g003
Figure 4. Monthly correlations for each satellite product. (a) Shows results for Pearson correlations, while (b) shows Spearman correlations.
Atmosphere 15 00749 g004
Figure 5. Error by for month for each satellite product: (a) mean absolute error and (b) root mean square error.
Atmosphere 15 00749 g005
Figure 6. Monthly bias showing the underestimation and overestimation by satellite products.
Atmosphere 15 00749 g006
Figure 7. Spatial distribution of evaluation statistics for monthly estimated precipitation by three precipitation products over Rio Grande–San Juan Basin.
Atmosphere 15 00749 g007
Figure 8. Annual precipitation by weather stations and estimation of precipitation with satellite products.
Atmosphere 15 00749 g008
Figure 9. Spatial distribution of evaluation statistics for annual estimated precipitation by three precipitation products over Rio Grande–San Juan Basin.
Atmosphere 15 00749 g009
Figure 10. Spatial distribution of Mann–Kendall’s monthly trends over the Rio Grande–San Juan basin for ground observations and satellite precipitation products.
Atmosphere 15 00749 g010
Figure 11. Spatial distribution of Mann–Kendall annual trends over the Rio Grande–San Juan basin for ground observations and satellite precipitation products.
Atmosphere 15 00749 g011
Table 1. Weather Stations in the Rio Grande–San Juan Basin.
RegionIDStationLat.Long.Elevation
(m)
Annual Average Precipitation
(mm)
Center19004APODACA25.7936°−100.1972°430599.24
19015EL CERRITO25.5100°−100.1933°510954.43
19052MONTERREY (OBS)25.7336°−100.3047°515669.88
19096LA HASTEQUITA25.6386°−100.4550°720424.79
19105DOCTOR GONZALEZ25.8544°−99.9433°370632.52
19117EJIDO MARIN25.8586°−100.0222°403542.91
19123GRUTAS DE GARCIA25.8503°−100.5242°1043331.45
East19016EL CUCHILLO25.7181°−99.2558°145572.26
19022GENERAL BRAVO (DGE)25.8014°−99.1756°106584.18
19039LAS ENRAMADAS 25.5014°−99.5214°230652.19
19042LOS RAMONES 25.6914°−99.6306°210575.17
19162VISTA HERMOSA 25.7708°−99.6339°199791.89
19163LAS BRISAS 25.3958°−99.54500°229639.24
19169GARZA GONZALES 25.8319°−99.6244°200628.69
Mountainous5148POTRERO DE ABREGO 25.2844°−100.3428°1740422.08
19002AGUA BLANCA25.5442°−100.5231°2193661.49
19018EL PAJONAL25.4897°−100.3889°2576548.97
19033LAGUNA DE SANCHEZ25.3461°−100.2800°1879859.09
19047MIMBRES 24.9739°−100.2586°2331635.66
19053RAYONES25.0208°−100.0772°848577.16
North19036LA POPA26.1639°−100.8278°945221.83
19044MAMULIQUE 26.1172°−100.2283°538508.60
19124HIGUERAS (DGE)25.9622°−100.0156°494504.54
South19048MONTEMORELOS25.1819°−99.8322°421847.72
19069LA BOCA 25.4294°−100.1289°4601020.50
19173PALOMITOS (GE)25.4172°−99.9972°368822.12
19189EL PASTOR 25.1517°−99.9267°4951033.48
West5048SALTILLO (DGE)25.4333°−101.000°1700288.00
5170LA ROSA 25.5183°−101.3861°1680207.06
19165CHUPADEROS DEL INDIO25.8136°−100.7900°900312.72
Data obtained from the official “Climatological Statistical Information” website [40,41].
Table 3. Parametric and non-parametric statics equation methods.
MethodEquationPerfect Value
CP i = 1 n X i X ¯ Y i Y ¯ i = 1 n X i X ¯ 2 * i = 1 n Y i Y ¯ 2 1(1)
MAE 1 n i = 1 n X i Y i 0(2)
RMSE 1 n i = 1 n X i Y i 2 0(3)
Bias i = 1 n X i Y i n 0(4)
CS r h o = 6 d i 2 n n 2 1 1(5)
Table 4. Results of evaluating statistics for monthly precipitation by satellite products.
Pearson CorrelationSpearman CorrelationMAERMSEBIAS
CMORPH0.910.8715.6726.14−2.36
IMERG0.930.9328.3246.64–27.40
PERSIANN CCS0.500.5241.1460.5415.87
Table 5. Evaluation results for annual precipitation estimation by satellite products.
CPCSMAERMSEBias
CMORPH0.880.8799.89125.62−80.92
IMERG0.910.93898.69391.44−382.38
PERSIANN CCS0.240.52232.56300.85124.63
Table 6. Mann–Kendall test results for monthly series at basin level for each observation.
ObservedCMORPHIMERGPERSIANN CCS
S18666069081228
Z2.550.821.241.68
ρ0.010.40.210.09
TrendIncreasingly
Significant
Increasingly
Non-Significant
Increasingly
Non-Significant
Increasingly
Non-Significant
Table 7. Mann–Kendall test results for annual series at basin level for each observation.
ObservedCMORPHIMERGPERSIANN CCS
S49024
Z0.205720.4889801.4032
ρ0.837010.6248510.16056
TrendIncreasingly
Non-Significant
Increasingly
Non-Significant
No TrendIncreasingly
Non-Significant
Disclaimer/Publisher’s Note: The statements, opinions and data contained in all publications are solely those of the individual author(s) and contributor(s) and not of MDPI and/or the editor(s). MDPI and/or the editor(s) disclaim responsibility for any injury to people or property resulting from any ideas, methods, instructions or products referred to in the content.