Abstract
UK air pollutant data collected over a 10-year period (2010–2019) from 46 sites with Urban Traffic, Urban Background, Suburban Background, Rural Background, and Urban Industrial environmental types were analysed to study the relationships between [NO] vs. [PM2.5] and [O3] vs. [PM2.5] during the summer for each site type. These results were used to describe the consequence of recent PM2.5 reductions on NO and O3 concentrations at different site types across the UK. The strongest positive [NO] vs. [PM2.5] correlation was observed for the Urban Traffic site type overall, but it displayed the weakest positive [O3] vs. [PM2.5] correlation. Analysis of individual Urban Traffic sites revealed an overall negative [O3] vs. [PM2.5] gradient at the London Marylebone Road (LMR) site. A sharp 35% PM2.5 decrease occurred at LMR between 2011 and 2015 before annual mean concentrations plateaued. Further examination of annual correlations revealed negative [O3] vs. [PM2.5] gradients in each year directly proceeding the sharp 35% PM2.5 decrease at LMR. NOx fluctuations were minimal and accompanied by comparable volatile organic compound (VOC) decreases; thus, VOC-limited chemistry at LMR was deemed to not be the primary cause of O3 increases. Instead, PM2.5 reductions are suggested to be a more significant factor in causing O3 increases, as suppression of O3 production by PM2.5 chemistry decreases with declining [PM2.5]. The remaining two Urban Traffic sites in Birmingham did not display a negative [O3] vs. [PM2.5] correlation in the years studied. This was partly ascribed to the Birmingham measurement sites not being under the influence of the street canyon effect like LMR. Principal attribution was to the lower-average absolute initial PM2.5 concentrations and absence of a significant (>26%) continuous mean PM2.5 decline of greater than 2 years. This study therefore proposed a threshold initial PM2.5 concentration (t) above which O3 suppression by PM2.5 chemistry is sufficient to induce O3 increases when average PM2.5 concentrations significantly decline (by >26% across >2 years), where 17 μg m−3 < t < 26 μg m−3. Extending this analysis to additional cities across the UK as sufficient data become available would allow refinement of the proposed threshold and improved understanding of the influence from the street canyon effect. These results inform future air pollution policies, in the UK and across the globe, in which further joint reductions of PM2.5 and O3 are crucial to achieve maximum benefits to human health.
1. Introduction
Fine particulate matter (PM2.5) is a source of chemicals and the source-specific contributions of PM2.5 are variable across different regions [1], seasons [2], and times [3]. Each source emits a combination of various chemical constituents that have different adverse effects on air quality, climate, and human health.
Primary PM2.5 can originate from natural sources, such as dust storms and forest fires [4,5] and anthropogenic sources, such as fossil fuel combustion, e.g., road transport including exhaust (e.g., diesel vehicles) and non-exhaust (e.g., tyre wear, brake wear, road surface abrasion from vehicles), cigarette smoke and biomass burning [6]. Secondary PM2.5 is produced through physical and chemical processes by the gas precursors emitted from anthropogenic and biogenic sources. The Urban Background concentrations of PM2.5 are dominated by secondary PM2.5, e.g., in the central and southern UK reported by DEFRA [7], in the Greater Paris region reported by Beekmann et al. [8], in Northern Italy reported by De Meij et al. [9] and Larsen et al. [10]. The formation of secondary PM2.5 is highly uncertain and varies regionally and seasonally due to meteorological changes and other variables that affect atmospheric chemistry. Thus, knowing the mass concentration of PM2.5 alone is insufficient in identifying contributing sources or in attributing a reduction in PM2.5 to a particular control measure. However, the relationships of PM2.5 with co-emitted and co-produced species can provide valuable information for understanding the sources, formation, and evolution of PM2.5 pollution.
The key precursors that allow secondary PM2.5 formation are sulfur dioxide (SO2), nitrogen oxides (NOx = NO + NO2), ammonia (NH3), and volatile organic compounds (VOCs). The secondary formation of PM2.5 due to chemical reactions in the atmosphere generally downwind and/or some distances from the original emission source [11]. Thus, the precursors, especially VOCs emitted by multiple sources, pose further problems to the identification and quantification of individual source contributions to atmospheric concentrations of PM2.5.
Like PM2.5, tropospheric ozone (O3) at surface level has been subject of significant research owing to its harmful impact on human health [12,13] and adverse effects on climate and vegetation [14,15]. Ozone’s strong oxidizing properties cause damage to airway cells and lining fluids, as well as causing immune-inflammatory responses inside and outside the lungs [12]. Both short-term and long-term exposure to ozone were found to be linked with increased mortality due to respiratory and cardiovascular diseases [12,13]. Ozone has phytotoxic effects on vegetation, causing injury to plant tissue and a significant decrease in crop and timber yield [15]. Tropospheric O3 production occurs as a result of a photochemical cycle beginning with gas-phase oxidation of VOCs, catalysed by HOx radicals, and requiring the presence of NOx. Evidence in the literature suggests that heterogenous reactions are an important loss process for NOx impacting O3 production efficiency [16]. The principal heterogenous NOx removal mechanism is via the hydrolysis of N2O5 which is much slower in the gas phase. Field observations and laboratory studies support the efficient uptake of N2O5 [17,18], with said studies measuring the reaction probability (γ) to be in the range of 0.01–1 for aqueous solutions such as H2SO4 largely independent of aerosol composition [19]. Importantly, the timescale for N2O5 removal on tropospheric aerosol is estimated to range from minutes in heavily polluted air, characterised by increased particle density and surface area, to hours in more remote regions [16].
Owing to the human health impact of PM2.5, significant reductions in direct PM2.5 and gaseous precursor emissions have been appended to many global air pollution policies, and relative concentrations have begun decreasing. Following significant PM2.5 decreases in Beijing, China, from 2013, a non-linear relationship of PM2.5 and O3 between the years of 2013 and 2017 was recently reported [20]. Their observations showed that in highly polluted regions (i.e., high PM2.5 concentrations), the aerosol chemistry involving reactive uptake of the gaseous precursors (e.g., HO2) dominated over the loss of HO2 by NO, resulting in decreased ozone formation. Significant reductions in PM2.5 since the State Council of China enacted the Clean Air Action Plan in 2013 were postulated to have induced a rise in surface-level O3, due to reduced reactive uptake of HO2. The GEOS-Chem model simulation results were also found to be in agreement with this postulation, attributing most of the observed suppression to HO2 radical-scavenging by PM2.5 [20]. To compliment the observational evidence presented in the study by Li et al. [20], a corresponding study has been performed using measurement data from UK sites.
In 2010, the UK published Air Quality Standards Regulations (AQSR) which prompted national PM2.5 reduction measures, including a specific annual average concentration aim to be met by 2020 [21]. In UK urban areas, the yearly average PM2.5 concentrations are decreasing over time due to pollution control strategies [22] and ground-level O3 concentrations were reported to have been increasing over the preceding decade [23,24,25]. However, the current levels of PM2.5 in urban sites still exceed legislation. Using UK Automatic Urban and Rural Monitoring Network (AURN) hourly measured data for a 10-year period beginning from 2010, this study analysed the impact of UK PM2.5 emission reductions on ground-level O3 concentrations, which were reported to be rising in the UK according to the most recent UK Air Quality Expert Group (AQEG) report in 2021 [23]. Therefore, this study aims to assess the impact of PM2.5 reductions on the ground-level O3 increases in the UK, using observational data from the 10-year period following the publication of the 2010 AQSR. Findings from this study will be important in guiding future air pollution policies and reduction strategies involving both O3 and PM2.5 in the UK, which will be beneficial in terms of improved quality of life, for both people and ecosystems.
2. Materials and Methods
2.1. Measurement Data
Measured data of O3, NOx, and PM2.5 concentrations were extracted for the 10-year period from January 2010 to December 2019 from the UK’s national compliance monitoring network, the AURN data archive [26]. The data selection specifically avoided measurements taken during the COVID-19 pandemic and associated lockdowns that may skew pollutant analyses. The AURN is supported by the UK’s Department for Environment, Food and Rural Affairs (DEFRA); it records measurement data for a number of air pollutants across 170 air quality monitoring sStations (AQMS) [27].
For O3 and NOx concentrations, the measurement techniques used by AURN are UV absorption and chemiluminescence, respectively [26]. For particulate matter measurements, the standard gravimetric reference method does not facilitate continuous on-line monitoring [28]. This is due to the time delay introduced from the requirement to weigh the exposed filters before the analysis of results can take place. In order to supply near-real-time, hourly information on PM2.5 concentrations, the AURN instead uses automated measuring systems accepted to be equivalent to the reference method, in accordance with the automated techniques standard. The AURN employs six equivalent techniques: ‘Tapered Element Oscillating Microbalance (TEOM)’, ‘Beta Attenuation monitor (BAM)’, ‘Gravimetric monitor (GM)’, ‘Filter Dynamics Measurement System (FDMS)’, ‘Optical light scattering (OLS)’, and ‘Fine Dust Analysis System (FIDAS)’. The instruments all have a minimum performance criterion of 25% measurement uncertainty, which also accounts for natural measurement fluctuations. In addition, PM2.5 concentration measurements require valid data capture of at least 85%. Data validation consists of a manual review of the data, ensuring use of the most recent calibration factors for data scaling [29]. Additionally, validation excludes any data obtained during instrument malfunctions or faulty calibrations, but incorporates any data missed due to monitoring station communication failures.
The daily mean NOx and PM2.5 data were calculated from measured hourly concentrations. The measured O3 data were obtained as the daily maximum 8 h running mean (MDA8), which is the maximum 8 h running mean measured on a specific day, from midnight to midnight [30]. The calculation progresses with a one-hour step, generating running mean values for intervals such as 00:00–07:59 or 01:00–08:59. Consequently, a total of 24 values for 8 h running means is possible within a day, but 75% valid data capture is required for a valid running mean. The highest (maximum) mean value is selected from the valid calculated values. MDA8 data are used for O3 because production occurs during daylight hours and are suppressed during the night-time. DEFRA’s Automatic Hydrocarbon Network employs an automated PerkinElmer gas chromatograph to monitor 29 VOCs (12 alkanes, 10 olefins, 1 alkyne, and 6 aromatic hydrocarbons) at an hourly resolution [31]. More details about the VOCs can be found in Table A1, Appendix A. VOC data were extracted specifically for the London Marylebone Road (LMR) Urban Traffic site. Data were extracted as the daily mean in units of μg/m3 and have a measurement uncertainty of 15% [31].
2.2. Monitoring Sites
Of the 170 available UK monitoring sites, only those with 6 years or more of sufficient data coverage for the summer season (>70% for June, July, and August) were used in the subsequent analysis, which constituted 46 sites. The selected sites included 5 of the 6 site types used by UK AIR: Rural Background (RB), Suburban Background (SB), Urban Background (UB), Urban Industrial (UI), and Urban Traffic (UT). The percentage representation of each site type varied in the analysis, as did the number of sites in each country (Figure 1). Of the 46 sites included in the analysis, the largest percentage (36 sites, 78%) belonged to the Urban Background site type, and the smallest percentage (2%), consisting of a singular site, belonged to the Suburban Background site type. The remaining 3 site types each comprised 3 sites, accounting for 6.5% of the dataset, respectively. The Suburban Industrial (SI) site type was not included in the analysis due to insufficient measurement data of the relevant pollutants. Of the analysed sites, there were 2 located in Scotland, Northern Ireland, and Wales each. The remainder, and majority (40 sites, 87%), were located in England. All sites outside of England are in close proximity, <25 miles, to the open coast. Additionally, 14 of the sites in England are considered to be within 25 miles of the coast. Hence, a total of 43% of analysed sites are considered to be close to the coast.
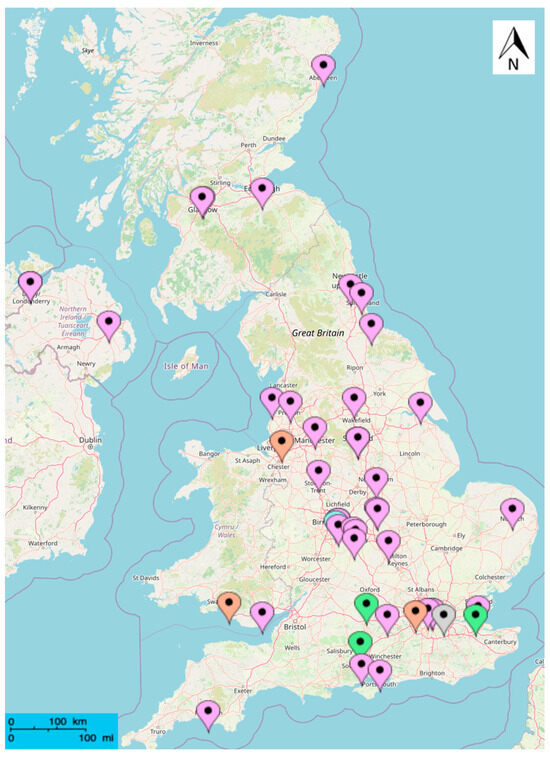
Figure 1.
Map of 46 UK sites used in the analysis. Location points are colour coded according to the monitoring station site type (Blue = Urban Traffic, Green = Rural Background, Orange = Urban Industrial, Purple = Urban Background, Grey = Suburban Background) An Urban Traffic site in London is obscured due to overlapping location points. There are 2 Urban Traffic sites overlayed in Birmingham.
The AQMS located at Marylebone Road exemplifies a typical roadside site in London, positioned 1 metre from the six-lane A501 [32,33,34,35,36]. Functioning as a reliable gauge of pollutant concentrations stemming from mobile sources within the Urban Traffic zone of London, this monitoring site is situated adjacent to Regent’s Park in the north, while prominent London city blocks surround it in other directions. The nearby vicinity forms a street canyon and encompasses educational institutions, tourist spots, retail establishments, and residential units. Due to Marylebone Road being a heavily trafficked thoroughfare, holding the highest traffic volume in London, it stands as a distinctive location for accurately representing the emission characteristics of the urban area in London [37]. Birmingham is the second most populous urban area in the UK after London [38]. The air quality monitoring station at BAR is located 6.5 metres from the kerb on a part of Birmingham’s heavily trafficked ring road [39]. BTR is located just 5 km away from BAR, next to a dual carriageway and ~700 metres to the north of the M6 motorway.
2.3. Data Analysis
The data obtained for O3, NO, and PM2.5 for all 46 AQMS were filtered to include summer months (June, July, and August) only, due to peak O3 concentrations being of most concern in summer weather conditions [40,41]. The summer month data were subsequently sorted according to site type. Individual site data were categorized and averaged across site type, enabling focused site type trend analysis. As the only ‘Suburban Background’ site, measured data from London Eltham represents this entire site type in the general analysis. ‘Urban Traffic’, ‘Rural Background’, and ‘Urban Industrial’ site type averages were generated from only 3 sites each.
MDA8 O3 and average daily mean NO were plotted against average daily mean PM2.5 to determine their respective relationships. This analysis was conducted for the entire 10-year period for each site type and specific sites of interest. This allowed direct comparison of UT sites to non-UT sites to provide background information on the relationship between O3-NO and O3-PM2.5 over the UK for the most recent 10-year period that was unaffected by COVID-19. Further site- and year-specific plots were generated, which provided additional information on yearly variations in these relationships at specific sites. Linear regression analysis on an average imputed data set was conducted for each plot, from which line-of-best-fit equations and R2 values were generated. The imputed data set used the mean concentration where measured concentration values were missing. Site-specific annual plots were tested for statistical significance at the standard 5% level of uncertainty (95% confidence level). Years where p-values were larger than 0.05 were not included in subsequent analyses.
Maximum and minimum gradients were calculated using the 95% confidence level values of regression gradient and intercept. This analysis has value as the error analysis for this type of plot, allowing the range of possible gradients and thus pollutant relationships to be depicted. The yearly change in gradient was plotted as a bar chart for the sites where the gradient changed to negative for at least 1 year in the 10-year period.
Timeseries plots of NOx and PM2.5 concentrations, along with summed VOC concentrations where data were available, were plotted for the UT site types over the 10-year period from January 2010 to December 2019. This sequential analysis approach was employed to establish general pollutant concentration trends across the period and to examine year-on-year variations in pollutant levels. Standard error (σx−) was calculated from standard deviation (σ) and displayed as error bars on the plots.
3. Results and Discussion
The relationship between NO and PM2.5 at the RB, SB, UB, UI, and UT environmental sites is shown in Figure 2. Primary NOx emissions occur almost exclusively in the form of NO, and due to NO oxidation occurring on a very fast timescale, a positive correlation between NO and PM2.5 was taken to indicate a strong primary source of PM2.5. As expected, the highly polluted UT environments dominated the axis of Figure 2a. As the most significant UK primary emission source of NO is from car exhausts [42], this site type recorded significantly higher NO concentrations compared with other site types. The largest number of PM2.5 measurements above 30 µg m−3 can also be attributed to the UT site type, including the highest PM2.5 concentrations recorded. This is indicative of significant primary PM2.5 emissions at high traffic sites, a result of both exhaust emissions and non-exhaust emissions, such as tyre and brake wear, road dust, and abrasion [43]. A strong positive correlation indicates NO-PM2.5 co-pollution at traffic sites, as well as suggests that primary-emission-focused reduction measures could be successful for reducing both PM2.5 and NO in highly polluted environments in the UK.
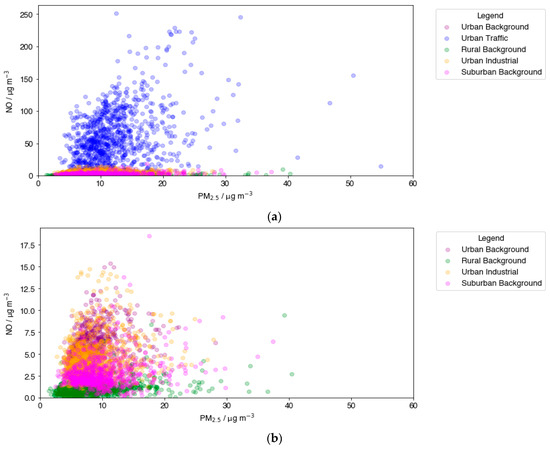
Figure 2.
The relationship between NO and PM2.5, plotted as daily means across 5 site types in the UK. Plot (a) presents data for all site types, Plot (b) excludes UT data for better intercomparison for other site types. Data are plotted for summer months (June, July, and August) for a 10-year period between 2010 and 2019. The NO vs. PM2.5 plots for individual site types are shown in Appendix B (Figure A1).
Excluding the UT site type (Figure 2b) permits a more focused analysis of the other environments. Significant overlap occurred between UB and UI data points, inferring similarly moderate primary sources of PM2.5 and NO, likely from domestic emissions and road vehicle emissions at UB sites and from industrial-related emissions at the UI site type. UI and UB sites displayed a general positive NO-PM2.5 correlation, indicating relevant primary emission reduction could reduce PM2.5 and NO concurrently, analogous to UT sites. In Figure 2b, the higher measured NO concentrations, those exceeding 10 µg m−3, mostly occur at UI and UB site types, but comparatively few high relative PM2.5 concentrations are measured, particularly those exceeding 25 µg m−3.
The RB and SB site types show high concentrations of PM2.5, despite very low NO concentrations. Sources of NO are much less abundant in rural and suburban regions, predominantly due to a sharp decline in road traffic. In 2017, the UK National Atmospheric Emissions Inventory (NAEI) reported domestic combustion to represent a major source (41.6%) of PM2.5 emissions in the UK, but a relatively minute NOx source (3.9%) [42]. In addition, once formed, PM2.5 has a characteristic high susceptibility to movement and thus can easily travel from urban environments to more rural areas before detection, unlike NO. High levels of PM2.5 where NO is low could also be indicative of secondary PM2.5. High concentrations of biogenic VOCs (BVOC) exist at rural locations and can contribute to significant secondary organic aerosol (SOA) formation. Moreover, these two site types are represented by only four sites in the analysis, of which two (50%) are within a 25-mile radius of the coast, indicating that transported sea spray and dust may comprise a significant contribution to the PM2.5 composition.
The relationship between O3 and PM2.5 at each environmental type is displayed in Figure 3. O3 was plotted as MDA8 to account for the strong diurnal variations of the pollutant. O3 is considered to be a secondary pollutant in the boundary layer, formed from photochemical oxidation reactions; thus, co-pollution of O3 and PM2.5 is a better indicator of secondary PM2.5, which can form as a result of the same OH-initiated reactions as O3.
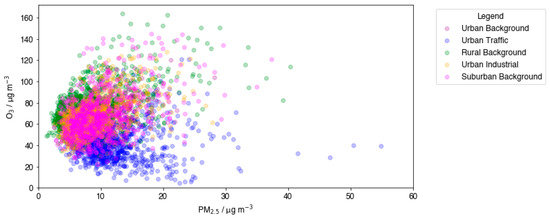
Figure 3.
Scatter plots displaying the relationship between daily MDA8 O3 and PM2.5 across 5 site types in the UK.
In Figure 3, the RB site type displays the highest recorded O3 concentrations. High O3 production is characteristic of rural areas in the summer due to the combination of many factors, such as abundant sunlight, elevated temperatures, and elevated biogenic emissions from vegetation. Aligned high PM2.5 measurements could be again attributed to SOA formation from the high biogenic VOC emissions in summer and transport from nearby urban areas, which is also likely for the SB sites. High concentrations of both O3 and PM2.5 are measured mainly in RB and SB site types. The lowest O3 measurements can be attributed to the UT site type overall, in contrast to what was observed with NO. This suggests that PM2.5 sources at UT sites are predominantly primary, as they are more correlated with NO than O3. This agrees with vehicles accounting for a very large urban primary source of both NO and PM2.5. By contrast, O3 production efficiency is known to decrease at highly polluted sites, as a result of the extremely elevated NOx concentrations, which results in O3 formation being VOC-limited [44]. The competitive termination reaction between NO and OH in the ozone-forming photochemical sequence inhibits the initiation reaction between OH and VOCs. Ozone production efficiency shows linearity to VOC emissions as a result. In the absence of a street canyon structure, higher anthropogenic VOC emissions at urban sites can be effectively balanced by increased atmospheric mixing and dispersion, preventing the ozone precursor’s accumulation. In addition, the UK began addressing VOC emissions prior to 2010, with the earliest VOC emission reduction targets being required to be met by 2003 [42]. These factors, with the added fact that urban areas exhibit lower vegetation coverage, resulting in reduced biogenic emissions of VOCs, it is expected that O3 production would curtail at UT sites. This BVOC factor is even more pronounced in the summer months used in this study, due to the plant response to heat stress and soil moisture deficits, which sees plants increase their BVOC emissions [45].
Despite lower O3 concentrations at the UT site type, measured PM2.5 concentrations still show a much higher average compared with other sites. Linear regression analysis was applied to each site type’s individual O3-PM2.5 relationship in Figure 4. Of the five site types, UT is the anomaly in terms of slope and R2 value, displaying a gradient value around four times lower than other sites and an R2 value close to zero. There are a significantly larger number of data points at very low O3 concentrations but moderate to high PM2.5 concentrations, ~20 µg m−3. All other site types show a clear positive gradient and thus infer an overall positive relationship between O3 and PM2.5. The spread from the linear regression line at the less anthropogenically polluted site types, SB and RB, is significant, likely reflecting random extreme meteorological events, which have a dependence on specific site location and affect both O3 formation and transport of primary PM2.5 from nearby urban and industrial sources. By contrast, the spread displayed at UB and UI site types is much lower, due to neither site providing optimal conditions for extreme PM2.5 or O3 levels in the summer months. The much shallower gradient is observed for the UT site type.
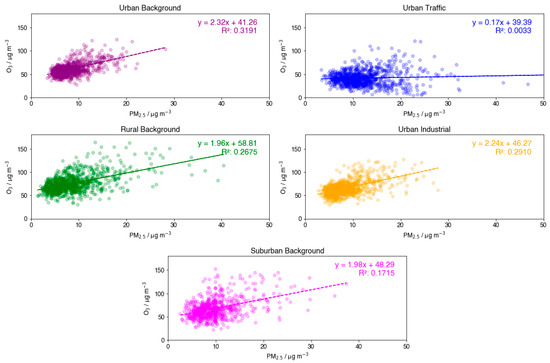
Figure 4.
Individual subplots displaying the relationship between daily MDA8 O3 and PM2.5 for each site type, including linear regression lines with their equations and R2 values.
Three UT sites were included in the analysis: Birmingham A4540 Roadside (BAR), Birmingham Tyburn Roadside (BTR), and London Marylebone Road (LMR). Comparison of O3 vs. PM2.5 scatter plots at the three UT sites (Appendix B, Figure A2) show that both Birmingham sites demonstrate a positive correlation between pollutants. Conversely, the overall correlation at LMR is negative. Given the negative correlation between PM2.5 and O3 seen at LMR, it can be inferred that reducing PM2.5 concentrations may play a part in increased O3 ground-level concentrations in summer months as has been observed in Beijing, China [20]. Further dissection of this relationship on an annual basis demonstrated a clear ‘tipping point’ at which LMR moves from a statistically significant negative correlation (2014–2015) to a statistically significant positive correlation in recent years (2019) (Figure 5).
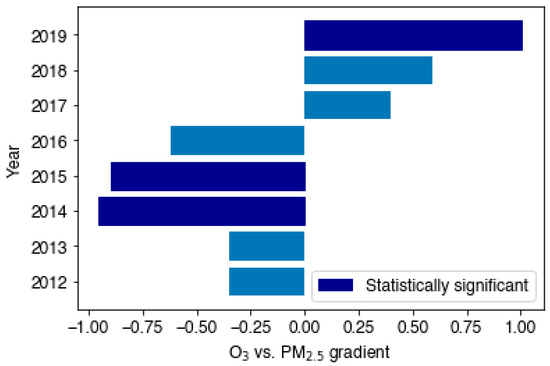
Figure 5.
A horizontal bar graph depicting the changing O3 vs. PM2.5 gradients across the 10-year period at LMR, where data coverage was sufficient (>70%). Statistically significant annual plots at the 95% confidence level are shown in navy blue.
Negative correlations, of varying extent, between MDA8 O3 and mean daily PM2.5 were observed over the summer season for the years 2012–2016 at LMR. On average, on days where PM2.5 concentrations were highest, MDA8 O3 concentrations were suppressed, and vice versa. At the confidence level of 95%, 2014, 2015, and 2019 linear regressions were statistically significant. Additionally, the negative linear regression in 2013 showed statistical significance at the 90% confidence level. The horizontal bar chart in Figure 5 depicts the annual change in the average O3-PM2.5 relationship; an inversion from 2016 to 2017 is clearly shown. The largest negative gradients occurred in the summers of 2014 and 2015; the largest positive gradient occurred most recently in 2019.
To infer the significance of PM2.5 reductions on the observed annual O3 vs. PM2.5 relationships and the 2017 inversion, a timeseries plot of mean annual PM2.5 concentrations was plotted (Figure 6), including the data from all seasons. Overall, the timeseries plot shows a decrease across the time period. PM2.5 peaked at 24.4 µg m−3 in 2011 and dropped by 40.6% to 14.5 µg m−3 in 2019. The sharpest decrease occurred from 2011 to 2015, where a 35% decline was observed, accounting for 86% of the total decrease. From 2015 to 2018, mean PM2.5 stabilised at approximately 16 µg m−3. A further absolute decrease of 1.34 µg m−3 was observed from 2018 to 2019.
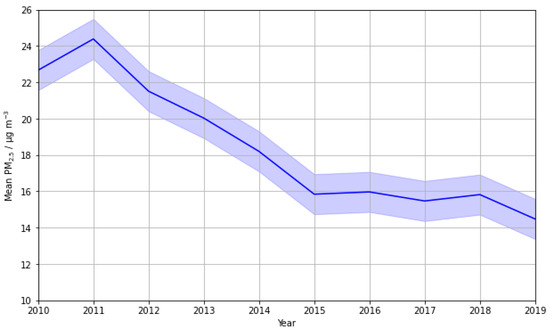
Figure 6.
A timeseries plot showing the 10-year trend in average mean daily PM2.5 from 2010 to 2019 at LMR. Uncertainty is presented as standard error and represented using a continuous, translucent error bar.
Scatter plots depicting the summer correlations between PM2.5 and O3 specifically for the years 2014, 2015, and 2019 at LMR are shown in Figure 7. The summer period is of particular interest because MDA8 O3 is enhanced in summer months because of increased temperatures and sunlight intensity, whereas secondary PM2.5 tends to be lower. To this notion, it is important to recognise that large MDA8 O3 measurements can occur as a result of such meteorological conditions, characteristic of the hotter summer days. The year 2015 directly proceeds the most significant decrease (35%) in mean PM2.5, which could explain the strong negative gradient seen in Figure 7b. The preceding year, 2014, also shows a strong negative gradient (Figure 7a), following a reduction of 25% from 2011. The 8.5% decrease observed between 2018 and 2019 is not sufficient to cause a relationship inversion (Figure 7c). This suggests that the negative relationship between PM2.5 and O3 is most significant immediately following the steepest decreases in PM2.5. The 2018 to 2019 decrease is preceded by a 4-year period of relative stability, further supporting this theory.
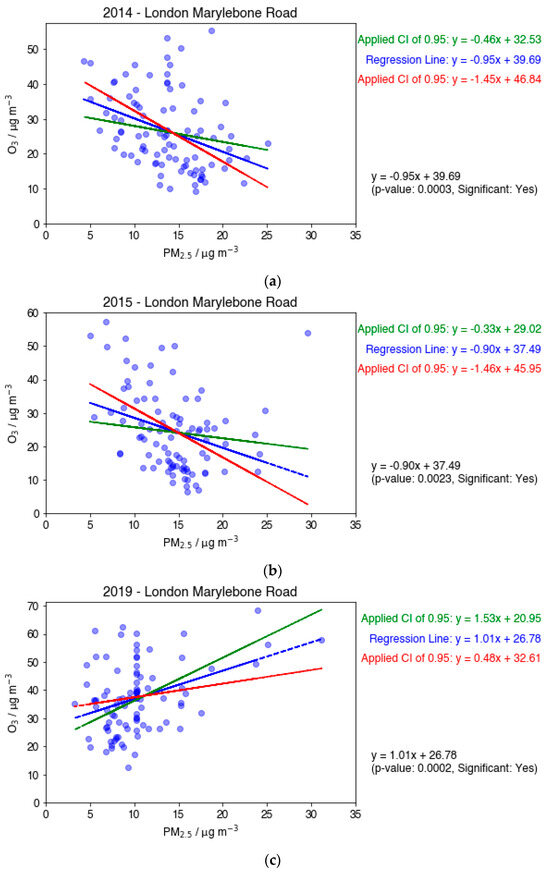
Figure 7.
Scatter plots showing MDA8 O3 against PM2.5 for the years 2014 (a), 2015 (b), and 2019 (c) at LMR. The plots include a linear regression line, as well as maximum and minimum linear regression lines at the 95% confidence level. An anomalous PM2.5 data point is circled in orange in (b).
Error analyses conducted on these plots take the form of maximum and minimum regression lines. In each case, the maximum and minimum gradients align with the original regression gradient sign, which increases confidence in the observed correlation. Plots 7a,b show similar spreads, both of which suggest that significant reductions in PM2.5 are contributing to O3 spikes.
Figure 7b shows an anomalous value at both high PM2.5 and high O3, which occurred on 12 June 2015. The highest measured O3 concentrations in the summer of 2015 were all recorded within a 2-week timeframe of 2–15 June; thus, it is likely that these measurements resulted from favourable weather conditions for O3 formation across this 2-week period, and it is unlikely that the 12 June O3 measurement was anomalous. However, the result appears to be anomalous in PM2.5. The mean and standard deviation values were calculated with both the 12 June measurement included and omitted, respectively, specifically for the days in the 2-week period of early June where O3 concentrations of 50 µg m−3 and higher were recorded. The PM2.5 value recorded on 12 June was in excess of two standard deviations from the mean when included in both calculations and larger than five standard deviations from the mean when omitted from the calculations. As a result, this point (circled in orange on Figure 7b) was considered anomalous in PM2.5 and disregarded. Removing this data point reveals an even stronger negative correlation in 2015.
At sites classified as UT, the surplus to background PM2.5 concentrations can largely be attributed to vehicular emissions [46]. Emission reduction measures that focus on vehicular PM2.5 emissions would reduce both primary PM2.5 emissions whilst also simultaneously causing reductions in vehicular NOx emissions. NOx plays an important role as a gaseous precursor to secondary inorganic and organic nitrate formation in addition to O3 formation. In a VOC-limited regime, typical of highly polluted urban centres, significant NOx reductions cause O3 to spike [22,23]. It is therefore possible that the increase in O3 could be an effect of NOx-VOC-O3 chemistry, caused by the reductions in NOx that occur simultaneously to reductions in PM2.5, rather than as a result of the PM2.5 reductions.
The 10-year trend in mean NOx at the LMR site was plotted and is shown in Figure 8a. An overall decrease across the entire 10-year period is observed. Average NO fluctuations largely mirrored those of overall NOx, whilst average measured NO2 showed a dampened, smoother overall decrease. The NOx trend shows negligible overall change between the years 2010 and 2017, before decreasing significantly in the last 2 years studied. Sectioning the NO trend in the same way reveals a small average increase between 2010 and 2017, before an analogous sharp decrease to 2019. The lack of a substantial decrease in NOx indicates that O3 increases were unlikely the result of decreasing NOx. Additionally, this suggests that the PM2.5 decreases were not predominantly a result of NOx precursor emission reductions reducing secondary organic and inorganic particulate nitrate. This is in agreement with a modelling study conducted by Vieno et al. [47] which showed primary PM2.5 reductions to be the most impactful on overall PM2.5 reductions in the UK. The initial period of average NO increase is the same period where negative relationships are seen between O3 and PM2.5 at LMR, further supporting this. The observed dip in NOx occurring from 2012 to 2013, amounting to a 10.6% decline, may have positively influenced the strength of the negative relationship between PM2.5 and O3 though. The same could be said for the 9.2% decrease between 2014 and 2015. However, NOx peaks in 2014, when the gradient of O3-PM2.5 was the most strongly negative (Figure 7a), suggesting that there is very likely an additional reason why ozone spiked when PM2.5 was reduced, not linked to NOx. This is in agreement with the results reported in China [20,48].
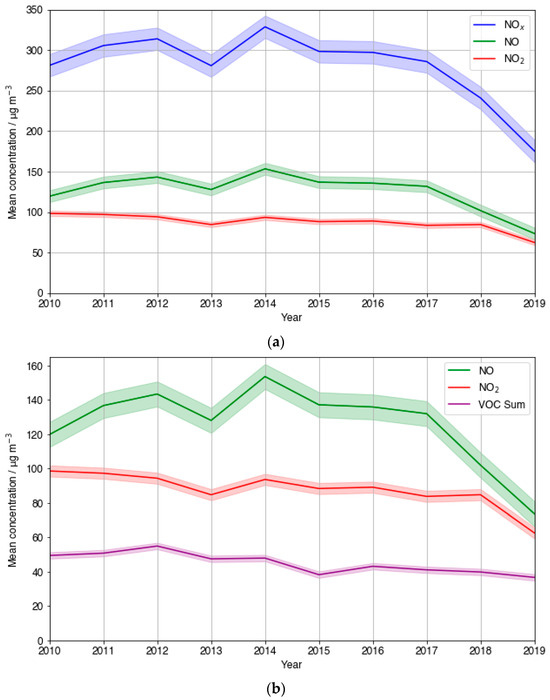
Figure 8.
A timeseries plot of the 10-year trend in (a) mean NOX, NO, and NO2 and (b) NO, NO2, and summed VOC concentrations at LMR.
LMR is one of the few sites where measurements of VOCs are taken by the Automatic Hydrocarbon Network. Figure 8b compares the yearly mean measured NO and NO2 to that of the summed concentration of measured VOCs. Simultaneous reduction in VOCs and NOx is a widely used pollution reduction strategy in VOC-limited environments where considerable NOx reductions on their own are known to cause O3 spikes [49,50]. An overall steady decrease in average summed VOC concentrations of 25% was observed across the 10-year period at LMR. The steeper observed NO and NO2 decreases between 2012–2013 and 2014–2015 were both accompanied by comparative steep gradient decreases in VOCs, 13.6% and 20.2%, respectively. This is in line with the UK Government introducing strategies to reduce road-traffic-related emissions in 2010, as these emissions comprise the UK’s largest share of both VOC emissions and NOx emissions [51,52]. This analysis, together with the assumption that LMR exists in a typically VOC-limited time period across the time period considered, which additionally considers the ozone formation potential of each VOC, both provide further evidence that the negative correlation observed between PM2.5 and O3 between 2012 and 2016 at LMR was not just a result of NOX and VOC reductions. From this, the significance of PM2.5 reductions becomes increasingly evident.
In contrast to LMR, the other UT sites (BTR and BAR) do not show a negative correlation between PM2.5 and O3 for any individual year within the time period considered. Given the similarities between the three sites, it is important to consider why this result is seen. As BTR was closed down in September 2016, the BAR measurement site just 5 km away was opened as a replacement. Data from the two Birmingham UT sites are therefore combined to provide continuous data for the overall time period. In comparison to LMR, absolute measured PM2.5 concentrations were much smaller at BTR and BAR (Figure 9). This is consistent with the results presented by Laxen et al. [53] for 2009 data, where mean PM2.5 concentrations at different site types were compared to the Urban Background mean: mean PM2.5 concentrations at kerbside sites (within 1 m of the kerb) of busy roads, such as LMR, averaged values 7–8 µg m−3 above Urban Background values, whilst concentrations measured further from the kerb alongside busy roads, such as the Birmingham sites, averaged values only 1–2 µg m−3 above the Urban Background mean. With the highest mean PM2.5 concentration measured at LMR around 1.5 times larger than that at BTR in this analysis, Birmingham’s level of pollution may not exceed the threshold whereby O3 suppression by PM2.5 becomes significant. This is a sensible inference because it is widely accepted that China has one of the most severe air pollution problems, and according to both the studies of Li et al. [20] and Shao et al. [48], many cities in urban megacity regions displayed the inverse relationship observed in London.
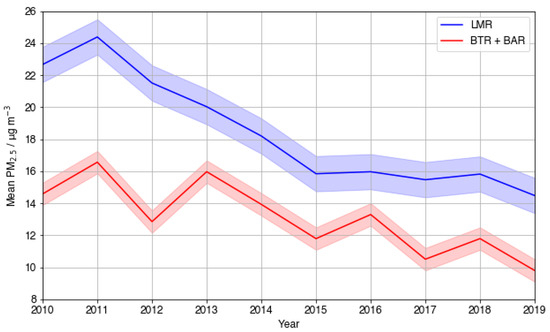
Figure 9.
A timeseries plot showing the 10-year trend in average mean daily PM2.5 (µg m−3) from 2010 to 2019 at all UT sites: LMR (blue), with BAR and BTR combined (red).
The lower PM2.5 concentrations at the Birmingham sites may result from the specific context of these measurement sites compared with LMR. LMR is known to be influenced by the ‘street canyon’ effect, where pollution dispersion is reduced, and therefore, the pollutant residence time around the measurement site is increased, so higher concentrations may be recorded [54]. Conversely, the Birmingham sites are not influenced by the street canyon effect, indicating that PM2.5 is dispersed more quickly following emission. The build-up of PM2.5 to levels sufficient to cause O3 suppression is therefore less likely at the Birmingham sites. Moreover, both Birmingham measurement site locations are further from the kerb than at LMR, facilitating PM2.5 dispersion before detection. This is further evidenced by the fact that average yearly NO2 concentrations are larger than those of NO at the Birmingham sites (Figure 10), which infers conversion of NO to NO2 before detection. An analysis of additional measurement sites in different cities across the UK, including those affected and unaffected by the street canyon effect, would allow the impact of street canyons on the PM2.5-O3 relationship to be studied further, though only the sites presented here are currently available for a long-term analysis.
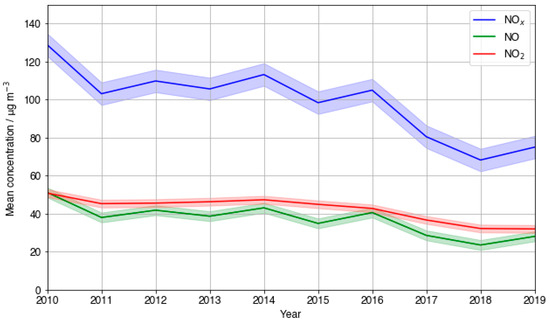
Figure 10.
The 10-year trend in mean, combined NOx, NO, and NO2 in µg m−3 at the Birmingham sites.
VOC concentration measurements are not available for either of the Birmingham UT sites; therefore, investigation into the O3 formation sensitivity regime is not possible. However, it is likely that the polluted urban centre of Birmingham resides in a VOC-limited regime, consistent with an analysis of other urban centres in the UK, like Edinburgh [55]. From this, it is possible to infer that PM2.5 must be present in greater concentrations than the maximum concentrations measured at the Birmingham sites (on average, 17 µg m−3) in order to suppress O3 formation. Similarly, the same long-term (>2 years), steep decreases in PM2.5 concentrations seen at LMR were not present at the Birmingham sites; it is possible this is also a requirement to see PM2.5-mediated O3 spikes in urban centres in the UK.
These results have implications for air pollution policy in the UK and across the globe. Quantifying the threshold PM2.5 concentration above which O3 suppression is significant for different UT environments, such as those impacted by street canyon effects, would hugely benefit the policies that target specific air pollution hotspots. Air pollution reduction strategies in VOC-limited urban centres where PM2.5 concentrations additionally exceed the PM2.5 threshold could utilise combined, gradual-decrease control strategies with all three pollutants in order to effectively mitigate O3 spikes [20]. In areas where the PM2.5 threshold is not exceeded, current strategies that aim for maximum reduction in PM2.5, without favouring one of either NOx or VOC reductions, would be most efficient and could significantly reduce PM2.5 population exposure. With recent studies showing that there exists no PM2.5 concentration below which negative health effects cease, this strategy could significantly improve the health of the nation [56].
4. Conclusions
This study analysed the relationship between PM2.5 and ground-level O3 across the UK to determine if the PM2.5 reductions, required by the 2010 AQSR, contributed to increasing surface-level O3 concentrations between the years 2010 and 2019. The largest primary contribution to the PM2.5 concentration was observed at the UT site type which had the strongest positive NO-PM2.5 relationship, confirming the impact of road vehicle traffic emissions on local pollution. Additionally, the O3-PM2.5 relationship at the UT site type showed a much weaker correlation in comparison to the other site types, confirming the importance of primary PM2.5 at this site type. A much larger secondary contribution to PM2.5 was observed at the other site types, which is more closely correlated to O3 formation due to similar favourable conditions for gaseous precursor photochemistry. Establishing the 10-year decreasing trend in PM2.5 at LMR indicated that surface-level O3 concentrations were increasing as PM2.5 concentrations were decreasing. LMR is considered to be in a VOC-limited regime; thus, it is possible that simultaneous NOX reductions were responsible for O3 spiking, rather than PM2.5 reductions. However, overall, NOX fluctuations were found to be minimal and were accompanied by VOC decreases; they were shown to have little impact during the years where a negative O3-PM2.5 relationship was observed. In contrast to LMR, neither Birmingham site displayed a negative O3-PM2.5 gradient during any of the years analysed. Consideration was given to the lower NO concentrations at the Birmingham sites being indicative of a NOX-sensitive regime, nullifying the effect of PM2.5 reductions on O3 when simultaneous NOX reductions were occurring. This analysis therefore suggests that O3 suppression by PM2.5 chemistry is sufficient to cause O3 increases in the UK when average PM2.5 concentrations start above a threshold value, t, where 17 µg m−3 < t < 26 µg m−3 and decrease (by > 26%) continuously over a period of longer than 2 years. In this 2010 to 2019 UK study, LMR was the only analysed site to demonstrate the negative impact of significant PM2.5 reductions on surface-level O3. Exemplifying the street canyon effect, and as the UK’s single busiest road in terms of vehicle traffic, LMR measured the highest PM2.5 concentrations in this study, likely to be mainly composed of primary PM2.5. Other UK city centres where high-rise buildings and traffic are abundant may additionally see this negative O3-PM2.5 relationship. The results obtained in this study therefore indicate the benefit of employing different air pollution reduction strategies in highly trafficked urban centres to those employed across the rest of the UK. In particular, the results evidence the importance of simultaneous VOC reductions for effective joint O3 and PM2.5 reduction strategies in areas of significant primary PM2.5. Outside of highly polluted city centres, where the negative O3-PM2.5 relationship appeared not to be a concern, more extreme PM2.5 reduction policies can be employed to maximally reduce population exposure to PM2.5 and thus significantly reduce its impact on human health. This approach can be extended to other cities across the globe, informing future policy. As secondary pollutants with substantial atmospheric residence times, the largest improvements to the environment and human health will be seen only when effective joint O3-PM2.5 air pollution mitigation strategies are employed in all inhabited regions.
Author Contributions
L.C. and R.H. investigated the data; L.C., R.H. and M.A.H.K. wrote the paper; R.H., D.E.S. and M.A.H.K. conceived and designed the project; D.E.S., R.H. and M.A.H.K. reviewed and edited the manuscript. All authors have read and agreed to the published version of the manuscript.
Funding
We thank Bristol ChemLabS and the Primary Science Teaching Trust, under whose auspices various aspects of this work were supported.
Institutional Review Board Statement
Not applicable.
Informed Consent Statement
Not applicable.
Data Availability Statement
Publicly available datasets were analysed in this study. These data can be found from here: https://uk-air.defra.gov.uk/data accessed on 1 May 2024.
Acknowledgments
We thank the Department for Environment, Food and Rural Affairs (Defra) for supporting UK monitoring network data.
Conflicts of Interest
The authors declare no conflicts of interest.
Appendix A

Table A1.
Volatile organic compounds (VOC) data extracted from DEFRA’s Automatic Hydrocarbon Network used in the analysis.
Table A1.
Volatile organic compounds (VOC) data extracted from DEFRA’s Automatic Hydrocarbon Network used in the analysis.
| Alkanes | Alkenes | Alkyne | Aromatic |
| Ethane | Ethene | Ethyne | benzene |
| Propane | Propene | toluene | |
| iso-butane | 1-butene | ethylbenzene | |
| n-butane | trans-2-butene | m+p-xylene | |
| iso-pentane | cis-2-butene | o-xylene | |
| n-pentane | 1,3-butadiene | 1,2,3-trimethylbenzene | |
| 2-methylpentane | trans-2-pentene | ||
| n-hexane | 1-pentene | ||
| n-heptane | isoprene | ||
| iso-octane | cis-2-pentene | ||
| n-octane | |||
| 3-methylpentane |
Appendix B
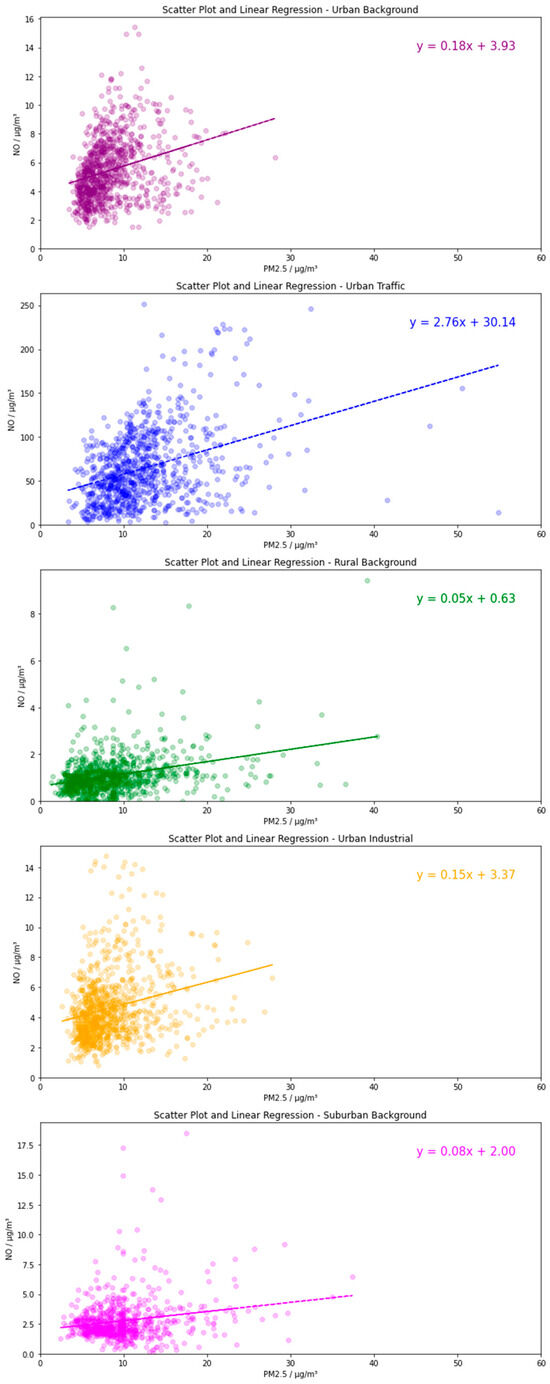
Figure A1.
The relationship between NO and PM2.5 for individual site types.
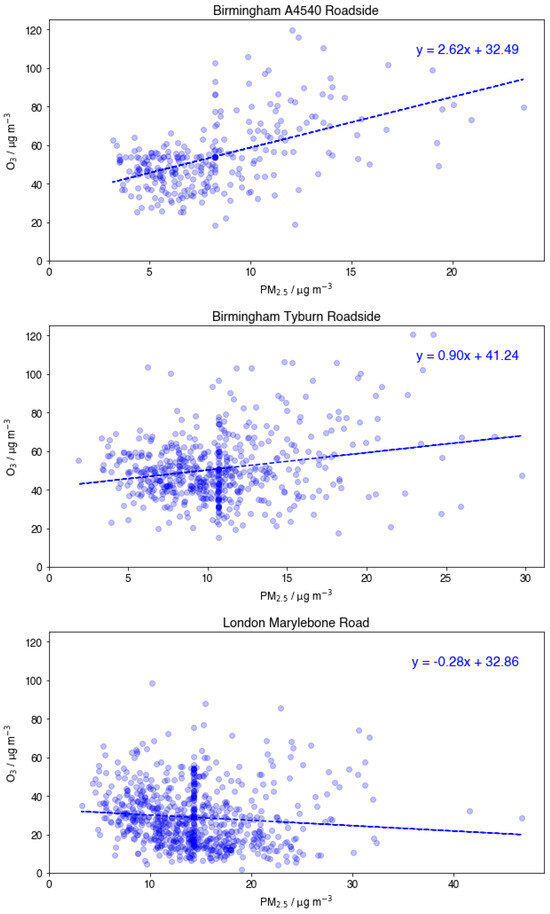
Figure A2.
Comparison of O3 vs. PM2.5 scatter plots at Birmingham A4540 Roadside, Birmingham Tyburn Roadside, London Marylebone Road.
References
- Oh, M.-S.; Park, C.K. Regional source apportionment of PM2.5 in Seoul using Bayesian multivariate receptor model. J. Appl. Stat. 2022, 49, 738–751. [Google Scholar] [CrossRef] [PubMed]
- Samek, L.; Stegowski, Z.; Furman, L.; Styszko, K.; Szramowiat, K.; Fiedor, J. Quantitative assessment of PM2.5 sources and their seasonal variation in Krakow. Water Air Soil Pollut. 2017, 228, 290. [Google Scholar] [CrossRef] [PubMed]
- Chow, W.S.; Liao, K.; Huang, X.H.H.; Leung, K.F.; Lau, A.K.H.; Yu, J.Z. Measurement report: The 10-year trend of PM2.5 major components and source tracers from 2008 to 2017 in an urban site of Hong Kong, China. Atmos. Chem. Phys. 2022, 22, 11557–11577. [Google Scholar] [CrossRef]
- Philip, S.; Martin, R.V.; Snider, G.; Weagle, C.L.; van Donkelaar, A.; Brauer, M.; Henze, D.K.; Klimont, Z.; Venkataraman, C.; Guttikunda, S.K.; et al. Anthropogenic fugitive, combustion and industrial dust is a significant, underrepresented fine particulate matter source in global atmospheric models. Environ. Res. Lett. 2017, 12, 044018. [Google Scholar] [CrossRef]
- Ditto, J.C.; Joo, T.; Khare, P.; Sheu, R.; Takeuchi, M.; Chen, Y.; Xu, W.; Bui, A.A.T.; Sun, Y.; Ng, N.L.S.; et al. Effects of Molecular-Level Compositional Variability in Organic Aerosol on Phase State and Thermodynamic Mixing Behavior. Environ. Sci. Technol. 2019, 53, 13009. [Google Scholar] [CrossRef] [PubMed]
- McDuffie, E.E.; Martin, R.V.; Spadaro, J.V.; Burnett, R.; Smith, S.J.; O’Rourke, P.; Hammer, M.S.; van Donkelaar, A.; Bindle, L.; Shah, V.; et al. Source sector and fuel contributions to ambient PM2.5 and attributable mortality across multiple spatial scales. Nat. Commun. 2021, 12, 3594. [Google Scholar] [CrossRef] [PubMed]
- Department for Environment Food and Rural Affairs. Air Quality Expert Group, Fina Particulate Matter (PM2.5) in the United Kingdom. Available online: https://uk-air.defra.gov.uk/research/aqeg/ (accessed on 14 May 2024).
- Beekmann, M.; Prévôt, A.S.H.; Drewnick, F.; Sciare, J.; Pandis, S.N.; Denier van der Gon, H.A.C.; Crippa, M.; Freutel, F.; Poulain, L.; Ghersi, V.; et al. In situ, satellite measurement and model evidence on the dominant regional contribution to fine particulate matter levels in the Paris megacity. Atmos. Chem. Phys. 2015, 15, 9577–9591. [Google Scholar] [CrossRef]
- De Meij, A.; Thunis, P.; Bessagnet, B.; Cuvelier, C. The sensitivity of the CHIMERE model to emissions reduction scenarios on air quality in Northern Italy. Atmos. Environ. 2009, 43, 1897–1907. [Google Scholar] [CrossRef]
- Larsen, B.; Gilardoni, S.; Stenström, K.; Niedzialek, J.; Jimenez, J.; Belis, C. Sources for PM air pollution in the Po Plain, Italy: II. Probabilistic uncertainty characterization and sensitivity analysis of secondary and primary sources. Atmos. Environ. 2012, 50, 203–213. [Google Scholar] [CrossRef]
- Hodan, W.M.; Barnard, W.R. Evaluating the Contribution of PM2.5 Precursor Gases and Re-Entrained Road Emissions to Mobile Source PM2.5 Particulate Matter Emissions; MACTEC Federal Programs: Research Triangle Park, NC, USA, 2004. [Google Scholar]
- Zhang, J.; Wei, Y.; Fang, Z. Ozone pollution: A major health hazard worldwide. Front. Immunol. 2019, 10, 2518. [Google Scholar] [CrossRef]
- Nuvolone, D.; Petri, D.; Voller, F. The effects of ozone on human health. Environ. Sci. Poll. Res. 2018, 25, 8074–8088. [Google Scholar] [CrossRef] [PubMed]
- IPCC. Climate Change 2013: The Physical Science Basis. Contribution of Working Group I to the Fifth Assessment Report of the Intergovernmental Panel on Climate Change; Stocker, T.F., Qin, D., Plainer, G.-K., Tignor, M., Allen, S.K., Boschung, J., Nauels, A., Xia, Y., Bex, V., Midgley, P.M., Eds.; Cambridge University Press: Cambridge, UK; New York, NY, USA, 2013. [Google Scholar]
- Juráň, S.; Grace, J.; Urban, O. Temporal changes in ozone concentrations and their impact on vegetation. Atmosphere 2021, 12, 82. [Google Scholar] [CrossRef]
- Jenkin, M.E.; Clemitshaw, K.C. Ozone and other secondary photochemical pollutants: Chemical processes governing their formation in the planetary boundary layer. Atmos. Environ. 2000, 34, 2499–2527. [Google Scholar] [CrossRef]
- Colvile, R.N.; Choularton, T.W.; Gallagher, M.W.; Wicks, A.J.; Downer, R.M.; Tyler, B.J.; Storeton-West, K.J.; Fowler, D.; Cape, J.N.; Dollard, G.J.; et al. Observation on great dun fell of the pathways by which oxides of nitrogen are converted to nitrate. Atmos. Environ. 1994, 28, 397–408. [Google Scholar] [CrossRef]
- Van Doren, J.M.; Watson, L.R.; Davidovits, P.; Worsnop, D.R.; Zahniser, M.S.; Kolb, C.E. Temperature dependence of the uptake coefficients of HNO3, HCl and N2O5 by water droplets. J. Phys. Chem. 1990, 94, 3265–3269. [Google Scholar] [CrossRef]
- DeMore, W.B.; Sander, S.P.; Golden, D.M.; Hampson, R.F.; Kurylo, M.J.; Howard, C.J.; Ravishankara, A.R.; Kolb, C.E.; Molina, M.J. Chemical Kinetics and Photochemical Data for Use in Stratospheric Modeling, Evaluation Number 12; JPL Publication 97-4; Jet Propulsion Laboratory, National Aeronautics and Space Administration: Pasadena, CA, USA, 1997; 266p. [Google Scholar]
- Li, K.; Jacob, D.J.; Liao, H.; Shen, L.; Zhang, Q.; Bates, K.H. Anthropogenic drivers of 2013–2017 trends in summer surface ozone in China. Proc. Nat. Acad. Sci. USA 2019, 116, 422–427. [Google Scholar] [CrossRef] [PubMed]
- Department for Environment Food and Rural Affairs Air Quality Strategy: Framework for Local Authority Delivery. 2023. Available online: https://assets.publishing.service.gov.uk/media/64e8963d635870000d1dbf9d/Air_Quality_Strategy_Web.pdf (accessed on 15 May 2024).
- Department for Environment Food and Rural Affairs National Statistics. Particulate Matter (PM10/PM2.5). Available online: https://www.gov.uk/government/statistics/air-quality-statistics/concentrations-of-particulate-matter-pm10-and-pm25 (accessed on 15 May 2024).
- Air Quality Expert Group. Ozone in the UK—Recent Trends and Future Projections. 2021. Available online: https://uk-air.defra.gov.uk/assets/documents/reports/cat09/2112200932_Ozone_in_the_UK_Recent_Trends_and_Future_Projections.pdf (accessed on 15 May 2024).
- Holland, R.; Khan, M.A.H.; Derwent, R.G.; Lynch, J.; Ahmed, F.; Grace, S.; Bacak, A.; Shallcross, D.E. Gas-phase kinetics, POCPs and an investigation of the contributions of VOCs to urban ozone production in the UK. Int. J. Chem. Kinet. 2023, 55, 350–364. [Google Scholar] [CrossRef]
- Diaz, F.M.R.; Khan, M.A.H.; Shallcross, B.M.A.; Shallcross, E.D.G.; Vogt, U.; Shallcross, D.E. Ozone trends in the United Kingdom over the last 30 years. Atmosphere 2020, 11, 534. [Google Scholar] [CrossRef]
- Department for Environment Food & Rural Affairs National Air Quality Data Archive. UK Air Information Resource. Available online: https://uk-air.defra.gov.uk/data/data_selector_service#mid (accessed on 15 May 2024).
- Department for Environment Food & Rural Affairs Automatic Urban and Rural Network (AURN). Available online: https://uk-air.defra.gov.uk/networks/network-info?view=aurn (accessed on 15 May 2024).
- Department for Environment Food & Rural Affairs. “Particulate Matter (PM2.5 Targets) in the Environment Act: Monitoring Assessment Methods. Available online: https://uk-air.defra.gov.uk/networks/monitoring-methods?view=PM-Environment-Act-MonitoringMethods (accessed on 15 May 2024).
- Department for Environment Food & Rural Affairs. The Air Quality Data Validation and Ratification Process. 2017. Available online: https://uk-air.defra.gov.uk/assets/documents/Data_Validation_and_Ratification_Process_Apr_2017.pdf (accessed on 15 May 2024).
- Department for Environment Food & Rural Affairs. UK AIR Glossary. Available online: https://uk-air.defra.gov.uk/air-pollution/glossary (accessed on 15 May 2024).
- Department for Environment Food & Rural Affairs. Automatic Hydrocarbon Network. Available online: https://uk-air.defra.gov.uk/networks/network-info?view=hc (accessed on 15 May 2024).
- Department for Environment Food & Rural Affairs. Site Information for London Marylebone Road(UKA00315). Available online: https://uk-air.defra.gov.uk/networks/site-info?uka_id=UKA00315&search=View+Site+Information&action=site&provider=archive (accessed on 15 May 2024).
- Wood, C.R.; ApSimon, H.; Arnold, S.; Balogun, A.A.; Barlow, J.F.; Belcher, S.E.; Britter, R.E.; Cheng, H.; Colvile, R.N.; Dobre, A.; et al. Dispersion experiments in central London: The 2007 DAPPLE project. Bull. Am. Meteorol. Soc. 2009, 90, 955–969. [Google Scholar] [CrossRef]
- Martin, D.; Price, C.S.; Nickless, G.; Britter, R.E.; Londou, A.-N.; Neophytou, M.K.; Cheng, H.; Robins, A.G.; Dobre, A.; Belcher, S.E.; et al. Urban tracer dispersion experiments in London (DAPPLE) 2003: Field studies and comparisons with empirical prediction. Atmos. Sci. Lett. 2010, 11, 241–248. [Google Scholar] [CrossRef]
- Balogun, A.; Tomlin, A.; Wood, C.; Barlow, J.; Belcher, S.; Smalley, R.; Lingard, J.; Arnold, S.; Dobre, A.; Robins, A.; et al. In-street wind direction variability in the vicinity of a busy intersection in Central London I. Bound. Layer Meteorol. 2010, 136, 489–513. [Google Scholar] [CrossRef][Green Version]
- Martin, D.; Price, C.S.; Nickless, G.; Britter, R.E.; Londou, A.-N.; Neophytou, M.K.; Cheng, H.; Robins, A.G.; Dobre, A.; Belcher, S.E.; et al. Urban tracer dispersion experiments during the second DAPPLE field campaign in London 2004. Atmos. Environ. 2010, 44, 3043–3052. [Google Scholar] [CrossRef]
- Zhang, C.; Stevenson, D. Characteristic changes of ozone and its precursors in London during COVID-19 lockdown and the ozone surge season analysis. Atmos. Environ. 2022, 273, 118980. [Google Scholar] [CrossRef] [PubMed]
- Kalisa, E.; Fadlallah, S.; Amani, M.; Nahayo, L.; Habiyaremye, G. Temperature and air pollution relationship during heatwaves in Birmingham, UK. Sustain. Cities Soc. 2018, 43, 111–120. [Google Scholar] [CrossRef]
- Department for Environment Food & Rural Affairs. Site Information for Birmingham A4540 Roadside(UKA00626). Available online: https://uk-air.defra.gov.uk/networks/site-info?uka_id=UKA00626&search=View+Site+Information&action=site&provider=archive (accessed on 15 May 2024).
- Garrido-Perez, J.M.; Ordóñez, C.; García-Herrera, R.; Schnell, J.L. The differing impact of air stagnation on summer ozone across Europe. Atmos. Environ. 2019, 219, 117062. [Google Scholar] [CrossRef]
- Wang, T.; Xue, L.; Brimblecombe, P.; Lam, Y.F.; Li, L.; Zhang, L. Ozone pollution in China: A review of concentrations, meteorological influences, chemical precursors, and effects. Sci. Total Environ. 2017, 575, 1582–1596. [Google Scholar] [CrossRef] [PubMed]
- Wakeling, D.; Passant, N.R.; Murrells, T.P.; Pang, Y.; Thistlethwaite, G.; Walker, C.; Brown, P.; del Vento, S.; Hunter, R.; Wiltshire, J.; et al. UK Informative Inventory Report (1990 to 2015); DEFRA: London, UK, 2017; pp. 67–76. [Google Scholar]
- Air Quality Expert Group. Fine Particulate Matter (PM2.5) in the United Kingdom. 2012. Available online: https://uk-air.defra.gov.uk/assets/documents/reports/cat11/1212141150_AQEG_Fine_Particulate_Matter_in_the_UK.pdf (accessed on 15 May 2024).
- Holland, R.; Seifert, K.; Saboya, E.; Khan, M.A.H.; Derwent, R.G.; Shallcross, D.E. Elucidating the effects of COVID-19 lockdowns in the UK on the O3-NOx-VOC relationship. Atmosphere 2024, 15, 607. [Google Scholar] [CrossRef]
- Strong, J.; Whyatt, J.D.; Metcalfe, S.E.; Derwent, R.G.; Hewitt, C.N. Investigating the impacts of anthropogenic and biogenic VOC emissions and elevated temperatures during the 2003 ozone episode in the UK. Atmos. Environ. 2013, 74, 393–401. [Google Scholar] [CrossRef]
- Harrison, R.M. Airborne particulate matter. Philos. Trans. R. Soc. A 2020, 378, 20190319. [Google Scholar] [CrossRef]
- Vieno, M.; Heal, M.R.; Williams, M.; Carnell, E.; Nemitz, E.; Stedman, J.; Reis, S. The sensitivities of emissions reductions for the mitigation of UK PM2.5. Atmos. Chem. Phys. 2016, 16, 265–276. [Google Scholar] [CrossRef]
- Shao, M.; Wang, W.; Yuan, B.; Parrish, D.D.; Li, X.; Lu, K.; Wu, L.; Wang, X.; Mo, Z.; Yang, S. Quantifying the role of PM2.5 dropping in variations of ground-level ozone: Inter-comparison between Beijing and Los Angeles. Sci. Total Environ. 2021, 788, 147712. [Google Scholar] [CrossRef] [PubMed]
- Wang, N.; Lyu, X.; Deng, X.; Huang, X.; Jiang, F.; Ding, A. Aggravating O3 pollution due to NOx emission control in eastern China. Sci. Total Environ. 2019, 677, 732–744. [Google Scholar] [CrossRef] [PubMed]
- Sicard, P.; Paoletti, E.; Agathokleous, E.; Araminienė, V.; Proietti, C.; Coulibaly, F.; De Marco, A. Ozone weekend effect in cities: Deep insights for urban air pollution control. Environ. Res. 2020, 191, 110193. [Google Scholar] [CrossRef] [PubMed]
- Amann, M.; Derwent, D.; Forsberg, B.; Hänninen, O.; Hurley, F.; Krzyzanowski, M.; de Leeuw, F.; Liu, S.J.; Mandin, C.; Schneider, J.; et al. Health Risks of Ozone from Long-Range Transboundary Air Pollution; World Health Organization (WHO) Regional Office for Europe: Copenhagen, Denmark, 2008. [Google Scholar]
- Lewis, A.C.; Hopkins, J.R.; Carslaw, D.C.; Hamilton, J.F.; Nelson, B.S.; Stewart, G.; Dernie, J.; Passant, N.; Murrells, T. An increasing role for solvent emissions and implications for future measurements of volatile organic compounds. Philos. Trans. R. Soc. A 2020, 378, 20190328. [Google Scholar] [CrossRef] [PubMed]
- Laxen, D.; Moorcroft, S.; Marner, B.; Laxen, K.; Boulter, P.; Barlow, T.; Harrison, R.; Heal, M. PM2.5 in the UK, Report for Scotland & Northern Ireland Forum for Environmnetal Research (SNIFFER), Edinburgh. December 2010. Available online: https://www.aqconsultants.co.uk/CMSPages/GetFile.aspx?guid=eb3cd7b4-b297-46c5-a382-58113c04a105 (accessed on 16 June 2024).
- Taseiko, O.V.; Mikhailuta, S.V.; Pitt, A.; Lezhenin, A.A.; Zakharov, Y.V. Air pollution dispersion within urban street canyons. Atmos. Environ. 2009, 43, 245–252. [Google Scholar] [CrossRef]
- Tudor, C. Ozone pollution in London and Edinburgh; spatiotemporal characteristics, trends, transport and the impact of COVID-19 control measures. Heliyon 2022, 8, e11384. [Google Scholar] [CrossRef]
- Papadogeorgou, G.; Kioumourtzoglou, M.-A.; Braun, D.; Zanobetti, A. Low levels of air pollution and health: Effect estimates, methodological challenges and future directions. Curr. Environ. Health Rep. 2019, 6, 105–115. [Google Scholar] [CrossRef]
Disclaimer/Publisher’s Note: The statements, opinions and data contained in all publications are solely those of the individual author(s) and contributor(s) and not of MDPI and/or the editor(s). MDPI and/or the editor(s) disclaim responsibility for any injury to people or property resulting from any ideas, methods, instructions or products referred to in the content. |
© 2024 by the authors. Licensee MDPI, Basel, Switzerland. This article is an open access article distributed under the terms and conditions of the Creative Commons Attribution (CC BY) license (https://creativecommons.org/licenses/by/4.0/).