Abstract
Indonesia, a country located in the equatorial region with hilly and valley lands surrounded by vast oceans, has complex rainfall patterns that can generally be classified into three types: equatorial, monsoon, and local. Rainfall estimates have only been derived based on local data and characteristics so far, and have not yet been developed based on universal data for all of Indonesia. This study aimed to develop a rainfall estimation model based on weather radar data throughout Indonesia using ensemble machine learning with the gradient boosting algorithm. The proposed rainfall estimation model is universal, can be applied to different rainfall pattern areas, and has a temporal resolution of 10 min. It is based on determining the root mean square error (RMSE) and R-squared (R2) values. Research was conducted in six areas with different rainfall patterns: Bandar Lampung and Banjarmasin with monsoon rain patterns, Pontianak and Deli Serdang with equatorial rain patterns, and the Gorontalo and Biak areas with local rain patterns. The analysis of the proposed model reveals that the best hyperparameters for the learning rate, maximum depth, and number of trees are 0.7, 3, and 50, respectively. The results demonstrate that the estimated rainfall in the six areas was very accurate, with RMSE < 2 mm/h and R2 > 0.7.
1. Introduction
Indonesia is located in the tropics, between the continents of Asia and Australia and between the Pacific and Indian Oceans, and is crossed by the equator. It consists of islands stretching west to east, with hilly and valley lands surrounded by vast oceans. These conditions cause the Indonesian region to have high weather and climate diversity [1,2,3]. Several phenomena strongly influence the climate patterns in Indonesia, which can be observed from the weather parameter return periods [4,5]. Based on the grouping of monthly average rainfall distribution patterns, Indonesia’s territory climatologically consists of seasonal zones (ZOMs) and non-seasonal zones (non-ZOMs) [6,7,8]. The Indonesian region has 407 climate patterns, of which 342 are ZOMs, which generally present apparent differences between the rainy and dry seasons, while the other 65 are non-ZOMs [9]. In addition to seasonal patterns, Indonesia’s territory is divided according to three rain pattern types, namely, monsoonal, local, and equatorial [10]. The diversity of rain patterns in the Indonesian region presents a challenge for the estimation of rainfall in various regions throughout the country [11]. The Meteorological, Climatological, and Geophysical Agency (BMKG) has stated that Indonesia, as a tropical and archipelagic country, has complex atmospheric phenomena due to the complexity and uncertainty of its rain distribution. It is difficult for the BMKG to provide rainfall estimate information with high accuracy and resolution, both spatially and temporally.
Rainfall estimation studies using several methods have been conducted in areas with monsoon rain patterns [12,13,14], and, likewise, for areas with equatorial [15] rainfall patterns. Estimation studies have been carried out in each rain pattern area independently, but have not been carried out comprehensively and in an integrated manner to cover all three rain patterns. Therefore, these developed methods can only be applied to areas with specific rain patterns [16,17]. An estimation method that applies to a particular region may lead to a significant deviation if applied to other regions [18,19]. In addition, estimation methods that use statistical models do not always produce accurate results [20,21,22], as the accuracy of a statistical model depends on the linear relationships between variables.
The characteristics of rainfall data vary widely, are not continuous, and fluctuate [23,24,25,26]; therefore, they may be non-linear. Therefore, machine learning approaches are suitable for the estimation of rainfall as, conceptually, machine learning algorithms can be applied to both linear and non-linear data sets [27,28,29,30,31]. The application of machine learning to estimate rainfall has been carried out in previous studies, using various methods and data sources. A multi-layer perceptron (MLP) could accurately estimate rainfall using single-polarisation weather radar [32]. However, MLP models often work slowly when used to process complex data and are highly dependent on the quality of the training data, as local minima can cause generalisation problems [33,34]. Tree regression and random forest, which are both supervised machine learning methods, have the potential to be used to estimate rainfall from dual-polarisation weather radar [27]. Random forest models excel in terms of estimation accuracy, while tree regression excels in terms of processing speed [27,35]. However, random forest has a major limitation—the dependence of the accuracy on the number of trees—which can make the algorithm too slow and ineffective for real-time estimation [36]. Meanwhile, tree regression is very sensitive to the training data and, so, irrelevant attributes and noise can cause the estimation results to be inaccurate [37].
Using satellite data and weather radar, machine learning methods have been proven to be effective in estimating rainfall [38]. Furthermore, using data sources that are more heterogeneous and comprehensive, such as rain gauge, radar, and satellite data, allows machine learning models to produce very accurate rainfall estimates [39]. However, the use of machine learning in the development of rainfall estimation studies still faces two important concerns [40]. First, from the implementation side, some machine learning algorithms for estimating rainfall generally do not consider the variability of rain patterns. Second, from the point of view of the effectiveness and efficiency of the estimates based on machine learning approaches, the result is very dependent on the characteristics of the data and the selected algorithm [41,42].
Several researchers have previously stated that the gradient boosting (GB) algorithm may efficiently manage non-linear relationships between data. This algorithm is not affected by overfitting [43] or precision [44], is accurate and robust against missing data [45], and can provide good results in significant and varied data sets [33]. Considering the heterogeneous characteristics of rainfall data, GB has been shown to be a suitable machine learning algorithm for estimation [46,47]. In this study, the GB algorithm is implemented to estimate rainfall at several points in the ZOM and non-ZOM regions, including monsoon, equatorial, and local rainfall patterns. Therefore, the estimation model is universal and non-sectoral, remains accurate, and can be applied to all regions of Indonesia.
2. Materials and Methods
2.1. Research Data
This study used rainfall data from tipping bucket rain gauge measurements and weather radar reflectivity data for six regions in Indonesia: Bandar Lampung, Banjarmasin, Pontianak, Deli Serdang, Gorontalo, and Biak. The Bandar Lampung and Banjarmasin regions represent ZOM regions, while Pontianak, Deli Serdang, Gorontalo, and Biak represent non-ZOM regions. The Pontianak and Deli Serdang areas have an equatorial rain pattern, while the Gorontalo and Biak areas have a local rain pattern. The map, coordinates, and elevation of each research location, as well as the distance of the weather radar instrument from the tipping bucket, are presented in Figure 1. The data period used in this research is from December 2021 to February 2022.
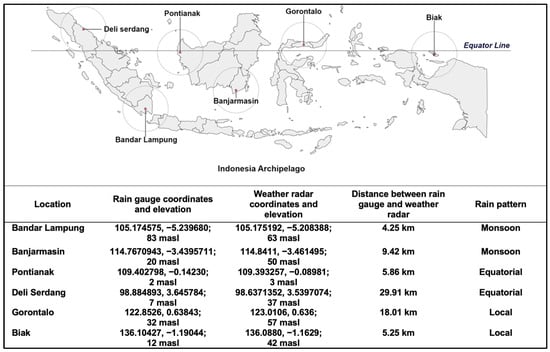
Figure 1.
Research locations with map information, coordinates, altitude, distance from rain gauges and weather radar, as well as rain patterns at each location.
The six research locations are part of the BMKG’s weather radar network. The six weather radars are C-band radars using an operating frequency of 5500–5700 MHz with a single polarisation [48]. The weather radar scanning strategy was designed to generate reflectivity data every 10 min. Rainfall data were obtained through the accumulation of tipping bucket measurements simultaneously. Each location consists of three tipping bucket unit, which records rainfall data accumulatively every 10 min during the research period. The tipping bucket sensor used is the property of BMKG and has a resolution of 0.1 mm [49]. The distance between rain gauges and weather radar varies. The radar reflectivity data in this study have undergone attenuation correction to ensure measurement accuracy and reliability. Attenuation correction compensates for the loss of signal strength due to absorption and scattering by atmospheric particles, especially rain. Gaseous attenuation is 0.017 dB/km, obtained from the radar manual dataset adapted to the polarimetric technique [50,51]. The radar reflectivity range used per location is 0–50 dBZ. We used three approaches: previous literature, a rain detection approach, and manual radar dataset information [52,53].
To ensure accuracy and consistency in rainfall detection, we select data that show agreement between the two sources, namely when the radar detects rain and is recorded on the rain gauge and when both do not. If there is a difference in detection between the two sources, we do not use the data. This approach ensures that only data that consistently show the presence or absence of rain are included, thereby increasing the reliability and validity of our research results.
2.2. Pre-Processing
The weather radar data used in this study were column maximum (CMAX) reflectivity data. CMAX is a weather radar product that represents the maximum reflectivity value at a given location. The CMAX product takes a set polar volume, converts it into a Cartesian volume, and displays the maximum value for each vertical column. Physically, CMAX represents the maximum possible rainfall in a space. Meteorologists can see the worst-case scenario overall by using the CMAX product instead of comparing several two-dimensional images from multiple layers and three-dimensional products. It helps in the observation of high-intensity rainfall from convective clouds, which often occur in Indonesia [54]. Several studies in Indonesia show that the use of CMAX produces a more representative product in estimating rainfall [22,55].
The data are provided in the form of a volumetric (.vol) file. In general, weather radar data are stored in the polar coordinate structure of the radar sweep, as shown in Figure 2, while meteorological spatial data processing is carried out in a Cartesian coordinate structure using longitude and latitude coordinates.
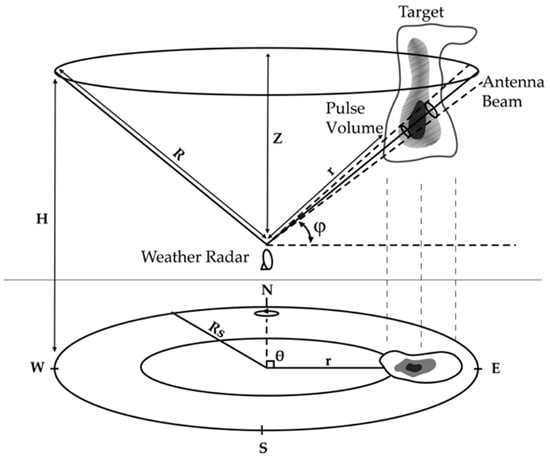
Figure 2.
Schematic of radar data observation and structure in polar coordinates. The parameter H is the height above ground level, φ is the vertical sweep angle of the radar, r is the radar target radius, and θ is the polar angle (azimuth). Modified from [56].
Both data types were converted into the network common data form (NetCDF) format. The Python-based open-source wradlib version 1.19 software was used to process the weather radar data. These data contain time information, coordinates, and CMAX reflectivity data variable values. The method for obtaining the data was applied by first setting the target coordinates. Then, pixel alignment of the radar image was performed at the coordinates using four pixels of the nearest 2 × 2 pixel size through bilinear interpolation, which can provide a relatively smoother image output value. Bilinear interpolation is an extension of linear interpolation involving two variables. The bilinear interpolation process works linearly in one direction and then another [57,58]. The interpolation result in this pre-processing process is the radar reflectivity data at the tipping bucket coordinates.
2.3. Gradient Boosting Algorithm
As highlighted in the contributions of this research, we aimed to build a rainfall estimation model. Rainfall estimation is modelled as a supervised learning problem, where the target is rainfall data from tipping bucket rain gauge measurements in terms of hours. The method tests the accuracy of estimates generated from training radar data in all study areas. The resulting model is then applied to each study area. We named it the Global Model because it is built from all datasets in all of six study regions. The results are compared with the model for each rain pattern area. We named it the Local Model. Both models are built using the Gradient Boosting algorithm.
In general, BMKG uses the Z–R Marshall-Palmer equation (MP, Z = 200R1.6) to convert radar reflectivity data (Z) into rainfall (R) in stratiform rain. For convective rain in tropical regions, the Rosenfeld equation (Z = 250R1.2) is used. We also develop a new empirical relationship Z–R (Z = ARb) by adjusting the constants A and b based on the study region. Therefore, we compared the GB Model with these three statistical equations [13].
The complete workflow is shown in Figure 3. In this study, we propose to randomly divide the original data set into training (70%) and test (30%) data sets [59]. The training algorithms were then utilised on the training data set. The model confidence was determined according to the score on the test data set using the coefficient of determination method (R2). R2 indicates the correlation between the target values and values predicted by the model; the closer R2 is to 1.0, the closer the predictions are to the target values. New models were re-trained until a satisfactory level of confidence was achieved with the algorithm parameters, and split sizes were adjusted accordingly.
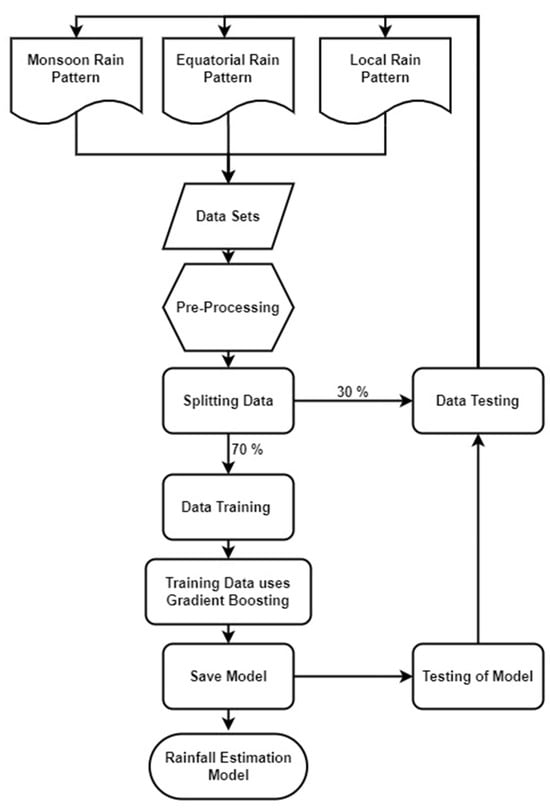
Figure 3.
Data sets in six regions representing monsoon, equatorial, and local rainfall patterns were trained using the GB algorithm to obtain an estimation model. The estimation model is saved and implemented in each research area through testing of the predicted tipping bucket measurement values. In addition, comparisons were made with local models that had been previously built in the area.
This research focuses on implementing models with tuned hyperparameters. GB has several hyperparameters that must be tuned to obtain optimal model accuracy. The GB hyperparameters include Maximum Depth (MD), Learning Rate (LR), and Number of Trees (NOT). Hyperparameter tuning can be performed manually, through testing several combinations of hyperparameters on pre-determined parameters. These combinations are tested one after another in order to produce the best combination, indicated by the lowest error value [60].
Determining the MD parameter will set the maximum depth in each tree. The lowest limit of the MD is 1 [61], while the maximum allowable depth is 3 [62]; therefore, the MD was adjusted with the variations 1, 2, and 3. Determining the MD is intended to prevent overfitting [63].
LR is a parameter that determines the step size of each update during training. The function of the LR is to change the gradient value using a scalar function [64]. The LR in GB can shrink the contribution of each new tree added to the series. The LR value ranges from 0 to 1 [65]. The LR parameter was tuned with values of 0.1, 0.3, and 0.7. Given the same number of trees, the greater the LR, the faster the minimum loss function or error for each sample is achieved, but it has the potential to have an overfitting effect.
The number of trees in the GB algorithm is expressed by the NOT hyperparameter. The higher the NOT, the better the ability to study data. However, adding many trees can slow down the training process. Thus, the magnitude of the NOT was adjusted with the values of 50, 100, and 150 [62].
3. Results and Discussion
3.1. Data and Correlation
The model was built using tipping bucket observation data and weather radar reflectivity data at six locations. Each location had different data characteristics. Even though the study period was the same, after the filtering process, different amounts of training data were obtained. Data filtering was carried out to eliminate missing data; however, this has the potential to cause data imbalances, especially with the differences in the amount of data for each region. The number of data samples after filtering was 15,146, with a distribution of 4856 data samples in Bandar Lampung, 1940 data samples in Banjarmasin, 2233 data samples in Biak, 1268 data samples in Gorontalo, 919 data samples in Pontianak, and 3930 data samples in Deli Serdang. For the training data process, we adopted a random undersampling strategy [66] to avoid the problem of data imbalance in several locations. Therefore, the data for each location is 919 data samples with the total data for all locations being 5514 data samples.
The data plotting results shown in Figure 4 indicate that the reflectivity values of the weather radar at the tipping bucket coordinates did not have a strong correlation with the tipping bucket measurement values. For several reasons, radar and rain gauge quantitative measurements of precipitation can differ [67]; for example, the estimated rainfall measured by the weather radar may be rainfall that has not yet reached the ground’s surface and is often far from the radar. The direction of wind movement could also affect the area of rainfall [68,69,70]. The product of the vertical reflectivity of the radar showed significant variability due to the growth of precipitation, evaporation, and the influence of the wind. These variations can result in a large difference between the estimated radar rainfall at a certain altitude and that which falls on the ground [71]. Another effect was the high spatial variability of rainfall coverage. The size of the rain gauge capture was only about 20 cm—much smaller than the radar pixel resolution of around 400 m2 [72,73]. The data plot indicates the underestimation of rainfall, possibly caused by ground clutter and anomalous propagation echoes [74]. In addition, tipping bucket rain gauges may increasingly underestimate rainfall when either the wind speed or precipitation intensity is high [75]. Previous research regarding the sampling interval of radar data has indicated an error in rainfall estimation with a sampling interval of 5–10 min. The effect of radar scanning time also cannot be ignored; therefore, it was necessary to design an appropriate radar scanning strategy [76]. Furthermore, the distance difference between the weather radar and the rain gauge did not correlate with the measurement results of the two instruments; therefore, the distance function of the rain gauge from the location of the weather radar could not characterise the differences in the measurement results between the two instruments.
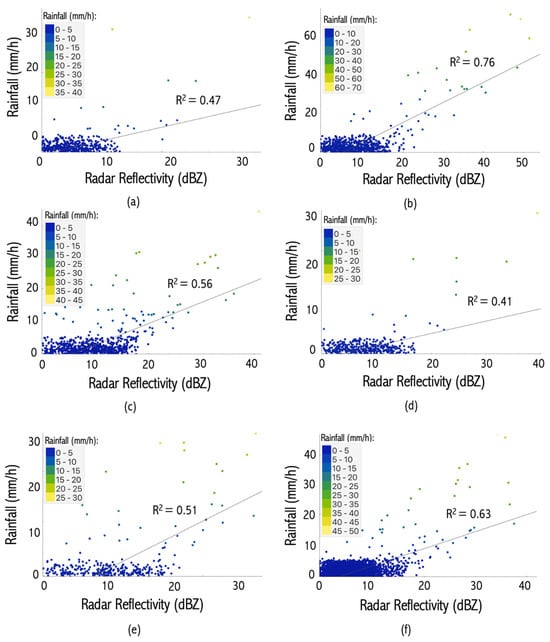
Figure 4.
Plots of rainfall data and weather radar reflectivity in the areas of (a) Bandar Lampung, (b) Banjarmasin, (c) Biak, (d) Gorontalo, (e) Pontianak, and (f) Deli Serdang.
3.2. Application of the Gradient Boosting Models
Evaluation of the tuning hyperparameters played an important role in implementing the GB model. It was necessary to obtain the best hyperparameter values to apply in the GB model. The evaluation index used for hyperparameter tuning was the root mean square error (RMSE). Figure 5 describes the GB model hyperparameter tuning results for all study areas. When the LR, MD, and NOT took values of 0.7, 3, and 150, respectively, the best model accuracy for the Lampung, Biak, Deli Serdang, and Pontianak regions was observed. The best tuning for the Banjarmasin area was when the LR, MD, and NOT were set as 0.7, 2, and 50. Meanwhile, the best effect was obtained for the Gorontalo region when the LR, MD, and NOT values were 0.7, 3, and 50, respectively.
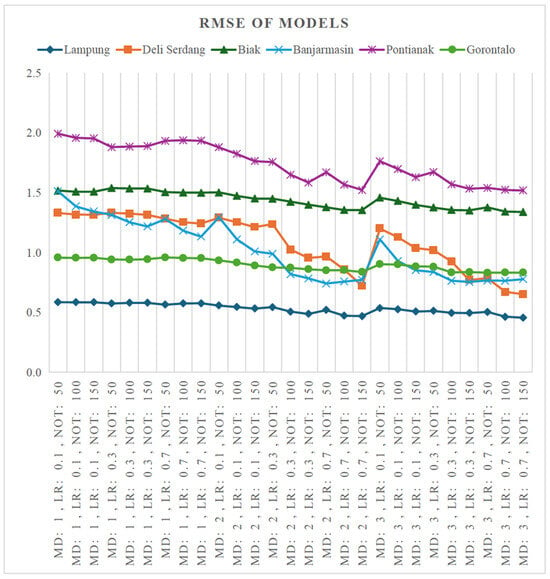
Figure 5.
Graphic visualisation of root mean square error (RMSE) in mm/h based on hyperparameter tuning in the form of Learning Rate (LR), Maximum Depth (MD), and Number of Trees (NOT) in the global model for each region.
Using a small LR is recommended to produce a good model and avoid overestimation [54]. However, a small LR must be balanced with a large NOT to achieve the best estimate. As the maximum NOT in this study was limited to 150 and considering the need for faster processing times, the best LR was 0.7 for all locations. The MD value, which was relatively accurate for all regions, was tuned to 3. Based on the hyperparameter tuning evaluation results, it was determined that the LR, MD, and NOT to be implemented in the global model were 0.7, 3, and 150, respectively.
During the study period, the measured rainfall in the Bandar Lampung region was 0.6–36 mm/h. The estimation results for the GB model in the Bandar Lampung region had a very strong correlation with the tipping bucket rain gauge measurement value. The global model also correlated fairly strongly with the tipping bucket rain gauge measurement value of 0.92. The GB estimation model had good accuracy when it rained with high intensity. When the tipping rain gauge registered 36 mm/h, the value estimated by the global model was 34.9 mm/h. Meanwhile, the local model at Bandar Lampung obtained a better estimate of 35.9 mm/h.
Several rain events measured with a rain gauge were recorded in the Banjarmasin region, with rainfall of 0.1–50.9 mm/h. The estimated rainfall using the global model and the local model strongly correlated with the tipping bucket rain gauge measuring values, each at 0.96 and 0.99. With strong correlation, the global model could be accurately applied to the Bandar Lampung and Banjarmasin regions, which have monsoon rain patterns.
Based on the tipping bucket rain gauge data and weather radar in the Biak region from December 2021 to February 2022, 179 rain data samples were recorded with 0.6–38.2 mm/h of rainfall. Overall, the correlation value of the local model in Biak with the tipping bucket rain gauge measurement value was 0.88; this was better than the correlation value of the global model with the tipping bucket rain gauge measurement value of 0.79. As for the regions with the same rain pattern, the estimation results of the local model in the Gorontalo region also had a correlation with the tipping bucket rain gauge measurement value that was not strong; however, the model could still be applied to the regions with local rain patterns.
The local model in the Pontianak region had an excellent correlation with the tipping bucket rain gauge measurement value (of 0.96); meanwhile, the correlation of the global model with the tipping bucket rain gauge measurement value was 0.89. In the Deli Serdang region, the correlation values of the two estimation models were good with respect to the tipping bucket measurement values, at 0.96 and 0.90, respectively. The evaluation results showed that the global model could be applied to areas with equatorial rain patterns.
Comparisons of observed rainfall data, global model estimates, and local model estimates are shown in Figure 6.
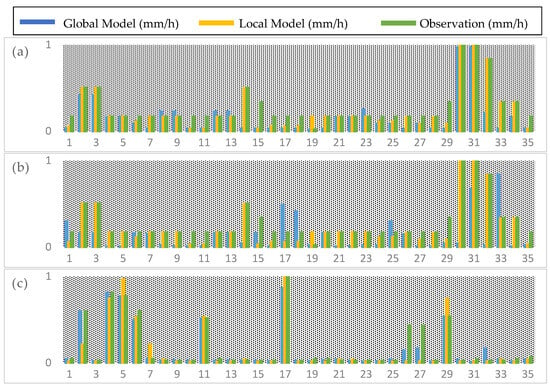
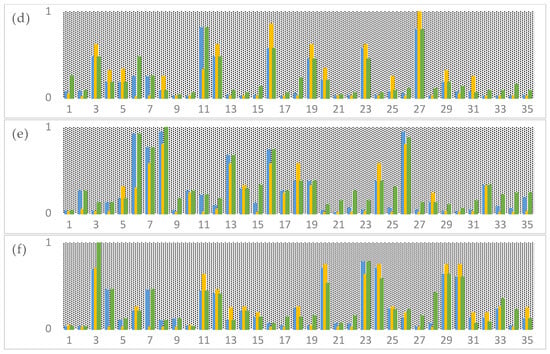
Figure 6.
Observed rainfall data, global model estimates, and local model estimates for (a) Lampung, (b) Banjarmasin, (c) Biak, (d) Gorontalo, (e) Pontianak, and (f) Deli Serdang. The x-axis is a sample of rain events; we used 35 samples of rain events in each location. The y-axis is the normalised value of rainfall intensity.
The results of the evaluation of the model are illustrated in Figure 7 and summarised in Table 1. In general, the estimation results of the global model could be applied to the six locations, representing three regions with monsoon, local, and equatorial rain patterns. Given the variability of different patterns and rainfall, the global model could accurately estimate rainfall. Interestingly, when applied to areas with local rainfall patterns, the global model had a lower correlation and higher error values when compared with regions with equatorial and seasonal rainfall patterns.
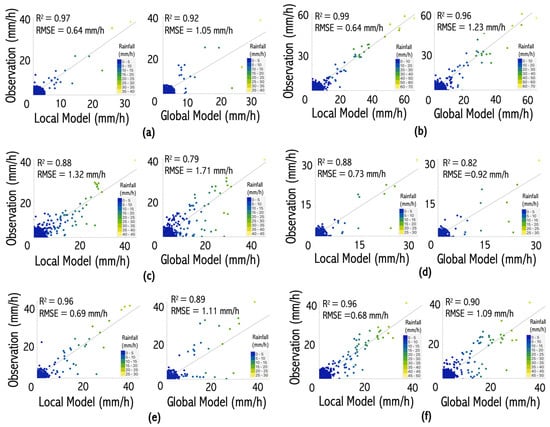
Figure 7.
Comparison of observed rainfall data, global model estimates, and local model estimates for (a) Lampung, (b) Banjarmasin, (c) Biak, (d) Gorontalo, (e) Pontianak, and (f) Deli Serdang.

Table 1.
Evaluation of the implementation of the gradient boosting model in the Bandar Lampung, Banjarmasin, Biak, Gorontalo, Pontianak, and Deli Serdang regions.
Regions with local rainfall patterns have greater rainfall data complexity than other regions, as rain caused by convective clouds dominates in such areas. The appearance of convective clouds is influenced by local conditions—namely, the presence of oceans and waterscapes—which result in intensive local heating [77]. Convective rain clouds can be characterised as rain clouds that rise extremely high and have large enough water droplets to produce rainfall of more than 10 mm/h [78]. Convective rain occurs in limited periods and usually covers a small area or is localised [79,80]. This rain pattern generally leads to high levels of rainfall [81]. Strong winds accompany it. and so the estimated rainfall using weather radar generally provides unfavourable results in the case of convective clouds [82,83], leading to significant differences between rain gauge measurements and radar image estimates [84,85]. The complexity and size of the training data can also affect the estimation results of a model using GB [86].
We also see a significant comparison of rainfall estimation results using the Gradient Boosting algorithm compared to the Z–R equation. Gradient Boosting is superior due to its ability to capture the non-linear relationship and complex interactions between radar reflectivity and precipitation rate by minimizing the loss function by dynamically adjusting the model based on the prediction error gradient. Meanwhile, the Z–R equation relies on a simple linear relationship with empirical constants often inconsistent across various weather conditions.
Furthermore, a model test was carried out without using local rain training data, in order to determine the effect of data complexity in local rainfall pattern areas on the GB global model. The global model without local rain training data was compared with the global model without monsoon training data and the global model without equatorial rain training data. To determine the effect of the amount of training data, the global model without training data in one of the rain pattern regions was compared with the global model which used all the training data. As a result, the global model without local rain training data had a better correlation than the global model without monsoon training data and the global model without equatorial rain training data. This meant that local rainfall data had the most significant impact on the accuracy of the global model estimates. However, the global model which used all the training data produced the strongest correlations. This indicates that the global model produced better rainfall estimates with more training data. Table 2 compares the global model estimation results based on the training data.

Table 2.
Comparison of global model estimation results based on training data used.
The differences in distance and elevation of the tipping bucket rain gauge and weather radar resulted in differences in rain measurements detected by weather radar in the six areas; however, they did not significantly affect the estimation results of the GB global model. In addition, the imbalance and randomness of the input data were also not a problem for the model.
4. Conclusions
In this study, we implemented and analysed an ensemble machine learning algorithm, GB, to estimate rainfall based on weather radar reflectivity data. The research areas included ZOM and non-ZOM areas characterised by monsoon, equatorial, and local rainfall patterns. The training data included data from all research regions, and the estimation model trained on these data was applied to each research area. Hyperparameter tuning was performed first, in order to obtain the best estimation results. With regard to tuning the hyperparameters, a lower LR does not mean that the accuracy results will be better, as seen from the optimal LR of 0.7. Meanwhile, a higher MD and NOT values tend to produce better estimates.
Based on the research results, the global model can estimate rainfall accurately in regions characterised by monsoon, local, and equatorial rainfall patterns. The effect of data complexity on model accuracy in regions with local rainfall patterns was also analysed. Model tests without local rainfall training data show that local rainfall data have the most significant impact on the accuracy of global model estimates. Another conclusion is that the Gradient Boosting algorithm consistently provides more accurate and reliable rainfall estimates compared to the traditional Z–R equation in various regions. The GB algorithm ensemble learning method is optimal for dealing with complex data, such as unbalanced and uncorrelated variables. In addition, the GB algorithm can handle significant and long-term historical data, primarily spatial and temporal data. Further research must be conducted regarding the effect of the amount of training data on model accuracy.
Author Contributions
Conceptualization, M.P.; methodology, M.P.; software, M.P.; validation, M.S.R. and D.H.; formal analysis, M.P., M.S.R. and D.H.; investigation, M.P., M.S.R. and D.H.; resources, M.P.; data curation, M.P.; writing—original draft preparation, M.P.; writing—review and editing, M.P., M.S.R. and D.H.; visualization, M.P.; supervision, M.S.R. and D.H. All authors have read and agreed to the published version of the manuscript.
Funding
This research received no external funding.
Institutional Review Board Statement
Not applicable.
Informed Consent Statement
Not applicable.
Data Availability Statement
Data available on request due to restrictions.
Acknowledgments
The authors are grateful to the Meteorology, Climatology, and Geophysics Agency for providing some information for this research.
Conflicts of Interest
The authors declare no conflicts of interest.
References
- Belgaman, H.A.; Kimpei, I.; Rusmawan, S.; Masahiro, T.; Edvin, A.; Arika, U.; Sheila, K. Characteristics of seasonal precipitation isotope variability in Indonesia. Hydrol. Res. Lett. 2017, 11, 92–98. [Google Scholar] [CrossRef]
- Faradiba, F. Determination of Climate Factors in Flood and Drought Disaster in Indonesia using Instrumental Variable (IV) Methods. J. Ilmu Fis. Univ. Andalas 2021, 13, 54–61. [Google Scholar] [CrossRef]
- Jun-Ichi, H.; Yamanaka, M.D.; Matsumoto, J.; Winarso, P.A.; Sribimawati, T. Spatial and Temporal Variations of the Rainy Season over Indonesia and their Link to ENSO. J. Meteorol. Soc. Jpn. 2002, 80, 285–310. [Google Scholar]
- Aldrian, E.; Gates, L.D.; Widodo, F.H. Seasonal variability of Indonesian rainfall in ECHAM4 simulations and in the reanalyses: The role of ENSO. Theor. Appl. Climatol. 2007, 87, 41–59. [Google Scholar] [CrossRef]
- Pramuwardani, I.; Sopaheluwakan, A. The Influence of Madden-Julian Oscillation on Local-Scale Phenomena over Indonesia during the Western North Pacific and Australian Monsoon Phases. Forum Geogr. 2018, 31, 156–169. [Google Scholar] [CrossRef]
- Ardhitama, A.; Sholihah, R. Kajian Penentuan Awal Musim di Daerah Non ZOM 14 Riau dengan Menggunakan Data Curah Hujan dan Hari Hujan. J. Sains Teknol. Modif. Cuaca 2014, 15, 65–73. [Google Scholar] [CrossRef]
- Nuryanto, D.E. Keterkaitan Antara Monsun Ind-Australia Dengan Variabilitas Musiman Curah Hujan di Benua Maritim Indonesia Secara Spasial Berbasis Hasil Analisa Data Satelit TRMM. J. Meteorol. Dan Geofis. 2012, 13, 91–102. [Google Scholar] [CrossRef]
- Satiadi, D.; Fathrio, I. Penentuan Onset Monsun di Wilayah Indo-Australia Berdasarkan Lompatan ITCZ. J. Sains Dirgant. 2011, 9, 1–11. [Google Scholar]
- Setiawan, A.M.; Ripaldi, A. Prakiraan Musim Hujan 2021/2022 di Indonesia; Clearing House: New York, NY, USA, 2021. [Google Scholar]
- Aldrian, E. Meteorologi Laut Indonesia; Puslitbang BMKG: Jakarta Pusat, Indonesia, 2008. [Google Scholar]
- Gernowo, R.; Widodo, C.E.; Widodo, A.P. The atmospheric dynamic extreme of tropical as an analysis of climate change in Indonesia. Geogr. Tech. 2020, 15, 138–146. [Google Scholar] [CrossRef]
- Ardiyanto, L.; Hanif, A.M.; Alfaridzi, M.; Ariwibowo, S.; Wardoyo, E.; Nugraheni, I.R. Estimasi Curah Hujan Radar Cuaca dengan Hubungan Z–R Berbeda pada Tipe Awan Hujan Konvektif dan Stratiform di Lampung. Pros. SNFA Semin. Nas. Fis. Dan Apl. 2019, 4, 51–60. [Google Scholar] [CrossRef]
- Hutapea, T.D.F.; Permana, D.S.; Praja, A.S.; Muzayanah, L.F. Modification of Z–R Relationship Constants in Surabaya Radar for Improving the Accuracy of Rainfall Estimates. J. Meteorol. Dan Geofis. 2021, 21, 91–97. [Google Scholar] [CrossRef]
- Juma’a, M.W.; Limantara, L.M.; Wahyuni, S. Estimasi Tinggi Curah Hujan dari Data Klimatologi Menggunakan Model Artificial Neural Network (Ann) di Kabupaten Badung Bali Selatan. J. Teknol. Dan Rekayasa Sumber Data Air 2021, 1, 126–135. [Google Scholar] [CrossRef]
- Swarinoto, Y.S.; Husain. Daily Rainfall Estimation Using Auto Estimator Method (Jayapura and its surrounding case). J. Meteorol. Dan Geofis. 2012, 13, 53–61. [Google Scholar]
- Marzuki; Hashiguchi, H.; Vonnisa, M.; Harmadi; Muzirwan; Nugroho, S.; Yoseva, M. Z–R Relationships for Weather Radar in Indonesia from the Particle Size and Velocity (Parsivel) Optical Disdrometer. In Proceedings of the 2018 Progress in Electromagnetics Research Symposium (PIERS-Toyama), Toyama, Japan, 1–4 August 2018; pp. 37–41. [Google Scholar] [CrossRef]
- Rui, X.P.; Qu, X.K.; Yu, X.T.; Lei, Q.L.; Fan, Y.L. Quantitative rainfall estimation using weather radar based on the improved kalman filter method. Appl. Ecol. Environ. Res. 2019, 17, 369–381. [Google Scholar] [CrossRef]
- Ayasha, N. A Comparison of Rainfall Estimation Using Himawari-8 Satellite Data in Different Indonesian Topographies. Int. J. Remote Sens. Earth Sci. 2021, 17, 189–200. [Google Scholar] [CrossRef]
- Tian, W.; Yi, L.; Liu, W.; Huang, W.; Ma, G.; Zhang, Y. Ground radar precipitation estimation with deep learning approaches in meteorological private cloud. J. Cloud Comput. 2020, 9, 22. [Google Scholar] [CrossRef]
- Inlaung, K.; Nakapan, S. Study of radar rainfall estimation using geographic information systems over Chiang Mai province. J. Phys. Conf. Ser. 2018, 1144, 012089. [Google Scholar] [CrossRef]
- Sobli, N.H.M.; Ismail, A.F.; Isa, F.N.M.; Mansor, H. Assessment of Radar Reflectivity-Rainfall Rate, Z–R Relationships for a Convective Event in Malaysia. Int. J. Electr. Energy 2013, 1, 239–243. [Google Scholar] [CrossRef]
- Efendi, U.; Nadiansyah, R.; Afriza, P.R.; Nugraheni, I.R.; Ali, A. Uji Akurasi Estimasi Curah Hujan Produk Radar Cuaca C-BAND di Wilayah Pontianak. In Proceedings of the Seminar Nasional Geografi III, Yogyakarta, Indonesia, 2 November 2019; pp. 776–785. [Google Scholar]
- Bove, R.; Pelino, V.; de Leonibus, L. Complexity in rainfall phenomena. Commun. Nonlinear Sci. Numer. Simul. 2006, 11, 678–684. [Google Scholar] [CrossRef]
- Peters, O.; Hertlein, C.; Christensen, K.; Hertlein, C. A Complexity View of Rainfall. Phys. Rev. Lett. 2002, 88, 1–4. [Google Scholar] [CrossRef] [PubMed]
- Silva, A.S.A.d.; Barreto, I.D.d.C.; Cunha-Filho, M.; Menezes, R.S.C.; Stosic, B.; Stosic, T. Spatial and Temporal Variability of Precipitation Complexity in Northeast Brazil. Sustainability 2022, 14, 13467. [Google Scholar] [CrossRef]
- Hidayat, R.; Ando, K. Variabilitas Curah Hujan Indonesia dan Hubungannya Dengan ENSO/IOD: Estimasi Menggunakan Data JRA-25/JCDAS. Agromet 2014, 28, 1–8. [Google Scholar] [CrossRef]
- Shin, K.; Song, J.J.; Bang, W.; Lee, G.W. Quantitative Precipitation Estimates Using Machine Learning Approaches with Operational Dual-Polarization Radar Data. Remote Sens. 2021, 13, 694. [Google Scholar] [CrossRef]
- Kaličanin, K.; Čolović, M.; Njeguš, A.; Mitić, V. Benefits of Artificial Intelligence and Machine Learning in Marketing. In Proceedings of the International Scientific Conference on Information Technology and Related Research, Belgrade, Serbia, 20 May 2019; pp. 472–477. [Google Scholar] [CrossRef]
- Attaran, M.; Deb, P. Machine Learning: The New ‘Big Thing’ for Competitive Advantage. Int. J. Knowl. Eng. Data Min. 2018, 5, 277–305. [Google Scholar] [CrossRef]
- al Bataineh, A. A comparative analysis of nonlinear machine learning algorithms for breast cancer detection. Int. J. Mach. Learn. Comput. 2019, 9, 248–254. [Google Scholar] [CrossRef]
- Ryo, M.; Rillig, M.C. Statistically reinforced machine learning for nonlinear patterns and variable interactions. Ecosphere 2017, 8, 1–16. [Google Scholar] [CrossRef]
- Waskita, T.P.; Saputro, A.H.; Sopaheluwakan, A.; Ryan, M. Machine Learning System for Rainfall Estimates from Single Polarization Radar. In Proceedings of the International Conferences on Information System and Technology (CONRIST 2019), Yogyakarta, Indonesia, 5–6 December 2019; SciTePress: Setúbal, Portugal, 2020; pp. 41–48. [Google Scholar] [CrossRef]
- Çolakoğlu, N.; Akkaya, B. Comparison of Multi-Class Classification Algorithms on Early Diagnosis of Heart Diseases. In Proceedings of the ISBIS Young Business and Industrial Statisticians Workshop on Recent Advances in Data Science and Business Analytics, Istanbul, Turkey, 25–28 September 2019; pp. 162–172. [Google Scholar]
- Popescu, M.-C.; Balas, V.E.; Popescu, L.P.; Mastorakis, N.E. Multilayer Perceptron and Neural Networks. Wseas Trans. Circuits Syst. 2009, 8, 579–588. [Google Scholar]
- Prajwala, T.R. A Comparative Study on Decision Tree and Random Forest Using R Tool. Int. J. Adv. Res. Comput. Commun. Eng. 2015, 4, 196–199. [Google Scholar] [CrossRef]
- Little, M.P.; Rosenberg, P.S.; Arsham, A. Alternative stopping rules to limit tree expansion for random forest models. Sci. Rep. 2022, 12, 15113. [Google Scholar] [CrossRef]
- Rokach, L.; Maimon, O. Decision Trees. In Data Mining and Knowledge Discovery Handbook; Springer: Berlin/Heidelberg, Germany, 2006; pp. 165–192. [Google Scholar] [CrossRef]
- Chandrasekar, V.; Tan, H.; Chen, H. A Machine Learning System for Rainfall Estimation from Spaceborne and Ground Radars. In Proceedings of the 2017 32nd General Assembly and Scientific Symposium of the International Union of Radio Science, URSI GASS 2017, Montreal, QC, Canada, 19–26 August 2017; Institute of Electrical and Electronics Engineers Inc.: Piscataway, NJ, USA, 2017; pp. 1–2. [Google Scholar] [CrossRef]
- Guarascio, M.; Folino, G.; Chiaravalloti, F.; Gabriele, S.; Procopio, A.; Sabatino, P. A Machine Learning Approach for Rainfall Estimation Integrating Heterogeneous Data Sources. IEEE Trans. Geosci. Remote Sens. 2020, 60, 4200111. [Google Scholar] [CrossRef]
- Sarker, I.H.; Kayes, A.S.M.; Watters, P. Effectiveness analysis of machine learning classification models for predicting personalized context-aware smartphone usage. J. Big Data 2019, 6, 57. [Google Scholar] [CrossRef]
- Sarker, I.H. Machine Learning: Algorithms, Real-World Applications and Research Directions. SN Comput. Sci. 2021, 2, 160. [Google Scholar] [CrossRef] [PubMed]
- Juarez-Orozco, L.E.; Martinez-Manzanera, O.; Nesterov, S.V.; Kajander, S.; Knuuti, J. The machine learning horizon in cardiac hybrid imaging. Eur. J. Hybrid Imaging 2018, 2, 15. [Google Scholar] [CrossRef]
- Ma, L.; Zhang, G.; Lu, E. Using the gradient boosting decision tree to improve the delineation of hourly rain areas during the summer from advanced Himawari imager data. J. Hydrometeorol. 2018, 19, 761–776. [Google Scholar] [CrossRef]
- Hosen, S.; Amin, R. Significant of Gradient Boosting Algorithm in Data Management System. Eng. Int. 2021, 9, 85–100. [Google Scholar] [CrossRef]
- Aziz, N.; Akhir, E.A.P.; Aziz, I.A.; Jaafar, J.; Hasan, M.H.; Abas, A.N.C. A Study on Gradient Boosting Algorithms for Development of AI Monitoring and Prediction Systems. In Proceedings of the 2020 International Conference on Computational Intelligence (ICCI), Bandar Seri Iskandar, Malaysia, 8–9 October 2020; pp. 11–16. [Google Scholar]
- Hassan, D.; Isaac, G.A.; Taylor, P.A.; Michelson, D. Optimizing Radar-Based Rainfall Estimation Using Machine Learning Models. Remote Sens. 2022, 14, 5188. [Google Scholar] [CrossRef]
- Putra, M.; Rosid, M.S.; Handoko, D. Rainfall Estimation Using Machine Learning Approaches with Raingauge, Radar, and Satellite Data. In Proceedings of the 2022 International Conferernce on Electrical Engineering and Informatics (ICELTICs), Banda Aceh, Indonesia, 27–28 September 2022. [Google Scholar]
- Wardoyo, E. Analisis Interferensi Frekuensi Radar Cuaca C-Band di Indonesia. InComTech J. Telekomun. Dan Komput. 2014, 5, 163–184. [Google Scholar] [CrossRef][Green Version]
- All Weather Inc. Tipping Bucket Rain Gauge Models 6011-A 6011-B User’s Manual; All Weather Inc.: Sacramento, CA, USA, 2008. [Google Scholar]
- Matrosov, S.Y.; Kingsmill, D.E.; Martner, B.E.; Ralph, F.M. The utility of X-band polarimetric radar for quantitative estimates of rainfall parameters. J. Hydrometeorol. 2005, 6, 248–262. [Google Scholar] [CrossRef]
- Gu, J.Y.; Ryzhkov, A.; Zhang, P.; Neilley, P.; Knight, M.; Wolf, B.; Lee, D.-I. Polarimetric attenuation correction in heavy rain at C band. J. Appl. Meteorol. Climatol. 2011, 50, 39–58. [Google Scholar] [CrossRef]
- Baedi, R.; Boers, R.; Russchenberg, H. Detection of Boundary Layer Water Clouds by Spaceborne Cloud Radar. J. Atmos. Ocean. Technol. 2002, 19, 1915–1927. [Google Scholar] [CrossRef]
- Kogan, Z.N.; Mechem, D.B.; Kogan, Y.L. Assessment of variability in continental low stratiform clouds based on observations of radar reflectivity. J. Geophys. Res. D Atmos. 2005, 35, 1–15. [Google Scholar] [CrossRef]
- Prasetyo, B.; Pusparini, N.; Fitria, W. Weather Radar Application for Identification of Extreme Weather Conditions Fluctuation (Case Study: Flood in Medan City on October 5th 2018). J. Sains Teknol. Modif. Cuaca 2019, 20, 13–21. [Google Scholar] [CrossRef]
- Tondang, Y.M.; Situmorang, M.; Ikhsan, T.; Darmawan, Y. Accuracy of Weather Radar Products for Rainfall Estimation in North Sumatra Region. Prism. Sains J. Pengkaj. Ilmu Dan Pembelajaran Mat. Dan IPA IKIP Mataram 2023, 11, 351–357. [Google Scholar] [CrossRef]
- Daliakopoulos, I.N.; Tsanis, I.K. A Weather Radar Data Processing Module for Storm Analysis. J. Hydroinform. 2012, 14, 332–344. [Google Scholar] [CrossRef]
- Yang, W.; Liu, J.; Li, M.; Guo, Z. Isophote-Constrained Autoregressive Model with Adaptive Window Extension for Image Interpolation. IEEE Trans. Circuits Syst. Video Technol. 2018, 28, 1071–1086. [Google Scholar] [CrossRef]
- Elizabeth, T. Analisis Hasil Resolusi Citra Dengan Metode Interpolasi Nearest Neighbor, Interpolasi Bilinear, dan Interpolasi Bicubic. J. Sist. Teknol. Inf. Komun. 2019, 2, 1–5. [Google Scholar]
- Guillen, M.D.; Aparicio, J.; Esteve, M. Gradient tree boosting and the estimation of production frontiers. Expert Syst. Appl. 2023, 214, 119134. [Google Scholar] [CrossRef]
- Callens, A.; Morichon, D.; Abadie, S.; Delpey, M. Using Random forest and Gradient boosting trees to 1 improve wave forecast at a specific location. Appl. Ocean. Res. 2020, 104, 102339. [Google Scholar] [CrossRef]
- Bartz, E.; Bartz-Beielstein, T.; Zaefferer, M.; Mersmann, O. Hyperparameter Tuning for Machine and Deep Learning with R A Practical Guide; Springer: Berlin/Heidelberg, Germany, 2022. [Google Scholar]
- Fan, M.; Xiao, K.; Sun, L.; Zhang, S.; Xu, Y. Automated Hyperparameter Optimization of Gradient Boosting Decision Tree Approach for Gold Mineral Prospectivity Mapping in the Xiong’ershan Area. Minerals 2022, 12, 1621. [Google Scholar] [CrossRef]
- Handayani, A.; Jamal, A.; Septiandri, A.A. Evaluasi Tiga Jenis Algoritme Berbasis Pembelajaran Mesin untuk Klasifikasi Jenis Tumor Payudara. J. Nas. Tek. Elektro Dan Teknol. Inf. 2017, 6, 394–403. [Google Scholar] [CrossRef][Green Version]
- Sahrul; Hadinisa, S.; Koyimatu, M.; Irawan, A.; Nogroho, H. Analisis Learning Rate pada Metode Transfer Learning untuk Sistem Pendeteksi Api. In Proceedings of the Seminar Nasional Microwave, Antena dan Propagasi (SMAP), Jawa Barat, Indonesia, 10 December 2018; pp. 1–4. [Google Scholar]
- Nielsen, D. Tree Boosting with XGBoost Why Does XGBoost Win ‘Every’ Machine Learning Competition? Master’s Thesis, Norwegian University of Science and Technology, Trondheim, Norway, 2017. [Google Scholar]
- Mohammed, R.; Rawashdeh, J.; Abdullah, M. Machine Learning with Oversampling and Undersampling Techniques: Overview Study and Experimental Results. In Proceedings of the 2020 11th International Conference on Information and Communication Systems, ICICS 2020, Irbid, Jordan, 7–9 April 2020; pp. 243–248. [Google Scholar] [CrossRef]
- Sebastianelli, S.; Russo, F.; Napolitano, F.; Baldini, L. Comparison between radar and rain gauges data at different distances Comparison between radar and rain gauges data at different distances from radar and correlation existing between the rainfall values in the adjacent pixels Comparison between radar and rain gauges data at different distances. Hydrol. Earth Syst. Sci. Discuss 2010, 7, 5171–5212. [Google Scholar] [CrossRef]
- Birhan, M.W.; Raju, U.J.P.; Kenea, S.T. Error Modeling Radar Rainfall Estimation through Incorporating Rain Gauge Data over Upper Blue Nile Basin, Ethiopia. Int. J. Comput. Sci. Appl. Math. 2019, 5, 48. [Google Scholar] [CrossRef]
- Erpul, G.; Norton, L.D.; Gabriels, D. The effect of wind on raindrop impact and rainsplash detachment. Trans. Am. Soc. Agric. Eng. 2003, 46, 51–62. [Google Scholar] [CrossRef]
- Nikahd, A.; Hashim, M.; Nazemosadat, M.J. A Review of Uncertainty Sources on Weather Ground-Based Radar for Rainfall Estimation. Appl. Mech. Mater. 2016, 818, 254–271. [Google Scholar] [CrossRef]
- Nanding, N.; Rico-Ramirez, M.A. Precipitation Measurement with Weather Radars. In Handbook of Environmental Chemistry; Springer Science and Business Media Deutschland GmbH: Berlin/Heidelberg, Germany, 2021; Volume 102, pp. 235–258. [Google Scholar] [CrossRef]
- Gires, A.; Tchiguirinskaia, I.; Schertzer, D.; Schellart, A.; Berne, A.; Lovejoy, S. Influence of Small Scale Rainfall Variability on Standard Comparison Tools between Radar and Rain Gauge Data. Atmos. Res. 2014, 138, 125–138. [Google Scholar] [CrossRef]
- Jensen, N.E.; Pedersen, L. Spatial Variability of Rainfall: Variations within a Single Radar Pixel. Atmos. Res. 2005, 77, 269–277. [Google Scholar] [CrossRef]
- Brandes, E.A.; Vivekanandan, J.; Wilson, J.W. NOTES AND CORRESPONDENCE A Comparison of Radar Reflectivity Estimates of Rainfall from Collocated Radars. J. Atmos. Ocean Technol. 1998, 16, 1264–1272. [Google Scholar] [CrossRef]
- Sevruk, B. Adjustment of tipping-bucket precipitation gauge measurements. Atmos. Res. 1996, 42, 237–246. [Google Scholar] [CrossRef]
- Piccolo, F.; Chirico, G.B. Sampling Errors in Rainfall Measurements by Weather Radar. Adv. Geosci. 2005, 2, 151–155. [Google Scholar] [CrossRef]
- Tukidi. Karakter Curah Hujan di Indonesia. J. Geogr. 2010, 7, 136–145. [Google Scholar] [CrossRef]
- Renggono, F. Analisis Kemunculan Awan Hujan Berdasarkan Jenisnya untuk Mendukung Kegiatan Modifikasi Cuaca. J. Sains Dan Teknol. Modif. Cuaca 2015, 16, 83–89. [Google Scholar] [CrossRef]
- Syafira, S.A.; Syaifullah, M.D.; Renggono, F. High Daily Rainfall-Clouds and Rain Characteristics Based on Micro Rain Radar Data (Case Study: Dramaga Area, Bogor). J. Sains Teknol. Modif. Cuaca 2016, 17, 27. [Google Scholar] [CrossRef]
- Badron, K.; Ismail, F.; Asnawi, A.L.; Malik, N.F.A.; Abidin, S.Z.; Dzulkifly, S. Classification of Precipitation Types Detected in Malaysia. Int. J. Inf. Commun. Eng. 2014, 8, 1388–1392. [Google Scholar]
- Alfahmi, F.; Boer, R.; Hidayat, R.; Perdinan; Sopaheluwakan, A. The Impact of Concave Coastline on Rainfall Offshore Distribution over Indonesian Maritime Continent. Sci. World J. 2019, 2019, 6839012. [Google Scholar] [CrossRef] [PubMed]
- Hunter, S.M. WSR-88D Radar Rainfall Estimation: Capabilities, Limitations and Potential Improvements. Natl. Weather Dig. 1996, 20, 26–38. [Google Scholar]
- Einfalt, T.; Jessen, M.; Mehlig, B. Comparison of radar and raingauge measurements during heavy rainfall. Water Sci. Technol. 2005, 51, 195–201. [Google Scholar] [CrossRef] [PubMed]
- Sideris, I.V.; Gabella, M.; Erdin, R.; Germann, U. Real-time radar-rain-gauge merging using spatio-temporal co-kriging with external drift in the alpine terrain of Switzerland. Q. J. R. Meteorol. Soc. 2014, 140, 1097–1111. [Google Scholar] [CrossRef]
- Thorndahl, S.; Nielsen, J.E.; Rasmussen, M.R. Bias adjustment and advection interpolation of long-term high resolution radar rainfall series. J. Hydrol. 2014, 508, 214–226. [Google Scholar] [CrossRef]
- MacNell, N.; Feinstein, L.; Wilkerson, J.; Salo, M.; Molsberry, S.A.; Fessler, M.B.; Thorne, P.S.; Motsinger-Reif, A.A.; Zeldin, D.C. Implementing machine learning methods with complex survey data: Lessons learned on the impacts of accounting sampling weights in gradient boosting. PLoS ONE 2023, 18, e0280387. [Google Scholar] [CrossRef]
Disclaimer/Publisher’s Note: The statements, opinions and data contained in all publications are solely those of the individual author(s) and contributor(s) and not of MDPI and/or the editor(s). MDPI and/or the editor(s) disclaim responsibility for any injury to people or property resulting from any ideas, methods, instructions or products referred to in the content. |
© 2024 by the authors. Licensee MDPI, Basel, Switzerland. This article is an open access article distributed under the terms and conditions of the Creative Commons Attribution (CC BY) license (https://creativecommons.org/licenses/by/4.0/).