Article

Seasonal Patterns and Allergenicity of Casuarina Pollen in Sydney, Australia: Insights from 10 Years of Monitoring and Skin Testing

by
Edwin R. Lampugnani
1,2,3,*,
Jeremy D. Silver
4,
Pamela Burton
5,
Usha Nattala
1,6 and
Constance H. Katelaris
5,7,*
1
AirHealth Pty Ltd., Parkville, VIC 3052, Australia
2
Menzies Institute for Medical Research, College of Health and Medicine, University of Tasmania, Hobart, TAS 7001, Australia
3
School of Health Sciences, University of Melbourne, Parkville, VIC 3010, Australia
4
Statistical Consulting Centre, School of Mathematics and Statistics, The University of Melbourne, Parkville, VIC 3010, Australia
5
Immunology & Allergy Unit Campbelltown Hospital, Campbelltown, NSW 2560, Australia
6
Melbourne Data Analytics Platform, University of Melbourne, Parkville, VIC 3010, Australia
7
School of Medicine, Western Sydney University, Penrith, NSW 2751, Australia
*
Authors to whom correspondence should be addressed.
Atmosphere 2024, 15(6), 719; https://doi.org/10.3390/atmos15060719
Submission received: 8 May 2024 / Revised: 31 May 2024 / Accepted: 5 June 2024 / Published: 15 June 2024
(This article belongs to the Special Issue Real-Time Detection, Discrimination, and Forecasting of Bioaerosols)

Abstract

:
Casuarina (Australian pine, She-oak) is native to Australia and South East Asia and is known for its abundant wind-borne pollen. Despite not being considered a major aeroallergen, some patients report respiratory symptoms upon exposure, with positive skin prick tests (SPT) to Casuarina pollen extract. This study investigates Casuarina pollen dispersal patterns in Sydney, Australia, over a 10-year period, from 2008 to 2018, revealing a bimodal distribution of pollen from September to October (southern hemisphere spring) and February to March (mid-late summer). Analysis of historical SPT data shows 20% of individuals with respiratory allergies reacting positively to Casuarina pollen extract, with almost 90% of these also reacting to grass pollen, suggesting potential cross-reactivity. Notably, there are no exclusive reactions to Casuarina pollen. Understanding the prolonged pollen season underscores the importance of year-round monitoring for accurate characterization. Currently lacking are commercially available skin test extracts or specific IgE assays for Casuarina sensitization, necessitating challenge studies to confirm clinical symptoms directly attributable to Casuarina pollen. By elucidating the seasonal dynamics and meteorological drivers of Casuarina pollen dispersion, alongside the potential allergenicity suggested by skin prick tests, this study paves the way for improved management of Casuarina-related allergies and highlights the critical need for further research on native Australian plant allergens.

1. Introduction

Allergic rhinitis, commonly known as hay fever, and asthma are chronic inflammatory airway diseases affecting millions of people worldwide. These conditions significantly impact quality of life, leading to lost productivity due to missed work or school days, increased healthcare costs associated with medication and doctor visits, and sleep disturbances caused by nasal congestion and difficulty breathing [1]. Effective management of allergic rhinitis and asthma hinges on identifying and avoiding triggers that provoke symptoms. Wind-pollinated trees emerge as significant contributors to the burden of allergic respiratory diseases. Unlike animal-pollinated plants that rely on insects for pollen dispersal, wind-pollinated trees, such as Casuarina (commonly known as Australian Pine or She-Oak), produce large quantities of lightweight pollen specifically designed for long-distance travel by wind currents.
While the allergenicity of wind-pollinated trees is well-established, the specific types of trees responsible for triggering allergic reactions vary depending on the geographical location and the predominant local flora. For instance, in regions such as Europe, India and USA, where Casuarina has been introduced, there is compelling evidence linking Casuarina pollen exposure to allergic respiratory symptoms, thus emphasising its role as a significant aeroallergen. However, understanding the allergenicity of Casuarina requires a deeper exploration of its characteristics and prevalence in native habitats.
Casuarina belongs to the family Casuarinaceae. It is a genus of approximately 60 tree species native to Australia, Southeast Asia, and the islands of the West Pacific Ocean [2]. They have a reputation for being low-maintenance, drought-resistant and having a tolerance for tough conditions and, as such, they have been extensively utilised in landscaping. They are slender trees usually 10–20 m in height but can grow up to 35 m in height. They have grey-green to dark green needle-like foliage (Figure 1a). The flowers are borne in catkins, with staminate flowers consisting of one stamen and subtending scales (Figure 1b), whereas pistillate flowers have two carpels [3]. Casuarinaceae pollen grains exhibit a distinctive morphology characterized by a rounded-triangular shape when viewed from the polar perspective and a transversally elliptic shape when observed from the equatorial view [4]. They are triporate with an equatorial diameter of ~27–35 μm.
Research on the contribution of Casuarina pollen to allergic rhinitis and asthma in Australia remains limited. Existing studies primarily rely on anecdotal evidence of respiratory symptoms experienced upon exposure to Casuarina [5]. The limited research focus on Casuarina as a potential aeroallergen may be attributed, in part, to the historical emphasis on studying introduced plant species as the primary source of allergens in Australia. Additionally, the lack of readily available and standardized Casuarina pollen extract for skin prick testing has hindered comprehensive investigations.
This study fills a notable gap in the existing literature by providing a comprehensive analysis of Casuarina pollen distribution and allergenicity in the Sydney region over a 10-year period. By characterizing the seasonal patterns of Casuarina pollen and investigating skin test reactivity to Casuarina pollen extract in a large sample of patients attending an allergy clinic, we offer unique insights into the prevalence of sensitization to Casuarina pollen among individuals with respiratory allergies. Additionally, our examination of the environmental factors influencing Casuarina pollen concentration in the air provides valuable insights into the dynamics of airborne pollen exposure in urban environments. Through these efforts, we contribute significantly to the understanding of pollen allergies and their management, particularly in regions where Casuarina species are prevalent.

2. Materials and Methods

2.1. Study Sites and Airborne Pollen Collection

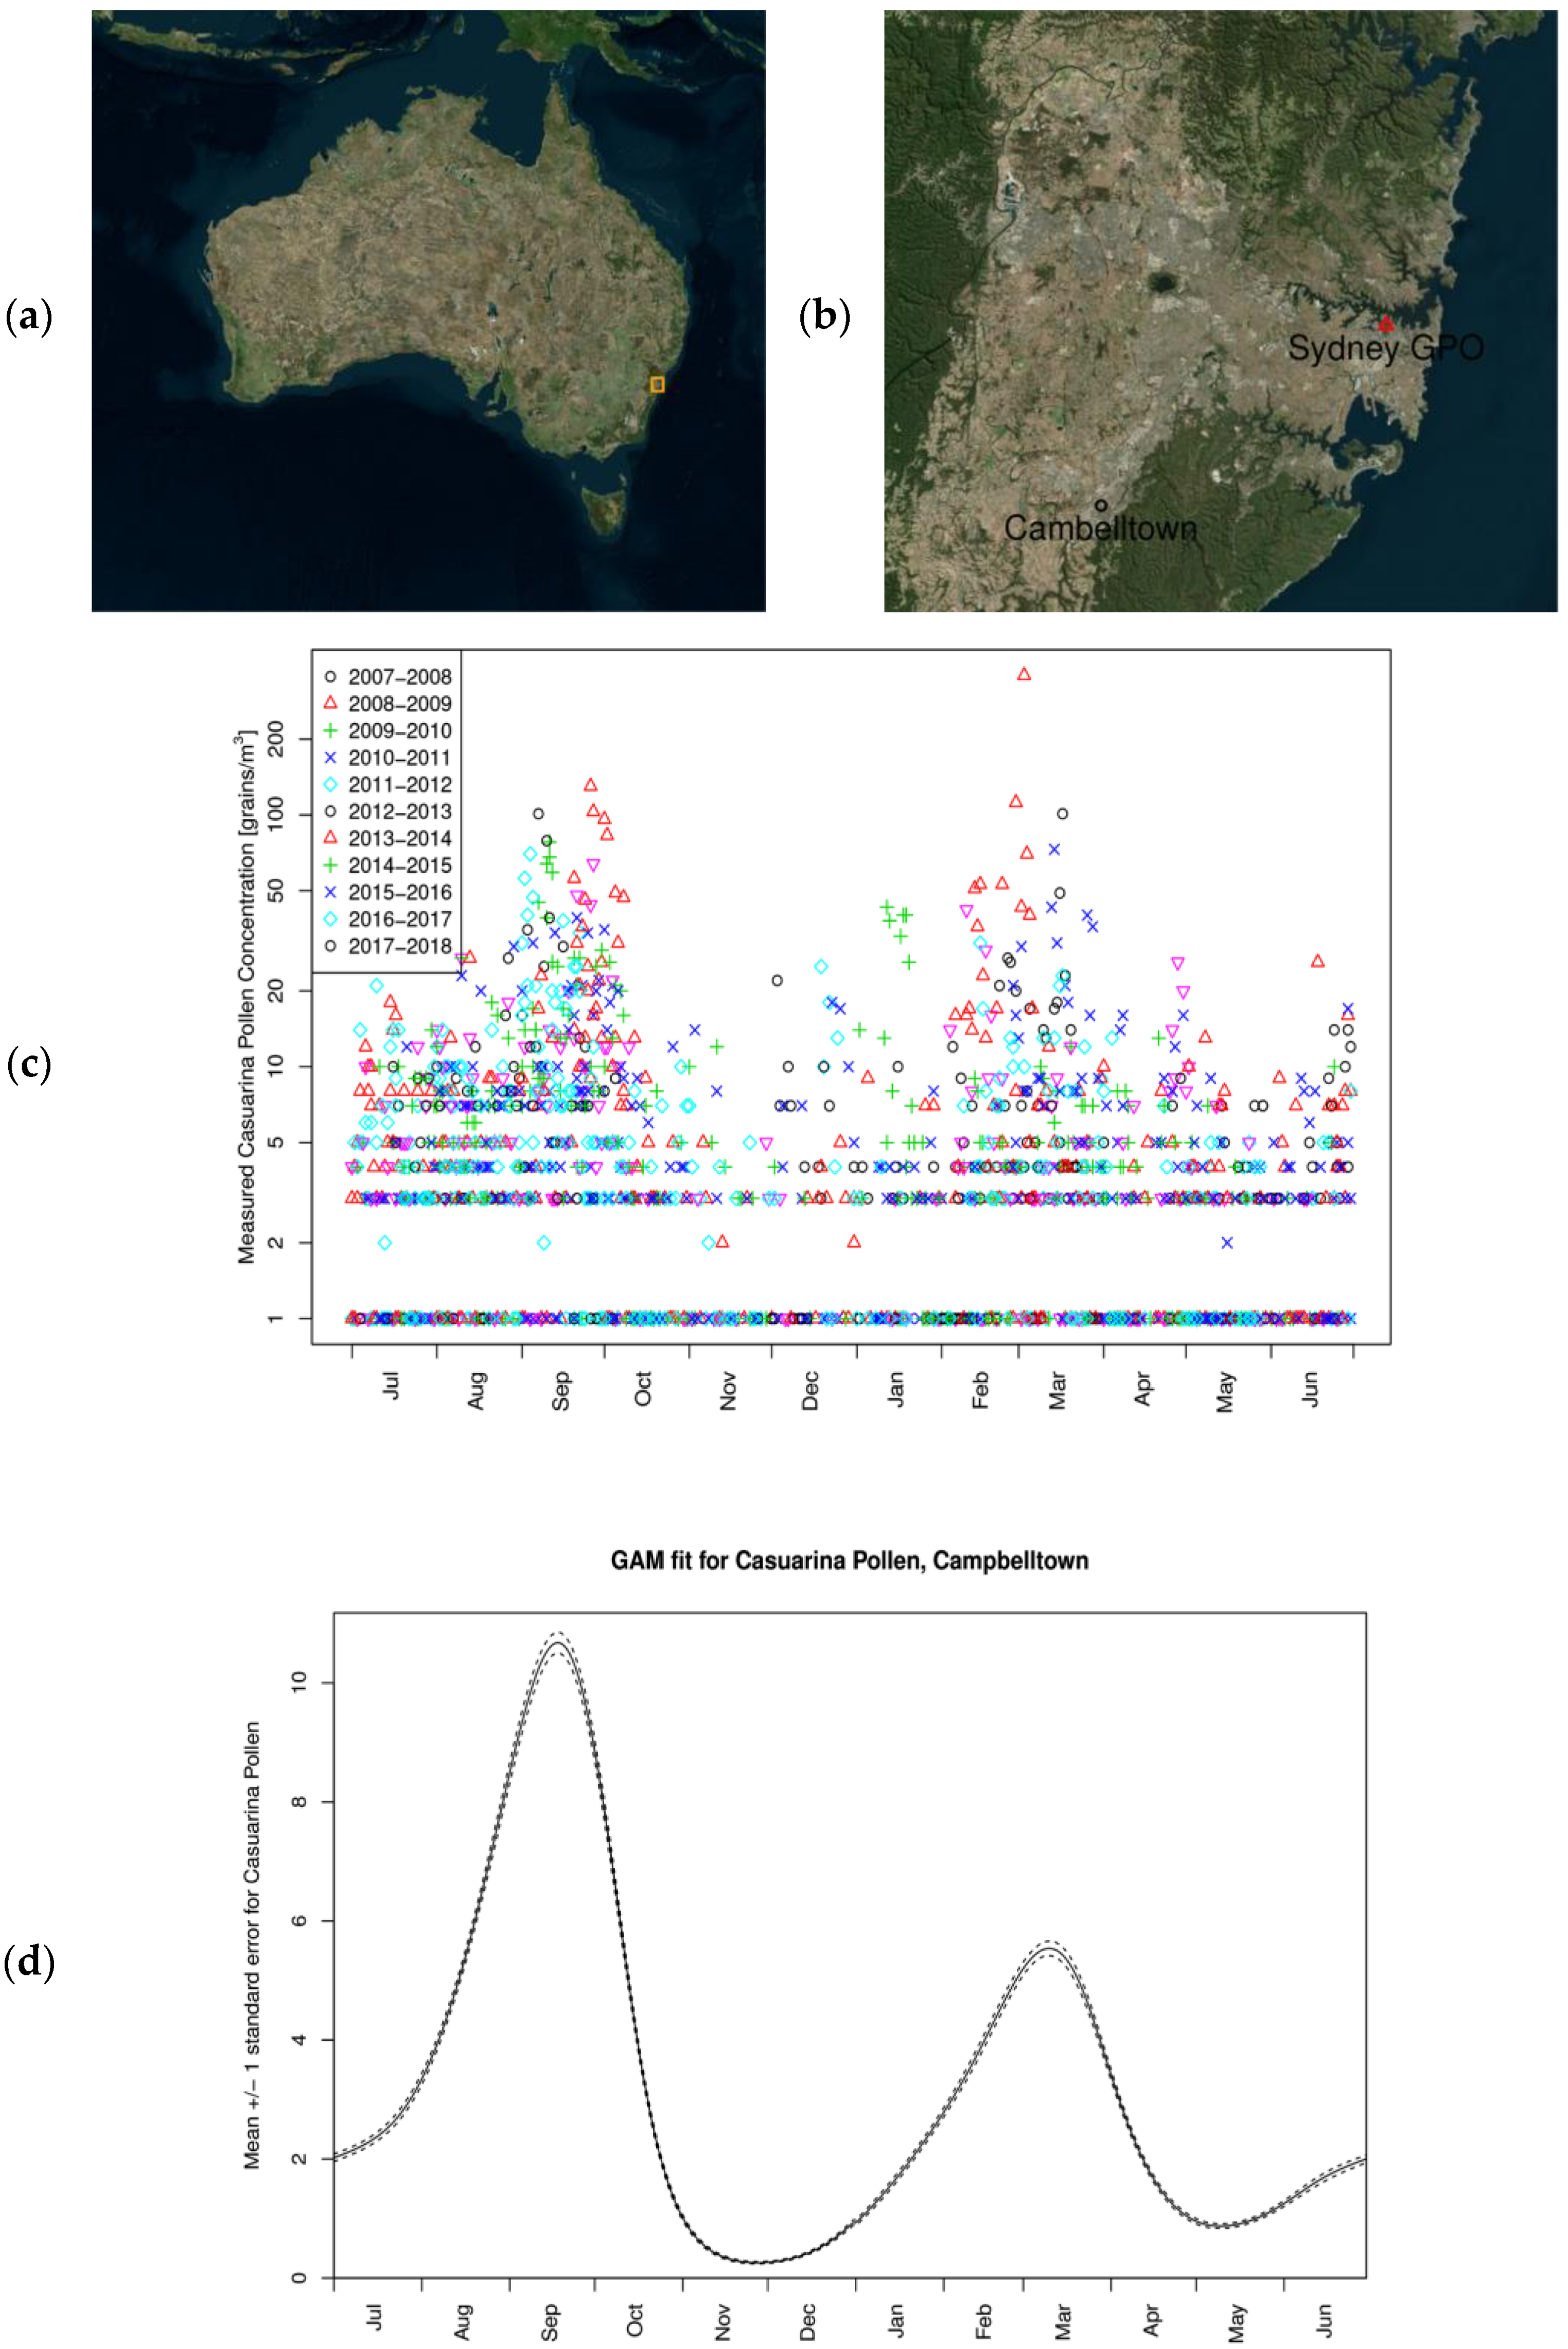
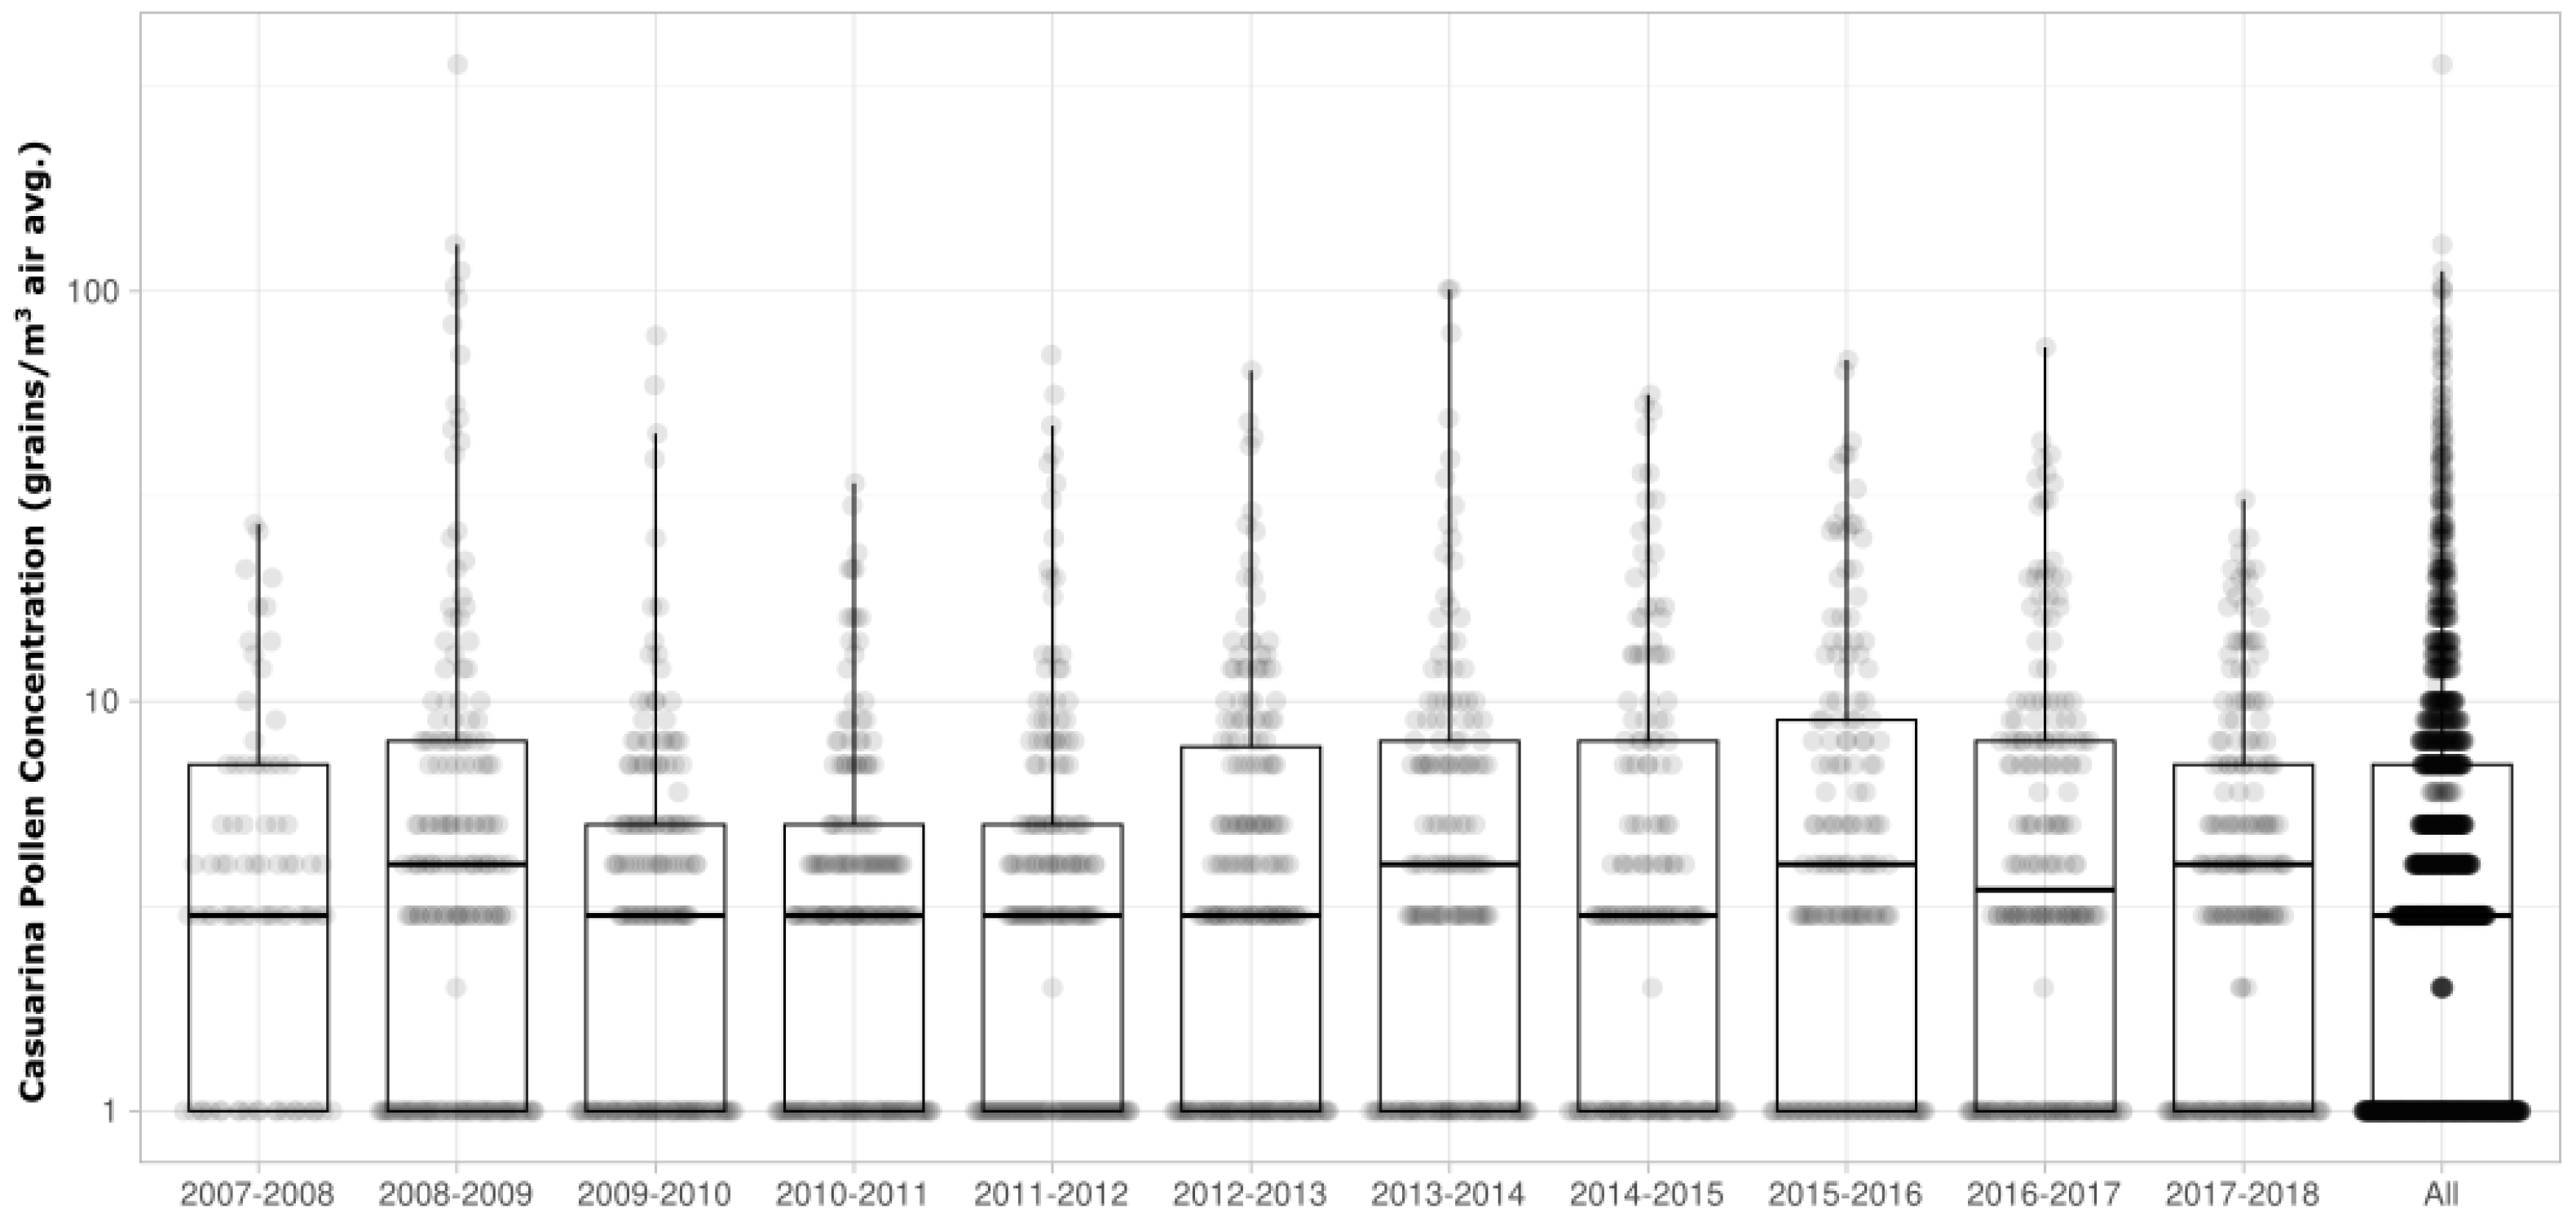
Casuarina pollen counts were performed over a 10 year period from 2008 to 2018 using a Burkard volumetric trap (Burkard Manufacturing Co., Ltd., Rickmansworth, Hertfordshire, UK) following established methods [6]. The sampling site was located 20 m above ground level, on the roof of Campbelltown Hospital in South West Sydney (approximately 45 km from Sydney’s General Post Office) at latitude 34.0779° S, longitude 150.8063° E. The sampling location is shown in 2a-b and full metadata for the pollen monitoring site is published on the Australian National Environmental Monitoring Sites Register. The sampler was calibrated to sample air at 10 litres/minute, and each sampling period was for 24 h in the spring and summer and over a seven day period, using the Burkard drum for the remainder of the year. Data are expressed as the average concentration of pollen grains per cubic meter over a 24 h period beginning at 8 AM. Summary data of each pollen season are made available in Figure 2 and Figure 3 and Supplementary Tables S1–S3.

2.2. Environmental Variables

Half-hourly weather variables were taken from the Australian Bureau of Meteorology’s (BoM) automatic weather station at Mt Annan, Cambelltown (latitude 34.06° S, longitude 150.77° E, 3.8 km from Cambelltown Hospital), and values were averaged over the same 24 h period as the pollen samples, (apart from the precipitation, which was the daily total across the same 24 h period). To estimate the daily mean wind direction, the wind-vector at each half hour was decomposed into its north–south and east–west components; these were then averaged to generate mean daily wind components, from which the direction was calculated. The seasonal patterns in the weather at the site are described in Supplementary Figures S1 and S2 (Supplementary Materials). While atmospheric transport of dust and pollen is often enhanced under common meteorological conditions (i.e., dry, gusty weather), leading some researchers to investigate whether dust plays a role in pollen transportation [7], detailed data on dust loading and dust storm events during the study period were not available for inclusion in this investigation.

2.3. Skin Prick Test Data

De-identified skin prick test results from 400 consecutive patients presenting with respiratory symptoms to a specialist public hospital allergy clinic from 2002 to 2005 were tabulated and patterns of pollen allergen reactivity examined. Skin prick tests were performed according to the recommendations of the Australasian Society of Allergy and Clinical Immunology (ASCIA Skin Test manual). Pollen allergens tested were chosen on the basis of their frequency of pollen detection in pollen surveys in this region. All allergen extracts were obtained from Hollister-Stier (Spokane, WA, USA). During the period from 2002 to 2005, a skin testing extract specifically for Casuarina pollen was commercially available and utilized in Australia for diagnostic purposes in allergy clinics. This availability enabled the comprehensive assessment of patient reactivity to Casuarina pollen. However, it is important to note that after this period, the supply of this particular skin testing extract ceased, resulting in a discontinuation of the ability to conduct skin prick tests specifically for Casuarina pollen sensitization. Histamine dichloride (10 mg/mL) was used as a positive control, while saline buffer/50% glycerol was used as a negative control. A positive skin test was defined as a wheal of 3 mm in the presence of the negative control.

2.4. Statistical Analysis

The distribution across the year of Casuarina pollen counts and other environmental variables were graphed to illustrate the seasonal cycles of these variables (Figure 2c). The seasonal cycle of Casuarina counts was modelled using a generalised additive model (GAM) as a nonlinear function of the day-of-year, enforcing a cyclical relationship across the start and end of the year. In results not presented here, additional weather-related variables were added to the model through forward variable-selection; however, the resulting regression models proved to have lower correlation with observations than the previous day’s Casuarina pollen count (this ‘persistence’ forecast is often used as a baseline for model verification); these models also showed little skill in predicting the onset and peak of the Casuarina pollen season. One reason for the poor skill of the model is that it assumed a fixed seasonal profile; it can be seen (Supplementary Tables S2 and S3 and Supplementary Figures S3 and S4) that the timing, magnitude, and duration of the peaks in the pollen time-series varied substantially from year to year. As such, rather than focus on the performance of these models, we will examine how the different weather variables related to the variance are not explained by the day-of-year. We will also consider what factors may control the characteristics (timing of onset, duration, and magnitude) of the Casuarina pollen season.
To assess which weather variables were important, we first fitted a Generalised Additive Model (GAM) with a negative-binomial exponential family (appropriate for integer-valued response variables, such as the pollen counts). The ‘residuals’ from this model (i.e., the observed values minus the corresponding predictions from the GAM) were then compared with a range of weather variables, assessing the Pearson correlation. These correlations were tested from being different to zero using Fisher’s Z-transformation. The meteorological variables considered were mean daily temperature, maximum daily temperature, minimum daily temperature, daily mean relative humidity, total daily precipitation, daily mean wind-speed, daily mean east–west wind-speed, and daily mean north–south wind speed. This was carried out in order to assess the relationships between these various meteorological parameters and the residuals of Casuarina pollen counts not explained by the seasonal cycle. These coefficients were chosen to quantify the strength and direction of linear relationships between variables.
Characteristics describing the amount of Casuarina pollen detected for each full 12-month period are presented in Supplementary Table S1, while characteristics for each mode within the bimodal distribution are described in Supplementary Tables S2 and S3. The 12-month period spanned 1 July of one year to 30 June the following year; this was divided into two Casuarina pollen ‘subseasons’: from 1 July to 31 December (the ‘JtD subseason’) and from 1 January to 30 June (the ‘JtJ subseason’). For the 12-month season, we calculate the mean, maximum, and standard deviation of the daily Casuarina pollen count as well as the number of ‘low’, ‘moderate’, or ‘high’ Casuarina pollen days (<20 grains/m3, 20–49 grains/m3, or >50 grains/m3, respectively, following the methods describer in [8]). For each subseason, we additionally estimate the timing of the ‘start’, ‘middle’, and ‘end’ of the subseason (the date at which the 5%, 10%, 50%, 90%, and 95% of the subseason’s cumulative count was achieved), as well as the duration of the subseason (the number of days between attaining the 5% to the 95% cumulative count, or 10% to 90%).
To investigate what may be controlling the characteristics of the Casuarina pollen season, we calculated several statistics relating to the local climate. These were computed separately for the two peak Casuarina subseasons. The ‘timing of onset’ of the peak Casuarina pollen subseason was taken to be the average day-of-year when 25% of the cumulative count in the subseason was achieved. The ‘duration’ of the subseason was the average time (in days) when 25% and 75% of the cumulative count in the JtD or JtJ season was achieved. The ‘magnitude’ of the pollen subseason was quantified in two ways, either as the mean pollen count over the full 6-month subseason or as the sum of the pollen count in excess of 20 (i.e., days with 17 and 43 grains/m3 would contribute 0 and 23 to this sum, respectively).
Information about the weather leading up to the peaks of the subseasons was subsequently compared with the aforementioned characteristics of the corresponding pollen subseason. The characteristics for the JtD subseason were compared with weather data from 1 July to 15 September, and the patterns found in the JtJ subseason were compared with weather data between 1 January and 15 March. We calculated the mean temperature (Tmean), the excess degree days above 5, 10, or 20 °C (T5, T10, T20), and the total rainfall (Rtot). The pollen seasonal statistics and the climate statistics were compared over the 11 years, with the relationship quantified with the Pearson correlation (Table 1). We did not take further steps towards modelling the seasonal characteristics, given that, looking at it in this manner, each pollen subseason (with up to 184 counts) is compressed into a single datum, meaning that at most 11 data points are available for modelling each characteristic of the pollen season. In this light, the limited amount of data allows some exploratory data analysis but is insufficient for a more detailed modelling exercise.
The R statistical computing environment was used for all computations (R Core Team, 2015), and the R package mgcv was used to fit and apply the GAMs [9]). Box plots were created using the PlotsOfData web tool [10].

3. Results

3.1. Casuarina Pollen Monitoring in Campbelltown, Sydney Australia

Figure 3 and Supplementary Tables S1–S3 show summary measures of the Casuarina pollen counts recorded at the study site over a 11 year period. Plots of daily Casuarina counts and 7-day moving averages are presented in Supplementary Figures S3 and S4. Casuarina pollen was detected in the atmosphere throughout the year (Figure 2c). Fitting a GAM to the Casuarina pollen count data showed a bimodal distribution, indicating the presence of two Casuarina pollen seasons—one in austral spring (September to November) and the other in autumn (March–May) (Figure 2d). Details describing the distribution of pollen throughout the year are summarised in Supplementary Tables S1–S3. The spring Casuarina season had a mid-point occurring on the 14th of September on average, with a standard deviation of 8 days. The spring-season generally lasts 82 ± 21 days on average, usually beginning on 29th of July (±9 days). In contrast, the midpoint for the autumn-season occurs on 9th March on average (±20 days) and lasts 104 ± 30 days on average. It is important to point out, however, that the timing, magnitude, and duration of each season varied substantially from year to year. We thus defined the average peak Casuarina pollen subseasons, where 50% of pollen counts were observed, for the spring and the autumn Casuarina pollen season separately. We defined ‘peak-season 1’ (PS1) as occurring on average between 1 July and 15 September and ‘peak-season 2’ (PS2) as occurring on average from 1 January to 15 March.

3.2. Factors Which Modulate Casuarina Pollen Concentration in the Air

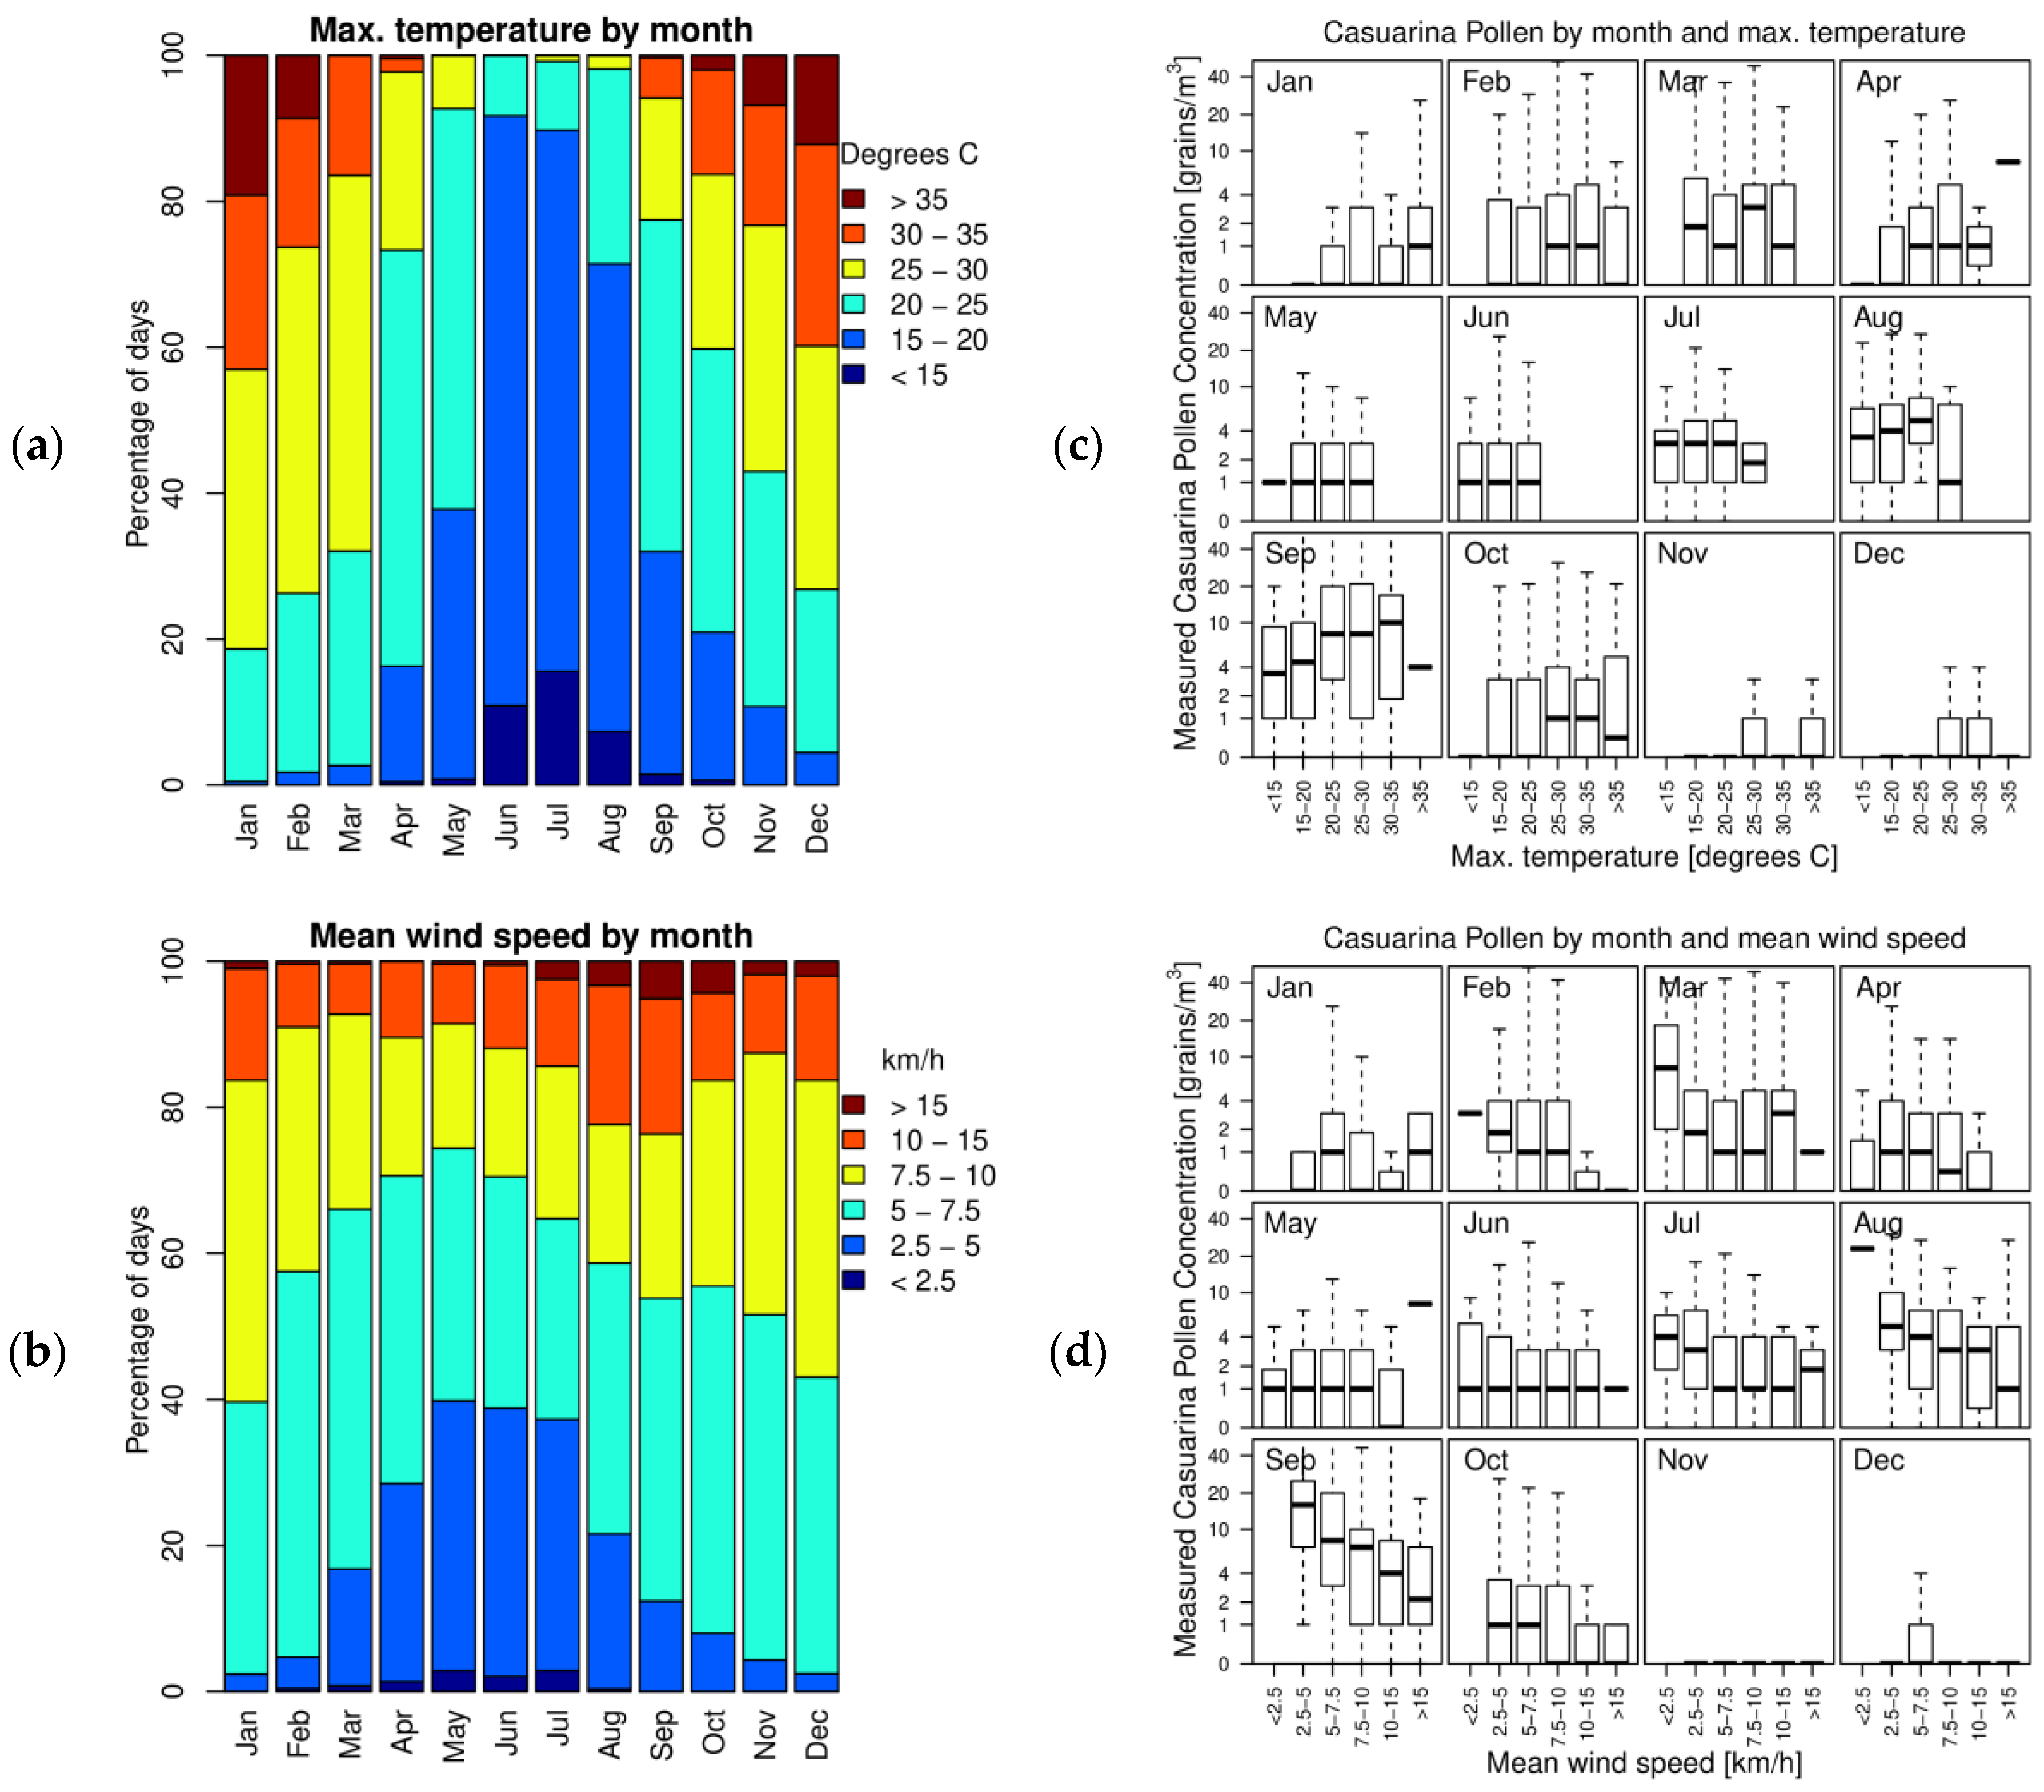
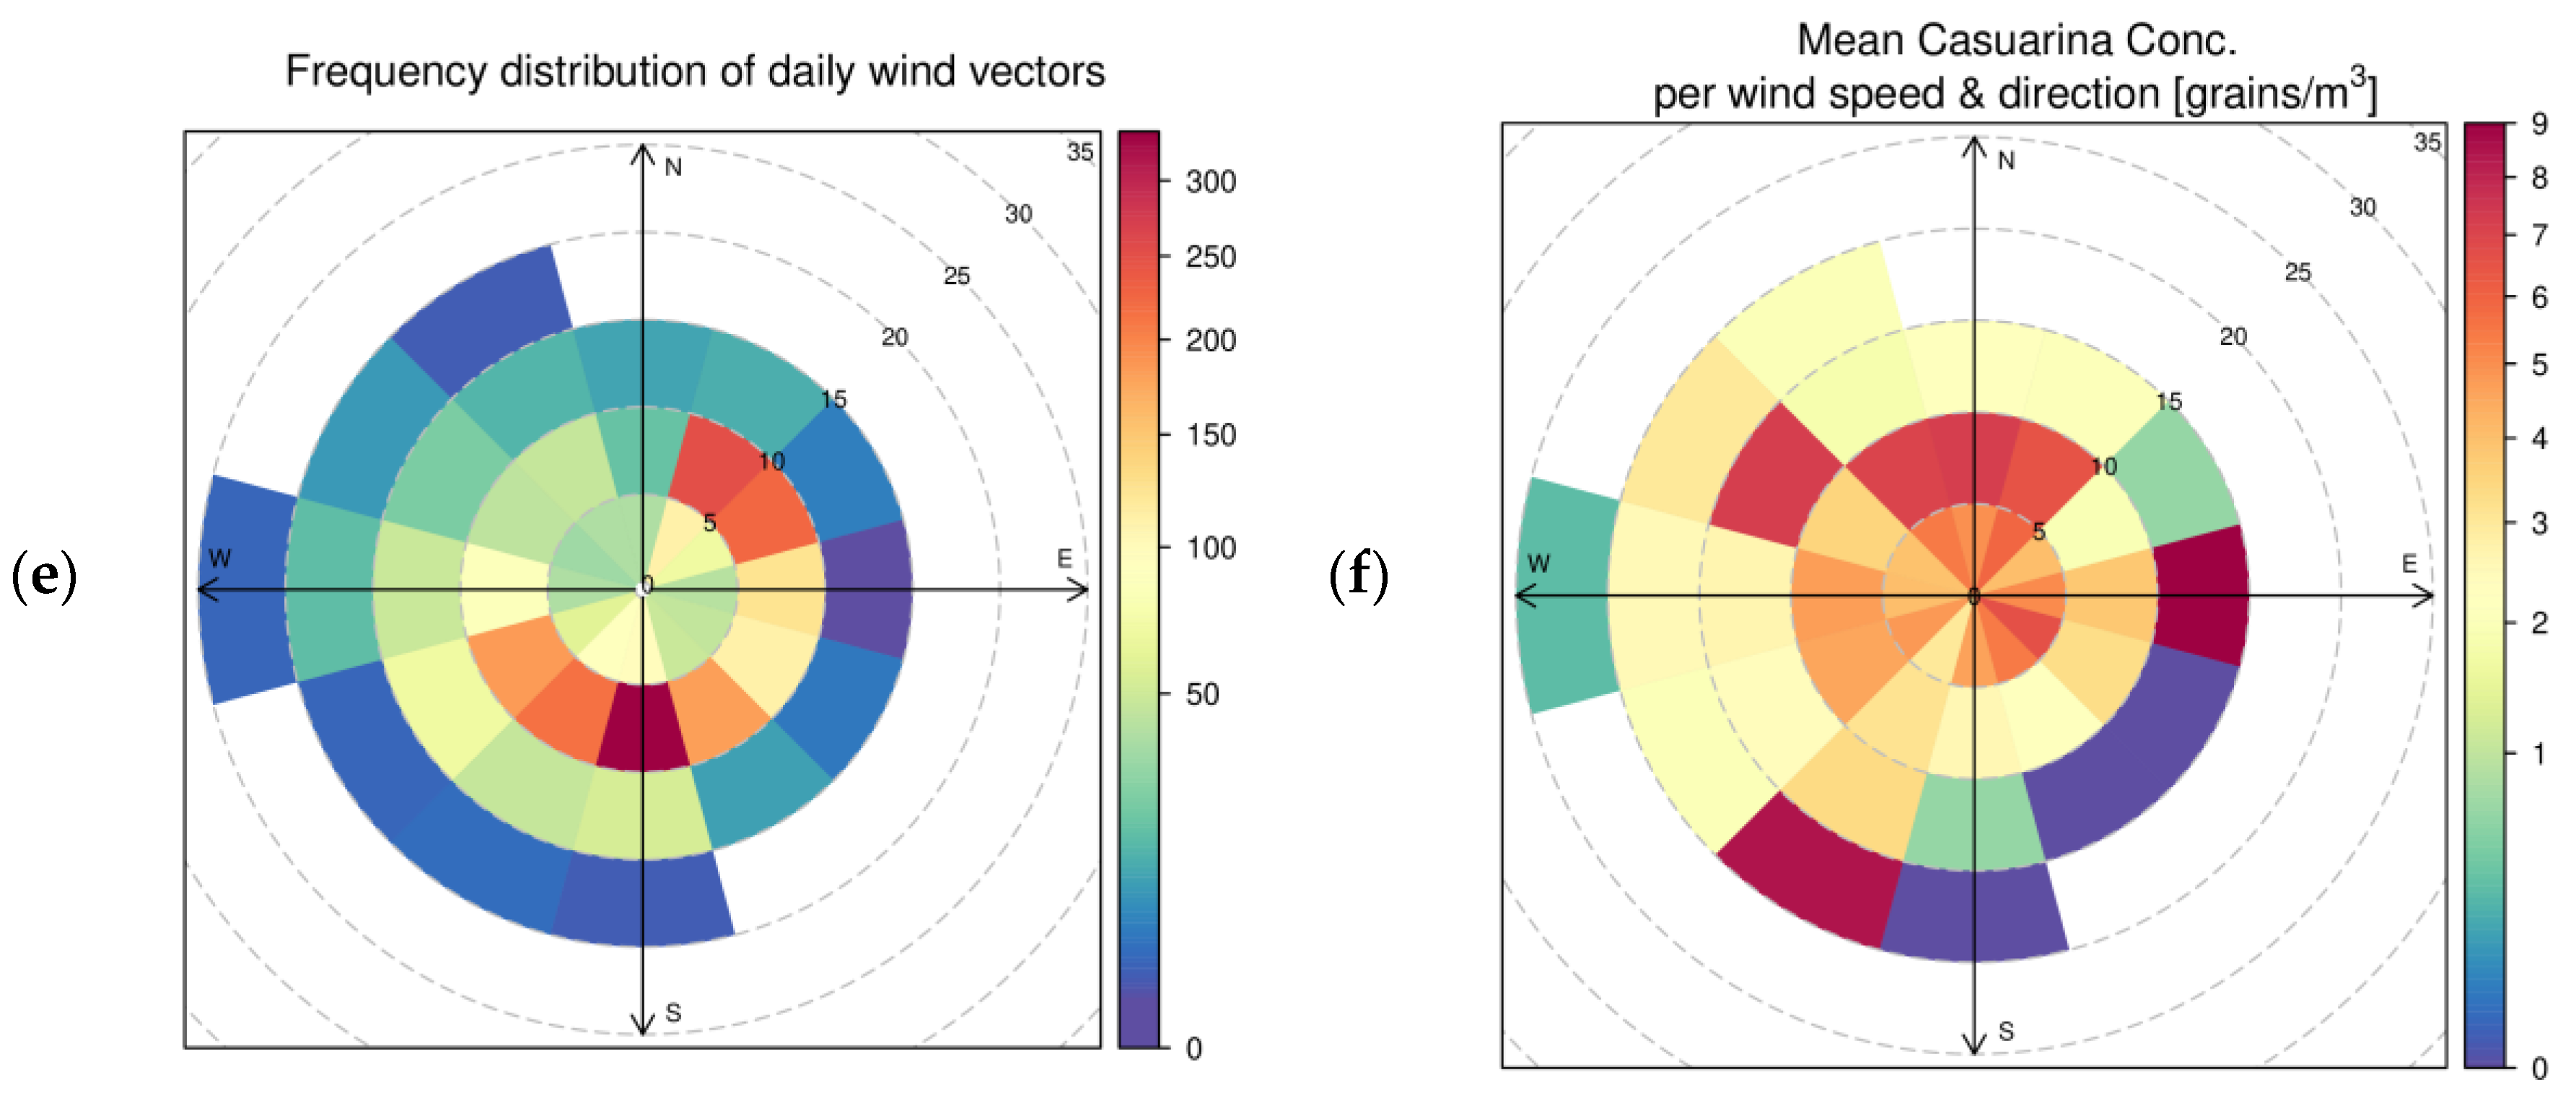
To determine the environmental factors which have the strongest impact on the presence of Casuarina pollen in the air, variation in pollen counts not explained by the seasonal cycle were correlated with meteorological parameters provided by the Australian Bureau of Meteorology. The variables shown to be significantly correlated with these residuals were the mean daily wind-speed (R = −0.0888, 95% CI = [−0.1242, −0.0531], p < 10−5), mean daily east–west wind speed (R = −0.0611, CI = [−0.0968, −0.0253], p < 10−3), mean daily north–south wind speed (R = −0.0878, CI = [−0.1233, −0.0520], p < 10−5), and the maximum daily temperature (R = 0.048, CI = [0.0124, 0.0839], p <0.01). In other words, Casuarina pollen concentration in the air increased with maximum temperature and decreased with total wind speed. These relationships varied across the year and were most apparent in September (Figure 4c,d). The largest counts were most apparent in moderate winds (5–10 km/h) from the north (Figure 4f), suggesting an uneven distribution of Casuarina in the area around the sampling location. Other wind sectors also showed some higher average counts (e.g., stronger winds from the south-west), but these averages were comprised of very few data points (Figure 4e,f).
As noted above, the highest pollen counts were typically recorded during the months of September and March. Daily maximum temperatures in Sydney during September are highly variable and intermediary to the summer and winter temperatures, whereas temperatures in March were slightly cooler than in summer, with fewer days over 30 °C (Figure 4a). Wind speeds in Sydney tend to be lower in winter than summer (Figure 4b), with September recording the highest frequency of very windy days (with mean wind speed in excess of 15 km/h).
Let us now consider how the local climate in the months prior to each Casuarina peak-season affects the characteristics of the observed peak-season (Table 1). The onset of the JtD subseason was positively correlated (R = 0.618) with total rainfall observed across PS1, and the onset of the JtJ subseason showed a weak negative correlation (R = −0.237) with the rainfall across PS1. The duration of the JtD subseason tended to decrease as the excess degree-days above 10 °C (T10) over PS1 (R = −0.495), whereas the duration of the JtJ subseason was positively correlated with the rainfall during PS2 (R = 0.676). The magnitude of the JtD subseason was positively correlated with the excess degree-days above 20 °C (T20) over PS1 (R = 0.6 for both estimates of the magnitude). The magnitude of the JtJ subseason showed different strengths of relationship depending on its definition (either as the mean or the sum in excess of 20 grains/m3), but for both definitions was positively correlated to the mean temperature from PS2 (R = 0.477 for mean pollen counts, and R = 0.273 for the sum of counts in excess of 20) and negatively correlated with total rainfall during this period (R = −0.317 for mean pollen counts, and R = −0.414 for the sum of counts in excess of 20).

3.3. Skin Testing

The results of skin prick tests (SPTs) to various aeroallergens in 400 respiratory allergy patients are shown in Table 2. There were no patients who reacted to Casuarina pollen extract exclusively and all Casuarina pollen reactors reacted to at least two other pollen extracts. In fact, 90% of those with positive SPTs to Casuarina extract reacted to Perennial Rye, Timothy, or Bermuda grass pollen extracts as well.

4. Discussion

Casuarina species, while native to Australia and areas of Southeast Asia, have been introduced to many regions around the world. In our study, we found that the annual cycle in the Casuarina pollen time-series from the Sydney area shows clear bimodal behaviour, with peaks in the Austral spring and autumn. This fits with a previous study in Darwin, in the north of Australia, which reported its occurrence between April and November and peaks around July and September, both during the dry season in this area [11]; the bimodal pattern reported in Darwin is not as pronounced as in Sydney, which may be due to the differences between the climates of the two areas (tropical savanna and humid subtropical, respectively, in the Köppen climate classification; [12]). Another study in northern New South Wales, Australia, found that Casuarina pollen was predominantly detected in the Autumn months [13]. Similarly, a multi-year record of Casuarina pollen counts in Brisbane, Australia, showed no evidence of bimodality [14]. Thus, our analysis has revealed that the distribution of Casuarina concentrations in Sydney’s air are unique to Australia. However, this is not the first report of Casuarina having two flowering seasons. Nagarajan et al. [15] revealed that in Sadiwayal, Pondicherry, and Coimbatore, in southern India, Casuarina pollen counts also had a bimodal distribution, coincident with the onset of the South West and North East monsoons. Our analysis also revealed that the magnitude and duration of each Casuarina pollen season was influenced by the climate in the preceding months. We noted that for the spring sub-season and the climate in the preceding months, wet conditions were associated with a delayed onset, cooler weather was associated with a longer sub-season, and warmer weather was associated with increased pollen counts. Similarly, the autumn sub-season showed the following links to the recent local climate: wetter, cooler conditions were associated with increased duration and lower magnitude of the pollen season. Casuarina pollen concentrations were found to be positively correlated with daily maximum temperature and negatively correlated with wind speed, although these relationships appeared strongest during the peak flowering seasons. Green et al. [16] found that daily airborne Casuarina pollen levels in Brisbane, Australia, were negatively correlated with temperature and precipitation, although wind speed was not considered; the correlations with Casuarina pollen in Brisbane were much stronger than any found in Sydney, suggesting that Casuarina flowering is not driven by temperature alone.
Positive skin tests with Casuarina pollen extract were first recorded by Zivitz in 1942 [17]. A study from Florida (USA) is probably the most definitive example of the demonstration of Casuarina allergenicity. The investigators demonstrated positive nasal and bronchial challenges in a subset of patients with positive skin tests, demonstrating a direct link between pollen exposure and elicitation of allergic symptoms [18]. Agashe et al. [19] also demonstrated positive skin tests in 250 of 264 Indian patients examined in that study. In our surveys, skin test data reveals that 20% of patients presenting with respiratory allergy to a referral allergy clinic have positive skin tests with the previously available skin test reagent. Skin test data alone does not confirm the allergenicity of a particular pollen species as immunological cross reactivity may result in positive skin tests. Indeed, all patients demonstrating a positive skin test to Casuarina pollen extract also reacted to at least one other pollen extract, with 90% reacting to one of our predominant grass species. The skin prick reactivity incidence is of a similar magnitude to a study of 64 subjects (also in Sydney, Australia), which found reactions in 12.5% of subjects [20]. One study of children in Brisbane, Australia, found skin-prick reactions in 21.6% of subjects with asthma and 2.8% of subjects with no asthma [21]. The reactivity to Casuarina pollen among children with asthma reported by Gibbs [21] was similar to grass species commonly reported as allergens (Bahia grass, ryegrass, Johnson Grass, and Bermuda grass).
Seasonal asthma has previously been associated with increased levels of grass pollen [22,23]. The relationship between Casuarina pollen levels and respiratory-related hospital admissions in Australia has not been extensively studied. Nevertheless, two studies focusing on respiratory-related hospital admissions and sales of pharmaceuticals for treatment of hay fever in Darwin, Australia [24,25], found associations between these respiratory health measures and concentrations of some aeroallergens, but not Casuarina pollen. A similar study examining associations between the levels of Casuarina and asthma admissions in children and adolescents in Sydney over a 5 year period also showed no association [26]. One possible explanation why such a relationship could not be observed is the limited distribution of Casuarina trees in the urban landscape and associated surrounds [27]. As such, exposure may be highly dependent to proximity to individual trees or pockets of trees.
As the season is not distinct from that of other plant species, symptom diaries are not useful in differentiating those patients with particular clinical sensitivity to Casuarina. Challenge tests are considered the “gold standard” for demonstrating the direct link between an allergen and clinical symptoms. The only formal challenge studies performed with Casuarina extract were those of Bucholtz et al. [18], where clinical sensitivity was demonstrated in both nasal and bronchial challenge tests in a subset of those showing positive skin tests. No challenge tests have been performed in an Australian population. To fully evaluate cause and effect for Casuarina pollen and hay fever signs and symptoms, individual sampling during the period of symptoms would be ideal.

5. Conclusions

This study provides the most comprehensive analysis to date of Casuarina pollen distribution in a major Australian city (Sydney) over a 10-year period. Our findings reveal a unique bimodal flowering pattern, with distinct peaks in austral spring (September–November) and autumn (March–May). This is an important observation for allergy sufferers and public health professionals, as it allows for targeted monitoring and mitigation strategies during these high-pollen seasons. We further investigated the influence of meteorological factors on airborne Casuarina pollen concentrations. Our analysis identified wind speed, wind direction, temperature, and rainfall as key environmental predictors.
Skin prick tests (SPTs) revealed a 20% positivity rate for Casuarina pollen among our allergy clinic population; the clinical significance of this finding remains to be definitively established. The high prevalence of co-positivity with grass pollen suggests potential cross-reactivity and underscores the need for further research, particularly challenge studies with Australian populations. Little attention has been given to the possibility of allergenicity of native plant species in Australia, partly due to a lack of pollen reagents for in vivo and in vitro testing.
This research sheds new light on the seasonal dynamics and meteorological influences on Casuarina pollen distribution in Sydney. The findings also highlight the need for further investigation into the allergenicity of Casuarina and other native Australian plants, potentially leading to improved allergy management strategies for Australian populations.

Supplementary Materials

The following supporting information can be downloaded at: https://www.mdpi.com/article/10.3390/atmos15060719/s1, Figure S1: Seasonal patterns in temperature at the study site; Figure S2: Seasonal patterns in wind speed and direction at the study site.; Figure S3: Daily Casuarina concentrations at the study site; Figure S4: 7 day moving average of Casuarina pollen concentration at the study site. Table S1: Statistics summarising the Casuarina pollen counts recorded in 11 years of data collection.; Table S2: Statistics summarising the Casuarina pollen counts recorded in the JtD subseason (spanning July to December).; Table S3: Statistics summarising the Casuarina pollen counts recorded in the JtJ subseason (spanning January to June) over 11 years of data collection.

Author Contributions

Conceptualization, E.R.L., J.D.S. and C.H.K.; methodology, E.R.L., J.D.S., U.N., P.B. and C.H.K.; formal analysis, E.R.L., J.D.S., U.N. and C.H.K.; writing original draft preparation, E.R.L., J.D.S. and C.H.K.; writing—review and editing, E.R.L., J.D.S., U.N. and C.H.K.; All authors have read and agreed to the published version of the manuscript.

Funding

This research received no external funding.

Institutional Review Board Statement

Ethical review and approval were waived for this study due to its retrospective nature, involving anonymized and de-identified patient data collected as part of a clinical audit.

Informed Consent Statement

Patient consent was waived for this study because it involved the analysis of anonymized and de-identified data collected during routine clinical audits.

Data Availability Statement

The raw data supporting the conclusions of this article will be made available by the authors on request.

Acknowledgments

Weather data was provided by the Australian Bureau of Meteorology, and we thank Tony Bannister for his help with obtaining it. The authors wish to thank Ed Newbigin for discussions.

Conflicts of Interest

The authors declare no conflicts of interest. The company had no role in the design of the study; in the collection, analysis, or interpretation of data; in the writing of the manuscript; or in the decision to publish the results.

References

  1. Brożek, J.L.; Bousquet, J.; Agache, I.; Agarwal, A.; Bachert, C.; Bosnic-Anticevich, S.; Brignardello-Petersen, R.; Canonica, G.W.; Casale, T.; Chavannes, N.H.; et al. Allergic Rhinitis and its Impact on Asthma (ARIA) guidelines; 2016 revision. J. Allergy Clin. Immunol. 2017, 140, 950–958. [Google Scholar] [CrossRef] [PubMed]
  2. Potgieter, L.J.; Richardson, D.M.; Wilson, J.R.U. Casuarina: Biogeography and ecology of an important tree genus in a changing world. Biol. Invasions 2014, 16, 609–633. [Google Scholar] [CrossRef]
  3. Taylor, E.L.; Taylor, T.N.; Krings, M. Flowering Plants. In Paleobotany, 2nd ed.; Academic Press: Cambridge, MA, USA, 2009. [Google Scholar]
  4. Coetzee, J.A.; Praglowski, J. Pollen evidence for the occurrence of Casuarina and Myrica in the Tertiary of South Africa. Grana 1984, 23, 23–41. [Google Scholar] [CrossRef]
  5. Lambert, K.A.; Katelaris, C.; Burton, P.; Cowie, C.; Lodge, C.; Garden, F.L.; Prendergast, L.A.; Toelle, B.G.; Erbas, B. Tree pollen exposure is associated with reduced lung function in children. Clin. Exp. Allergy 2020, 50, 1176–1183. [Google Scholar] [CrossRef] [PubMed]
  6. Katelaris, C.H.; Burke, T.V. A 7 year pollen profile of major Olympic Games venues in Sydney, Australia. Aerobiologia 2003, 19, 121–124. [Google Scholar] [CrossRef]
  7. Watanabe, M.; Igishi, T.; Burioka, N.; Yamasaki, A.; Kurai, J.; Takeuchi, H.; Sako, T.; Yoshida, A.; Yoneda, K.; Fukuoka, Y.; et al. Pollen Augments the Influence of Desert Dust on Symptoms of Adult Asthma Patients. Allergol. Int. 2011, 60, 517–524. [Google Scholar] [CrossRef] [PubMed]
  8. Ong, E.K.; Singh, M.B.; Knox, R.B. Grass pollen in the atmosphere of Melbourne: Seasonal distribution over nine years. Grana 1995, 34, 58–63. [Google Scholar] [CrossRef]
  9. Wood, S. Generalized Additive Models; Chapman and Hall/CRC: Boca Raton, FL, USA, 2017. [Google Scholar]
  10. Postma, M.; Goedhart, J. PlotsOfData—A web app for visualizing data together with their summaries. PLoS Biol. 2019, 17, e3000202. [Google Scholar] [CrossRef] [PubMed]
  11. Stevenson, J.; Haberle, S.G.; Johnston, F.H.; Bowman, D.M. Seasonal distribution of pollen in the atmosphere of Darwin, tropical Australia: Preliminary results. Grana 2007, 46, 34–42. [Google Scholar] [CrossRef]
  12. Beck, H.E.; Zimmermann, N.E.; McVicar, T.R.; Vergopolan, N.; Berg, A.; Wood, E.F. Publisher Correction: Present and future Köppen-Geiger climate classification maps at 1-km resolution. Sci. Data 2020, 7, 274. [Google Scholar] [CrossRef]
  13. Bass, D.J.; Delpech, V.; Beard, J.; Bass, P.; Walls, R.S. Late summer and fall (March–May) pollen allergy and respiratory disease in Northern New South Wales, Australia. Ann. Allergy Asthma Immunol. 2000, 85, 374–381. [Google Scholar] [CrossRef] [PubMed]
  14. Green, B.J.; Dettmann, M.E.; Rutherford, S.; Simpson, R.W. Airborne pollen of Brisbane, Australia: A five-year record, 1994–1999. Grana 2002, 41, 242–250. [Google Scholar] [CrossRef]
  15. Nagarajan, B.; Nicodemus, A.; Sivakumar, V.; Mandal, A.K.; Kumaravelu, G.; Jayaraj, R.S.C.; Bai, V.N.; Kamalakannan, R. Phenology and Control Pollination Studies in Casuarina equisetifolia Forst. Silvae Genet. 2006, 55, 149–155. [Google Scholar] [CrossRef]
  16. Green, B.J.; Dettmann, M.E.; Yli-Panula, E.; Rutherford, S.; Simpson, R. Aeropalynology of Australian native arboreal species in Brisbane, Australia. Aerobiologia 2004, 20, 43–52. [Google Scholar] [CrossRef]
  17. Zivitz, N. Allergy to Australian pine: A report of three cases. J. Allergy 1942, 13, 314–316. [Google Scholar] [CrossRef]
  18. Bucholtz, G.A.; Hensel, A.E.; Lockey, R.F.; Serbousek, D.; Wunderlin, R.P. Australian pine (Casuarina equisetifolia) pollen as an aeroallergen. Ann. Allergy 1987, 59, 52–56. [Google Scholar] [PubMed]
  19. Agashe, S.N.; Bapat, B.N.; Bapat, H.N.; Philip, E. Aerobiology of Casuarina pollen and its significance as a potential aeroallergen. Aerobiologia 1994, 10, 123–128. [Google Scholar] [CrossRef]
  20. Sercombe, J.K.; Green, B.J.; Rimmer, J.; Burton, P.K.; Katelaris, C.H.; Tovey, E.R. London Plane Tree bioaerosol exposure and allergic sensitization in Sydney, Australia. Ann. Allergy Asthma Immunol. 2011, 107, 493–500. [Google Scholar] [CrossRef] [PubMed]
  21. Gibbs, J.E. Eucalyptus pollen allergy and asthma in children: A cross-sectional study in South-East Queensland, Australia. PLoS ONE 2015, 10, e0126506. [Google Scholar] [CrossRef]
  22. Erbas, B.; Akram, M.; Dharmage, S.C.; Tham, R.; Dennekamp, M.; Newbigin, E.; Taylor, P.; Tang, M.L.K.; Abramson, M.J. The role of seasonal grass pollen on childhood asthma emergency department presentations. Clin. Exp. Allergy 2012, 42, 799–805. [Google Scholar] [CrossRef]
  23. Silver, J.D.; Sutherland, M.F.; Johnston, F.H.; Lampugnani, E.R.; McCarthy, M.A.; Jacobs, S.J.; Pezza, A.B.; Newbigin, E.J. Seasonal asthma in Melbourne, Australia, and some observations on the occurrence of thunderstorm asthma and its predictability. PLoS ONE 2018, 13, e0194929. [Google Scholar] [CrossRef] [PubMed]
  24. Hanigan, I.C.; Johnston, F.H. Respiratory hospital admissions were associated with ambient airborne pollen in Darwin, Australia, 2004–2005. Clin. Exp. Allergy 2007, 37, 1556–1565. [Google Scholar] [CrossRef] [PubMed]
  25. Johnston, F.H.; Hanigan, I.C.; Bowman, D.M. Pollen loads and allergic rhinitis in Darwin, Australia: A potential health outcome of the grass-fire cycle. Ecohealth 2009, 6, 99–108. [Google Scholar] [CrossRef]
  26. Shrestha, S.K.; Katelaris, C.; Dharmage, S.C.; Burton, P.; Vicendese, D.; Tham, R.; Abramson, M.J.; Erbas, B. High ambient levels of grass, weed and other pollen are associated with asthma admissions in children and adolescents: A large 5-year case-crossover study. Clin. Exp. Allergy 2018, 48, 1421–1428. [Google Scholar] [CrossRef] [PubMed]
  27. ABARES, Department of Agriculture, Fisheries and Forestry. Casuarina Forest. 2019. Available online: http://www.agriculture.gov.au/abares/forestsaustralia/profiles/casuarina-forest (accessed on 30 May 2019).
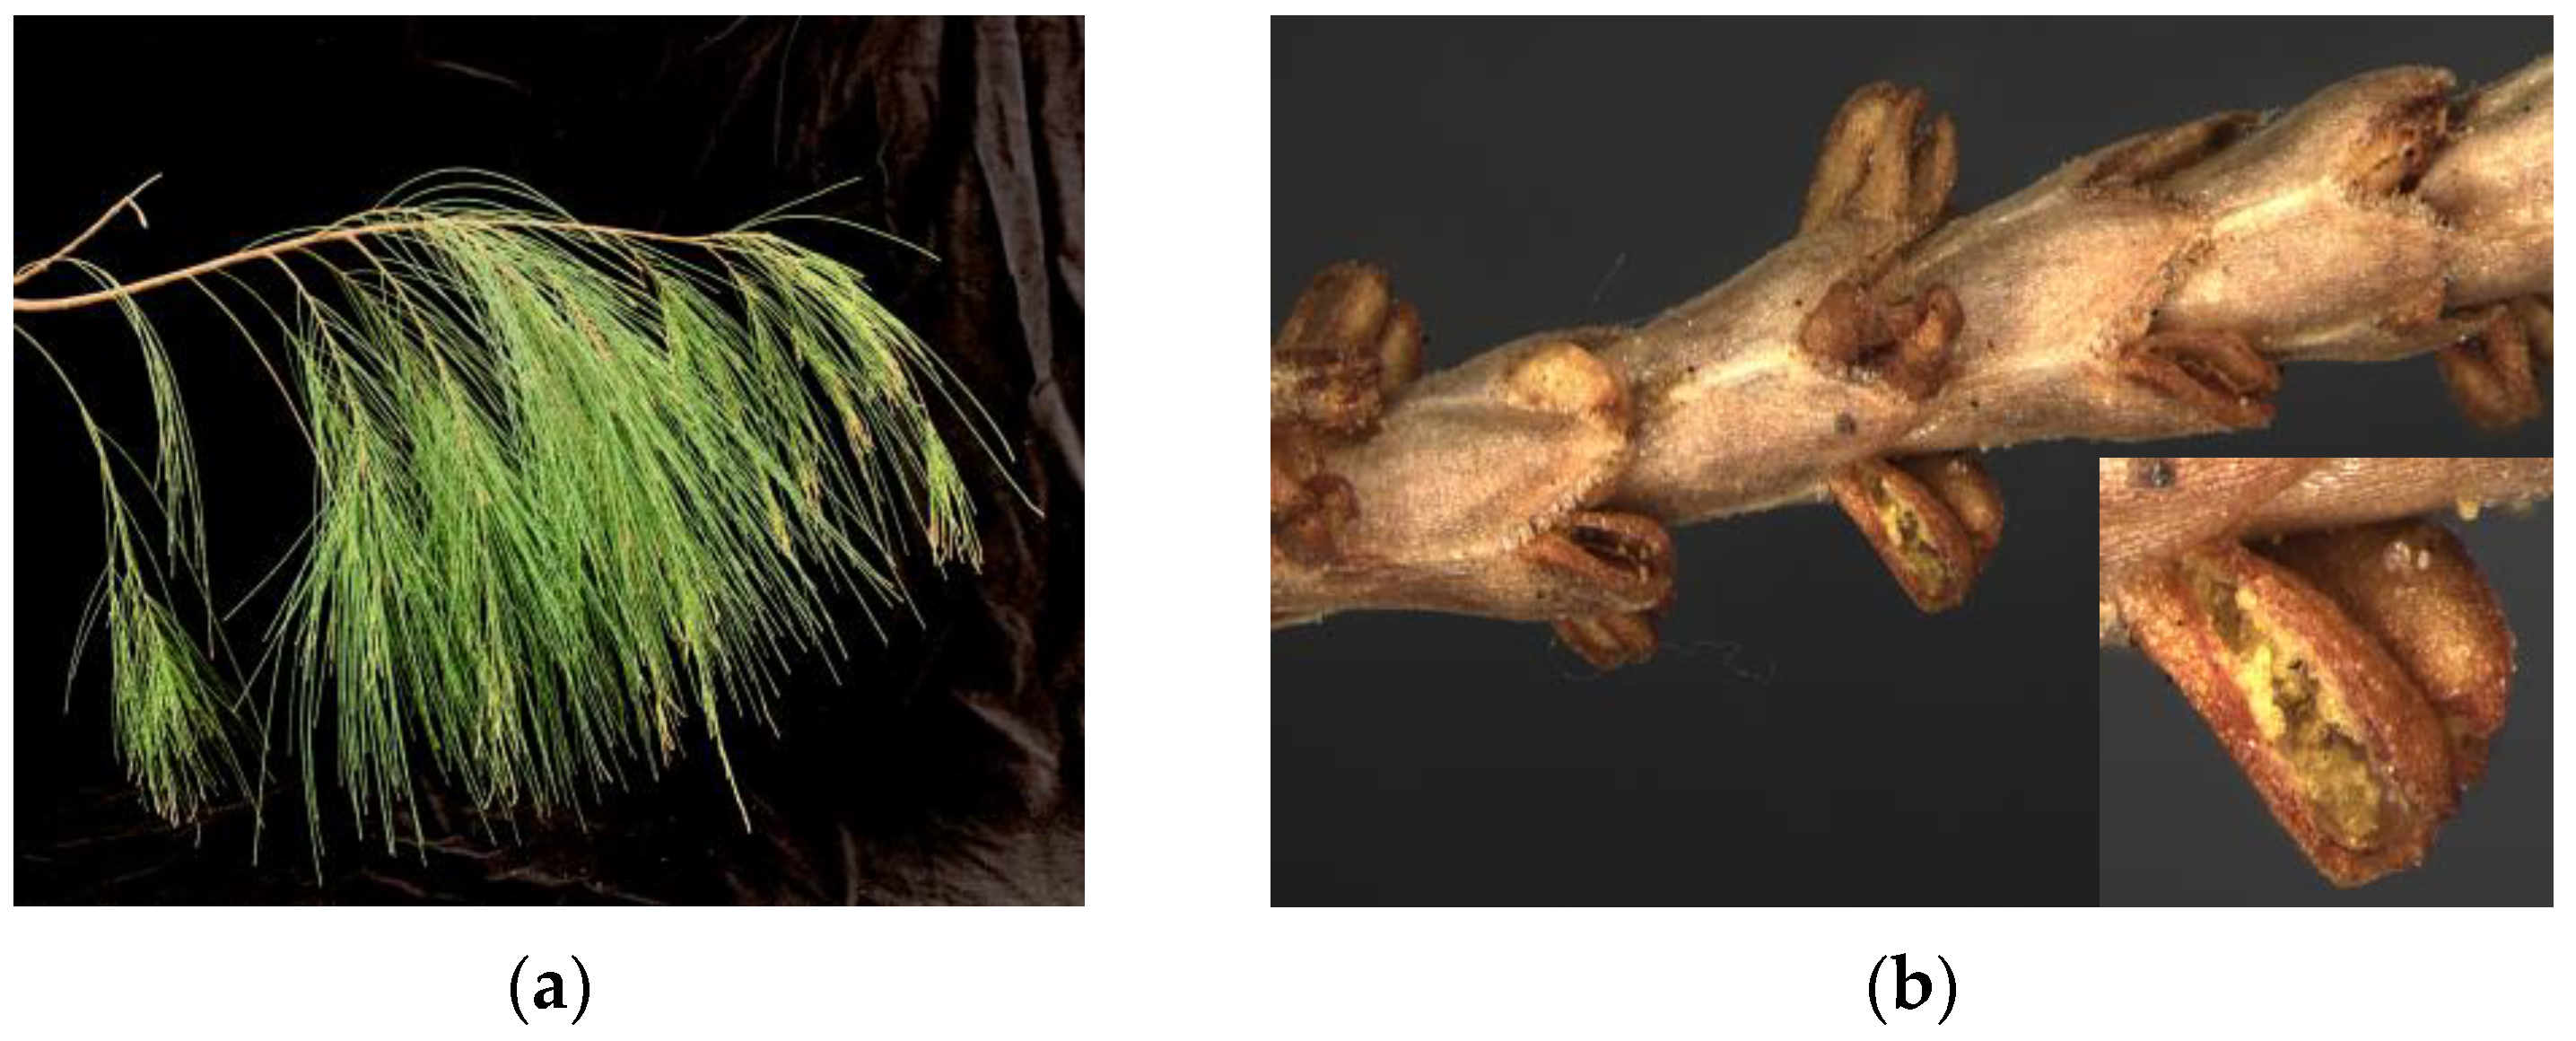
Figure 1. She-oak (Casuarina) foliage and flowers and pollen. (a) Grey-green to dark green needle like foliage of casuarina. (b) Close up of a Casuarina catkin with male flowers with dehisced anthers showing Casuarina pollen (inset).
Atmosphere 15 00719 g001
Figure 2. Study site location and Casuarina pollen seasons. (a) Satellite photo showing Australia and the study site location (orange square). (b) A close up of New South Wales showing the GPO of Sydney (red triangle). Satellite imagery is from Bing maps. (c) Recorded Casuarina concentrations shown for years 2008–2018. (d) GAM fit for Casuarina pollen counts as a function of day-of-year only.
Atmosphere 15 00719 g002
Figure 3. Summary of the Casuarina pollen counts recorded in 11 years of data collection. The summary of the data is shown as a boxplot, with the box indicating the IQR, the whiskers showing the range of values that are within 1.5-IQR, and a horizontal line indicating the median. Raw data is shown as jittered dots. Values are plotted on a log10 scale.
Atmosphere 15 00719 g003
Figure 4. The impact of maximum temperature, wind speed and wind direction on casuarina pollen counts. (a,b) Distribution of (a) maximum temperature and (b) mean wind speed at the study site by month. (c,d) Distribution of Casuarina pollen counts as a function of (c) maximum temperature and (d) mean wind speed at the study site for each month. (e) Frequency distribution of wind rose and (f) mean counts stratified by wind speed and direction.
Atmosphere 15 00719 g004aAtmosphere 15 00719 g004b
Table 1. Pearson correlation coefficients between parameters describing timing of onset, duration, and magnitude of the Casuarina pollen season in Sydney and local climate statistics for the months prior to each subseason (peak-season). Peak-season 1 (PS1) represents the first peak of Casuarina pollen concentration, occurring between 1 July and 15 September, while peak-season 2 (PS2) corresponds to the second peak between 1 January and 15 March. Highlighted cells have the largest absolute correlation for each of the parameters considered. Tmean: mean daily temperature; T5, T10, T20: excess degree days above 5 °C, 10 °C, and 20 °C thresholds, respectively; Rtot: total daily precipitation.
OnsetDurationMagnitude (Mean)Magnitude (Sum over 20)
SubseasonPS1PS2PS1PS2PS1PS2PS1PS2
Tmean0.1860.04−0.45−0.34−0.350.477−0.3730.273
T50.186−0.034−0.45−0.329−0.350.464−0.3730.284
T100.19−0.012−0.495−0.333−0.2540.469−0.3450.281
T20−0.1770.0150.211−0.2950.6050.4230.6010.203
Rtot0.618−0.237−0.0850.676−0.168−0.317−0.012−0.414
Table 2. Skin test results on 400 allergy clinic patients. Skin prick test results with various allergen extracts presented as a percentage of the tested population showing a positive skin test to the individual allergens.
Allergen Tested% Positive
Histamine dichloride (positive control)98.5
Glycerosaline (negative control)0.7
Cat hair28.9
Dog epithelium14.5
Dermatophagoides pteronyssinus72.5
American cockroach 45.5
Penicillium notatum10.7
Aspergillus fumigatus12.6
Alternaria alternata19.3
Cladosporium sp.15.0
White Birch (Betula)20.2
Acacia longifolia20.7
Casuarina19.7
Privet (Ligustrum)23.7
Plane Tree (Platanus)24.3
Perennial rye grass (Lolium perenne)51.7
Timothy (Phleum pratense)51.7
Bermuda (Cynodon dactylon)45.9
Bent (Agrostis)44.2
Orchard (Dactylis)49.1
Bahia (Paspalum notatum)45.8
English Plantain (Plantago lanceolata)38.6
Dock/Sorrell (Rumex)29.1
Disclaimer/Publisher’s Note: The statements, opinions and data contained in all publications are solely those of the individual author(s) and contributor(s) and not of MDPI and/or the editor(s). MDPI and/or the editor(s) disclaim responsibility for any injury to people or property resulting from any ideas, methods, instructions or products referred to in the content.