Abstract
Building materials, such as brick and concrete, are known indoor radon (222Rn) and thoron (220Rn) sources. Most radon and thoron exhalation studies are based on the laboratory testing of pieces and blocks of such materials. To discuss if laboratory findings can be applied to a real-world environment, we conducted intensive in situ exhalation tests on two solid concrete interior walls of an apartment in Japan for over a year. Exhalation rates of radon (JRn) and thoron (JTn) were measured using an accumulation chamber and dedicated monitors, alongside monitoring indoor air temperature (T) and absolute humidity (AHin). There were weak correlations between JRn or JTn and T or AHin at one tested wall, and moderate correlations of JRn and strong correlations of JTn with T or AHin at the other wall, meaning more or less seasonal variations. The findings aligned with previous laboratory experiments on JRn but lacked corresponding data for JTn. Additionally, a moderate or strong correlation between JRn and JTn was observed for both tested walls. Comparison with theoretical calculations revealed a new issue regarding the impact of each process of emanation and migration within concrete pores on radon and thoron exhalation. Overall, this study provides insight into parameterizing radon and thoron source inputs in modeling the spatiotemporal dynamics of indoor radon and thoron.
1. Introduction
Radon (222Rn, half-life 3.82 d) is a naturally occurring radioactive gas that can exist anywhere in the environment and is widely recognized as a risk factor for lung cancer. In recent years, much attention has been paid to thoron (220Rn, half-life 55.6 s), and its measurement techniques, dosimetry approaches, and data accumulation regarding its characteristics have been progressively established [1].
Of the various radon and thoron exposure locations, the most important is the indoor environment from the perspectives of public health and radiation protection. To assess the spatiotemporal dynamics of radon and thoron in dwellings, continuous-measurement-based studies have been conducted in many countries (e.g., [2,3,4]). From generation to exposure, radon and thoron undergo several processes, including (1) emanation within and exhalation from soil, building materials, and water, (2) migration (diffusion and advection through soil and building materials and air exchange (ventilation) between indoor and outdoor environments), and (3) inhalation after disintegrating to decay products. These processes have been mathematically described with parameters related to meteorological conditions, subslab soil, building materials, etc. For better assessment and prediction, it is important to investigate each process and numerically reproduce the measured results (e.g., [2,3,4,5]).
The soil beneath a building is widely considered the most dominant radon source [6,7,8,9]. Conversely, this cannot apply to thoron with a short half-life in any situation or in the case of high elevations of a high-rise building for both radon and thoron. In these cases, building materials used for walls, floors, etc. should be considered as an alternative source. Thus, there are a considerable number of papers discussing radon and thoron exhalation rates in terms of measurement techniques, material types, and meteorological effects. As a result, for example, protocols for measuring radon and thoron exhalation rates have been developed [10,11], and, recently, a database of radon exhalation rates for approximately 2000 samples of building materials used in Europe was created [12].
Most studies are based on laboratory testing with pieces and blocks of building material samples [12,13,14,15,16], probably due to the easy sample handling and controllability of meteorological conditions. Although in situ testing can be useful in observing the exhalation of radon and thoron from walls and floors installed in real-world buildings, any single dataset is merely a snapshot of given samples, times, and environmental conditions. An investigation bridging laboratory and in situ works is desired to discuss if the findings obtained in laboratories can be applied to a real-world environment. In this regard, through numerical computation, Sahoo et al. [17] found that laboratory testing with small samples may overestimate radon exhalation rates compared with in situ testing and then proposed a semi-empirical formula for correction.
To address such research requirements, this study conducted intensive in situ testing of radon and thoron exhalation rates for over a year to collect snapshot data from the same interior walls. The effects of air temperature and humidity and the relationships between radon and thoron exhalation rates were investigated through comparison with a previous laboratory-based study and theoretical calculations. This study will not only contribute to building a bridge between laboratory and in situ test data but also help in considering the input of radon and thoron sources required in modeling the dynamics of indoor radon and thoron concentrations.
2. Materials and Methods
2.1. Testing Location and In Situ Measurement
The exhalation test was conducted from April 2021 to January 2023 in two rooms of a ground-floor apartment of a 5-story housing complex built in 1980 in Okayama, Japan. A solid concrete interior wall in each room was tested, which was installed as the border between the apartment being tested and the next one. One wall will be called “R1W2”, and the other “R2W1.” No inhabitants were living in this apartment during this study.
The radon and thoron exhalation rates from the wall were measured using a so-called accumulation method. The solid concrete wall was covered with an accumulation chamber (hard surface emission chamber; DURRIDGE, USA). This chamber was made of acrylonitrile–butadiene–styrene plastic and had an internal cavity with a radius of 10.8 cm (ra), a depth of 1.27 cm (da), and a partition of size 20 × 1.27 × 1.27 cm3 (Vp); therefore, the internal cavity volume was Va = 433 cm3. Different effective measurement areas (i.e., SRn = = 366 cm2 for radon and STn = Va/da = 341 cm2 for thoron) were applied for calculating radon and thoron exhalation rates, as noted in a previous paper [18]. The gap between the chamber and the wall was filled with clay to suppress the leakage of air containing radon.
Radon and thoron exhaled from the wall were accumulated in the chamber and simultaneously measured using either of the two monitors: a pulsed ionization chamber (AlphaGUARD PQ2000 PRO, SAPHYMO, Frankfurt, Germany) for radon monitoring, and a passivated ion-implanted planar silicon detector with an electrostatic collection of charged alpha emitters (RAD7, DURRIDGE, Billerica, MA, USA) for radon and thoron monitoring (Figure 1a,b). As shown in Figure 1a, a thoron decay chamber was set in the measurement system to prevent thoron from flowing to the monitor (AlphaGUARD) that cannot discriminate radon and thoron. This chamber was simply an airtight acrylic box, and its size was designed so that thoron can remain in it for more than 10 min, corresponding to 10 half-lives, and its activity concentration can be reduced to <1/1000.
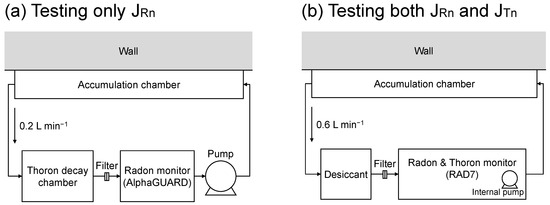
Figure 1.
Schematic representation of radon and thoron exhalation measurement systems. (a) System for testing only the radon exhalation rate using AlphaGUARD. (b) System for testing both radon and thoron exhalation rates using RAD7.
Figure 2 shows typical time plots of radon and thoron activity concentrations, indicating that the time required for equilibrium was more than 10 h for radon and far less than 1 h for thoron. Thus, each test was conducted for 24–48 h to ensure appropriate curve fitting for radon. Data processing from radon and thoron activity concentrations to exhalation rates will be explained later.
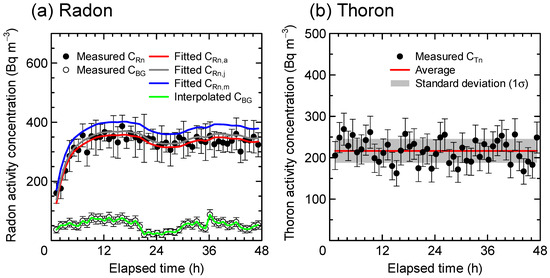
Figure 2.
Changes in measured radon or thoron activity concentration during the exhalation test. (a) Radon measured using AlphaGUARD. (b) Thoron measured using RAD7. Error bars for plots show the uncertainty (1σ) due to counting.
During the exhalation measurement, in addition to the indoor radon activity concentration measured using AlphaGUARD, CBG (Bq m−3), the indoor air temperature, T (°C), and the relative humidity, RHin (%) were monitored using a thermohygrometer (TR-73U, T&D, Matsumoto, Japan). Indoor air absolute humidity, AHin (g m−3), was then calculated as . The indoor temperature and humidity were strongly correlated with the outdoor temperature and humidity because no electrical appliances, including air conditioners and heaters, were used during the test. Meanwhile, relative humidity within the measurement system, RHsys (%), was also measured with RAD7’s built-in hygrometer, and then absolute humidity, AHsys (g m−3), was calculated when RAD7 was used for measurements because the essential use of the desiccant resulted in low relative humidity (<5% in general). Additionally, the temperature and water content at the wall surface were occasionally measured using a wall-surface temperature probe (0628-7507, TESTO, Titisee-Neustadt, Germany) and a stray field probe (0636-6160, TESTO, Titisee-Neustadt, Germany), respectively. However, these results are not shown in detail here, because there was no significant difference between air and wall-surface temperatures, and the wall-surface water content was stable diurnally and seasonally (i.e., 2.9 ± 0.3% for both R1W2 and R2W1).
2.2. Data Analysis
The radon and thoron exhalation rates were calculated using the analysis methods that the authors recently developed and validated [18]. The details below explain the outline of them.
The radon exhalation rate was obtained by fitting a mathematical model to the time plot (Figure 2a). The change in radon activity concentrations, CRn (Bq m−3), can be given by the following three-compartment model with the varying CBG:
where JRn (Bq m−2 s−1) denotes the radon exhalation rate from the wall, SRn (m2) is the exhalation measurement area for radon, V (m−3) is the volume of each compartment, v (m3 s−1) is the flow rate, α (s−1) is the leakage rate from the measurement system, CBG (Bq m−3) is the indoor radon activity concentrations outside of the system, λRn (s−1) is the decay constant of radon, and the subscripts “a”, “i”, and “m” are the accumulation chamber, the intermediate between the accumulation chamber and the radon monitor, and the radon monitor, respectively. Equation (3) was then fitted to a set of measured radon activity concentrations. In dealing with CBG, the actually observed variation was incorporated into the fitting computation. Mean and standard deviations (uncertainty with coverage factor k = 1) of JRn were calculated based on the Monte Carlo method [19], considering measurement uncertainties, such as radon activity concentrations.
The thoron exhalation rate, JTn (Bq m−2 s−1), was calculated using the following equation:
where STn (m2) denotes the exhalation measurement area for thoron, N (–) is the number of segments for the accumulation chamber, CTn (Bq m−3) is the measured thoron activity concentration, β = , γ = , and λTn (s−1) is the decay constant of thoron. N = 433 was used here, so that each segment volume corresponded to 1 cm3. Each measured thoron activity concentration (Figure 2b) was substituted in Equation (4) to obtain JTn. Mean and standard deviations of JTn were then calculated from a bunch of JTn obtained through one single exhalation test.
3. Results
Figure 3 and Figure 4 show JRn as a function of T and AHin, respectively. T is a predominant factor in defining AHin, so that the similar correlation trends were reasonably observed for both parameters. The data indicated weak positive correlations (0.1 < R < 0.4) for the wall R1W2 and moderate positive correlations (0.4 < R < 0.7) for R2W1. The values of JRn were similar between R1W2 and R2W1 at lower T (around T = 5 °C) or low AHin (around AHin = 5 g m−3), but the slope of the regression line was around four times higher at R2W1 than that at R1W2.
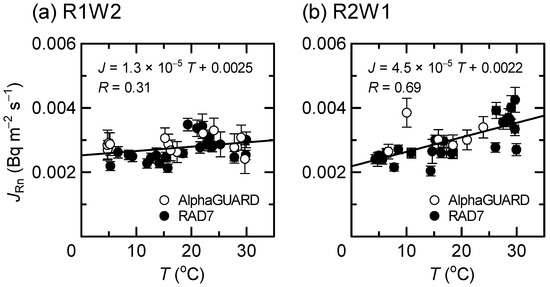
Figure 3.
Radon exhalation rate as a function of temperature. The monitor used is AlphaGARD or RAD7, and the walls tested are (a) R1W2 and (b) R2W1. The regression line is depicted for the combined data from both detectors.
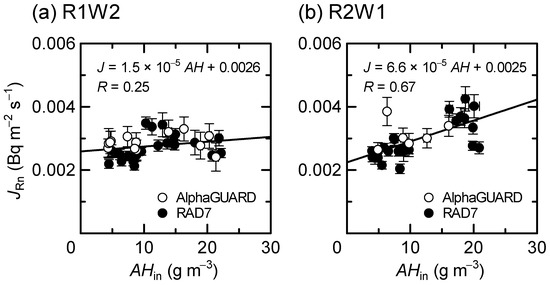
Figure 4.
Radon exhalation rate as a function of absolute humidity. The monitors used and walls tested are the same as in Figure 3.
Figure 5 and Figure 6 show JTn as a function of T and AHin, respectively, representing weak positive correlations for R1W2 and strong positive correlations (0.7 < R) for R2W1. Similarly to the case of JRn, JTn at R2W1 had greater slopes of the regression lines by a factor of around three compared to that at R1W2.
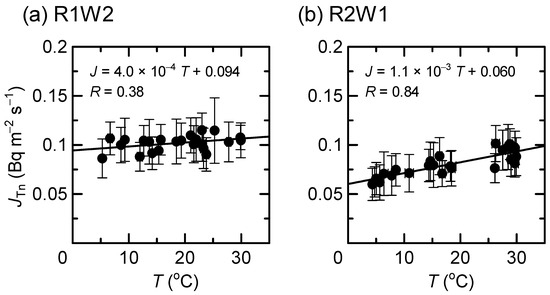
Figure 5.
Thoron exhalation rate as a function of temperature. The monitor used is RAD7, and the walls tested are (a) R1W2 and (b) R2W1.
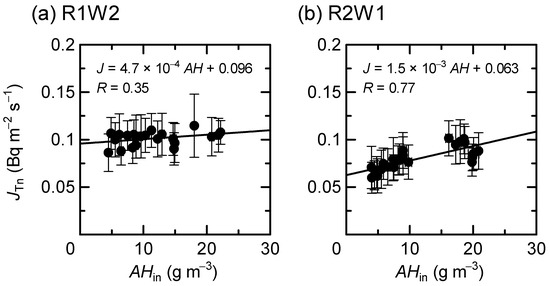
Figure 6.
Thoron exhalation rate as a function of absolute humidity. The monitor used and walls tested are the same as in Figure 5.
Figure 7 shows a moderate correlation between JRn and JTn for R1W2 and a strong correlation for R2W1, reflecting the similar dependence of JRn and JTn on T and AHin, as indicated in Figure 3, Figure 4, Figure 5 and Figure 6.
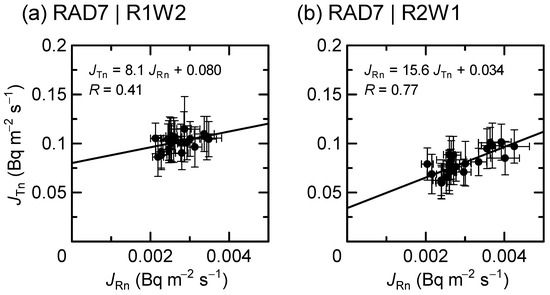
Figure 7.
Relationship between radon and thoron exhalation rates. The monitor used and walls tested are the same as in Figure 5.
The averages and standard deviations of all data are summarized in Table 1. The difference in average JRn, JTn, or α between the monitors or walls was relatively small (ca. 20% at most), considering the variability. All combined data (n = 66, except for n = 47 for JTn) show that the tested walls had, on average, 2.9 × 10⁻³ Bq m−2 s−1 for JRn, 0.089 Bq m−2 s−1 for JTn, and 8.2 × 10⁻⁵ s−1 for α. These are higher by a factor of six and two than typical values for JRn (5 × 10⁻⁴ Bq m−2 s−1) and JTn (0.05 Bq m−2 s−1) reported in an earlier review paper [20]; however, they fall within their typical ranges of 10−4–3 × 10⁻³ and 10−3–0.2 Bq m−2 s−1, respectively. The value of α was approximately one order of magnitude greater than a typical value of around 10−5 s−1 observed in common laboratory tests of rad on emanation and exhalation, where AlphaGUARD or RAD7 was simply connected to an airtight chamber containing a radon-emitting sample (e.g., [21]). This means that the present in situ measurement system was more prone to air leakage, probably because the gap between the accumulation chamber and wall remained unfilled despite the addition of clay to reduce leakage. When the equivalent measurement system is deployed to another testing location, different levels of air leakage, depending on wall-surface conditions, can be observed.

Table 1.
Averages and standard deviations of measured radon and thoron exhalation rates and leakage rates.
4. Discussion
This study obtained in situ data on JRn and JTn from the two solid walls for over a year. The data on JRn determined based on the different measurement systems using AlphaGUARD and RAD7 were combined to more clearly see its dependence on temperature and humidity. Although the data analysis methods for both systems were validated in a previous paper [18], we should be careful about the fact that the desiccant used for RAD7 dramatically dehumidified the internal air of the measurement system generally down to 5% or less in relative humidity (see RHsys in Table 1). It should be considered whether such low humidity induced unusual JRn values that were not comparable to those measured using AlphaGUARD. It is apparent from Figure 3 and Figure 4 that there was no significant discrepancy of JRn between both radon monitors, which validates the combination of those data. Furthermore, this suggests that AHin can be treated there as an alternative parameter instead of AHsys, which is supported by the fact that a strong positive association was actually observed between AHin and AHsys (R = 0.93).
Note that this argument is also supported by a reasonable assumption that tentatively low AHsys only during the RAD7-based exhalation tests caused very little change in water content in the sample of interest, W (%), at the shallow region of the wall, where some physical behaviors (e.g., radon emanation and diffusion) contributing to the release of radon to the atmosphere still effectively occur. This is because water diffuses from the surrounding or deeper region to the shallow region, and the evaporation through the open surface connected to capillary pores would take time [22,23,24].
According to previous studies based on laboratory tests with pieces of building material samples, such as brick, granite, and concrete, environmental factors can influence radon and thoron exhalation rates (e.g., [13,14]). Generally, JRn and JTn increase with increasing AH or W and then remain on a plateau or decrease beyond a certain level of AHin (AHsys) or W. The water effect can be explained by the combination of radon emanation and migration processes; an increase in W can enhance radon emanation, which is defined as an escape of radon atoms from the solid into pore spaces, and it can also impede radon diffusion and its resulting exhalation from pore spaces open to the atmosphere. Conversely, JRn simply increases with increasing T, and there is no known trend for the change in JTn with T. The temperature effect has been explained by radon adsorption during the migration in media; an increase in T can reduce the adsorption ability of radon atoms onto the solid surface, causing them to remain in the media.
Our in situ data from the solid concrete walls (Figure 3 and Figure 4) are compared with earlier laboratory testing data from 1 L cubic concrete samples [16]. Here, we focus on radon and concrete because comparing different building materials, which typically exhibit different radon and thoron exhalation characteristics even within the same material (e.g., [15]), seems inappropriate, and the laboratory-based findings of thoron exhalation from concrete samples have not yet been thoroughly compiled. As mentioned in Section 3, the weak and moderate correlations were found between JRn and T (Figure 3) or AHin (Figure 4), which appeared consistent with the following report, as discussed below. Stranden et al. [16] found that JRn increased with W from 0 to 4–5%, with a dramatic increase by a factor of five from W = 3 to 5%, and then dramatically decreased to the same level as observed at W = 0.5–3% with increasing W from 5 to 6%. Furthermore, it was also found that JRn increased by a factor of two to seven with increasing T from 5 °C to 50 °C; during the temperature experiment, the original W values (2.3–3.3%) in three concrete samples were preserved naturally without any water addition or drying treatment.
Our occasional water content monitoring at the wall surfaces deployed next to the accumulation chamber indicated the relatively stable W for over a year, i.e., 2.9 ± 0.3% for both R1W2 and R2W1 was seen. This means that T or AHin was not a surrogate index of W, as shown in the laboratory testing, too [16]. It can be concluded that regarding JRn as a function of T, our in situ data agreed with the laboratory testing result and supported their aforementioned argument about radon’s adsorption on the internal surface of the concrete. However, we could provide no data on the impact of W on JRn, and such information would be desired in the future to be discussed for a wall with a wide range of W.
When it comes to the effect of T on JRn, our data were close to the laboratory testing data from Stranden et al. [16]. Here, we consider their data at T close to our temperature; they indicated the increase in JRn by a factor of 1.2–2.0 with increasing T from 5 to 22 °C. However, they only provided a single JRn value without its uncertainty at each T, so more reliable and supporting data are desired in the future.
Finally, to examine the results in Figure 7, where the correlations seemed more or less different between the walls, other factors affecting JRn and JTn are discussed through simple theoretical calculations. The literature presented a mathematical model expressing an exhalation rate J (Bq m−2 s−1) from the solid wall with a thickness of d (m) [7,20]:
where C (Bq kg−1) represents the 226Ra or 224Ra activity concentration in the wall material, λ (s−1) is the decay constant of radon or thoron, ε (–) is the radon or thoron emanation fraction of the wall material, ρ (kg m−3), the density of the wall material, L (=) (m) is the diffusion length of radon or thoron in the wall material, and D (m2 s−1) is the diffusion coefficient of radon or thoron in the wall material. The input values were unknown for the walls tested in this study, and the following values were selected from the information in the literature [7,8,9,15,20] to roughly match the calculated J with the measured J: CRa-226 = 65 Bq kg−1, CRa-224 = 13 Bq kg−1, εRn = εTn = 0.1, ρ = 2300 kg m−3, d = 0.2 m, LRn = 0.183 m, LTn = 2.37 × 10⁻³ m, and D = 7.0 × 10⁻⁸ m2 s−1. When these input values are used in Equation (5), the solutions are JRn = 2.9 × 10⁻³ and JTn = 8.8 × 10⁻² Bq m−2 s−1.
Figure 8 shows how JRn and JTn can theoretically change within possible ranges of D (10−9–10−6 Bq m−2 s−1) or ε (0.01–0.14). As expected, an increase in ε can linearly amplify J, resulting in a linear relationship between JRn and JTn; the same relationship will be seen with changing C and ρ, as well. Changing D had a different relationship between JRn and JTn, where it exhibited a gentle or steep curve below or above D = 3.0 × 10⁻⁸ m2 s−1, respectively. This means that D greater than a critical level can have an essential impact only on JTn because most radon atoms with a longer half-life of 3.82 d can readily diffuse out of the wall to the atmosphere, even with low D.
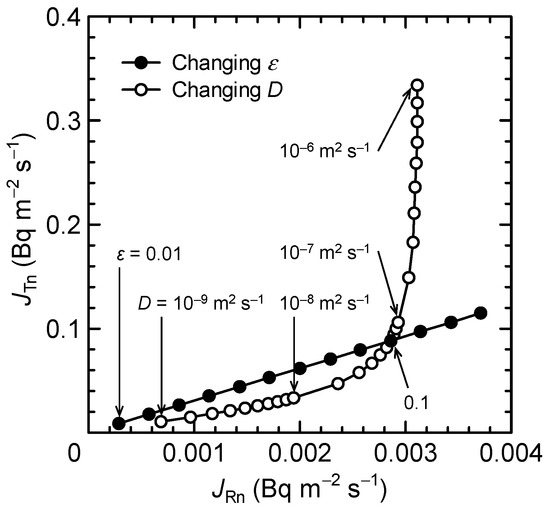
Figure 8.
Relationship between radon and thoron exhalation rates calculated with a variety of radon emanation fractions and diffusion coefficients. Equation (5) was applied to the calculation within the ranges of ε = 0.01–0.14 and D = 10−9–10−6 m2 s−1. The input values of the other parameters are listed in the text.
When our in situ testing results (Figure 7) are examined only from the diffusion process (Figure 8), R2W1 that had a two-fold larger slope of the regression line in Figure 7 is considered to have a higher D than R1W2 despite being used for the same apartment. One straightforward reason for this may be a difference in the aging of the concrete exposed to slightly different meteorological conditions for several decades. Figure 8 illustrates that JRn and JTn are relatively easy and difficult, respectively, to increase at D lower than 3.0 × 10⁻⁸ m2 s−1. However, Figure 3, Figure 4, Figure 5 and Figure 6 show that JRn and JTn increased to the same degree regardless of walls and meteorological parameters; for instance, ratios of JRn and JTn at 5 °C to those at 30 °C were 1.13 and 1.10 for R1W2 and 1.46 and 1.42 for R2W1, respectively. This implies that not only diffusion but also the emanation process is actually associated with the impacts of T and AHin on JRn and JTn. Investigating this issue in detail is beyond the scope of this study, but it would be an interesting research topic for better understanding the mechanism of radon and thoron exhalation from solid concrete installed in real buildings.
5. Conclusions
In situ radon and thoron exhalation rates were intensively measured at two solid concrete walls of an apartment in Japan. All data obtained for over a year were investigated to reveal environmental and material-associated factors affecting radon and thoron exhalation from the concrete walls. Regarding T and JRn, our findings were consistent with those of an earlier known laboratory study by Stranden et al. [16]. Conversely, the corresponding laboratory testing on JTn has not been conducted and is desired in the future. Additionally, the significant linear correlations between JRn and JTn observed at both tested walls was theoretically considered, revealing a new issue regarding how much impact each process of the emanation and migration within concrete pore spaces has on radon and thoron exhalation.
This study found more or less seasonal variations in both radon and thoron exhalation from the solid concrete wall. This finding could be useful in modeling the spatiotemporal dynamics of indoor radon and thoron in dwellings. In the case of a solid concrete wall, JRn and JTn as input parameters can be described as a simple function of T or AHin. This would contribute to a better understanding of a correlation between exhalation rates and airborne activity concentrations, as well as better modeling of indoor radon and thoron activity concentrations. The indoor activity concentrations were continuously monitored in the same rooms tested in parallel with a series of exhalation tests in this study, which will be available for statistical analysis and numerical modeling.
Note that, as a limitation of this study, this consideration cannot apply to other types of wall materials and structures, such as thin gypsum-based cavity walls, which may have diurnal variations in exhalation rates (unpublished data by the authors); this observation has already been implied by a theoretical consideration [25]. To validate our findings obtained only from the two walls of a single apartment, more in situ tests need to be conducted in different buildings and environments. Better parameterization of exhalation rates from other types of walls, including surface-coated concrete walls, in addition to concrete walls would also be necessary; thus, laboratory or in situ testing and numerical approaches should be expanded to a wider range of building materials.
Lastly, the authors would like to emphasize the importance of the data processing to gain JRn. The analysis method used in this study was a three-compartment model with varying CBG, which was developed and compared with other simple, common methods (e.g., one-compartment model with stable CBG) in a previous study [18]. It must be noted that if such a simple method was applied, different significances of correlations from what were seen in the present paper would be observed, resulting in more or less different conclusions. In particular, a way to deal with CBG was crucial. At least in our test cases, CBG was always lower than CRn in a plateau region (Figure 2a) but not as low, as we could consider CBG as stable by averaging a bunch of CBG over a test period.
Author Contributions
Conceptualization, A.S., M.M.H. and T.I.; methodology, A.S.; validation, A.S. and Y.I.; formal analysis, A.S.; investigation, A.S. and Q.J.; resources, A.S.; writing—original draft preparation, A.S.; writing—review and editing, A.S., Y.I., M.M.H., Q.J. and T.I.; visualization, A.S.; project administration, A.S. and T.I.; funding acquisition, A.S. All authors have read and agreed to the published version of the manuscript.
Funding
This work was supported by JSPS KAKENHI Grant Number 21K10426 and the Wesco Scientific Promotion Foundation, Okayama, Japan.
Institutional Review Board Statement
Not applicable.
Informed Consent Statement
Not applicable.
Data Availability Statement
The original contributions presented in the study are included in the article, further inquiries can be directed to the corresponding author.
Conflicts of Interest
The authors declare no conflicts of interest.
References
- Tokonami, S. Characteristics of thoron (220Rn) and its progeny in the indoor environment. Int. J. Environ. Res. Public Health 2020, 17, 8769. [Google Scholar] [CrossRef] [PubMed]
- Font, L.; Baixeras, C. The RAGENA dynamic model of radon generation, entry and accumulation indoors. Sci. Total. Environ. 2003, 307, 55–69. [Google Scholar] [CrossRef] [PubMed]
- International Commission on Radiation Units and Measurements (ICRU). Measurement and Reporting of Radon Exposures; ICRU Report No.88; International Commission on Radiation Units and Measurements: Bethesda, MD, USA, 2012; Volume 12. [Google Scholar]
- Dvorzhak, A.; Mora, J.C.; Real, A.; Sainz, C.; Fuente, I. General model for estimation of indoor radon concentration dynamics. Environ. Sci. Pollut. Res. 2021, 28, 54085–54095. [Google Scholar] [CrossRef] [PubMed]
- Nazaroff, W.W. Radon transport from soil to air. Rev. Geophys. 1992, 30, 137–160. [Google Scholar] [CrossRef]
- Cinelli, G.; De Cort, M.; Tollefsen, T. (Eds.) European Atlas of Natural Radiation; Publication Office of the European Union: Luxembourg, 2019. [Google Scholar]
- United Nations Scientific Committee on the Effects of Atomic Radiation (UNSCEAR). Sources and Effects of Ionizing Radiation. UNSCEAR 2000 Report to the General Assembly, with Scientific Annexes; United Nations: New York, NY, USA, 2000.
- United Nations Scientific Committee on the Effects of Atomic Radiation (UNSCEAR). Sources and Effects of Ionizing Radiation. UNSCEAR 1993 Report to the General Assembly, with Scientific Annexes; United Nations: New York, NY, USA, 1993.
- United Nations Scientific Committee on the Effects of Atomic Radiation (UNSCEAR). Sources, Effects and Risks of Ionizing Radiation. UNSCEAR 1988 Report to the General Assembly, with Annexes; United Nations: New York, NY, USA, 1988.
- ISO 11665-9:2019; Measurement of Radioactivity in the Environment 1—Air: Radon-222—Part 9: Test Methods for Exhalation Rate of Building Materials. ISO: Geneva, Switzerland, 2019.
- Kanse, S.D.; Sahoo, B.K.; Gaware, J.J.; Sapra, B.K. A novel method based on 220Rn (thoron) exhalation rate of indoor surfaces for robust estimates of 220Rn concentration and equilibrium factor to compute inhalation dose. Chemosphere 2021, 267, 128908. [Google Scholar] [CrossRef] [PubMed]
- Nuccetelli, C.; Leonardi, F.; Trevisi, R. Building material radon emanation and exhalation rate: Need of a shared measurement protocol from the european database analysis. J. Environ. Radioact. 2020, 225, 106438. [Google Scholar] [CrossRef] [PubMed]
- Janik, M.; Omori, Y.; Yonehara, H. Influence of humidity on radon and thoron exhalation rates from building materials. Appl. Radiat. Isot. 2015, 95, 102–107. [Google Scholar] [CrossRef] [PubMed]
- Hassan, N.M.; Tokonami, S.; Fukushi, M. A simple technique for studying the dependence of radon and thoron exhalation rate from building materials on absolute humidity. J. Radioanal. Nucl. Chem. 2011, 287, 185–191. [Google Scholar] [CrossRef]
- De Jong, P.; Van Dijk, W.; De Rooij, M. Influence of the porosity on the 222Rn exhalation rate of concrete. Health Phys. 2011, 100, 127–137. [Google Scholar] [CrossRef] [PubMed]
- Stranden, E.; Kolstad, A.K.; Lind, B. The influence of moisture and temperature on radon exhalation. Radiat. Prot. Dosim. 1984, 7, 55–58. [Google Scholar] [CrossRef]
- Sahoo, B.K.; Sapra, B.K.; Gaware, J.J.; Kanse, S.D.; Mayya, Y.S. A model to predict radon exhalation from walls to indoor air based on the exhalation from building material sample. Sci. Total Environ. 2011, 409, 2635–2641. [Google Scholar] [CrossRef] [PubMed]
- Sakoda, A.; Ishimori, Y.; Jin, Q.; Iimoto, T. Improved data analysis techniques for calculating more accurate radon and thoron exhalation rates from building interior solid walls. Appl. Radiat. Isot. 2024, 207, 111180. [Google Scholar] [CrossRef] [PubMed]
- Joint Committee for Guides in Metrology (JCGM). Evaluation of Measurement Data—Supplement 1 to the Guide to the Expression of Uncertainty in Measurement Propagation of Distributions Using a Monte Carlo Method; JCGM: Geneva, Switzerland, 2008; Volume 101. [Google Scholar]
- Porstendörfer, J. Properties and behavior of radon and thoron and their decay products in the air. J. Aerosol Sci. 1994, 25, 219–263. [Google Scholar] [CrossRef]
- Sakoda, A.; Meisenberg, O.; Tschiersch, J. An approach to discriminatively determine thoron and radon emanation rates for a granular material with a scintillation cell. Radiat. Meas. 2016, 89, 8–13. [Google Scholar] [CrossRef]
- Ryu, D.-W.; Ko, J.-W.; Noguchi, T. Effects of simulated environmental conditions on the internal relative humidity and relative moisture content distribution of exposed concrete. Cem. Concr. Compos. 2011, 33, 142–153. [Google Scholar] [CrossRef]
- Garrabrants, A.C.; Kosson, D.S. Modeling moisture transport from a portland cement-based material during storage in reactive and inert atmospheres. Dry. Technol. 2003, 21, 775–805. [Google Scholar] [CrossRef]
- Akita, H.; Fujiwara, T.; Ozaka, Y. A practical procedure for the analysis of moisture transfer within concrete due to drying. Mag. Concr. Res. 1997, 49, 129–137. [Google Scholar] [CrossRef]
- Tan, Y.; Yuan, H.; Kearfott, K. A model comparison of diffusion-controlled radon exhalation from solid and cavity walls with application to high background radiation areas. Environ. Sci. Pollut. Res. 2020, 27, 43389–43395. [Google Scholar] [CrossRef] [PubMed]
Disclaimer/Publisher’s Note: The statements, opinions and data contained in all publications are solely those of the individual author(s) and contributor(s) and not of MDPI and/or the editor(s). MDPI and/or the editor(s) disclaim responsibility for any injury to people or property resulting from any ideas, methods, instructions or products referred to in the content. |
© 2024 by the authors. Licensee MDPI, Basel, Switzerland. This article is an open access article distributed under the terms and conditions of the Creative Commons Attribution (CC BY) license (https://creativecommons.org/licenses/by/4.0/).