Abstract
From 2001 to 2020, three typhoons with similar moving paths and intensities were found to trigger markedly different cooling off northeastern Taiwan. They were typhoons Utor (2001), Nuri (2008), and Hagupit (2008), which led to maximum sea surface temperature (SST) cooling temperatures of 8.8, 2.7, and 1.4 °C, respectively. The drastic cooling discrepancy implies that the existing understanding of the key mechanism leading to the cooling off northeastern Taiwan could be insufficient. For further exploring the key reason(s) contributing to the marked discrepancy, a regional oceanic modeling system (ROMS) was used to reconstruct the background oceanic environment corresponding to three typhoon passages. Results show that the wide radius of maximum winds of typhoon Utor contributes to the strongest SST cooling by enhancing the Kuroshio intrusion (KI) onto the shelf northeast of Taiwan. Heat budget diagnostics explain why including tidal forcing can substantially promote SST cooling. The process was associated mainly with a stronger vertical advection tied to the influence of de-stratification by tidal mixing. Finally, warmer Taiwan Strait currents, driven by wind forcing the typhoons to pass zonally through the north South China Sea, intruded clockwise into the Longdong coast and accelerated the recovery of sea surface cooling around Longdong.
1. Introduction
Given the possible influences of affecting tropical cyclone (TC) activities, short-term regional weather systems, long-term climate balances, fisheries, ecological systems, and regional oceanic environments, upper ocean responses to TC passages have attracted continued and wide attention from the oceanic, atmospheric, metrological, and climatological communities [1,2,3,4,5,6,7,8,9,10,11,12,13]. In addition to the relatively comprehensive investigations for the responses in open oceans, the TC-induced upper ocean responses in coastal and shelf regions attract increasing attention with the systematic advancements in in situ measurement instruments, remote sensing techniques, and numerical modeling calculations [14,15,16,17,18,19].
For example, Hurricane Ivan crossed the Gulf of Mexico with category 4–5 intensity before making landfall in Alabama. Using 14 acoustic Doppler current profilers, Mitchell et al. [14] showed, in unprecedented detail, the ocean response to Ivan as it passed over the outer continental shelf. Teague et al. [15] further indicated that currents in excess of 2 m/s were observed during the passage of Ivan by using the same dataset. Using the ocean radar system-derived sea surface current data, Morimoto et al. [17] investigated the movement of the Kuroshio axis on the northeast shelf of Taiwan responding to typhoon passages. They indicated that the mean current speed northeast of Taiwan increased by 18 cm/s because the Kuroshio axis moved onto the shelf after typhoon passages. Zheng and Chen [19] investigated three-dimensional currents and cooling responses around the sea northeast of Taiwan underlying the influences of typhoon passages using a 2 km high-resolution ocean tidal current model. They suggested that tidal effects should be considered to accurately model the upper ocean responses to typhoon passages around this region.
TC-induced upper ocean cooling off northeastern Taiwan (TCNET) is a particularly complex issue related to cooling responses in coastal regions to TC passages. The reason is the simultaneous presence of active Kuroshio and sharp bathymetric changes due to the conjunction of the edge of the Okinawa Trough to the East China Sea (ECS) continental shelf [16]. Tsai et al. [16] indicated that the TCNET resulted mainly from the upwelling of Kuroshio’s subsurface water tied to Kuroshio intrusion (KI) onto the shelf, rather than the entrainment mixing generated by the TC wind forcing. Zheng et al. [18] reconstructed upper ocean responses off northeastern Taiwan to all typhoon passages from 2005 to 2013 using numerical modeling by a regional oceanic modeling system (ROMS). They indicated that the typhoon-induced near-inertial currents over the continental shelf can also trigger distinct cooling within this region in addition to the mechanism of KI. Meanwhile, the processes of KI and enhanced near-inertial currents are dominated mainly by wind forcing rather than upper oceanic conditions. Accordingly, on the basis of field investigations of coastal sea surface cooling, Doong et al. [20] indicated that the coastal sea surface temperature (SST) drops at Longdong were highly correlated with the moving tracks of typhoons. A similar statement for TCNET was summarized and can be found in Figure 2 in Tsai et al. [16].
Here, long-term in situ measurement of SST by a temperature meter mounted on a moored buoy is used to quantify the coastal SST cooling responses around the Longdong coast northeast of Taiwan to all typhoon passages from 2001 to 2020. Three historic typhoons with very similar moving paths and intensities were found to induce markedly different magnitudes of cooling off northeastern Taiwan in the past 20 years. This fact conflicts with existing theories and understandings of TCENT. The main objective of this study is to obtain a more comprehensive understanding of the generation and variations in TCNET. To further explore the key reason(s) contributing to the marked discrepancy, several numerical experiments based on ROMS were conducted to reconstruct the background oceanic environment during the passages of three typhoons. Meanwhile, the role of tidal forcing was also examined in our analysis for a more comprehensive discussion. Through a series of comparisons of standard and idealized experiments, the results show that the wider radius of maximum winds of typhoon Utor is responsible for the strongest SST cooling through enhancing the KI onto the shelf northeast of Taiwan. Additionally, heat budget diagnostics further explain how tidal forcing promotes SST cooling. In general, the process was associated with a stronger vertical advection due to the influence of de-stratification by tidal mixing. Finally, the warmer Taiwan Strait current (TSC) was shown to intrude clockwise into the Longdong coast and accelerate the recovery of SST cooling around Longdong, which was first documented in the literature.
The rest of the paper is organized as follows. The model descriptions, experimental design, typhoon characteristics, and moored buoy data are introduced in Section 2. Section 3 compares model simulations and continuous temperature measurements and explores key mechanism(s) leading to SST coolings in three typhoon cases. The results of heat budget analysis (HBA) are presented in Section 4. Section 5 shows the effects of other influencing factors. Conclusions and remarks are given in Section 6.
2. Data and Methods
2.1. Moored Buoy Data
In this study, moored buoy data were used to monitor the long-term coastal SST cooling responses off northeastern Taiwan to all typhoon passages from 2001 to 2020. The buoy was situated approximately 0.6 km off the Longdong coast and at 23 m depth in the water. The monitor project was funded by the Central Weather Bureau, Taiwan. The buoy was deployed by the Coastal Ocean Monitoring Center, National Cheng Kung University since 1998 [20]. The water temperature sensor is positioned 0.6 m beneath the sea surface. Since 2000, the procedures for sensor calibration, system integration, operation, and maintenance have been ISO 9001:1994 certified. The sensor offers an accuracy of ±0.1% F.S., making it suitable for critical temperature monitoring applications. Prior to being integrated with the buoy, the sensor must be sent to the National Meteorological Instrument Center at CWB for calibration to ensure its accuracy. The long-term measurement of SST is available from 1998 to the present, and the data can be accessed through https://doi.org/10.1594/PANGAEA.895002 (accessed on 1 March 2024).
2.2. Typhoons
Typhoon data around Taiwan from 2001 to 2020 were used here to examine the relationship between typhoon moving tracks and coastal SST cooling responses off northeastern Taiwan to typhoon passages. The product was composed of best track data that were processed and provided by the Joint Typhoon Warning Center. Information on the product includes time-varying positions of TC center, wind radius, central pressure, and maximum sustained wind speed at 6 h intervals. In the past 20 years, three historic typhoons with very similar moving paths and intensities have been found to trigger totally different magnitudes of cooling off northeastern Taiwan. They are typhoons Utor (2001), Nuri (2008), and Hagupit (2008) (Figure 1). The dataset was obtained from https://www.metoc.navy.mil/jtwc/jtwc.html (accessed on 1 March 2024).
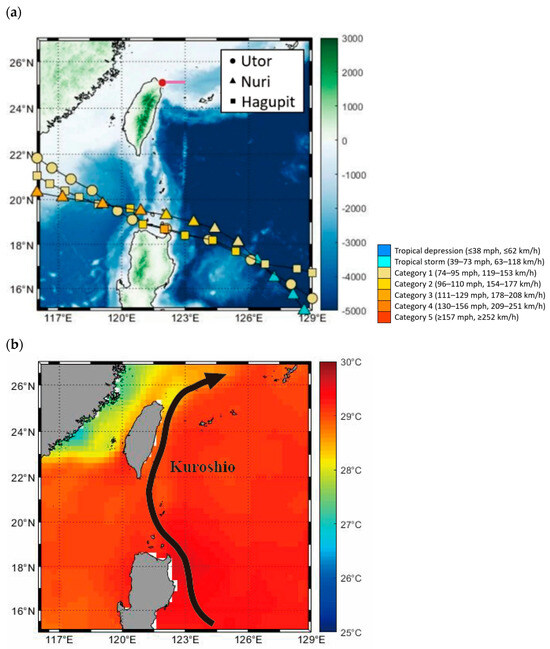
Figure 1.
(a) Study area with topography (unit: meters). Typhoon tracks and intensities of three TC cases are shown as 6 hourly markers with different colors. The large red dot denotes the location of the Longdong buoy northeast of Taiwan. The pink line denotes the current transect used in Figures 4 and 5. (b) Schema of Kuroshio flowing path and background physical state of SST (climatology of August, which was retrieved from https://psl.noaa.gov/data/gridded/data.noaa.oisst.v2.html) (accessed on 1 March 2024) corresponding to the passages of three TCs.
Typhoon Utor formed on 3 July 2001, reached typhoon strength on 6 July, made landfall in Guangdong, China on 7 July, and dissipated on 8 July. Originating in the northwest Pacific, it moved northwest, impacting the Philippines, Hong Kong, and southern China, traveling from the Philippine Sea into the South China Sea and intensifying over warm waters. Similarly, Nuri formed on 17 August 2008, reached typhoon strength on 20 August, made landfall in Hong Kong on 22 August, and dissipated on 23 August. Nuri also formed in the northwest Pacific and moved northwest, affecting the Philippines, the South China Sea, and Hong Kong, maintaining its strength over warm waters after crossing from the waters east of the Philippines into the South China Sea. Hagupit, which formed on 14 September 2008, reached typhoon strength on 18 September, made landfall in Guangdong, China on 23 September, and dissipated on 24 September. Like the others, Hagupit originated in the northwest Pacific and moved northwest, impacting the Philippines, the South China Sea, and southern China, maintaining its intensity over warm ocean waters as it traveled through the Philippine Sea into the South China Sea.
2.3. Ocean Model Description and Experimental Design
For further exploring the possible mechanisms contributing to the markedly different coolings of Utor (2001), Nuri (2008), and Hagupit (2008), ROMS was used to reconstruct the background oceanic environment corresponding to the durations of three individual typhoon passages. ROMS is a free-surface, primitive equation, curvilinear coordinate oceanic model. Barotropic and baroclinic momentum equations are resolved separately in ROMS, and the subgrid-scale mixing processes are parameterized by a nonlocal, K-profile planetary boundary layer scheme [21]. For numerical experiments designed and executed in this study, nested-grid ROMS was implemented to maintain high spatial resolution for resolving regional dynamical features around Longdong and including complete Kuroshio dynamic simultaneously.
In the vertical direction, 20 s coordinate levels were unevenly distributed to achieve higher resolution in the upper ocean near the surface [22]. Model bathymetry was created by merging higher resolution bathymetry (500 m × 500 m spatial resolution) distributed by Ocean Data Bank Taiwan and global 1 min ocean bottom topography from Etopo1. The parent and nested model domains covered the regions of 19–27° N, 119–127° E, and 23.9–26.2° N, 120.5–123° E, respectively (Figure 2). The horizontal resolutions are approximately 6 and 2 km for parent and nested domains, respectively. Meanwhile, model simulations were driven by momentum wind forcing from hourly Modern-Era Retrospective analysis for Research and Applications, version 2 (MERRA-2) product (0.5° latitude × 0.625° longitude). Atmospheric-related parameters, which were used to calculate net heat flux across the air–sea interface, were derived also from MERRA-2. The product of MERRA-2 was retrieved through https://disc.gsfc.nasa.gov/ (accessed on 1 March 2024).
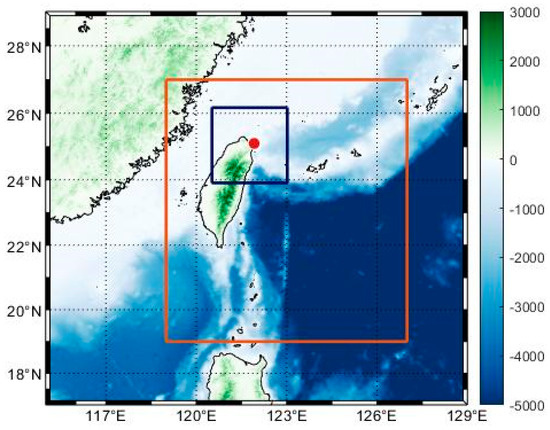
Figure 2.
Study area with topography (unit: meters). The red and blue rectangles denote the domains of parent and nested grids for ROMS. The red dot denotes the location of the Longdong buoy in the northeast of Taiwan.
Initial and lateral boundary conditions for ROMS were derived from a data-assimilated version of HYbrid Coordinate Ocean Model (HYCOM) global solutions with a spatial resolution of 1/12th of a degree [23]. The outputs were derived through https://www.hycom.org/dataserver/gofs-3pt1/reanalysis (accessed on 1 March 2024). Additional complete descriptions for ROMS can be found in Shchepetkin and McWilliams [24,25]. Related validations for the performance of ROMS in reproducing oceanic environment variations underlying typhoon passages can be found in previous studies [11,26,27]. In addition, for the complete spinning up of smaller-scale features in the inner domain, only simulations 2 days after initialization were used in the following analyses.
Zheng and Chen [19] indicated that tidal forcing could play a key role in dominating the regional oceanic dynamics and thus the consequential cooling response off northeastern Taiwan. In this study, the role of tidal forcing was also included in our series of experiments for a more comprehensive discussion. Tidal forcing was included in our simulations by integrating different tidal constituents into ROMS from its lateral boundaries based on the same method described in previous studies [28,29]. Tidal constituents (M2, S2, N2, K2, K1, O1 P1, Q1, Mf, and Mm) were obtained from the global model of ocean tides TPXO7, which was developed by Oregon State University [30]. In addition, the high agreement between simulated tidal amplitudes and tide gauge-measured sea level changes validates the performance of ROMS simulations of tidal forcing in this region [19]. All the numerical experiment configurations are summarized in Table 1.

Table 1.
List of model experiments.
3. Results
3.1. Model Simulations of Three Cooling Events
Figure 3 shows the near-surface temperature drops centered at 25.09° N, 121.92° E in response to passages of three historical typhoons, Utor (2001), Nuri (2008), and Hagupit (2008). The yellow, red, and blue lines denote the temperature variabilities derived from the moored buoy (temperature measured at 0.6 m depth), model simulations without tidal forcing (EXPSTD), and model simulations with tidal forcing (EXPTIDE, temperatures at 0 m depth). In situ temperature measurements given by moored buoy (yellow lines) recorded maximum SST drops during three TC passages. They are 8.8 °C (occurred at 00:00 on 6 July), 2.7 °C (at 15:00 on 21 August), and 1.4 °C (at 00:00 on 23 September), which correspond to the durations of Utor (2001), Nuri (2008), and Hagupit (2008) passages.
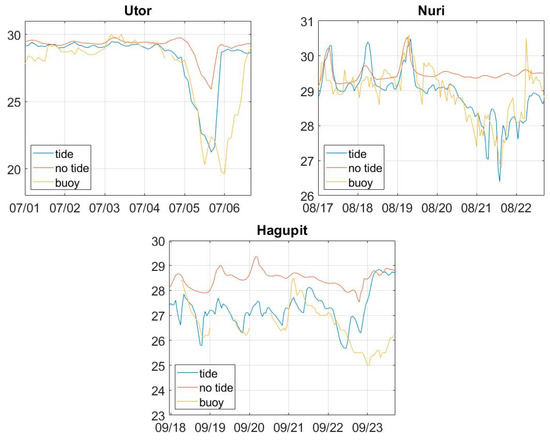
Figure 3.
Near-surface temperature drops centered at 25.09° N, 121.92° E in response to passages of three historical typhoons, Utor (2001), Nuri (2008), and Hagupit (2008). The yellow, red, and blue lines denote the temperature variabilities derived from the moored buoy (temperature at 0.6 m depth), model simulations without tidal forcing (EXPSTD), and model simulations with tidal forcing (EXPTIDE, temperatures at 0 m depth).
Comparison of simulations without tidal forcing (EXTSTD, red lines) with in situ measurements (yellow lines) shows that model simulations exhibit systematically weaker sea surface cooling than moored buoy measurements during the three typhoon events. The blue lines in Figure 3 show the results of model simulations with tidal forcing as inputs (EXPTIDE, UTORTIDE, NURITIDE, and HAGUPITTIDE). Compared with in situ temperature measurements provided by moored buoy temperature meter (yellow lines), model-simulated sea surface coolings in EXPTIDE, systematically enhanced with tidal forcing, exhibit much closer agreement with the in situ moored buoy measurements. Meanwhile, the temperature differences in maximum cooling between EXPTIDE and in situ measurements for three events sharply decrease to 1.4, 0.4, and 0.7 °C compared with the differences between EXPSTD and in situ measurements of 6.3, 3.0, and 2.5 °C for Utor (2001), Nuri (2008), and Hagupit (2008). After tidal forcing is integrated, model-simulated sea surface coolings behind typhoon passages are strongly enhanced. In addition, the surface coolings are reproduced more realistically compared with simulations without tidal forcing. This result shows a consistent trend as demonstrated in Zheng and Chen [19].
3.2. Key Mechanism Leading to SST Coolings to Three Typhoon Cases
Figure 4 shows the cross-transects of temperature (in color shadings) denoting the gradual uplift of subsurface cold water (denoted by 20 °C isotherms in bold-red contours). The core position of the northward Kuroshio current (KC) was outlined by meridional current speeds greater than 50 cm/s along the transect (contours of 50 and 70 cm/s: dashed lines, contours above 90 cm/s: solid lines) [26,31]. In the case of Utor (left panel in Figure 4), the evolution of temperature isotherms and the core position of the meridional KC indicate that the core of Kuroshio appears to be pushed shore-ward from 5 July to 6 July at 06:00. About 2 days later, it retreats toward offshore back to its original position. In the case of Nuri, the core position of KC appears to be stationary throughout the period of typhoon passage. (It is noted that the shift of the white cross on August 20 is affected by the tide, not the movement of the entire current core). The variability characteristic of the core position of KC in the case of Hagupit falls between the patterns corresponding to Utor and Nuri. It is worth noting that Figure 4 shows the results of EXPTIDE corresponding to three TC events. By contrast, the results of EXPSTD, without the influence of high-frequency and periodic tidal signals, show a systematically more straightforward scenario of gradual uplift of subsurface cold water tied to KI (see Figure S1 in Supplementary Materials (SM)).
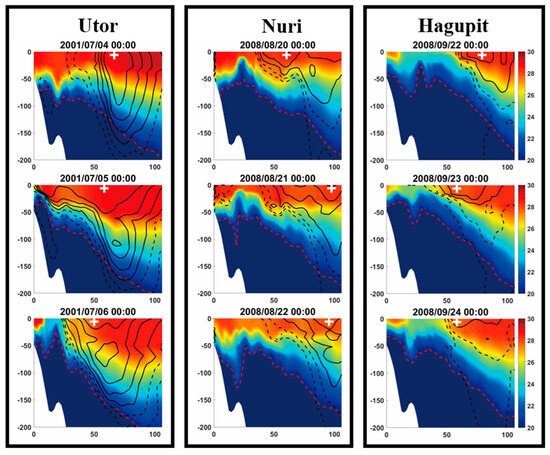
Figure 4.
Latitudinal transects (from 121.93° E to 123.00° E, along 25.09° N) of temperature (°C, color shading) and the position where KC passed through simulated in UTORTIDE (left panel), NURITIDE (middle panel), and HAGUPITTIDE (right panel). The position of KC was defined by outlines with northward current speeds greater than 50 cm/s (contours of 50 and 70 cm/s: dashed lines, contours above 90 cm/s: solid lines). The dashed-red contours denote 20 °C isotherms and the white cross indicates where the meridional current speed is strongest along the transect.
Overall, the results on the three cases show that a stronger onshore movement of KC (e.g., KI) leads to stronger coastal upwelling and consequential SST coolings around the sea surface, which implies that KI appears to play a crucial role in sea surface cooling around this region. To provide more straightforward evidence for the key mechanism leading to the coastal upwelling and consequential sea surface cooling, idealized experiment-1 (IE-1) was designed and executed by removing the local wind forcing (wind forcing was set to zero) off northeastern Taiwan (24–26° N, 121–123° E). Similar usage can be seen in Zheng et al. [18].
Figure 5 shows the results of UTORIE-1, NURIIE-1, and HAGUPITIE-1. Because the main purpose of executing IE-1 is to further examine the relationship between local wind forcing and KI and bring out the importance of KI on the consequential SST cooling, please compare Figure 5 (results of IE-1) directly to Figure 4. As shown in Figure 5, the cross-transects of temperature (in color shadings) no longer exhibit the gradual uplift of subsurface cold water (denoted by 20 °C isotherms in bold-red contours). The core position of northward KC was also outlined by meridional current speeds greater than 50 cm/s along the transect. In the three cases, the current cores are almost stationary, and no obvious KI is observed. This demonstrates the tight relationship between local wind forcing off northeastern Taiwan and consequential KI. Moreover, without KI, the coastal upwelling that appeared originally in UTORTIDE and HAGUPITTIDE is no longer detected. This result can serve as another dynamic evidence confirming the key role played by KI in generating coastal upwelling and consequential sea surface cooling around Longdong.
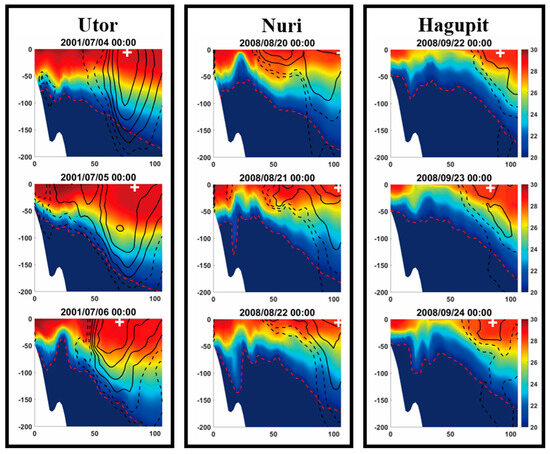
Figure 5.
Similar to Figure 4, but for the results derived from UTORIE-1 (left panel), NURIIE-1 (middle panel), and HAGUPITIE-1 (right panel).
Given the tight relationship between local wind forcing off northeastern Taiwan and consequential KI and thus sea surface cooling, we examined the local wind forcing corresponding to three typhoon passages. Figure 6 shows the spatial distributions of wind forcing (wind stress, unit: N/m2) for Utor (2001), Nuri (2008), and Hagupit (2008) passages from MERRA-2. In general, wind stress shows similar patterns and moving timing during their passages. By contrast, Figure 7 shows the time-varying local wind forcing (unit: m/s) centered at the Longdong site northeast of Taiwan. Relative to Figure 6, the continuous time series of local wind forcing off northeastern Taiwan during three typhoon passages show marked differences. Among the three cases, wind forcing is relatively strong in the case of Utor. In the case of Utor, a distinct period of strong northeast wind appeared around Longdong on the first half day of 4 July. In the case of Hagupit, another period of northeast wind blowing is observed, but it is much shorter and weaker than that in the case of Utor. According to the digital typhoon information report released by CWB Taiwan, the discrepancy is attributed mainly to the different radii of maximum winds (RMWs) of three different typhoons. The RMWs of typhoons Utor, Nuri, and Hagupit were 350, 220, and 280 km, respectively, while they similarly passed the Luzon Strait. Wind forcing during Utor provides a most favorable local wind for triggering KI in northeastern Taiwan because of its wider RMWs. Referring to the tight relationship between TCNET and local wind forcing as demonstrated above, the discrepancy in RMWs among the three typhoons is likely the key reason why the three typhoons, with similar moving tracks and intensities, triggered significantly different magnitudes of cooling off northeastern Taiwan.
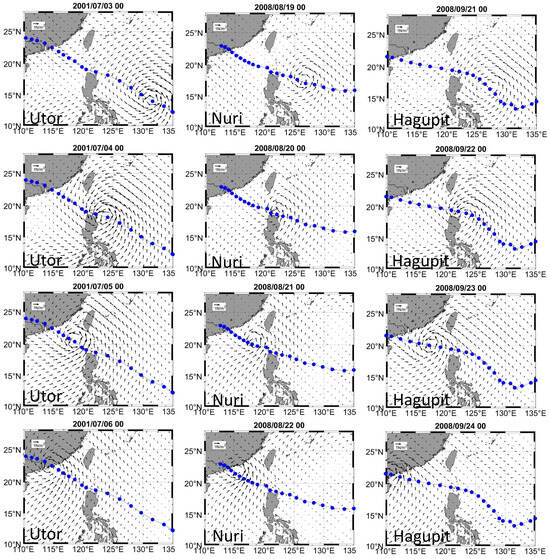
Figure 6.
Surface wind forcing (wind stress, unit: N/m2) during passages of three typhoon cases. In general, variations of wind stress corresponding to three typhoon passages show similar patterns and moving timing during their passages.
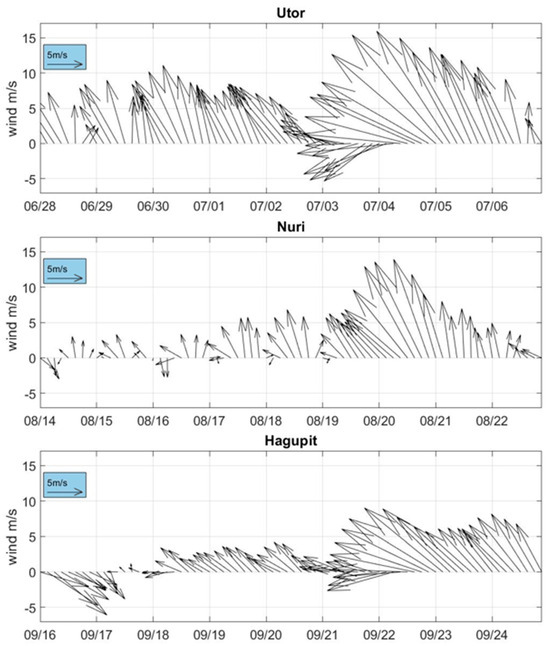
Figure 7.
Local wind measurements (unit: m/s) sampled at the Longdong site northeast of Taiwan.
4. Heat Budget Analysis (HBA)
The relationship between the dominant mechanisms leading to stronger sea surface cooling and consequential temperature variations was further examined by HBA following Glenn et al. [32]. The ROMS conservation of heat equation was used to quantify the relative contributions of the different terms responsible for the simulated distinctive sea surface cooling during the passages of three typhoons. The general conservation equation for the heat budget in ROMS is given below (Equation (1)):
with the following vertical boundary conditions for the surface (Equation (2)) and the bottom (Equation (3)), respectively:
where T is the temperature, u, v, w are the three components of velocity. kH and kZ are the horizontal and vertical diffusivity coefficients; DT is the horizontal mixing term. Qnet is the net surface heat flux, is the density of seawater, Cp is the specific heat capacity of seawater, and h is the depth. Here, the residual is related to the slightly different temporal integrating intervals, time-varying vertical s-coordinate used in ROMS, and influence of friction [32].
Figure 8, Figure 9 and Figure 10 display the evolutions of separate terms in Equation (1) from the surface to 80 m depth at the model grid closest to the maximum sea surface cooling (25.09° N, 122° E). Because the results of EXPTIDE include many high-frequency fluctuations, it will be difficult to elucidate the main cooling mechanisms through HBA directly (see Figures S2–S4 in SM). Thus, to simplify the problem, at the present stage, only the results of EXPSTD were applied in HBA (Figure 8, Figure 9 and Figure 10), and the influence of tidal forcing will be discussed in a separate section (Section 4.1). Nevertheless, we compared the results of the HBA of EXPSTD to the more complex results of EXPTIDE and found that the key cooling mechanisms show good consistency. Figure 8 shows the temperature rate of change, zonal advection, meridional advection, vertical advection, and vertical mixing terms (unit: 10−4 °C/s) during the passage of Utor. Figure 9 and Figure 10 show the same heat budgets but for the durations of the passages of typhoons Nuri and Hagupit. Notably, the horizontal mixing term is close to zero and ignored in the series analysis.
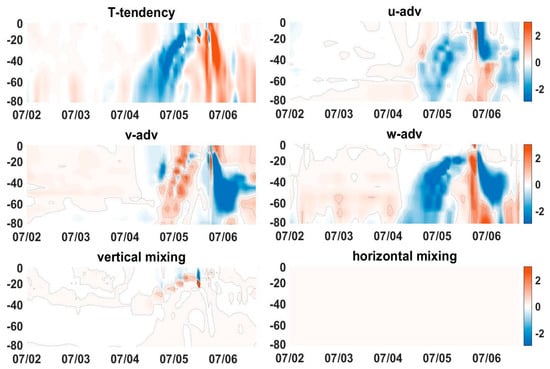
Figure 8.
Depth-time variations (Hovmoller plot) of each term (unit: 10−4 °C/s) in the HBA for the results of EXPSTD during the passage of typhoon Utor, for the model grid centered approximately closest to the maximum sea surface cooling (25.09° N, 122° E). The color shadings in blue (red) denote negative (positive) tendencies. The gray solid contours denote zero values.
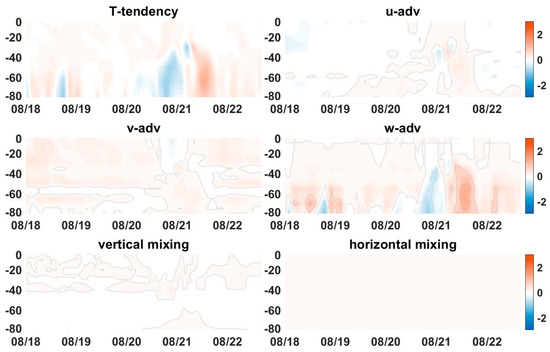
Figure 9.
Similar to Figure 8, but for the results of HBA during the passage of Typhoon Nuri.
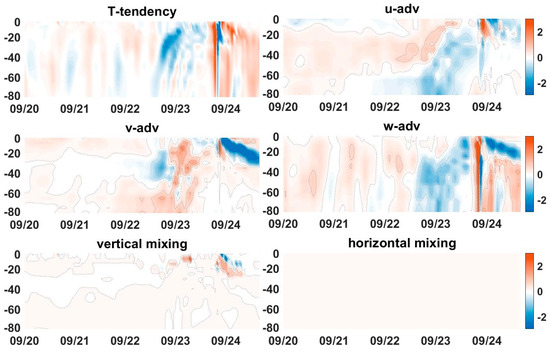
Figure 10.
Similar to Figure 8, but for the results of HBA during the passage of Typhoon Hagupit.
As shown in Figure 8, a relatively marked decrease in the surface mixed-layer temperature appears on 5 July at approximately 00:00, which shows consistent progress to the two-dimensional cross-transects in Figure 4. In addition, the influence of vertical advection () appears to dominate the cooling tendency that originated from deeper layers in all three cases, despite the individual discrepancies in the three cases. Meanwhile, the gradual uplift of deep cold water tied to vertical advection (upwelling) shows consistency with the uplift of cold water shown in the cross-transects (Figure 4). Overall, during this period, the uplift of cold water from deeper regions provides a favorable cold water source for the later entrainment/vertical mixing associated with strong wind forcing, carried by the typhoon’s passage. Meanwhile, u-advection, which is also related to the onshore-ward movement of KC (due to KI), plays a secondary role in enhancing the cooling process, particularly for KI-driven coolings (e.g., the cases of Utor and Hagupit). By contrast, the warming after the TC passage was attributed also to KI. Because cooperating with the background vertical temperature gradient, the first half of KI (uplift of colder water from deeper layer) would lead to significant cooling (e.g., 12:00 4 July to 00:00 5 July). By contrast, as the KI weakens, the synergy of the vertical temperature gradient and the falling of waters would lead to warming in the water column.
4.1. How Tidal Forcing Enhances the Cooling Process
As mentioned above, the inclusion of tidal forcing systematically enhances the coolings and improves the simulations of these coolings. Figure 11 shows individual terms in heat budget analysis from the surface to 80 m depth at the same position but for the component of tidal residual to better understand how tidal forcing enhances the cooling process. Tidal residuals are low-frequency components resulting from high-frequency oscillations caused by tides; during half of an irreversible tidal cycle, floodwaters lift and mix cold waters with surface waters; during the other half, the ebb does not return these waters back to their original positions [33]. The tidal residual field was retrieved by subtracting the results of EXPSTD from those of EXPTide. Thereafter, a 42 h low-pass filter was applied to the residuals to remove the high-frequency signals of tidal oscillations (e.g., Ko et al. [33]; Zheng and Chen [19]).
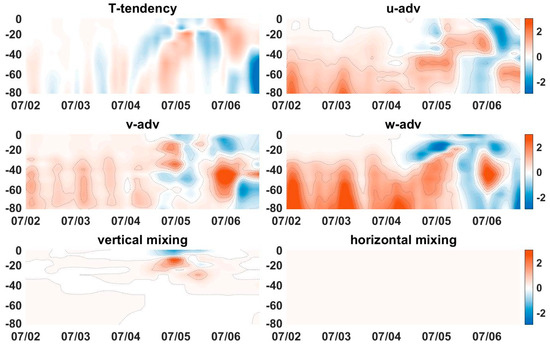
Figure 11.
Depth-time variations of the individual term (unit: 10−4 °C/s) in the heat budget analysis for the model grid centered at 122° E, 25.09° N but for the component of tidal residual. The color shadings in blue (red) denote negative (positive) tendencies. The gray solid contours denote zero values.
The case of Utor was chosen for demonstration because it showed the largest improvement among the three examples (Figure 3). Figure 11 shows that the effect of tidal residual leads to a stronger upper layer cooling (0–35 m) and sublayer warming tendencies through mainly vertical advection (T-tendency and vertical advection terms in Figure 11). This result implies that tidal residual current essentially enhances the sea surface coolings through enhanced vertical advection. He et al. [34] emphasized that seawater stratification is stronger in simulations that do not incorporate tides. Strong stratification will prevent the heat flux from being transferred downward, which leaves more heat flux in the mixed layer. Our results, which demonstrate alternating cooling and warming between the upper and lower layers, exhibit a high level of consistency with their findings, which implies that the tidal residual plays a key role in the stratification and thus the vertical advection-driven sea surface cooling (Figure 11). In addition, the effect of Utor is particularly important when compared with those of the other cases (see Figures S5 and S6 in SM) due to the stronger vertical mixing term associated with Utor, which is related to its strong momentum influx into the upper ocean (Figure 6 and Figure 7). This analysis helps explain how tide enhances the cooling process. Wang et al. [35] indicated that upwelling strength in the mixed layer will be underestimated, while that below the mixed layer will be overestimated in their simulation without tidal forcing. Their results also indirectly confirm our inference.
5. Other Influencing Factors
5.1. Influence of Different Tidal Phases
Li et al. [36] used observational data to study the current field northeast of Taiwan and emphasized that tides greatly influence the currents in this area. The semi-diurnal tide changes twice a day. The ebb flow heads toward the southeast, and the flood flow moves toward the northwest. Figure 12a,b shows that the ROMS-simulated horizontal current velocity changes with depth during the passage of Utor in UTORSTD and UTORTIDE, respectively. The red lines denote the variations in sea surface heights during typhoon passages. Overall, in the Longdong area, currents shallower than 50 m are affected mainly by the tides and part of the TSC flowing toward the southeast along the northern coast of Taiwan. By contrast, currents below 50 m are dominated by alternative tides (ebb toward the southeast and flood toward the northwest) as observed in Li et al. [36].
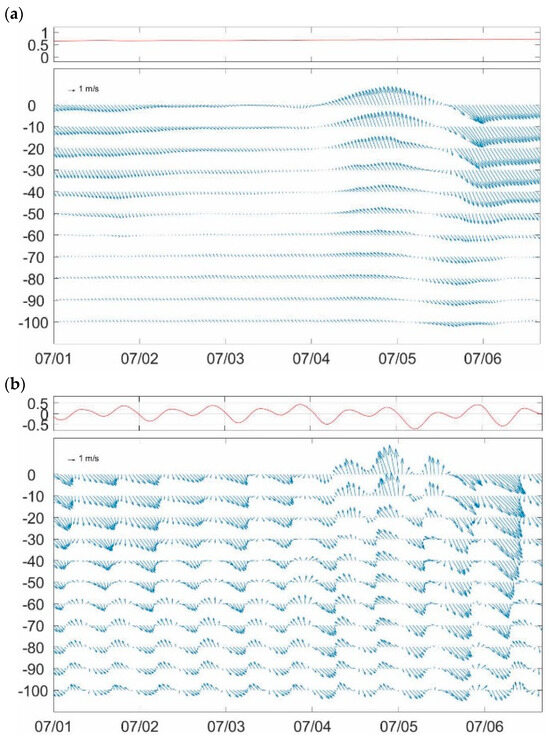
Figure 12.
Model-simulated current responses (blue arrows) centered at 25.09° N, 122° E at different depths during the passage of Utor for experiments (a) UTORSTD and (b) UTORTIDE, respectively. The red lines (upper panels) denote the variations in sea surface heights during typhoon passage.
The simulation results of UTORSTD (Figure 12a) show that, as the typhoon gradually approaches Taiwan, the TSC gradually weakens due to the influence of the peripheral wind forcing (Figure 6). Subsequently, the typhoon forces the KI into the ECS, which causes the northern current to appear in the upper layer (0–60 m) around Longdong. Therefore, as the typhoon enters the north South China Sea (SCS) and gradually moves away from Taiwan, the KI weakens and southeastward TSC enhances again. Referring to the simulation of UTORTIDE (Figure 12b), the KI can also be observed in the simulations. In addition, the currents are affected strongly by the alternative ebb and flood. Compared with the results of UTORSTD (Figure 12a), the northwestward and northward currents increase during floods (e.g., July 4 at 00:00–July 5 at 12:00). According to the theory proposed by Tomczak and Godfrey [37], the stronger northward current would more significantly drive the cold water uplift. By contrast, ebb flow (toward the southeast) offsets the northward currents, which would inhibit the uplift of cold water.
5.2. Influence of Taiwan Strait Current
When a typhoon passes through the southern part of the Luzon Strait, the wind forcing of its north flank (eastern wind) could drive part of the current to the west and invade into the north SCS (color panels in Figure 13). The current response to typhoon passage can be observed also in the variations in volume transports across certain transects. Figure 13a shows the transects (red bars) for volume transport (unit: Sv) calculations (from surface to 100 m) at the Luzon Strait (bar-A) and Taiwan Strait (bar-B) during the passage of Utor. Figure 13b shows the variations in volume transports passing through the Luzon Strait (left panel) and Taiwan Strait (right panel).
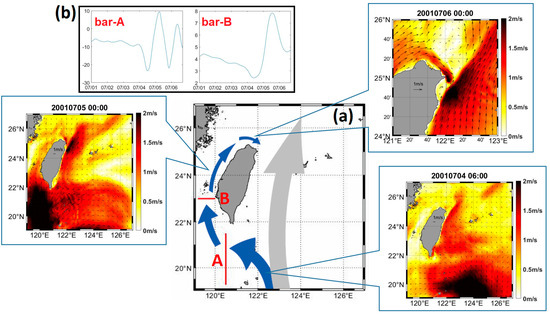
Figure 13.
(a) Transects (red bars) for volume transport calculations (from surface to 100 m) at the Luzon Strait and (bar-A) Taiwan Strait (bar-B) during typhoon passage. (b) Variations in volume transports (unit: Sv) passing through the Luzon Strait (left panel) and the Taiwan Strait (right panel) during the passage of Utor. The color panels surrounding Figure 10a denote sea surface current responses during the passage of Utor, including current speed in color shading (unit: m/s) and current directions in arrows.
Referring to the variations in volume transport passing through bar-A (across the Luzon Strait), the volume transport became negative, which implies westward flows. Some of the water from the northern SCS then flowed northward into the Taiwan Strait. Meanwhile, the northward current velocity in the Taiwan Strait increased significantly (color panels in Figure 13), and the northward volume transport passing through bar-B increased simultaneously (Figure 13b). Subsequently, the enhanced TSC passing through the Penghu channel flows along the northwestern and northern coast of Taiwan and heads to the Longdong area eventually, which caused the upper layer (with a depth of about 0–50 m) currents around Longdong to move southeast consequentially (color panels in Figure 13). The same signal of TSC moving toward the southeast around Longdong can be observed also in Figure 12 and Figure 6a in Chang et al. [38]. A specific mechanism driving TSC to invade southeastward toward Longdong during the southwesterly wind can be observed in Chang et al. [38]. Subsequently, these warmer TSC waters would partially inhibit the KI and thus accelerate the recovery of TCNET around Longdong to the original water temperature prior to typhoon passage. Overall, typhoons passing through the Luzon Strait surprisingly lead to TCNET by triggering KI. These typhoons also help the recovery of TCNET by modifying the currents in the Luzon Strait and Taiwan Strait sequentially.
5.3. Influence of Different Initial Oceanic Environments (Upper Ocean Thermal Structures)
Two more idealized experiments were executed to further clarify whether the initial field of the ocean will affect the cooling. They are idealized experiments 2 and 3 (UTORIE-2 and UTORIE-3), which were accomplished by replacing the oceanic environment (initial condition) in the simulation of Utor with the initial fields of Nuri and Hagupit, respectively. Meanwhile, other configurations were set to be consistent with UTORTIDE (Table 1). Figure 14 shows the simulated variations in SST in UTORTIDE, UTORIE-2, and UTORIE-3. The lowest temperatures in individual simulations are 21, 21.4, and 21.7 °C in experiments UTORTIDE, UTORIE-2, and UTORIE-3, respectively. In other words, despite marked discrepancies in the individual oceanic environments corresponding to the three typhoons (evident in the initial temperature transects prior to typhoon passages, as shown in Figure 4), the simulated SST variations exhibit very similar patterns. This finding implies that the influences resulting from different initial states of the ocean on TCENT are limited.
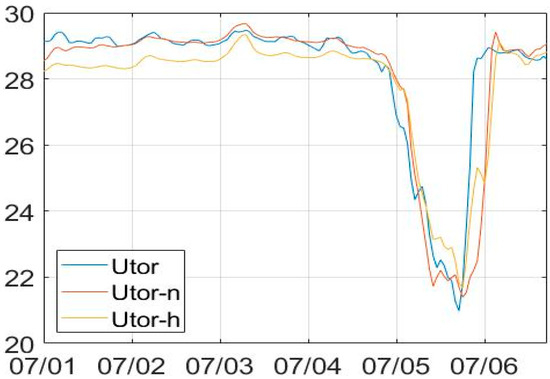
Figure 14.
Time series of simulated SST variations centered at 25.09° N, 122° E in UTORTIDE (blue line), UTORIE-2 (red line), and UTORIE-3 (yellow line).
Overall, the results suggest that the effect of the initial oceanic fields on the cooling of this area is relatively limited when compared with the general ocean cooling that occurs in the open ocean (the thermal structure plays an important role in subsequent generation and variation in cooling). This situation once again shows the dominating role played by wind forcing and wind-driven KI in TCNET. However, cooling within this region is demonstrated to be affected also by other factors, such as different tidal phases and TSC states.
6. Conclusions
On the basis of long-term in situ measurement of SST by a temperature meter mounted on moored buoys located northeast of Taiwan, this study investigates the long-term coastal SST cooling responses to TC passages around Taiwan from 2001 to 2020. Previous studies indicated that the moving track plays a dominant role in determining the cooling magnitude of this area. However, in the past 20 years, three historic typhoons passing through the Luzon Strait with similar moving paths and intensities have been found to trigger markedly different magnitudes of sea surface cooling off northeastern Taiwan. They are typhoons Utor (2001), Nuri (2008), and Hagupit (2008), which resulted in maximum SST cooling temperatures of 8.8, 2.7, and 1.4 °C, respectively, during their passages.
The drastic cooling discrepancy implies that existing understandings of the key mechanism leading to TCNET could be insufficient. Obviously, the three typhoon cases provide a rare and valuable opportunity for obtaining a more comprehensive understanding of the generation and variations in TCNET. ROMS was used here to reconstruct the background environment corresponding to three typhoon passages. In addition, the design and execution of a series of idealized experiments and heat budget analysis helped elucidate the influences of different physical processes on individual cooling in three typhoon passages. An advanced understanding of TCNET relative to existing studies is summarized as follows. First, KI leads to stronger sea surface cooling by enhancing the vertical advection and u-advection. The inclusion of tidal forcing enhances sea surface cooling by mainly improving the vertical advection tied to a process of de-stratification by tidal mixing. Different RMWs among three typhoons with similar intensities and moving tracks are found to be responsible for the differences in local wind measurements and consequential cooling discrepancy. Different tidal phases and TSC strengths are also demonstrated to influence KI and the consequential upwelling of subsurface cold water.
In addition to the more comprehensive discussion on the factors influencing the generation of TCNET given above, factors related to the recovery of TCNET (decrease in TCNET) are also presented in this study. During the typhoon passages, the typhoons were shown to affect the currents in the SCS and the Taiwan Strait. Wind forcing of the north flank of these typhoons drives part of the current to the west and invades the north SCS when they pass through the south part of the Luzon Strait. Therefore, some of the water flowing into the northern SCS flowed northward into the Taiwan Strait. Subsequently, the enhanced TSC passing through the Penghu channel flows along the northwestern and northern coast of Taiwan and heads to the Longdong area eventually. The warmer TSC waters partially inhibit the KI and accelerate the recovery of TCNET around Longdong. This process is particularly interesting because, on the one hand, the typhoons passing through the Luzon Strait contribute to TCNET by triggering KI; on the other hand, they decrease the TCNET by modifying the currents in the Luzon Strait and Taiwan Strait sequentially.
Supplementary Materials
The following supporting information can be downloaded at: https://www.mdpi.com/article/10.3390/atmos15060663/s1, Figure S1: Latitudinal transects (from 121.93°E to 123.00°E, along 25.09°N) of temperature (°C, color shading) and the position where KC passed through simulated in UTORSTD (left panel), NURISTD (middle panel), and HAGUPISTD (right panel). The position of KC was defined by outlines with northward current speeds greater than 50 cm/s (contours of 50 and 70 cm/s: dashed lines, contours above 90 cm/s: solid lines). The dashed-red contours denote 20 °C isotherms and the white cross indicates where the meridional current speed is strongest along the transect. Figure S2: Depth-time variations (Hovmoller plot) of each term (unit: 10−4 °C/s) in the HBA for the results of EXPSTD during the passage of typhoon Utor, for the model grid centered approximately closest to the maximum sea surface cooling (25.09°N, 122°E). The color shadings in blue (red) denote negative (positive) tendencies. The gray solid contours denote zero values. Figure S3: Similar to Figure S2, but for the results of HBA during the passage of Typhoon Nuri. Figure S4: Similar to Figure S2, but for the results of HBA during the passage of Typhoon Hagupit. Figure S5: Similar to Figure 11, but for the results during the passage of typhoon Nuri. Figure S6: Similar to Figure 11, but for the results during the passage of typhoon Hagupit.
Author Contributions
Z.-W.Z. and H.-J.W. conceived and designed the study. Z.-W.Z. contributed to English editing. Z.-W.Z. and H.-J.W. completed the writing and data interpretation. Data analyses were conducted mainly by H.-J.W. All authors have read and agreed to the published version of the manuscript.
Funding
This research was funded by the National Science and Technology Council of Taiwan through grants of 108-2628-M-003-001-MY3 and 111-2611-M-003-003-MY3.
Institutional Review Board Statement
Not applicable.
Informed Consent Statement
Not applicable.
Data Availability Statement
The data presented in this study are available on request from the corresponding author The data are not publicly available due to privacy.
Acknowledgments
This work is supported by the National Science and Technology Council of Taiwan through grants of 108-2628-M-003-001-MY3 and 111-2611-M-003-003-MY3. Thanks to JTWC, the Central Weather Bureau (Taiwan), and COMC(NCKU) for providing the essential data sets. Thanks also go to the scientific teams of HYCOM and ROMS.
Conflicts of Interest
The authors declare no conflicts of interest.
References
- Price, J.F. Upper ocean response to a hurricane. J. Phys. Oceanogr. 1981, 11, 153–175. [Google Scholar] [CrossRef]
- Schade, L.R.; Emanuel, K.A. The ocean’s effect on the intensity of tropical cyclones: Results from a simple coupled atmosphere ocean model. J. Atmos. Sci. 1999, 56, 642–651. [Google Scholar] [CrossRef]
- Shay, L.K.; Goni, G.J.; Black, P.G. Effects of a warm oceanic feature on Hurricane Opal. Mon. Weather Rev. 2000, 128, 1366–1383. [Google Scholar] [CrossRef]
- Cione, J.; Uhlhorn, E. Sea surface temperature variability in hurricanes: Implications with respect to intensity change. Mon. Weather Rev. 2003, 131, 1783–1796. [Google Scholar] [CrossRef]
- Lin, I.-I.; Liu, W.T.; Wu, C.-C.; Wong, G.T.F.; Hu, C.; Chen, Z.; Liang, W.-D.; Yang, Y.; Liu, K.-K. New evidence for enhanced ocean primary production triggered by tropical cyclone. Geophys. Res. Lett. 2003, 30, 1718. [Google Scholar] [CrossRef]
- Babin, S.M.; Carton, J.A.; Dickey, T.D.; Wiggert, J.D. Satellite evidence of hurricane-induced phytoplankton blooms in an oceanic desert. J. Geophys. Res. Oceans 2004, 109, C03043. [Google Scholar] [CrossRef]
- Siswanto, E.; Ishizaka, J.; Yokouchi, K.; Tanaka, K.; Tan, C.K. Estimation of interannual and interdecadal variations of typhoon-induced primary production: A case study for the outer shelf of the East China Sea. Geophys. Res. Lett. 2007, 34, L03604. [Google Scholar] [CrossRef]
- Lin, I.-I.; Wu, C.-C.; Pun, I.-F.; Ko, D.-S. Upper-ocean thermal structure and the western North Pacific category 5 typhoons. Part I: Ocean features and the category 5 typhoons’ intensification. Mon. Weather Rev. 2008, 136, 3288–3306. [Google Scholar] [CrossRef]
- Zheng, Z.-W.; Ho, C.-R.; Zheng, Q.; Lo, Y.-T.; Kuo, N.-J.; Gopalakrishnan, G. Effects of preexisting cyclonic eddies on upper ocean responses to Category 5 typhoons in the western North Pacific. J. Geophys. Res. Oceans 2010, 115, C09013. [Google Scholar] [CrossRef]
- Zheng, Z.-W.; Lin, I.-I.; Wang, B.; Huang, H.-C.; Chen, C.-H. A long neglected damper in the El Nino-typhoon relationship: A Gaia-like process. Sci. Rep. 2015, 5, 11103. [Google Scholar] [CrossRef]
- Kuo, Y.-C.; Zheng, Z.-W.; Zheng, Q.; Gopalakrishnan, G.; Lee, H.-Y. Typhoon-Kuroshio interaction in an air-sea coupled system: Case study of typhoon Nanmadol (2011). Ocean Model. 2018, 132, 130–138. [Google Scholar] [CrossRef]
- Mohanty, S.; Nadimpalli, R.; Osuri, K.K.; Pattanayak, S.; Mohanty, U.C.; Sil, S. Role of sea surface temperature in modulating life cycle of tropical cyclones over bay of Bengal. Trop. Cyclone Res. Rev. 2019, 8, 68–83. [Google Scholar] [CrossRef]
- Lin, J.Y.; Ho, H.; Zheng, Z.W. Improved Understanding of Typhoon-Induced Immediate Chlorophyll-A Response Using Advanced Himawari Imager (AHI) Onboard Himawari-8. Remote Sens. 2022, 14, 6055. [Google Scholar] [CrossRef]
- Mitchell, D.A.; Teague, W.J.; Jarosz, E.; Wang, W. Observed currents over the outer continental shelf during Hurricane Ivan. Geophys. Res. Lett. 2005, 32, L11610. [Google Scholar] [CrossRef]
- Teague, W.J.; Jarosz, E.; Wang, D.W.; Mitchell, D.A. Observed oceanic response over the upper continental slope and outer shelf during Hurricane Ivan. J. Phys. Oceanogr. 2007, 37, 2181–2206. [Google Scholar] [CrossRef]
- Tsai, Y.; Chern, C.S.; Wang, J. Typhoon induced upper ocean cooling off northeastern Taiwan. Geophys. Res. Lett. 2008, 35, L14605. [Google Scholar] [CrossRef]
- Morimoto, A.; Kojima, S.; Jan, S.; Takahashi, D. Movement of the Kuroshio axis to the northeast shelf of Taiwan during typhoon events. Estuar. Coast. Shelf Sci. 2009, 82, 547–552. [Google Scholar] [CrossRef]
- Zheng, Z.W.; Zheng, Q.; Gopalakrishnan, G.; Kuo, Y.C.; Yeh, T.K. Response of upper ocean cooling off northeastern Taiwan to typhoon passages. Ocean Model. 2017, 115, 105–118. [Google Scholar] [CrossRef]
- Zheng, Z.W.; Chen, Y.R. Influences of Tidal Effect on Upper Ocean Responses to Typhoon Passages Surrounding Shore Region off Northeast Taiwan. J. Mar. Sci. Eng. 2022, 10, 1419. [Google Scholar] [CrossRef]
- Doong, D.-J.; Peng, J.P.; Babanin, A.V. Field investigations of coastal sea surface temperature drop after typhoon passages. Earth Syst. Sci. Data 2019, 11, 323–340. [Google Scholar] [CrossRef]
- Large, W.G.; McWilliams, J.C.; Doney, S.C. Oceanic vertical mixing: A review and a model with a nonlocal boundary layer parameterization. Rev. Geophys. 1994, 32, 363–403. [Google Scholar] [CrossRef]
- Song, Y.; Haidvogel, D.B. A semi-implicit ocean circulation model using a generalized topography-following coordinate system. J. Comput. Phys. 1994, 115, 228–244. [Google Scholar] [CrossRef]
- Cummings, J.A. Operational multivariate ocean data assimilation. Q. J. R. Meteorol. Soc. 2005, 131, 3583–3604. [Google Scholar] [CrossRef]
- Shchepetkin, A.F.; McWilliams, J.C. Method for computing horizontal pressure-gradient force in an oceanic model with a nonaligned vertical coordinate. J. Geophys. Res. 2003, 108, 3090. [Google Scholar] [CrossRef]
- Shchepetkin, A.F.; McWilliams, J.C. The regional oceanic modeling system (ROMS): A split-explicit, free-surface, topography-following-coordinate oceanic model. Ocean Model. 2005, 9, 347–404. [Google Scholar] [CrossRef]
- Zheng, Z.-W.; Zheng, Q.; Lee, C.-Y.; Gopalakrishnan, G. Transient modulation of Kuroshio upper layer flow by directly impinging typhoon Morakot in east of Taiwan in 2009. J. Geophys. Res. Oceans 2014, 119, 4462–4473. [Google Scholar] [CrossRef]
- Shen, D.; Li, X.; Wang, J.; Bao, S.; Pietrafesa, L.J. Dynamical ocean responses to Typhoon Malakas (2016) in the vicinity of Taiwan. J. Geophys. Res. Oceans 2021, 126, e2020JC016663. [Google Scholar] [CrossRef]
- Flather, R.A. A tidal model of the northwest European continental shelf. Mem. Soc. R. Sci. Liege 1976, 10, 141–164. [Google Scholar]
- Lai, Y.-H.; Lu, C.-Y.; Zheng, Z.-W.; Chiang, L.-C.; Ho, C.-R. Numerical Simulation of the Trajectory of Garbage Falling into the Sea at the Coastal Landfill in Northeast Taiwan. Water 2022, 14, 1251. [Google Scholar] [CrossRef]
- Egbert, G.; Erofeeva, S. Efficient inverse modeling of barotropic ocean tides. J. Atmos. Ocean. Technol. 2002, 19, 183–204. [Google Scholar] [CrossRef]
- Liang, W.D.; Tang, T.Y.; Yang, Y.J.; Ko, M.T.; Chung, W.S. Upper-ocean current around Taiwan. Deep Sea Res. Part II 2003, 50, 1085–1105. [Google Scholar] [CrossRef]
- Glenn, S.M.; Miles, T.N.; Seroka, G.N.; Xu, Y.; Forney, R.K.; Yu, F.; Roarty, H.; Schofield, O.; Kohut, J. Stratified coastal ocean interactions with tropical cyclones. Nat. Commun. 2016, 7, 10887. [Google Scholar] [CrossRef] [PubMed]
- Ko, D.S.; Chao, S.Y.; Wu, C.C.; Lin, I.I.; Jan, S. Impacts of tides and Typhoon Fanapi (2010) on seas around Taiwan. Terr. Atmos. Ocean. Sci. 2016, 27, 261–280. [Google Scholar]
- He, Z.; Yang, D.; Wang, Y.; Yin, B. Impact of 4D-Var data assimilation on modelling of the East China Sea dynamics. Ocean Model. 2022, 176, 102044. [Google Scholar] [CrossRef]
- Wang, D.; Yang, Y.; Wang, J.; Bai, X. A modeling study of the effects of river runoff, tides, and surface wind-wave mixing on the Eastern and Western Hainan upwelling systems of the South China Sea. China. Ocean Dyn. 2015, 65, 1143–1164. [Google Scholar] [CrossRef]
- Li, P.; Shi, B.; Li, Y.; Wang, S.; Lv, X.; Wang, Y.; Tian, Q. Characterization of longshore currents in southern East China Sea during summer and autumn. Acta Oceanol. Sin. 2020, 39, 1–11. [Google Scholar] [CrossRef]
- Tomczak, M.; Godfrey, J.S. Regional Oceanography: An Introduction; Elsevier: Amsterdam, The Netherlands, 1994. [Google Scholar]
- Chang, Y.-L.; Oey, L.-Y.; Wu, C.-R.; Lu, H.-F. Why are there upwellings on the northern shelf of Taiwan under northeasterly winds? J. Phys. Oceanogr. 2010, 40, 1405–1417. [Google Scholar] [CrossRef]
Disclaimer/Publisher’s Note: The statements, opinions and data contained in all publications are solely those of the individual author(s) and contributor(s) and not of MDPI and/or the editor(s). MDPI and/or the editor(s) disclaim responsibility for any injury to people or property resulting from any ideas, methods, instructions or products referred to in the content. |
© 2024 by the authors. Licensee MDPI, Basel, Switzerland. This article is an open access article distributed under the terms and conditions of the Creative Commons Attribution (CC BY) license (https://creativecommons.org/licenses/by/4.0/).