Article

Potential Strengthening of the Madden–Julian Oscillation Modulation of Tropical Cyclogenesis

1
Department of Earth and Planetary Sciences, Yale University, New Haven, CT 06511, USA
2
Scripps Institute of Oceanography, University of California San Diego, La Jolla, CA 92093 , USA
*
Author to whom correspondence should be addressed.
Atmosphere 2024, 15(6), 655; https://doi.org/10.3390/atmos15060655
Submission received: 20 April 2024 / Revised: 25 May 2024 / Accepted: 28 May 2024 / Published: 30 May 2024
(This article belongs to the Section Meteorology)

Abstract

:
A typical Madden–Julian Oscillation (MJO) generates a large region of enhanced rainfall over the equatorial Indian Ocean that moves slowly eastward into the western Pacific. Tropical cyclones often form on the poleward edges of the MJO moist-convective envelope, frequently impacting both southeast Asia and northern Australia, and on occasion Eastern Africa. This paper addresses the question of whether these MJO-induced tropical cyclones will become more numerous in the future as the oceans warm. The Lagrangian Atmosphere Model (LAM), which has been carefully tuned to simulate realistic MJO circulations, is used to study the sensitivity of MJO modulation of tropical cyclogenesis (TCG) to global warming. A control simulation for the current climate is compared with a simulation with enhanced radiative forcing consistent with that for the latter part of the 21st century under Shared Socioeconomic Pathway (SSP) 585. The LAM control run reproduces the observed MJO modulation of TCG, with about 70 percent more storms forming than monthly climatology predicts within the MJO’s convective envelope. The LAM SSP585 run suggests that TCG enhancement within the convective envelope could reach 170 percent of the background value under a high greenhouse gas emissions scenario, owing to a strengthening of Kelvin and Rossby wave components of the MJO’s circulation.

1. Introduction

The Madden–Julian Oscillation (MJO) [1,2,3] and tropical cyclones (TCs) are two of the highest impact weather phenomena in the tropics. The MJO is a 30–60 oscillation in tropical rainfall and circulations that includes a large area of enhanced moist convection that typically forms over the equatorial Indian Ocean, moves slowly eastward, and dissipates near the Dateline. After the convection dissipates, a remnant and largely dry divergent circulation continues moving eastward through the western hemisphere [4,5]. Not only does the MJO cause strong local wind and rainfall perturbations near the equator, but it also has many remote affects, modulating Indian, Asian, and American monsoons [6,7,8], TC activity around the world (discussed below), atmospheric rivers that cause flooding in the western United States [9], and even polar weather [10,11]. Tropical cyclones (TCs), which include hurricanes and typhoons, have wreaked havoc on coastal communities since time immemorial. For example, their storm surges have killed an average of roughly 13,000 people per year over the past two centuries [12], and in recent decades, individual strong storms often causes tens of billions of dollars in damage [13]. The MJO and TCs also act in tandem to affect El Niño–Southern Oscillation, which has global climate impacts [14,15].
Because of their strong societal impacts, much research has been done to determine if the MJO and TCs are intensifying in our warming climate. Multiple studies have shown that the MJO has intensified during the last century [16,17,18,19], and many models predict that MJO rainfall and/or circulations will increase during the rest of the 21st century [20,21,22,23,24,25,26,27,28], although some climate models predict little or no additional MJO intensification [29]. Observations suggest that while global TCs have become fewer in number in recent decades, storms have intensified more rapidly as the oceans have warmed, with a greater proportion reaching category 4 or 5 strength [30]. Most TC-permitting climate models predict that these trends will continue, i.e., that there will be fewer global TCs, but more intense storms during the next century [31,32,33,34]. Owing to a rising sea level, and more economic development along coastlines, TC damage is increasing significantly with time [30].
The MJO and TCs are not independent weather systems; rather, TC activity is modulated by the MJO in every basin [35,36,37,38,39,40,41,42]. In fact, many meteorologists believe that accurately modeling both the MJO and TCs on time scales of 1–4 weeks is the key to subseasonal TC forecasts, and a number of modeling groups have pursued this endeavor [43,44,45,46]. However, few if any studies have focused on the coevolution of MJOs and TCs in longterm climate prediction, and in particular asked the question that we consider in this study: will the MJO modulation of TCs change under global warming? We address this question using the Lagrangian Atmospheric Model (LAM) [47,48,49], which has been carefully tuned to simulate realistic MJO circulations, and which as we show below produces reasonable TC distributions in the MJO’s vicinity.
This study is organized as follows. Section 2 describes the LAM and the methods we use to composite MJO circulations, to decompose them into Kelvin and Rossby components and to identify TCs. In Section 3, we compare MJO modulation of TCs in a LAM control run for the current climate with that in a LAM simulation with enhanced radiative forcing for a high greenhouse gas emission scenario. Section 4 is a summary and discussion.

2. Materials and Methods

2.1. LAM Simulations

The primary source of data for this study is from two simulations conducted with the LAM, which models atmospheric circulations by predicting the motions of individual air particles [47]. The LAM has a unique convective parameterization in which vertical positions of air particles within a column are rearranged when diabatic heating causes an absolutely unstable temperature profile [48]. In convectively unstable regions, this typically leads to a handful of moist particles ascending, while the vast majority of drier particles descend around them, thereby mimicing the flow of air in and around moist convective updrafts in nature. As particles pass one another in a given model column, they are allowed to mix momentum and tracers, and it turns out that precisely specifying this mixing rate is the key to accurately simulating the MJO [48]. The LAM simulates MJOs that have realistic horizontal and vertical structures, propagation speeds and periods, and decompositions of circulations into Kelvin and Rossby wave components [25,49,50]. Moreover, as we show below, the LAM does a reasonable job of simulating patterns of tropical cyclogenesis (TCG) in the MJO’s vicinity, as well as the patterning of TCG by the MJO, which makes it a good tool for this study.
In this paper, we compare results from two LAM simulations: a control run that has prescribed SSTs observed during 1982–2019, and a second run in which SSTs and radiative forcing are characteristic of that in the late 21st century under Shared Socioeconomic Pathway (SSP) 585. For the control experiment, sea surface temperatures come from the NOAA Optimum Interpolation Version 2 dataset [51]. For the SSP585 run, we calculate a CMIP6 SSP585 multi-model mean SST linear warming trend for 2015–2100 for each ocean gridpoint, and add this perturbation to the prescribed SSTs. For example, on the equator at the Dateline the warming rate is 4K/century, so we add 4K to the prescribed SSTs at this location for the SSP585 simulation. The SST perturbation is constant with respect to time. We also modify the radiative forcing to be consistent with the SST perturbation based on the results of the Lagrangian Coupled Model run presented in [26]. The equivalent Eulerian resolution of the simulations is roughly 1 degree in latitude and longitude, with 34 vertical levels.

2.2. Creating Composite MJOs

In order to understand how the MJO modulates TCG, we create composites of MJO circulations for each of the developing, mature, and dissipating stages of the MJO convective envelope, and we examine perturbations to TCG in the frame of reference of the MJO following [52]. We identify MJOs by bandpass filtering LAM rainfall data for periods of 15–75 days, and tracking large-scale eastward-moving equatorial precipitation anomalies that traverse at least 90 degrees in longitude [26,52,53]. We define the first third of the path as the developing stage, the second third as the mature stage, and the last third as the dissipating stage. This approach identifies 164 MJOs for the 38-year long LAM control run, or 4.31 MJOs per year, which is very close to the 4.27 MJOs per year identified with the same method in observations by [52]. For the LAM SSP585 run, there are 263 MJOs, or 6.92 events per year. For each simulation, and for each stage, average circulations are constructed in the frame of reference of the MJO using all of the cases.

2.3. Kelvin/Rossby Decomposition of MJO Circulations

In order to understand the dynamical causes of the MJO’s modulation of TCG, we decompose the MJO’s first baroclinic mode circulation into its two main components: Kelvin and Rossby waves. We compute the mean tropospheric temperature T and 850 hPa minus 200 hPa zonal flow (S), and apply the projection developed by [54] to obtain the Kelvin wave component. We then subtract the Kelvin wave structure from the mean temperature and flow fields to obtain the Rossby wave component. The projection is defined as follows:
k ^ ( x ) = ( S r × T ) e y 2 / 2 2 π d y ,
where k ^ is the coefficient of the Kelvin wave projection, x is longitude, and y is non-dimensional distance from the equator, with the Kelvin-wave projected fields given by:
( S , T ) = k ^ ( x ) ( 1 , 1 / r ) e y 2 / 2 .
The non-dimensional length scale is 1100 km and we use r = 12 m/s/C. For more details on the development and testing of this projection, the reader is refered to [54].

2.4. Identifying TCs in the LAM

We identify a TC in the LAM when cyclonic vorticity exceeds 4 × 10 5 s−1, there is a warm core that lasts at least 48 h, and the maximum wind speed within a radius of about 400 km exceeds 12.5 m/s for at least 36 consecutive hours. We identify these features on a two degree Eulerian grid that is constructed by averaging velocities and temperatures of the irregularly spaced LAM particles in bins. The 12.5 m/s amplitude on the 2 degree grid roughly corresponds to the 17.5 m/s tropical storm threshold typically applied at a smaller scale. Our vorticity threshold for identifying TCs is similar to that used by [46] on a 1.5 degree grid, but the LAM generates more intense cyclones at coarse resolution than most of the models analyzed in that study.

3. Results

In this section, we begin by showing that the LAM control run produces an MJO with realistic circulations for each stage of the convective life cycle. We then show the LAM generates a reasonable TCG climatology in the region where the MJO is convectively active, and also an accurate modulation of TCG in the MJO’s vicinity. These results establish that the LAM is a suitable tool for studying how MJO modulation of TCs could change with global warming. We then compare the modulation of TCs by the MJO in the LAM control run with that in the SSP585 simulation.

3.1. Comparing Observed and Modeled MJO Circulations

In several previous studies, we showed that the LAM simulates MJOs with realistic circulations, propagation speeds, and dynamical components [25,49,50]. These studies compared modeled MJO structure to that in the observational composite MJO constructed by [53], which used a frame of reference that moved with the MJO’s convective envelope. We recently improved this composite by including additional sounding stations and using data from three times as long of a period yielding a smoother illustration of MJO circulations [52]. Moreover, in this study, we also use simplified microphysics without explicit ice processes, which reduces the information passed between nodes by 40 percent and makes the LAM run faster. For these reasons, we have elected to repeat the comparison of modeled and observed circulations, both as a prelude to studying how simulated MJO circulations affect TCG, and to verify that the modified model continues to accurately simulate MJO circulations.
Figure 1 compares the composite time-longitude series of rainfall for the LAM control run to that for the observed MJO from [52], and it also illustrates the definition of the three stages of the MJO convective envelope with colored lines. The observed (Figure 1a) and simulated MJO convective envelopes (Figure 1b) have similar amplitudes, propagation speeds, and periods. Moreover, in each case, the enhanced rainfall is preceded and trailed by eastward propagating dry anomalies (Figure 1).
The composite MJO horizontal structures for each phase of the convective envelope for both the observations and the LAM control run are shown in Figure 2. Here, we plot perturbations to average tropospheric temperature (color contours), and the difference between 850 hPa and 200 hPa wind vectors, which illustrates the first baroclinic circulation of the MJO. During the developing stage, for both the observations and the model, the troposphere is cool to the west of the MJO convective center along the equator with westery (easterly) low-level (upper-level) flow (Figure 2a,d). This is the signature of an equatorial Kelvin wave that was likely triggered by the suppressed convection to the east of the MJO, having circumnavigated the tropics [53,54]. Both the observations and the model also show a warm anomaly with easterly low-level flow developing on eastern edge of the convective envelope, as well as cool-off-equatorial Rossby gyres to the east of the MJO with anticyclonic flow (Figure 2a,d), which are also likely a response to the suppressed convection to the east of the MJO’s convective center.
During the mature stage, in both the observations and the LAM, MJO circulations resemble the classical Matsuno–Gill model [55,56] of the linear response to an equatorial heat source, with Rossby gyres on the western edge of convective envelope, and a warm phase Kelvin wave to the east (Figure 2b,e). However, this solution is not in a steady state, with the Kelvin wave growing rapidly toward the east by the dissipating stage (Figure 2c,f), consistent with [57,58]. Moreover, the Rossby gyres are centered farther off the equator than linear theory predicts (for a basic state of rest), and they move eastward along with the convective envelope instead of westward, presumably owing to basic state upper-level westerlies off of the equator. At the mature stage (Figure 2b,e), there are still remnants of the cold, off-equatorial anticyclones to the east of the MJO, as well as the cold phase Kelvin wave to the west, but these features have mostly dissipated by the dissipating stage (Figure 2c,f).
Overall, the comparison of observed and modeled MJO circulations reveals that the LAM reproduces the key features of the MJO’s circulation seen in observations in the frame of reference of the MJO’s convective envelope.

3.2. Comparing Observed and Modeled TCG

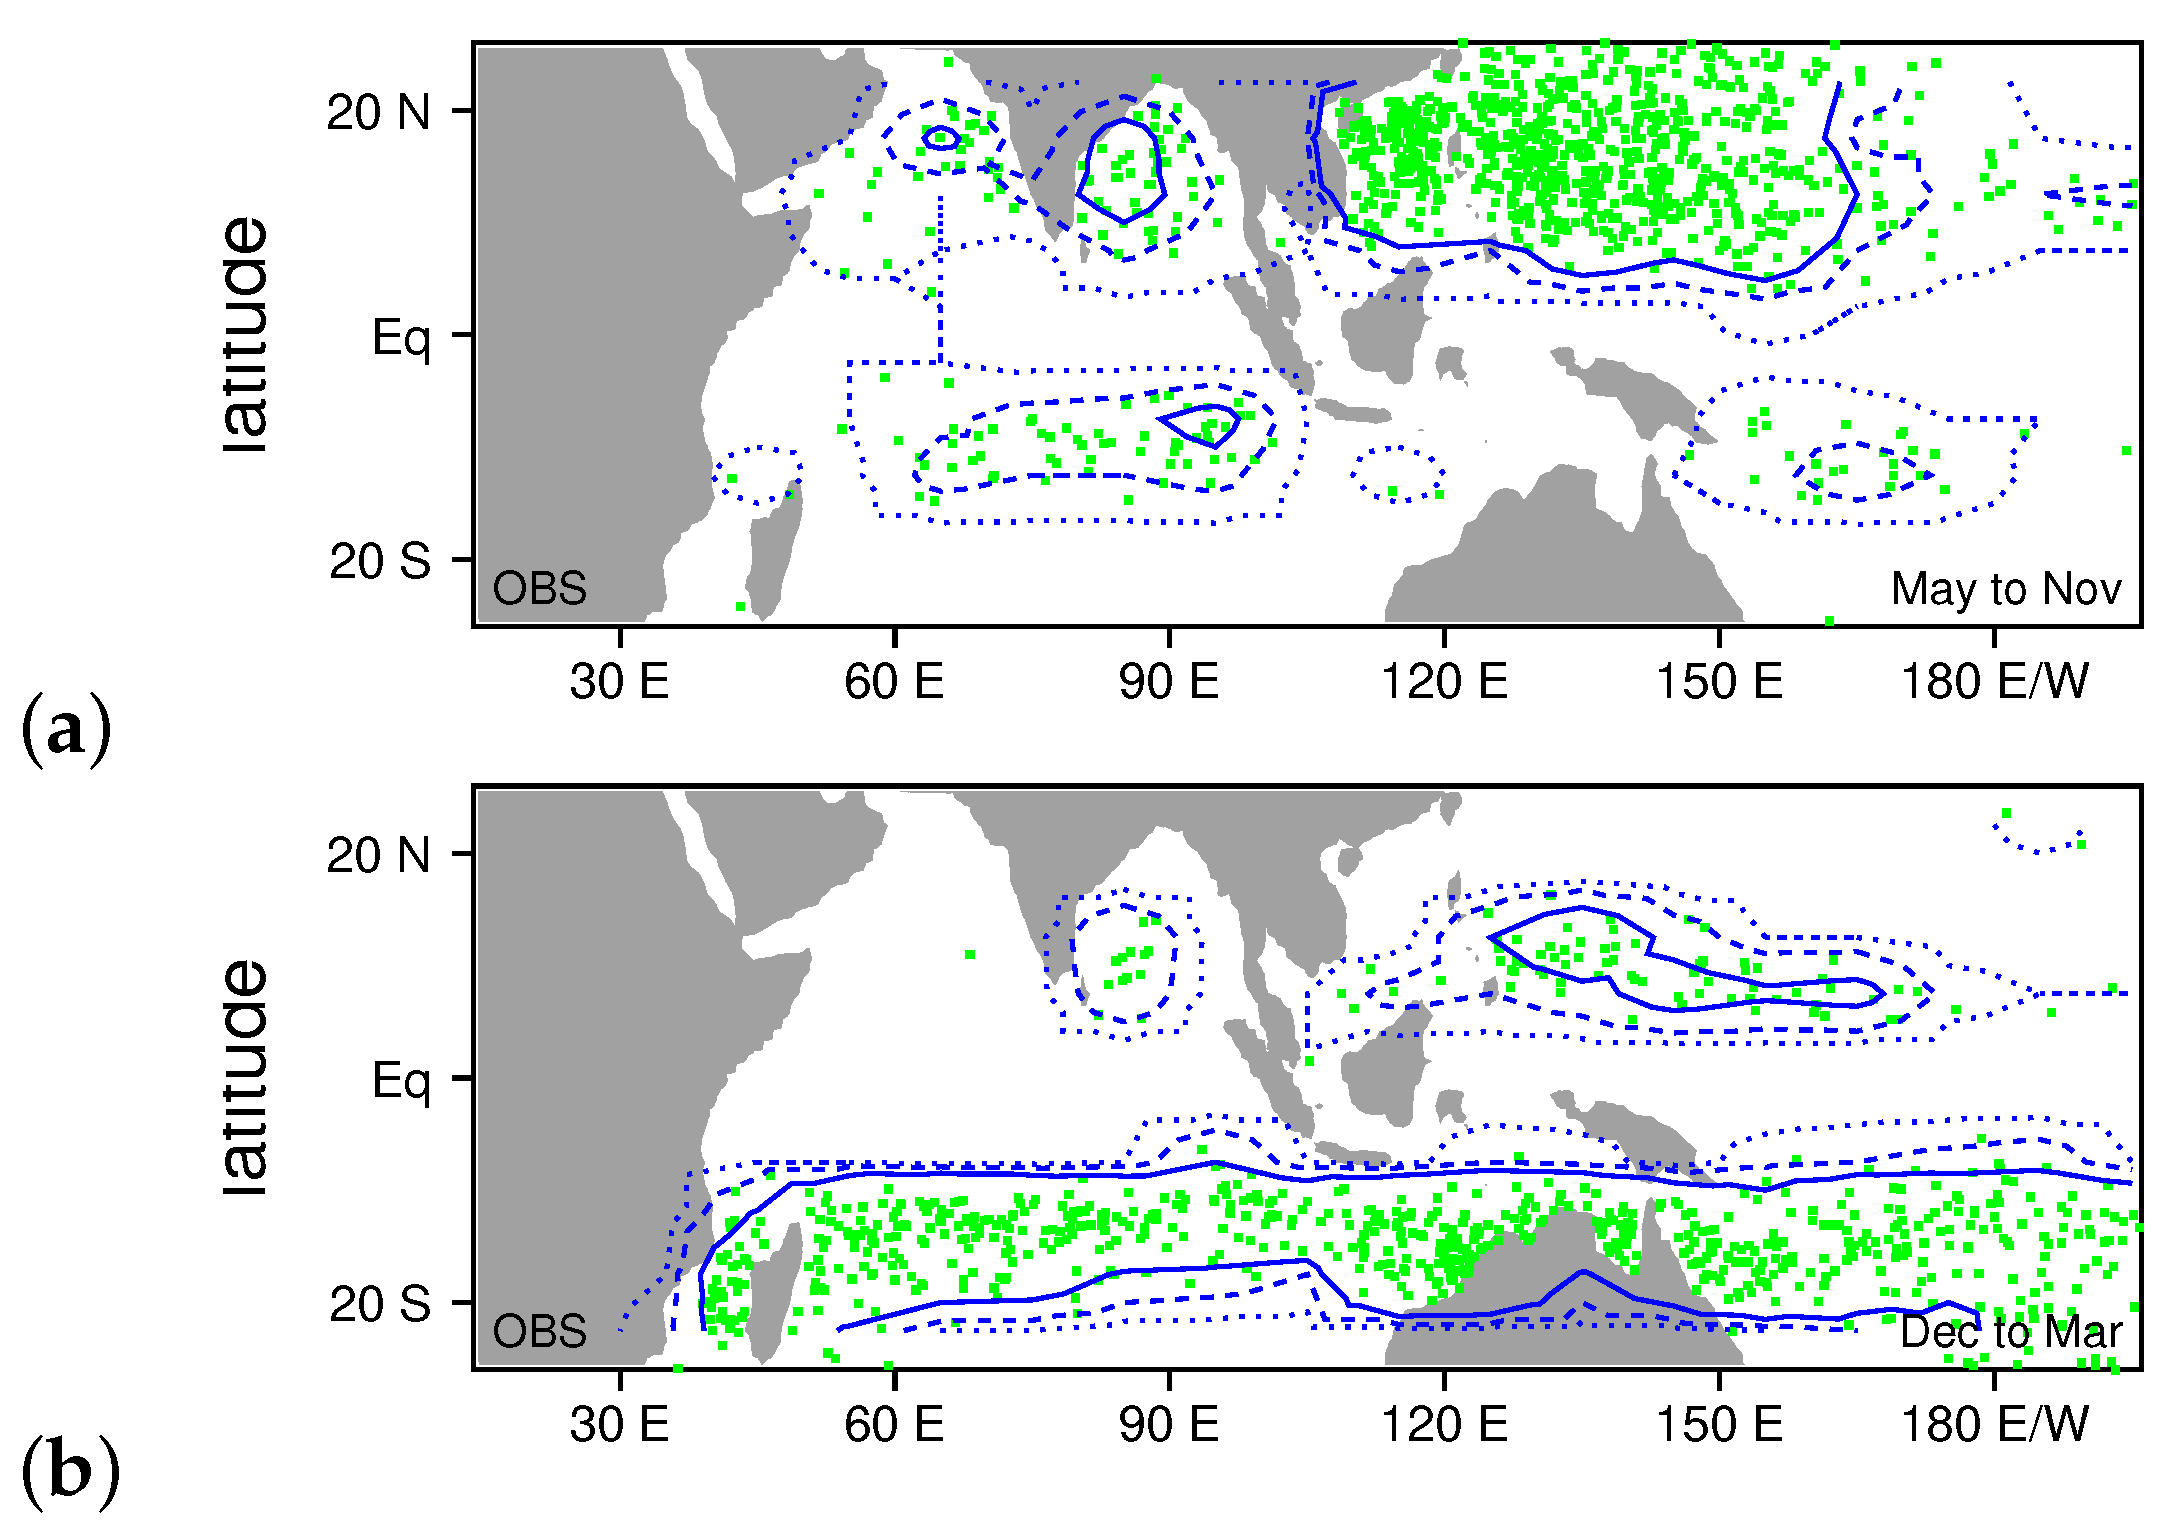
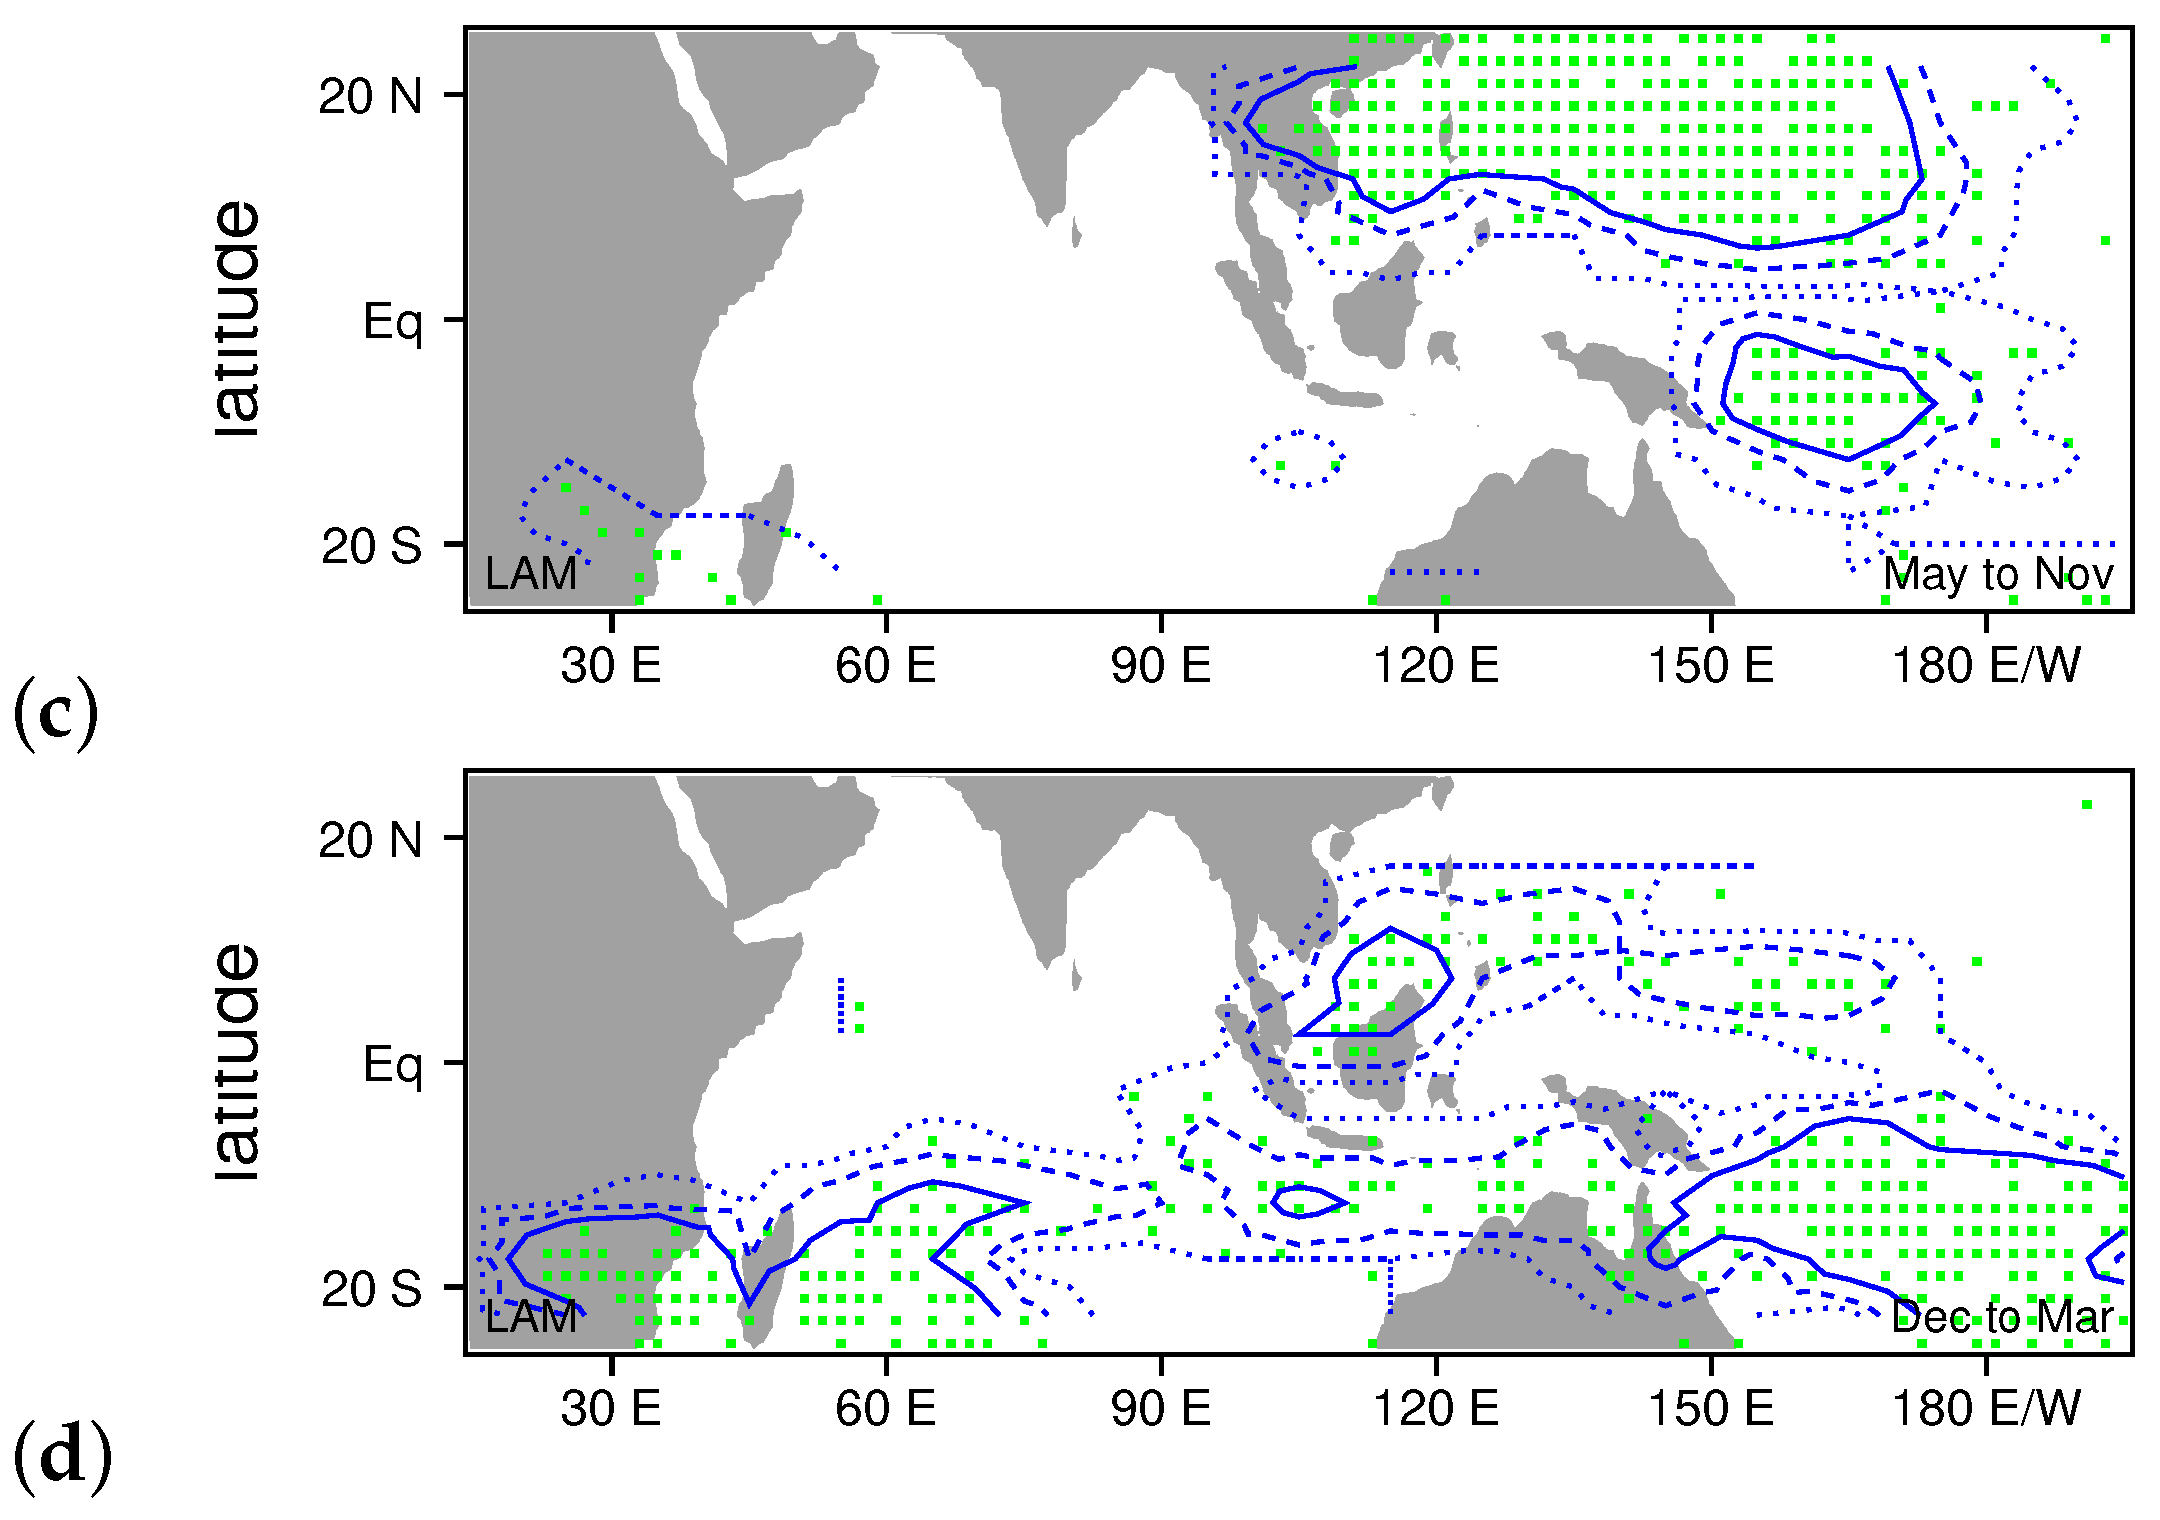
Before examining how the MJO modulates TCG in the LAM, we consider the TCG climatology in the vicinity of the MJO for both the northern and southern hemisphere tropical cyclone seasons. Figure 3a,b show observed locations of TCG (green dots) from 1979 to 2014 for May through November and December through March, respectively, with blue contours indicating regions of enhanced TCG. In the northern hemisphere season, the highest occurrence of TCG happens in a large region of the western Pacific from the east coast of Asia to about 170 E (Figure 3a). The LAM does a good job of reproducing this main region of TCG (Figure 3c). In the observations, there are also secondary regions of development northeast of Australia, near the middle of the southern Indian Ocean, and along the west and east coasts of India (Figure 3a). While the LAM generates TCG northeast of Australia, it does not produce TCG in the India Ocean in the boreal summer (Figure 3c). We are uncertain if this is due to a problem with the basic state, or a lack of precursor disturbances (especially near the coast of India). However, we do note that the bulk of the May–November TCG events occur in the Pacific, and that the LAM SSP585 run generates TCG near the coast of India (see below), so the enhancement of TCG near India is included in our analysis of changes to MJO modulation of TCG due to enhanced greenhouse gas forcing.
In the southern hemisphere tropical storm season, there is a band with high TCG between 10 and 20 S from the east coast of Africa to just east of the Dateline (Figure 3b). The LAM produces TCG across most of this band, with comparable frequencies to those observed in the eastern and western edges of the band, but somewhat lower frequency in the middle of the band. In both the observations and the model there is also a secondary region of TCG from the southeastern edge of Asia to just west of the Dateline. We conclude that for most of the region in which the MJO is convectively active, the LAM generates TCG patterns similar to those observed in nature.

3.3. Relating TCG to MJO Dynamical Components

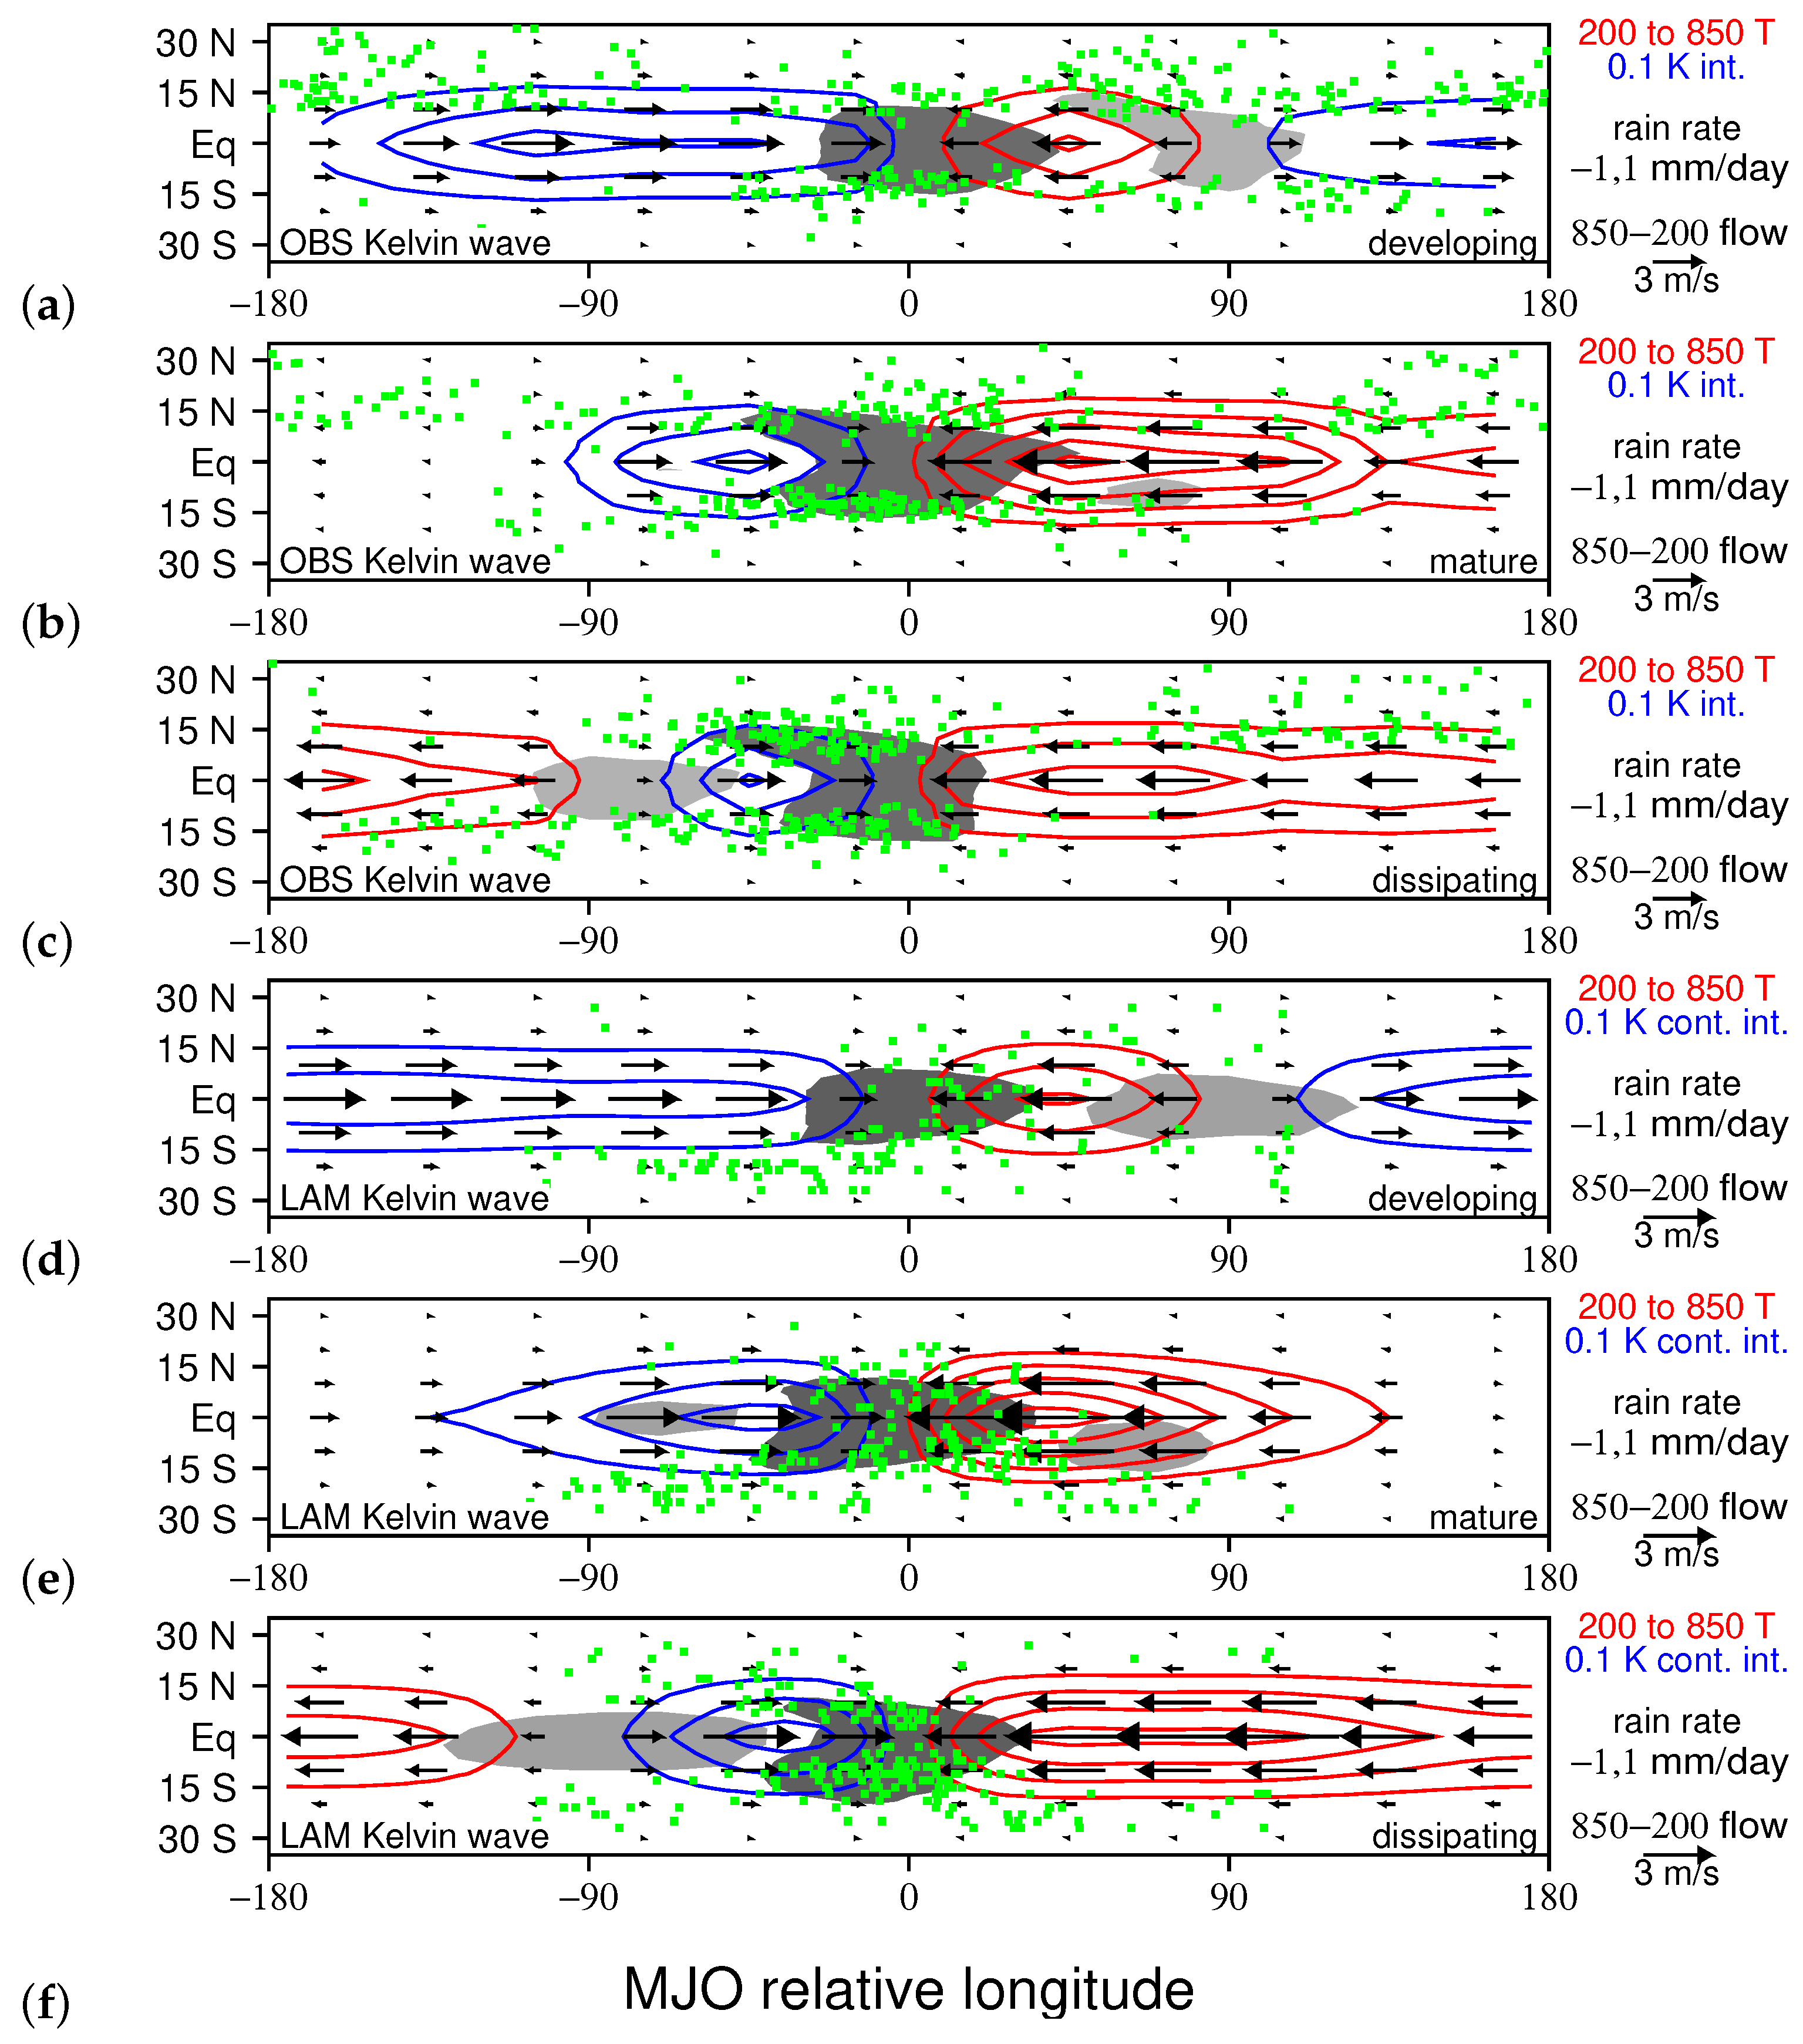
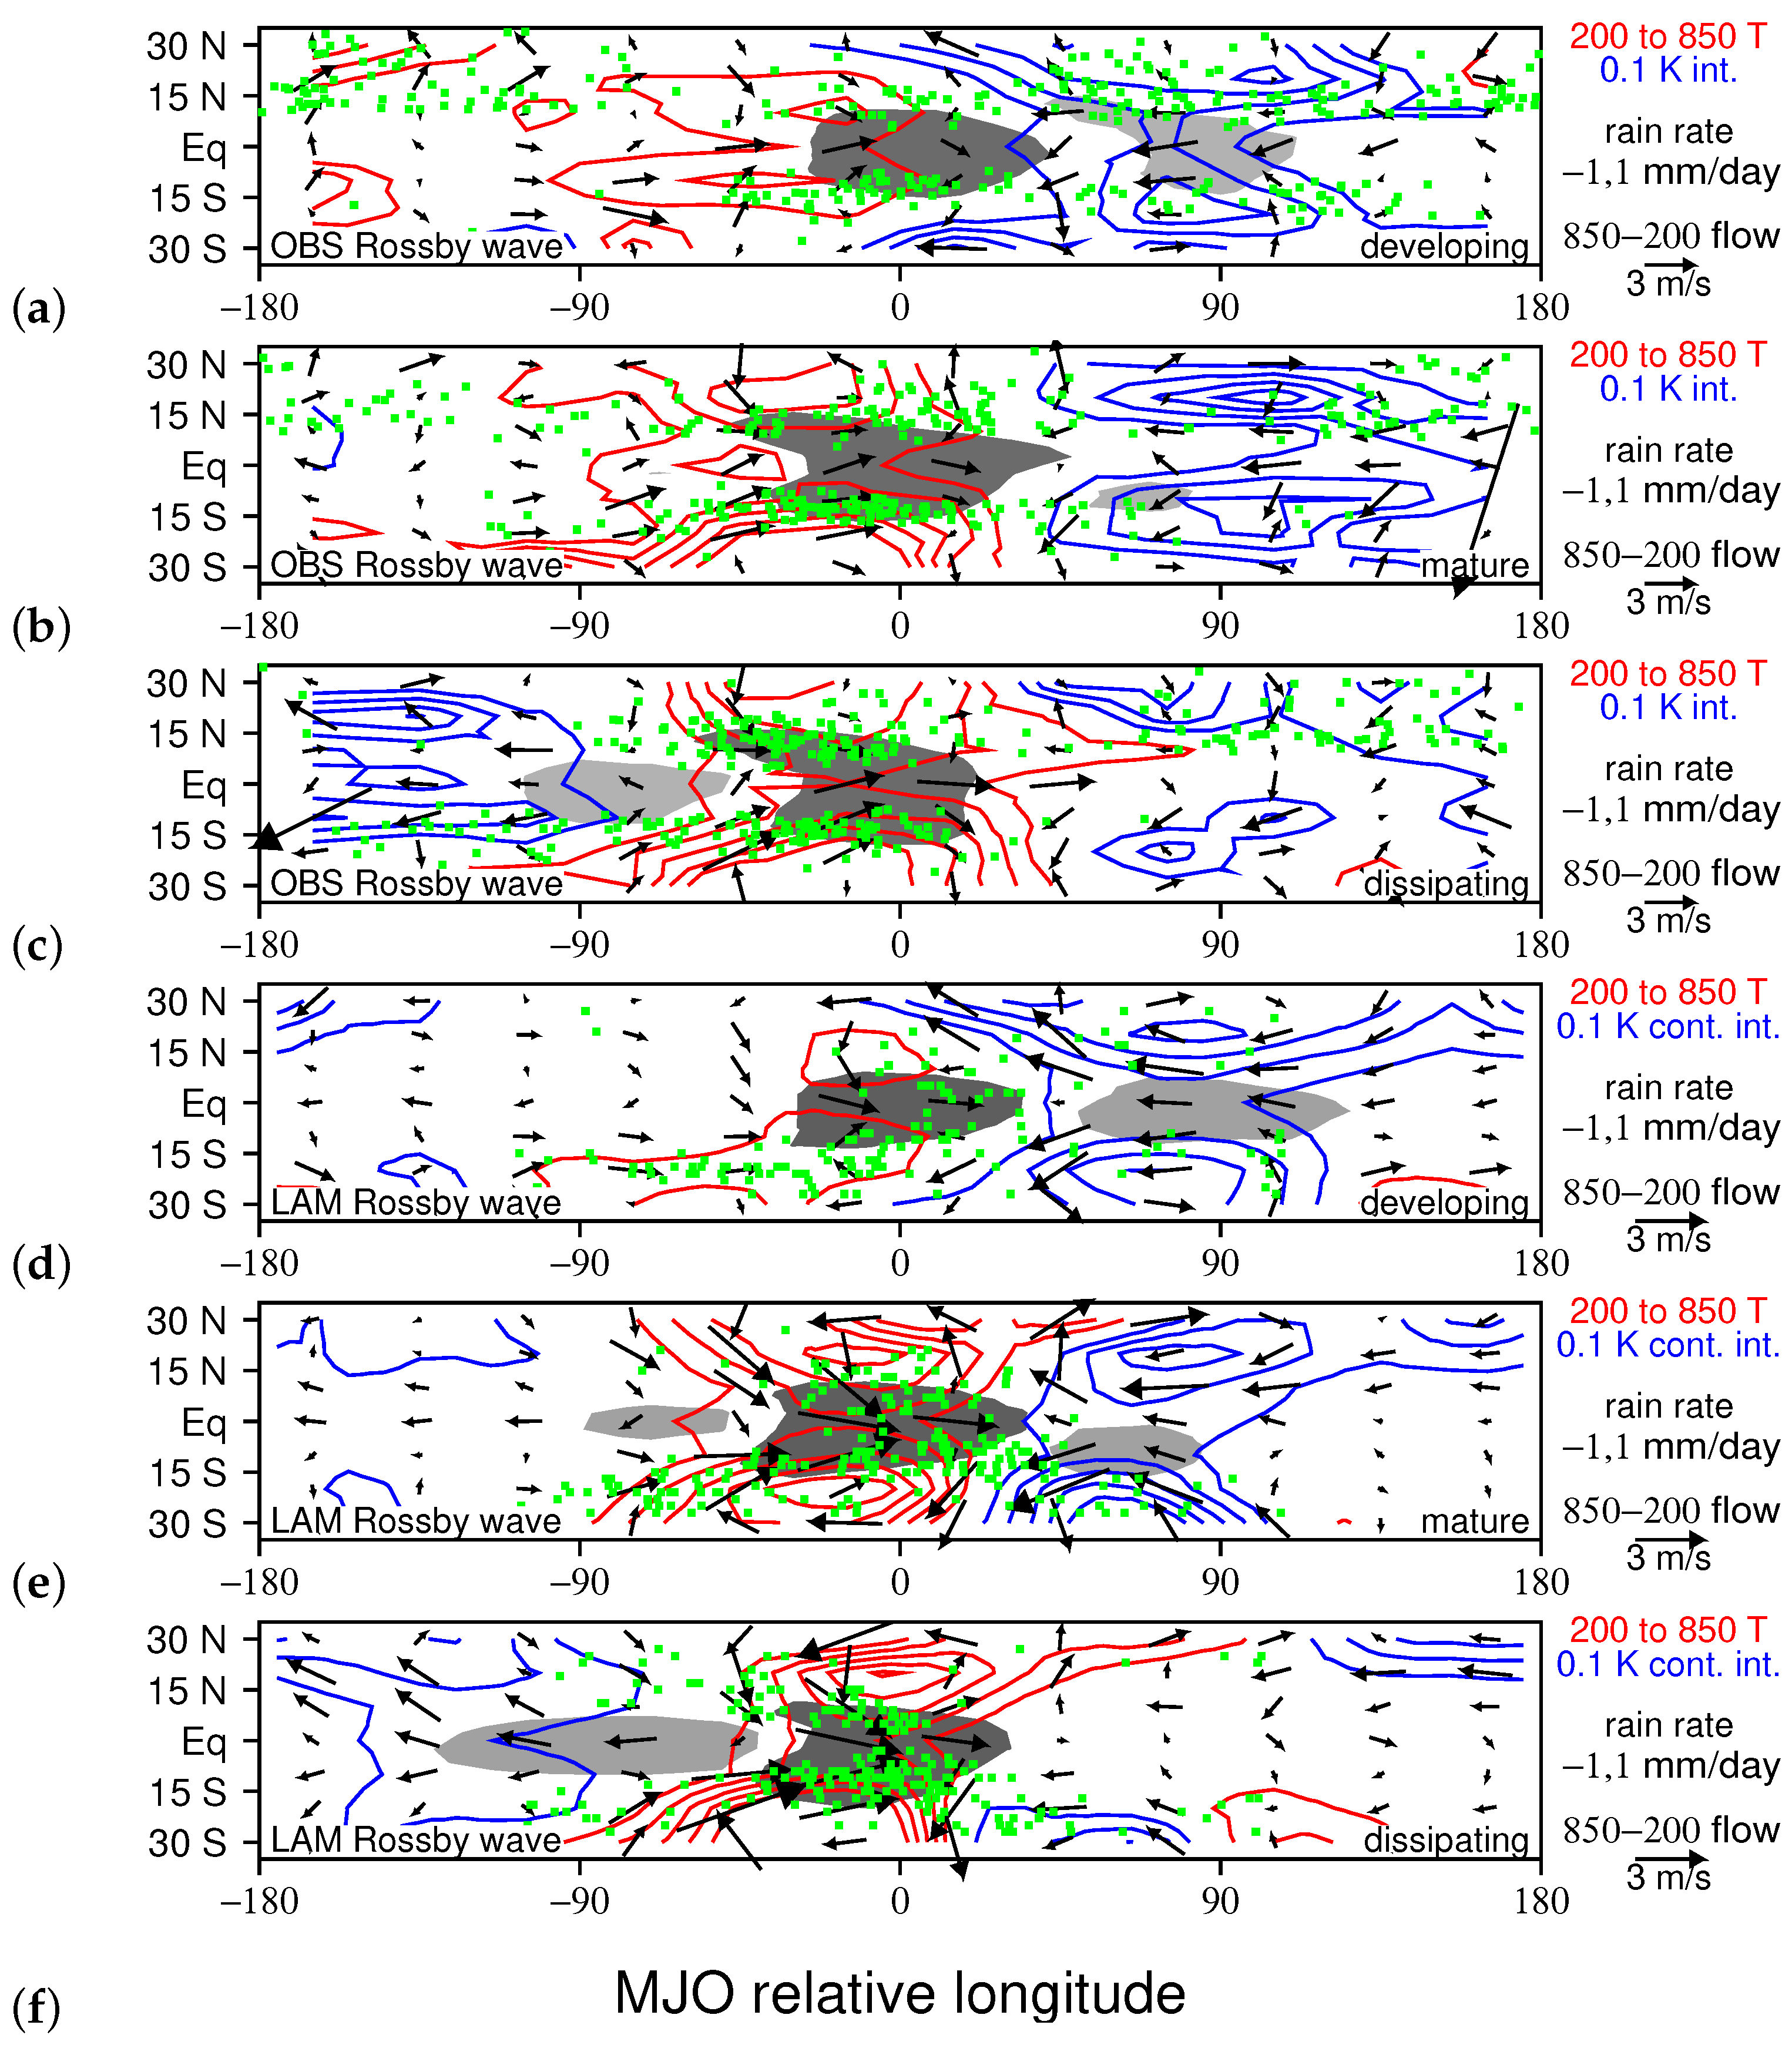
To date, we have examined LAM representations of MJO circulations and TCG independently, but we now consider their relationship. Following [52], we partition LAM MJO circulations into Kelvin and Rossby wave components, and overlay points of TCG (Figure 4 and Figure 5). Overall, the phasing and amplitude of the the MJO’s Kelvin wave circulation are quite similar in the LAM and in nature. During the developing stage a long, cool phase Kelvin wave lies to the west of the convective center, which shrinks during the mature and dissipating stages when a warm phase Kelvin wave grows eastward from the convective envelope and spreads most of the way around the world (Figure 4). The phasing and amplitude of the Rossby gyres are also similar in the LAM and in nature. During the developing stage, cool, anticyclonic gyres lie on the poleward edges of the suppressed region to the east of the MJO. They weaken over time as warm, cyclonic gyres grow on the western side of the convective envelope during the mature and dissipating stages. The main difference between the observed and modeled gyres is that the latter are slightly more intense and compact, which could be due to the denser sampling of the model data (Figure 5).
In nature, throughout the MJO’s convective life cycle TCG is enhanced in the ascending branch of the MJO’s Kelvin wave circulation (Figure 4a–c, from [52]), where the low-level westerlies lying to the west of the convective center converge with the low-level easterlies to the east of the convective center. TCG enhancement also occurs just north and south of the Kelvin wave westerlies near the western edge of the convective envelope, where there is a positive perturbation to low-level vorticity. The LAM control run also produces a high concentration of TCG events within the convective envelope centered near the convergence between Kelvin wave low-level westerlies and easterlies (Figure 4d–f). In early stages, TCG is lower in the LAM than in the observations on the northwest corner of the convective envelope, possibly due the lack of cyclones in the Indian Ocean in the LAM (Figure 4d,e). The fact that the LAM enhances TCG in the ascending branch of the Kelvin wave circulation is not surprising, since upward motion, high humidity, and a high frequency of precursor convective systems have all been associated with TCG in previous studies [35,42,59,60].
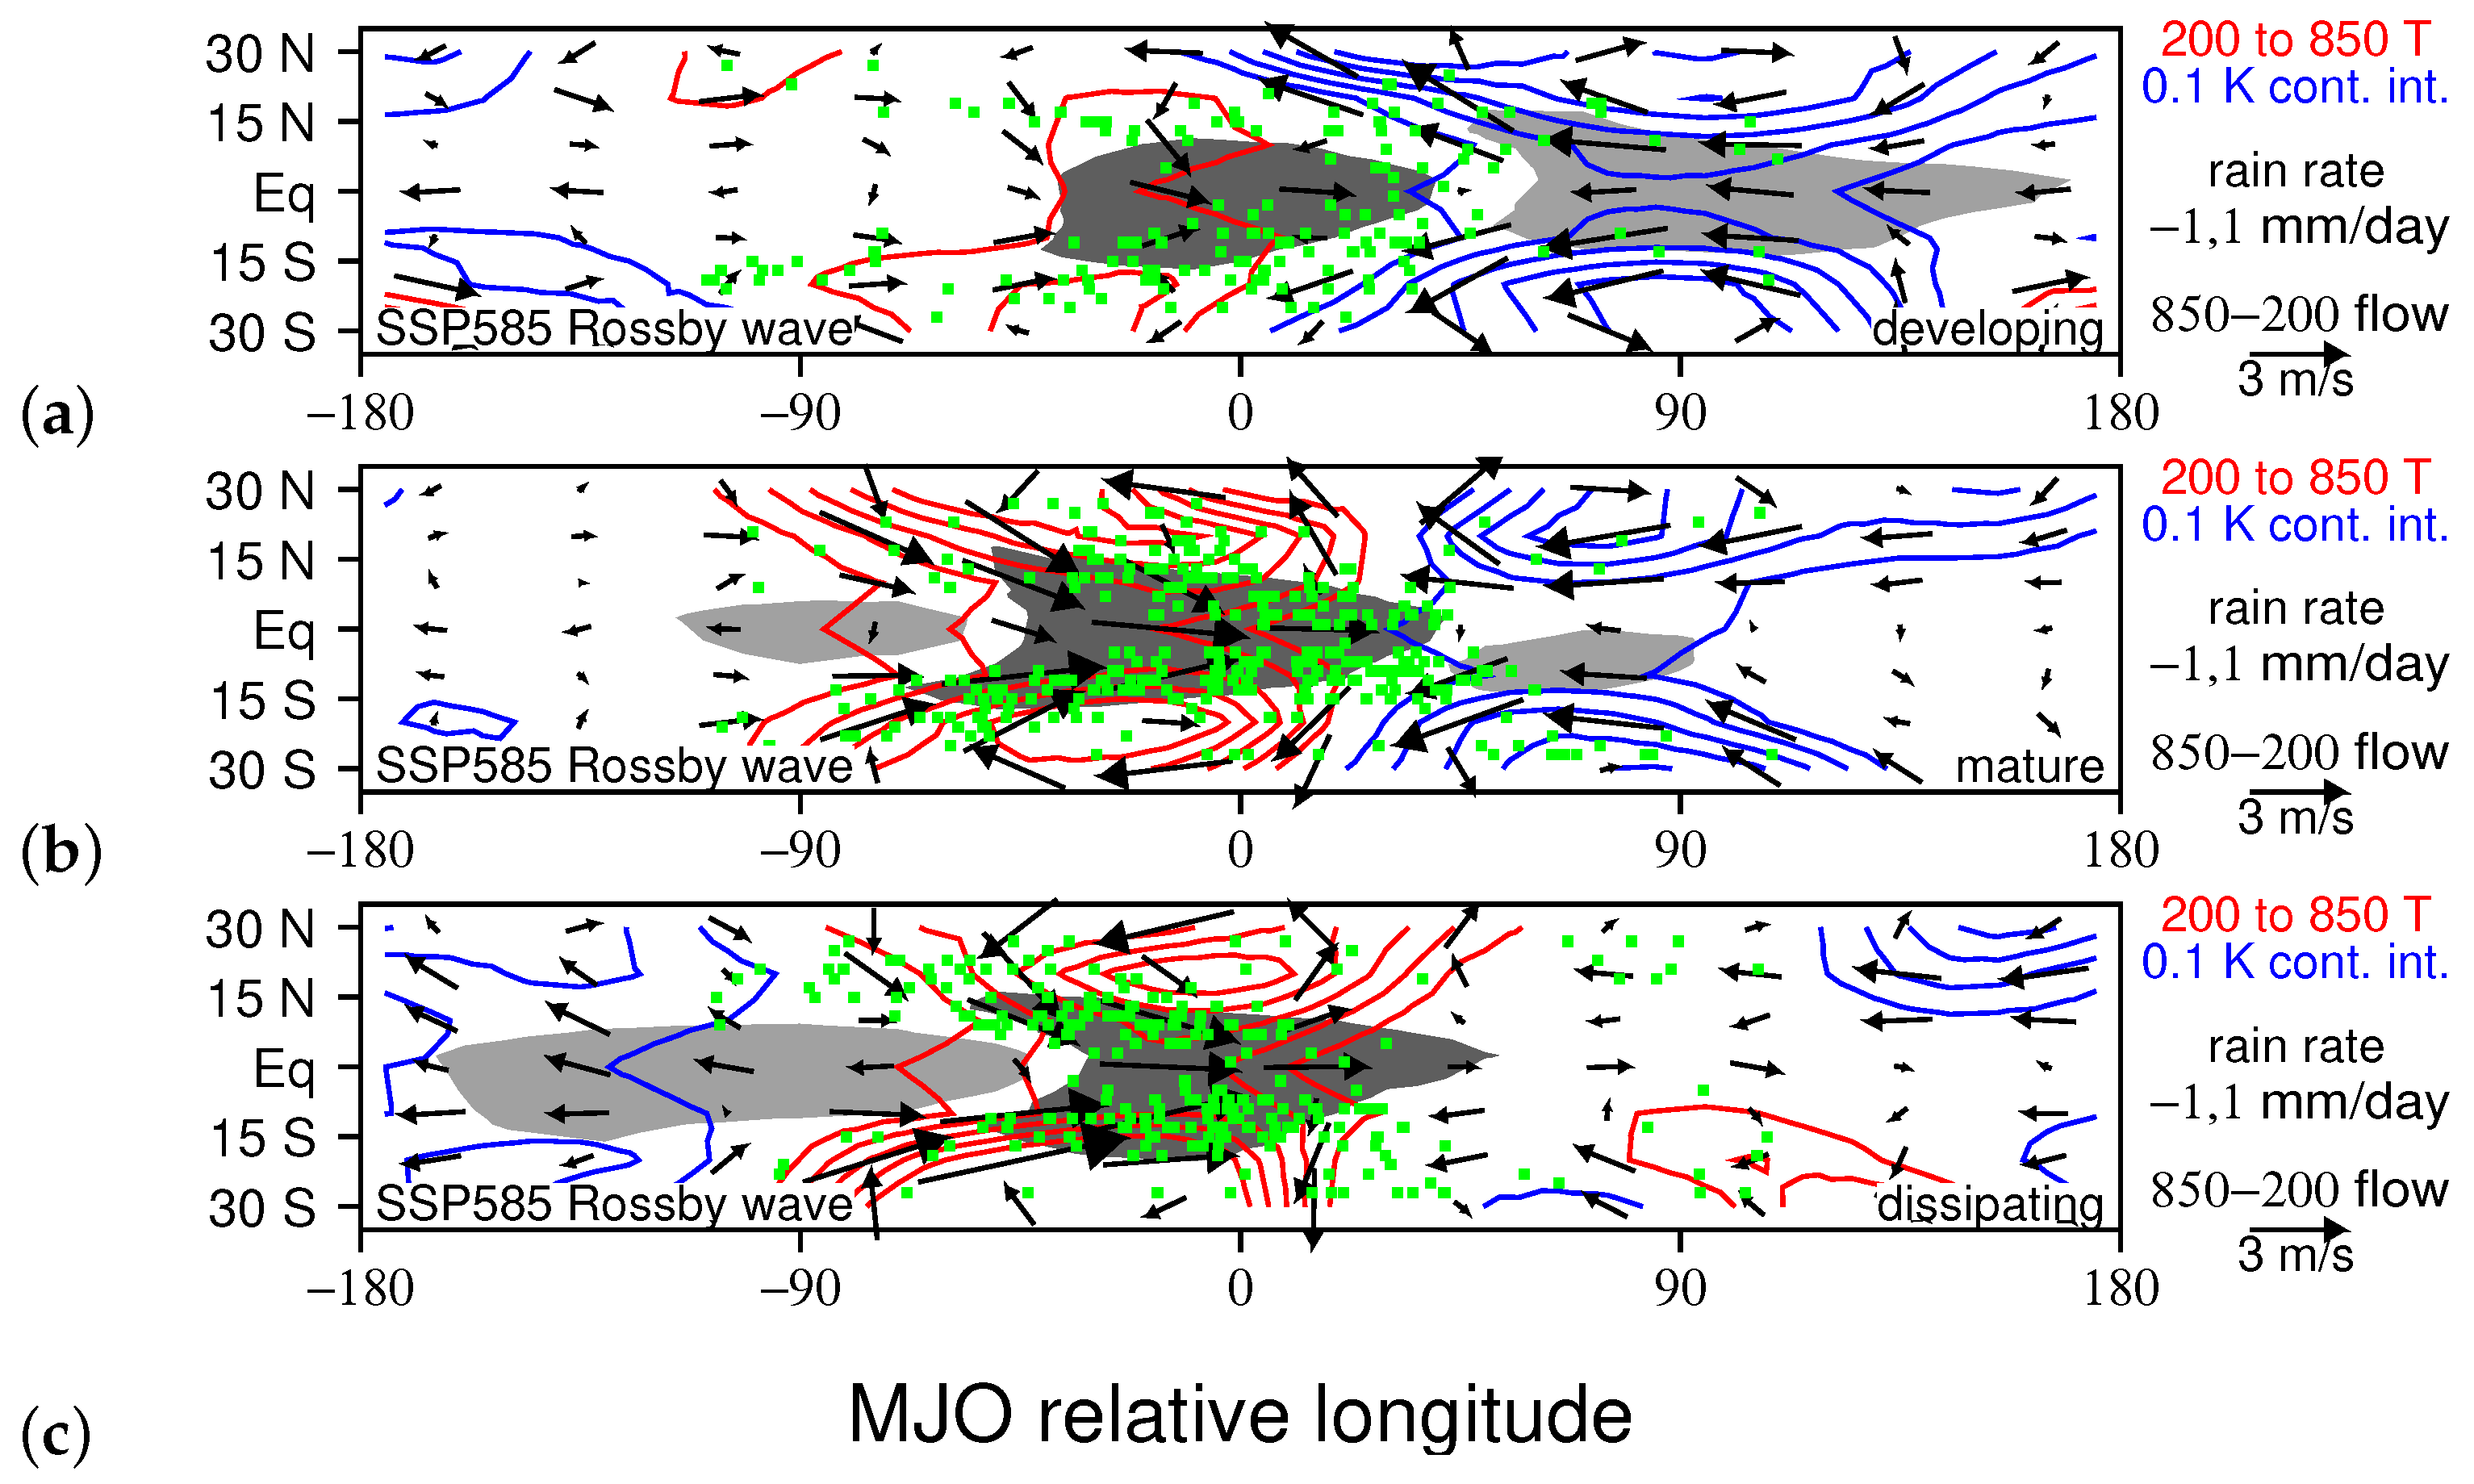
Figure 5 relates the MJO’s Rossby wave circulation to TCG for both observations and the LAM control run. The regions where the convective envelope overlaps the the gyres (i.e., where the dark shading overlaps the warm anomalies with cyclonic low-level flow in Figure 5) have the highest density of TCG events (i.e., clusters of green dots). There are mulitiple reasons why one would expect TCG to be favored in this location; it is a region with high moisture, high vorticity, and enhanced stability [59,60,61]. The LAM also produces a high concentration of TCG events where the Rossby gyres overlap the convective envelope. The Rossby gyres are slightly farther forward relative to the convective envelope in the LAM, and so is the region with the highest TCG (Figure 5).
As noted by [52,54], the evolution of the Kelvin wave flow features in the observations and the LAM control run closely resembles what inviscid linear theory predicts in response to the MJO’s heat source (Figure 4). While the MJO’s Rossby gyres are qualitatively similar to those predicted by theory, they form farther off the equator than linear theory predicts (assuming a basic state of rest), and they move slowly eastward along with the convective envelope, instead westward as simple linear theory predicts.

3.4. Quantifying MJO Modulation of TCG

Plotting points of TCG in the frame of reference of the MJO’s convective envelope is helpful, in terms of highlighting regions where there is an obvious enhancement of TCG, and how this enhancedment is related to MJO circulations (e.g., Figure 4 and Figure 5). However, this approach fails to quantify the MJO’s modulation of TCG. Here, we address this issue by dividing the frequency of TCG by that expected from monthly climatology for longitude bins in the MJO’s frame of reference following [52]. Since the MJO’s convectively generated circulations, as well as its enhancement of TCG, are more or less symmetric about the equator we group both the northern and southern hemisphere TC seasons together for this analysis for greater statistical significance of the results. In the observations, TCG is significantly enhanced within and just west of the convective envelope, and significantly reduced ahead of the convective envelope (Figure 6a, blue line), with the same general pattern for each stage (Figure 6a, black lines). The overall pattern of TCG modulation is the same in the LAM, with significant enhancement of TCG within the convective envelope, and a significant reduction in TCG ahead of the convective envelope (Figure 6b, blue line). The amplitudes of TCG enhancement and reduction are also about the same in the LAM control run and in nature, roughly 70 percent and 35–50 percent, respectively. These results, along with those in Figure 4 and Figure 5 suggest that the MJO modulates TCG in the LAM much in the same way it does in nature.

3.5. Predicted Changes to MJO Modulation of TCG due Enhanced Greenhouse Gases

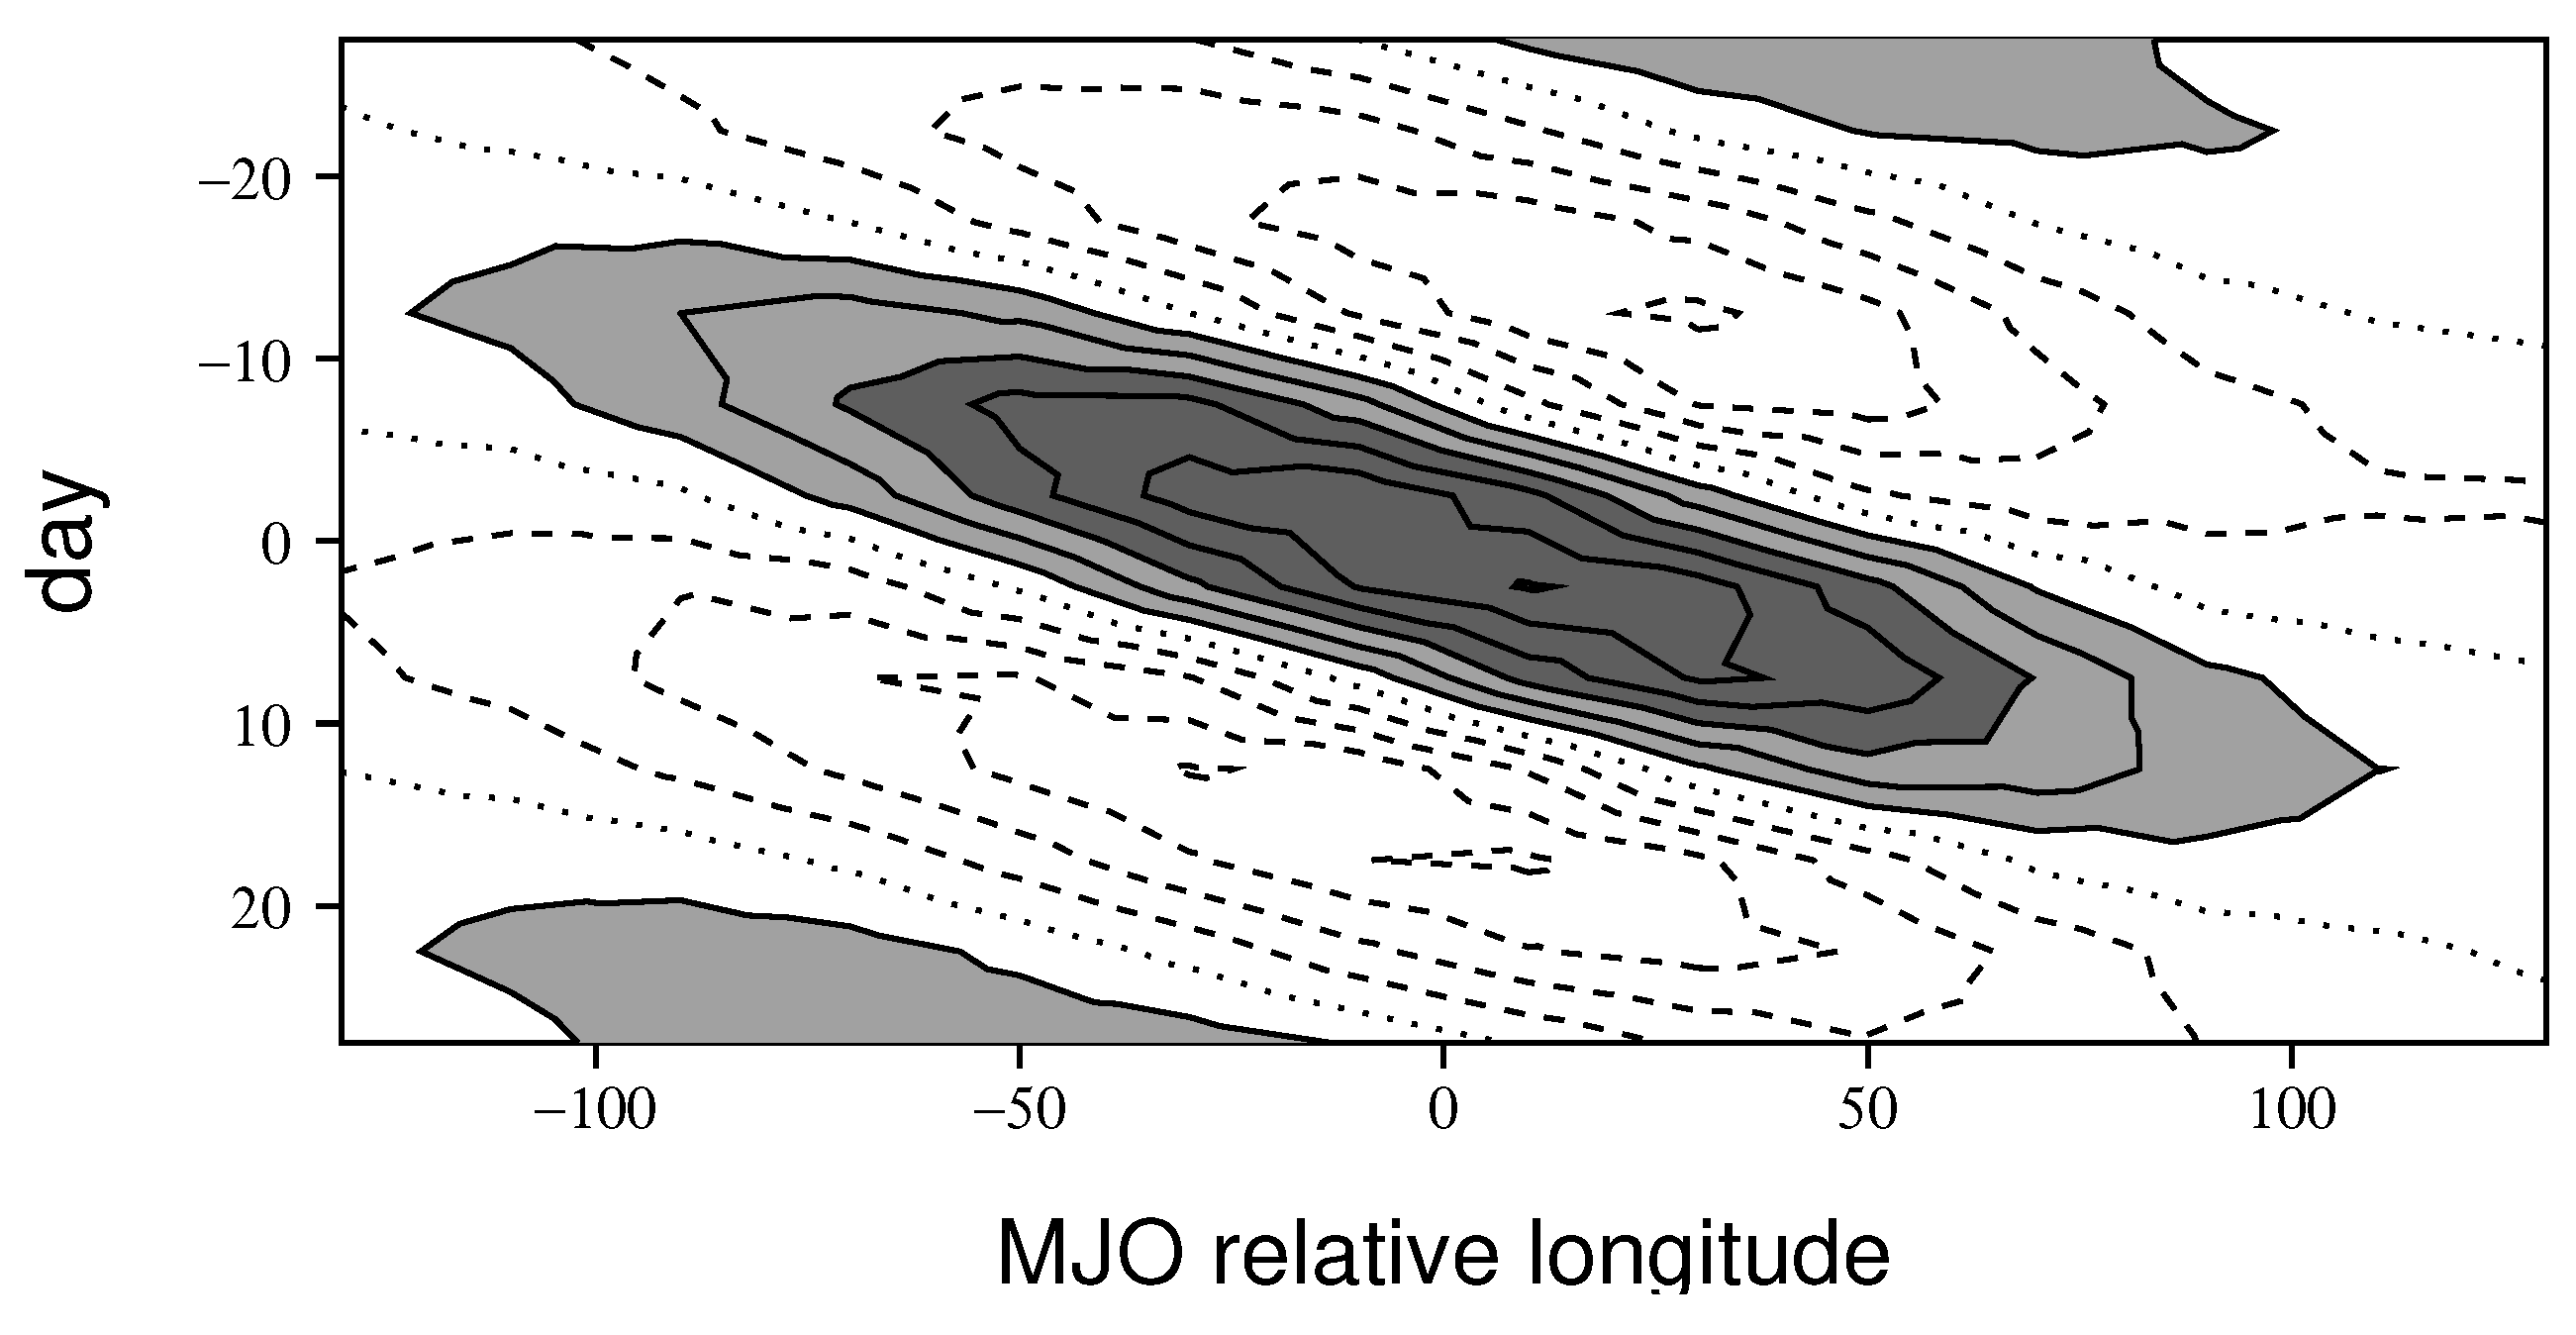
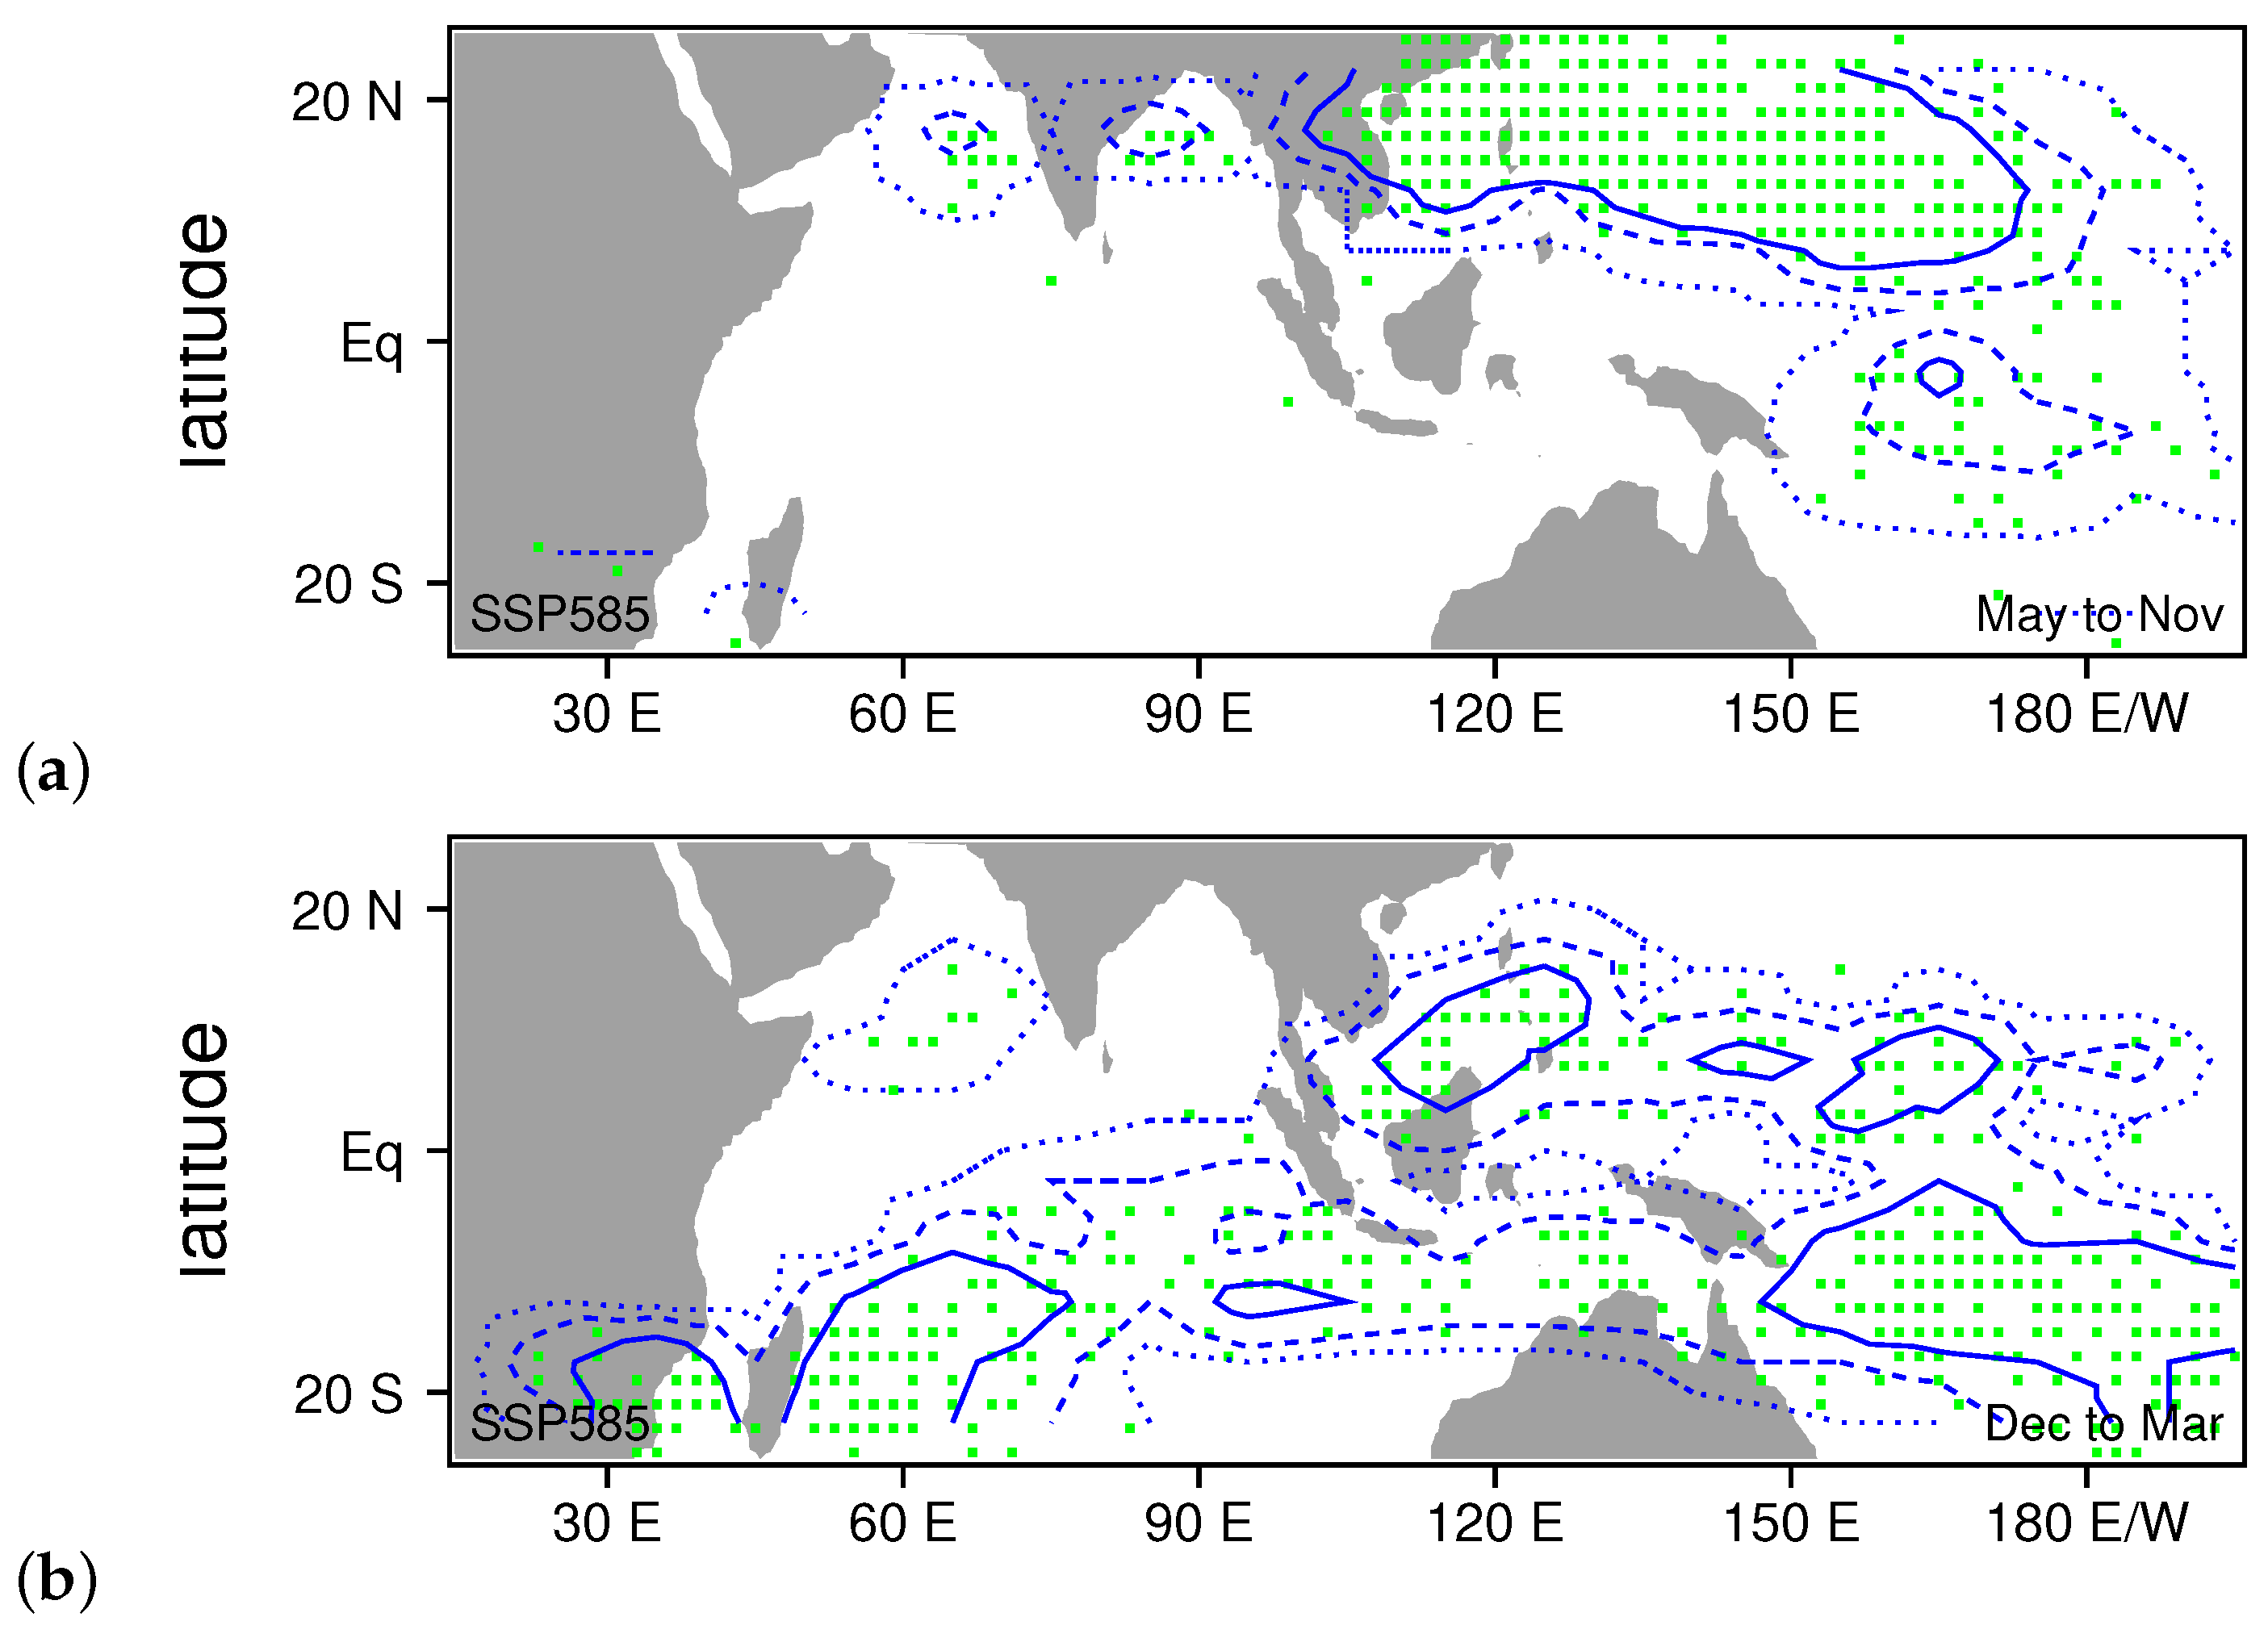
We now examine the MJO and TCG within the LAM SSP585 run, to see what the LAM predicts for changes to MJO modulation of TCG given a strong increase in greenhouse gases. As we discuss in Section 2, the MJO is more frequent in the SSP585 run. A composite analysis of MJO rainfall reveals that an average MJO also produces a stronger rainfall perturbation, covers a broader region of the tropics, and propagates more rapidly than in the LAM control run (compare Figure 1b and Figure 7). These predicted MJO changes under global warming are not unique to the LAM [20,21,22,23,24], although not all models predict that the MJO will intensify [29]. The LAM SSP585 run also produces a TCG basic state that is more like observations, with TCG events occuring east and west of India (Figure 8a) during May through November, and more TCG events occurring in the southeastern Indian Ocean during December through March (Figure 8b).
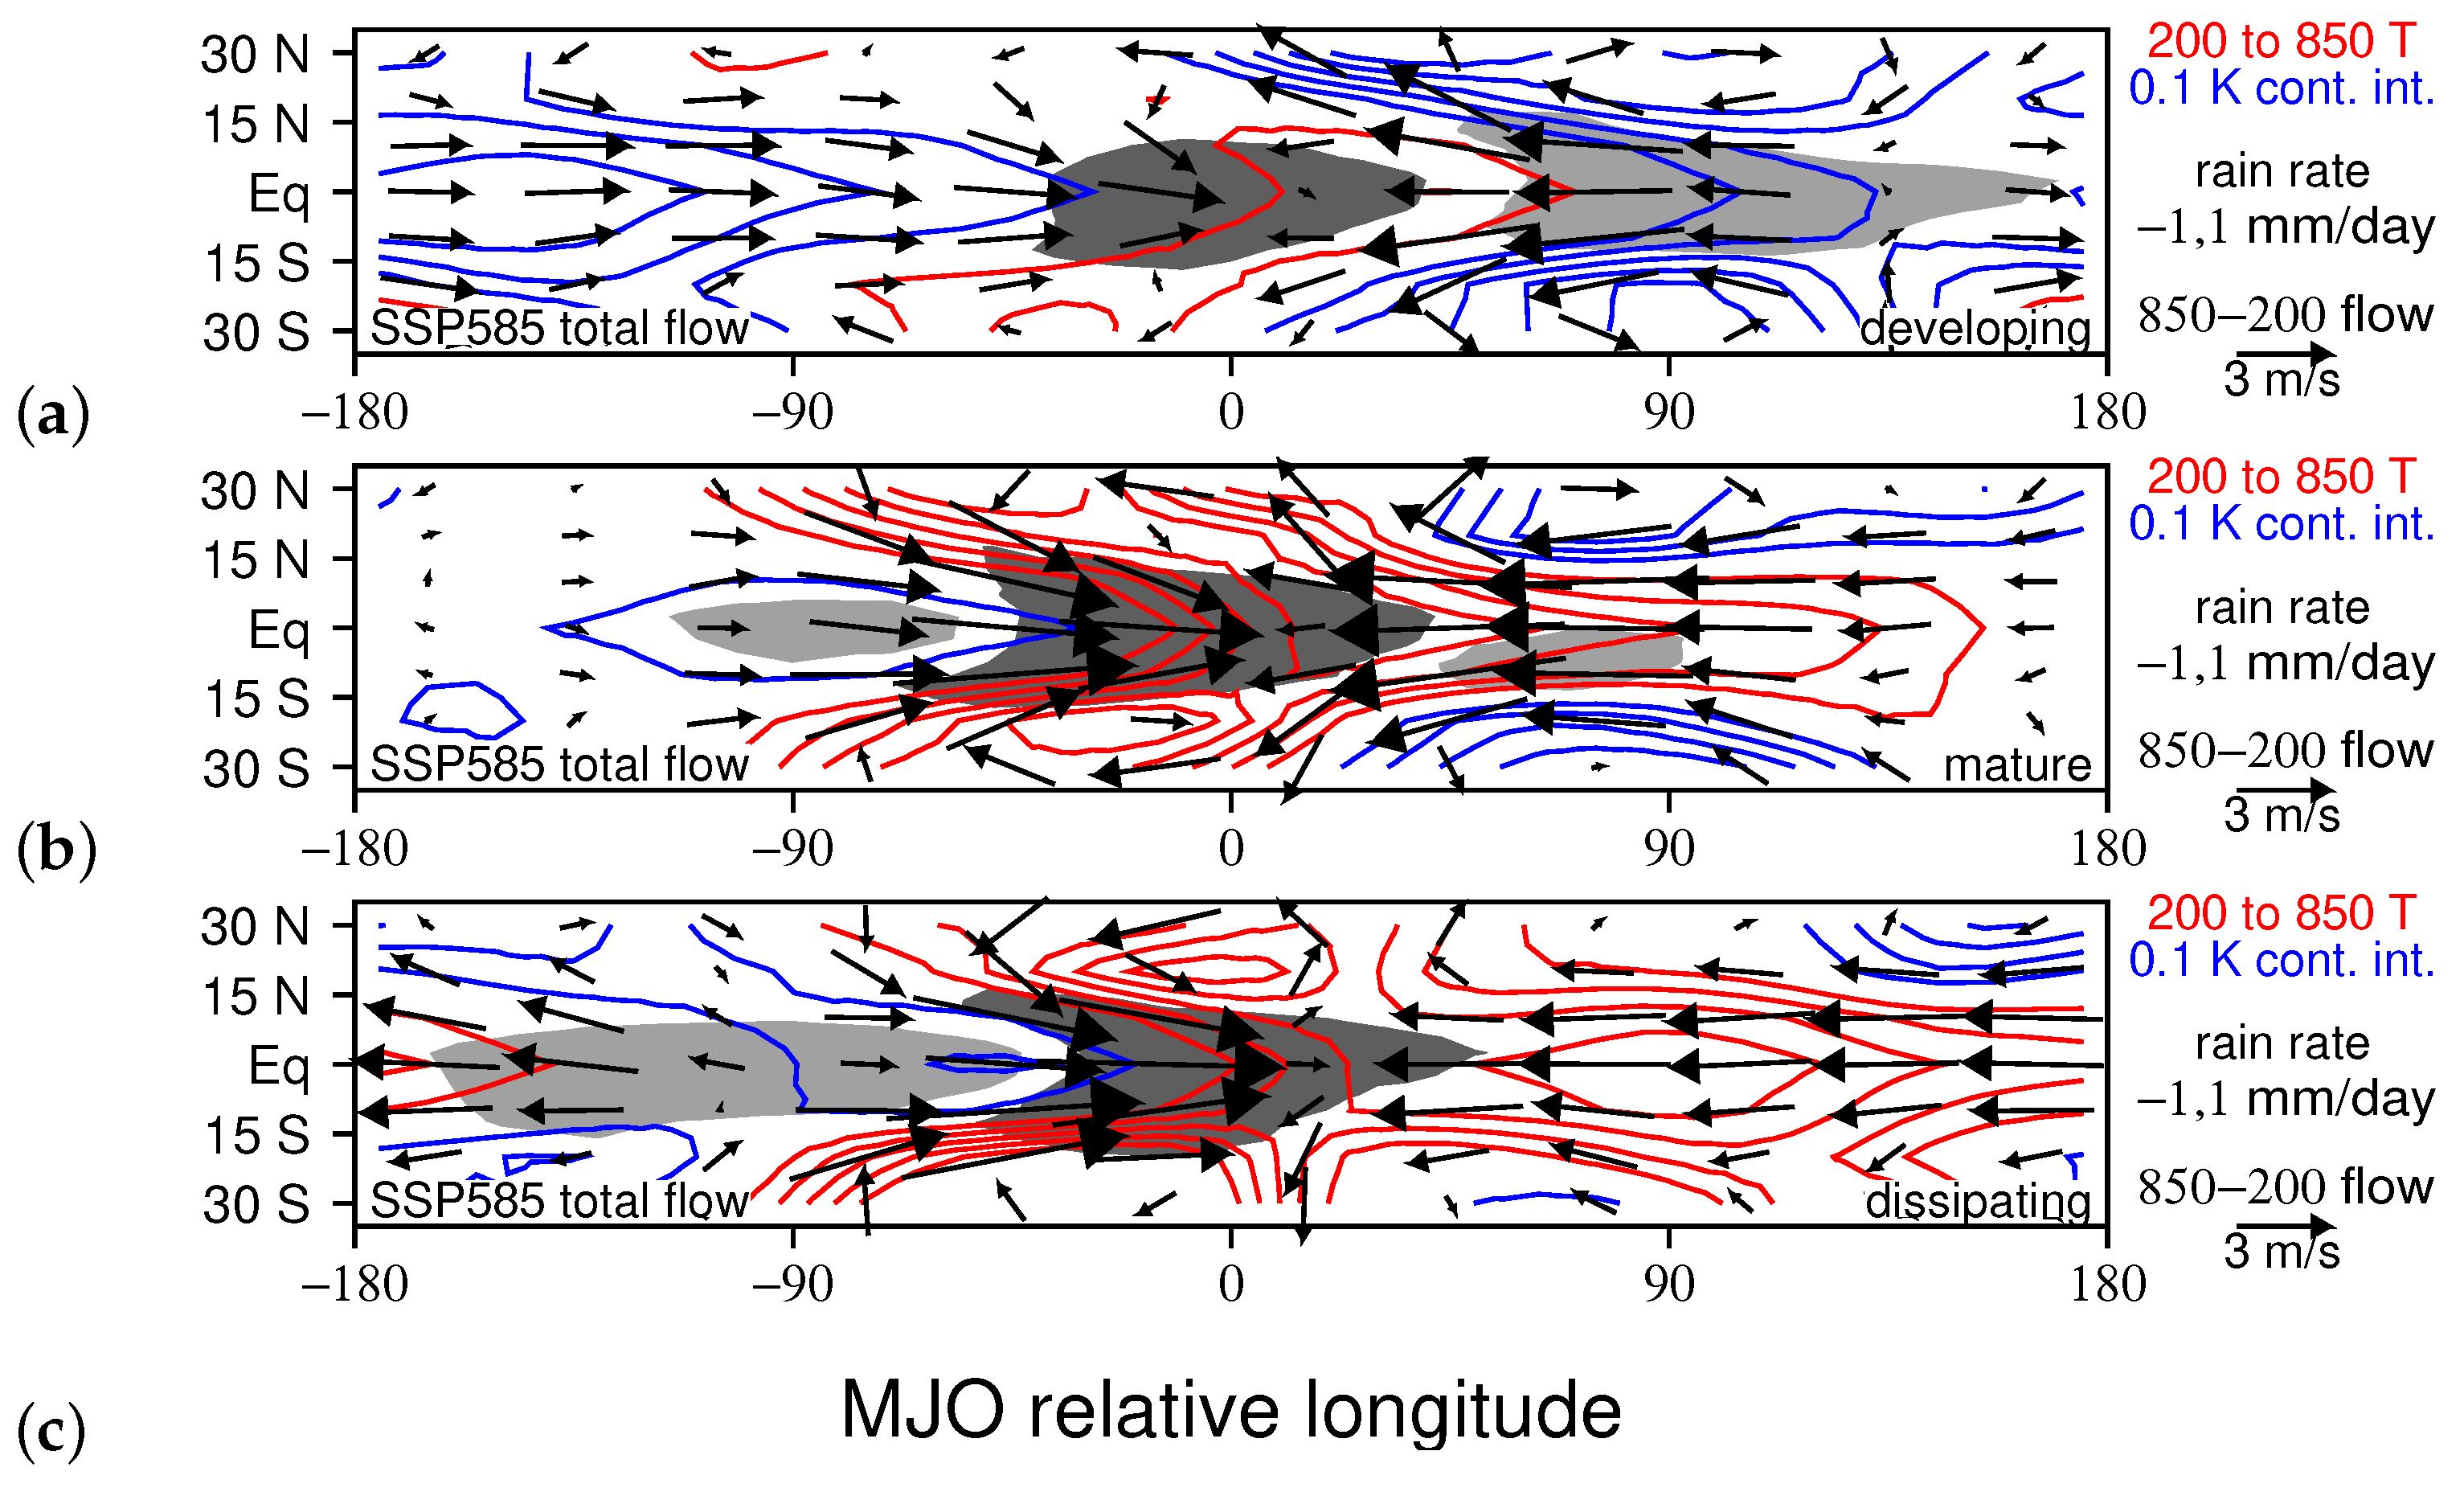
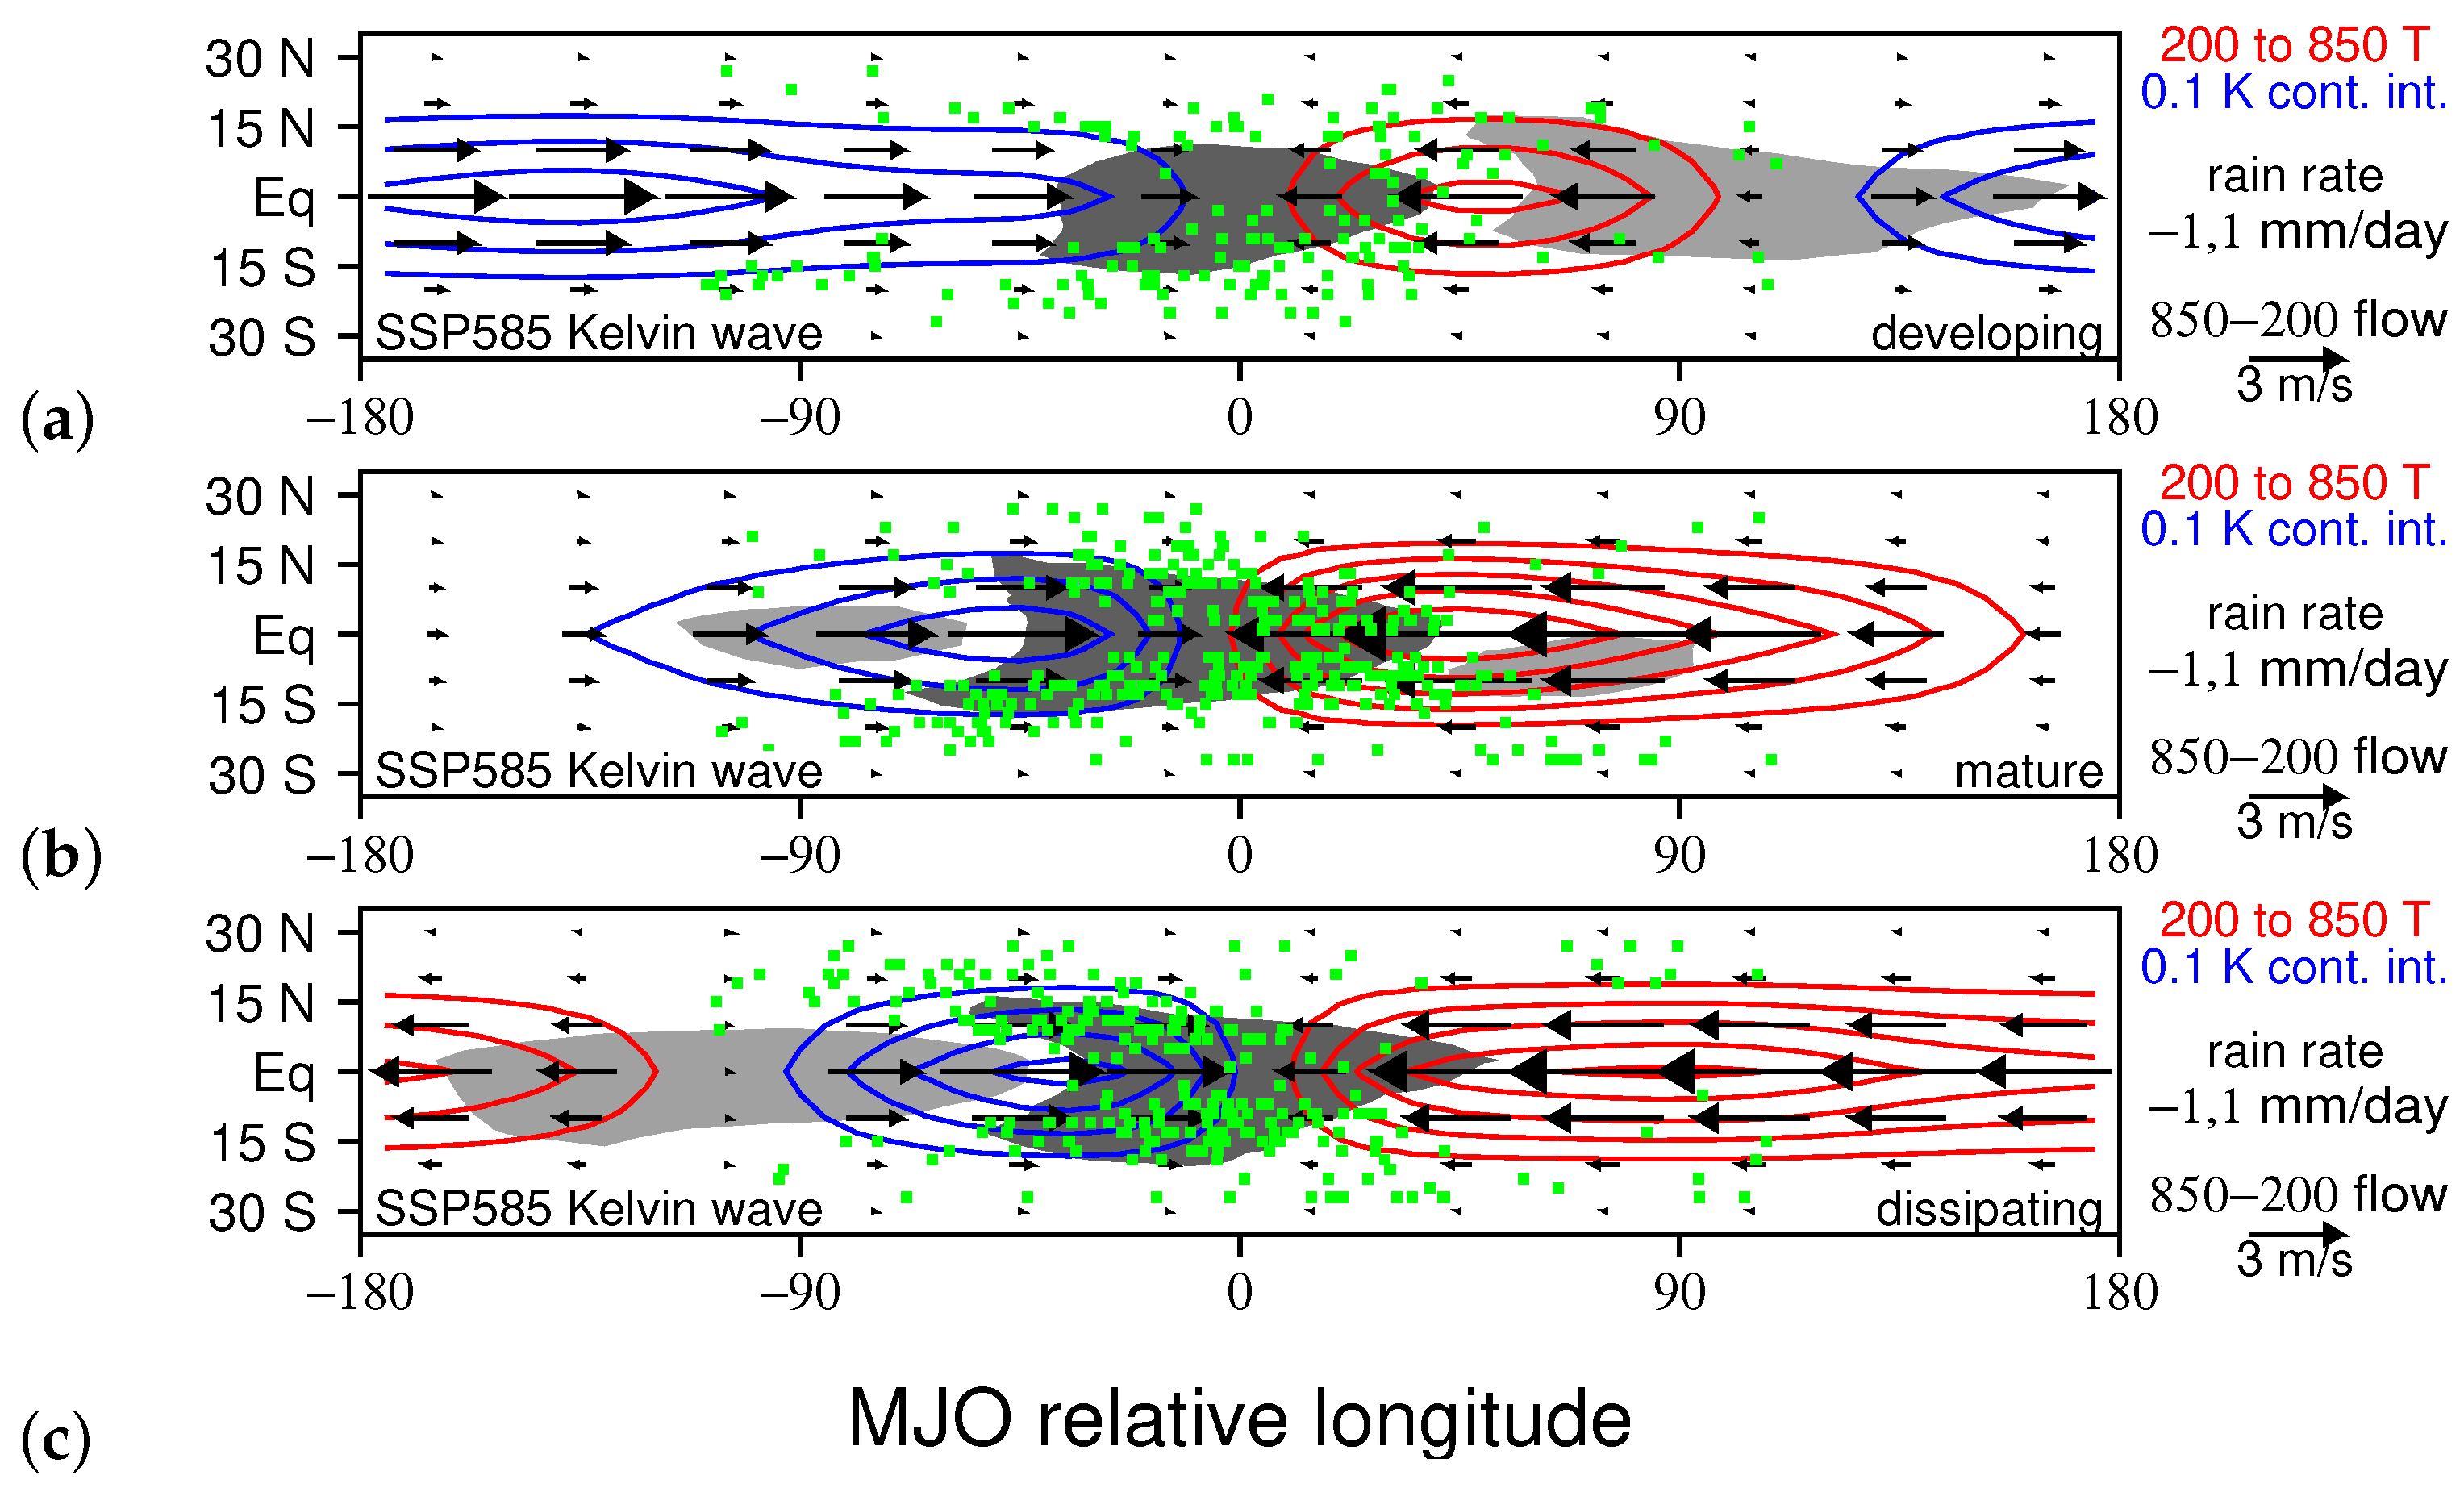
Comparing composite MJO circulations for the LAM SSP585 run to those in the control run reveals the same general flow and temperature patterns for each stage (compare Figure 2d–f and Figure 9a–c), but in the SSP585 run, dynamical features are generally stronger, and sometimes have a larger scale. For example, the cool phase Kelvin wave lying to the west of the convective envelope during the developing stage has more intense temperature and wind perturbations in the SSP585 run (compare Figure 4d and Figure 10a). At this time, the cool phase Rossby gyres on the poleward edges of the suppressed region to the east of the MJO are also larger and more intense in the SSP585 run (compare Figure 5d and Figure 11a). During the mature and dissipating stages, the warm phase Rossby gyres on the poleward edges of the MJO’s convective envelope are also larger and more intense in the SSP585 run than they are in the control run (compare Figure 5e,f and Figure 11b,c).
In the mature and dissipating stages, it is apparent that there are more TCG events (green dots in Figure 10 and Figure 11) within the MJO’s convective envelope than in the control run, both because of a larger convective envelope and because TCG events have a higher density. Presumably, this is because MJO perturbations that enhance TCG, such as upward motion, and positive moisture, rainfall, and vorticity anomalies, are all stronger in the SSP585 run, and because there are more MJO events in the SSP585 run.
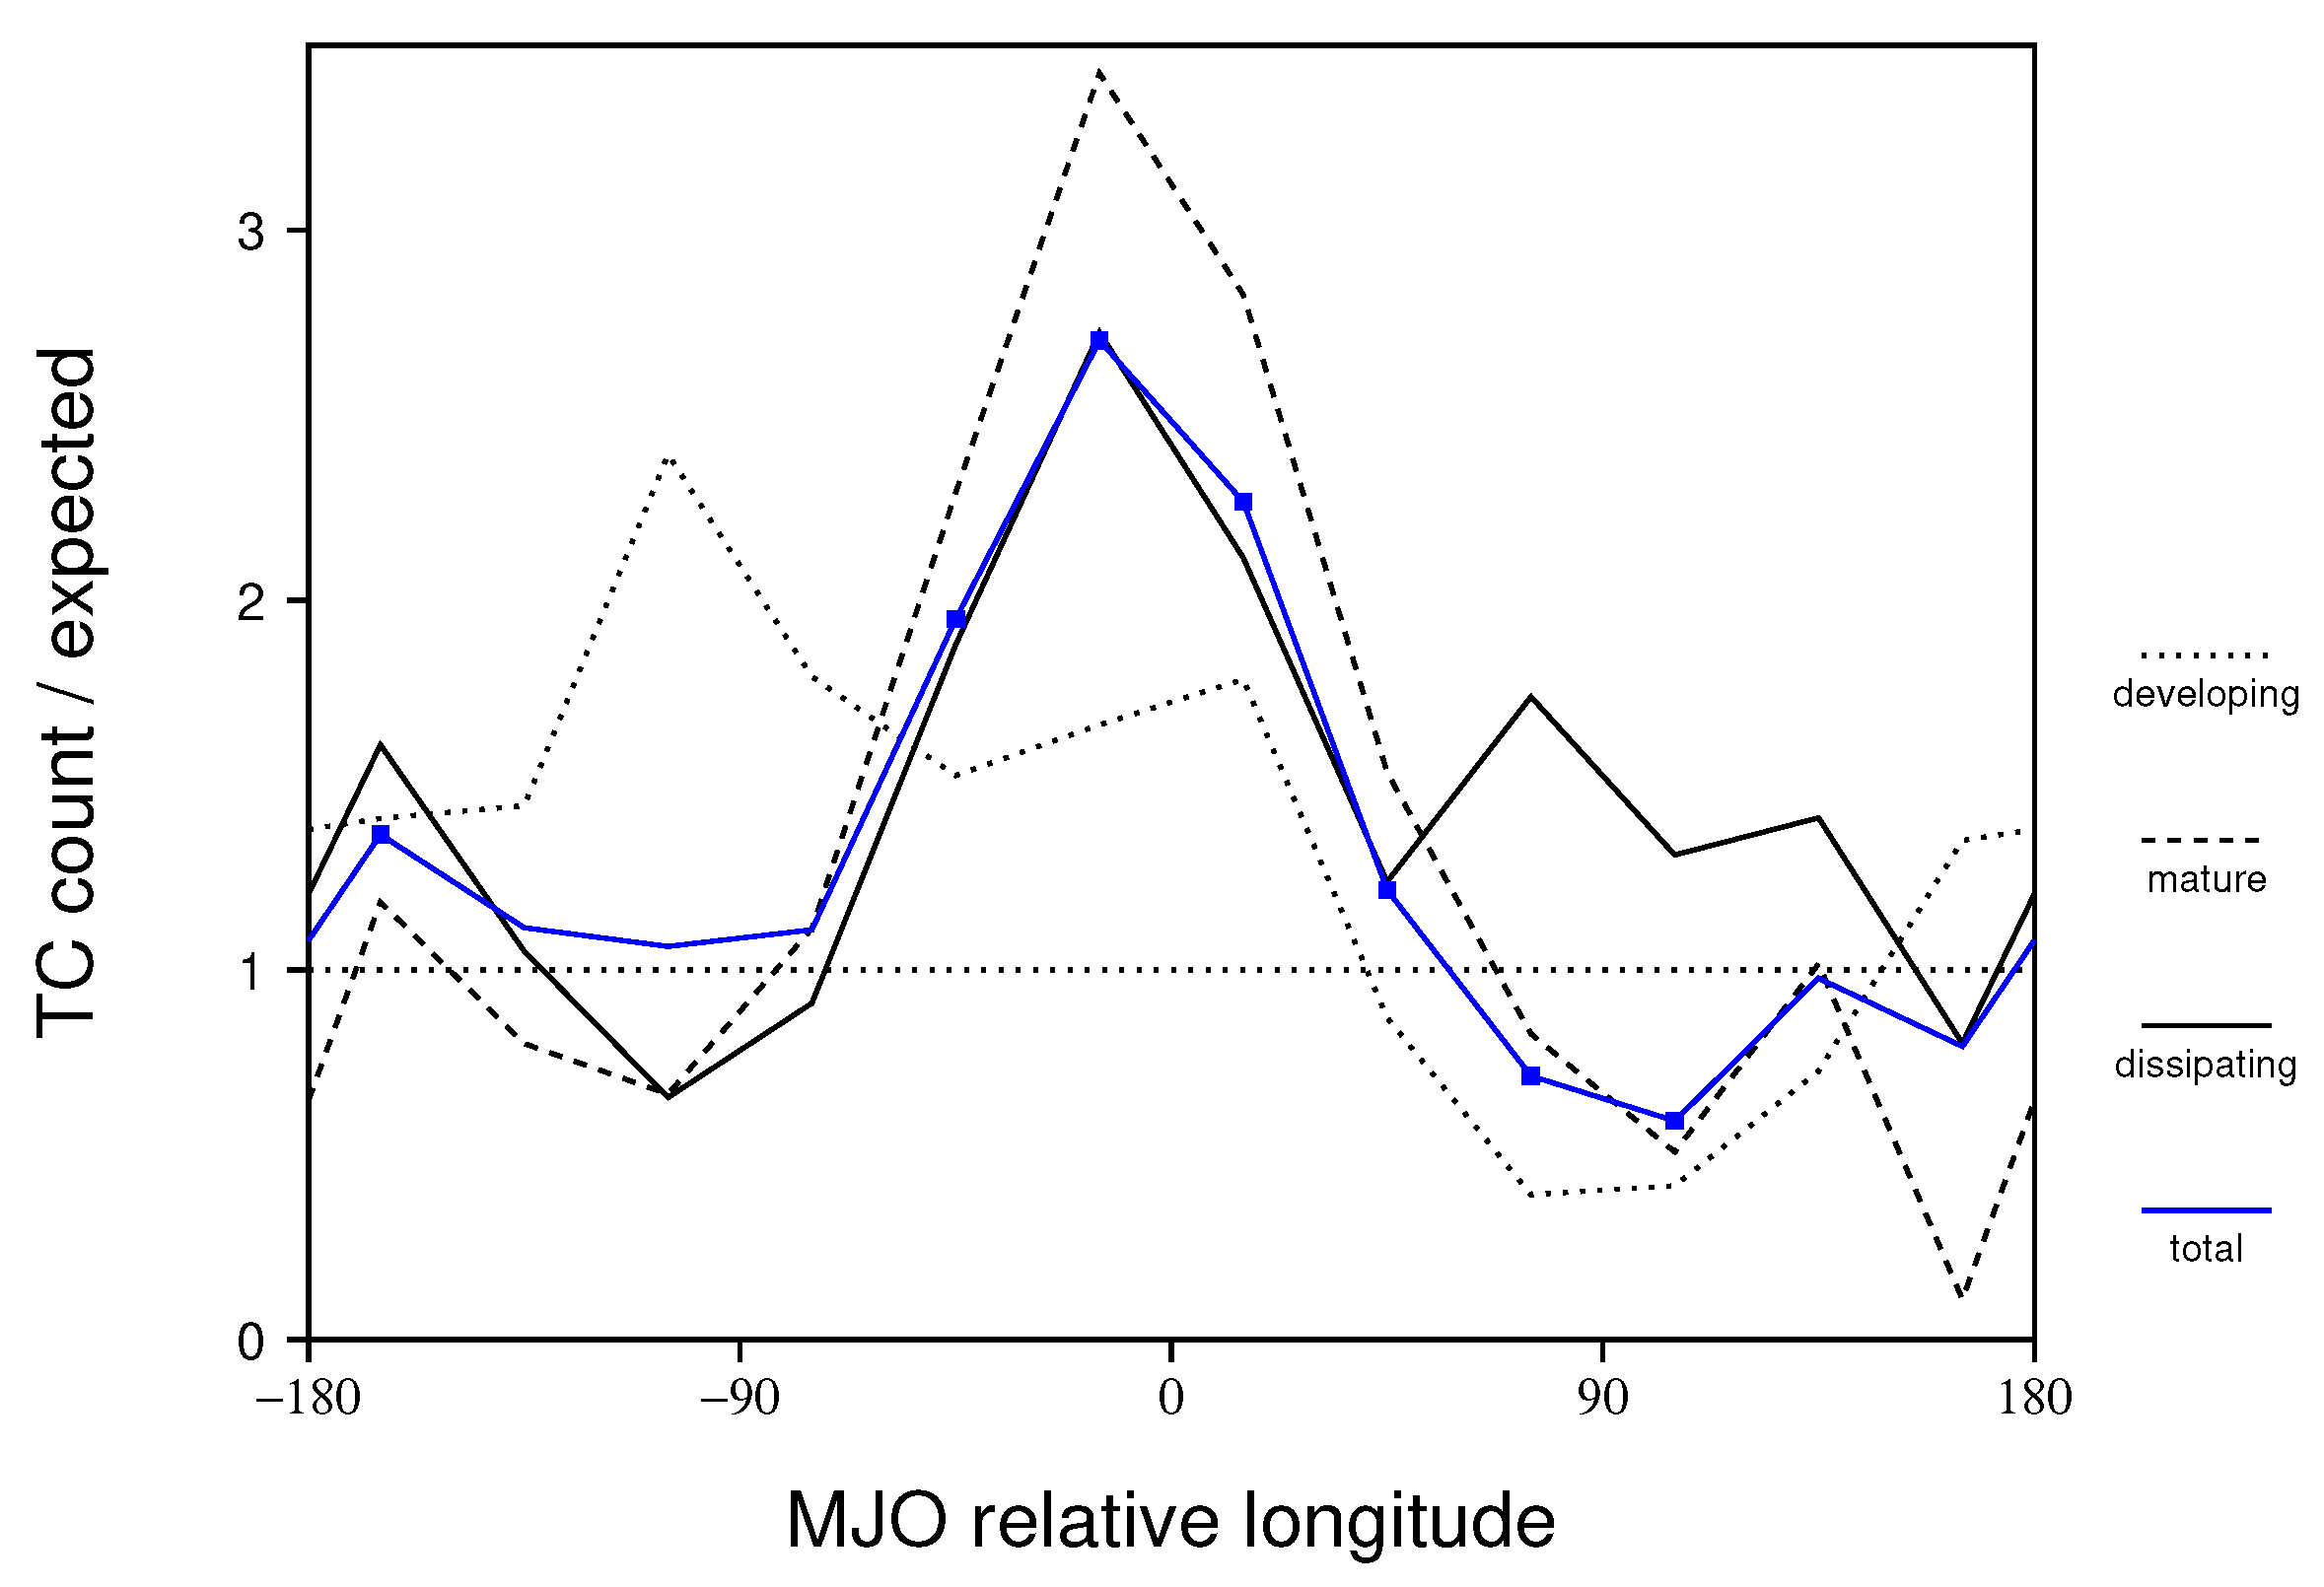
Figure 12 quantifies MJO modulation of TCG in the SSP585 run in longitude bins in the MJO’s frame of reference for each stage. As in Figure 6, the total number of TCG events is divided by the expected number based on monthly climatology. The same general pattern emerges as in the control run, with TCG enhancement within the MJO’s convective envelope for each stage, as well as a reduction in TCG ahead of the MJO for the developing and mature stages (compare Figure 6b and Figure 12). However, the enhancement of TCG is much greater in the SSP585 run; just west of the MJO convective center there are 2.70 times more TCG events than monthly climatology predicts in the SSP585 run, compared with an enhancement factor of 1.73 in the control run (compare blue lines in Figure 6b and Figure 12). Moreover, the percentage of TCG events that form in an MJO convective envelope increases from 16 percent in the control run to 28 percent in the SSP585 run. This means that the LAM predicts that with substantial global warming, a stronger and more frequent MJO will produce a much greater clustering of TCG events within its convective envelope.

4. Discussion

This paper examines how the modulation of TCG by the MJO could change if high emissions of carbon dioxide and other greenhouse gases continue. We use the LAM, which tracks individual air particles, to simulate MJOs and TCG for the recent climate as well as one with enhanced greenhouse forcing, like that in the late 21st century under Shared Socioeconomic Pathway (SSP) 585. The novel aspects of this study include the use of a fully Lagrangian model, which has a unique convective parameterization, and which accurately simulates the Kelvin and Rossby wave components of the MJO’s circulation over the life cycle of the convective envelope (Figure 4 and Figure 5). Unlike most previous studies, we also examine TCG in the frame of reference of the MJO’s convective envelope, which reveals how the patterning of TCG relates to the MJO’s Kelvin and Rossby wave circulations. Therefore, our simulations provide not only a warning about how TCG could change in the later part of this century—with a much stronger clustering of TCG events in the MJO’s convective envelope (Figure 12)—but also an explanation for this change: a strengthening of the Kelvin and Rossby wave components of the MJO’s circulation (Figure 10 and Figure 11).
The credibility of LAM predictions of future changes to TCG associated with the MJO is enhanced by the fact that the LAM control run generates an MJO modulation of TCG very much like that in nature. In particular, TCG is enhanced by 73 percent just west of the MJO’s convective center, and it is reduced by about 35–50 percent from 30 to 120 degrees east of the convective center (Figure 6b). Moreover, TCG is enhanced in the LAM in the same places relative to MJO dynamical features as it is in nature—near the ascending branch of the Kelvin wave circulation and where low-level cyclonic Rossby gyres overlap the region of enhanced convection (Figure 4 and Figure 5). These are locations with upward motion, and positive low-level moisture and vorticity perturbations, which have been associated with enhanced TCG in previous studies.
In the simulation with enhanced greenhouse gases, the MJO is more frequent, produces heavier rainfall (Figure 7), and has stronger circulations (Figure 9). Both the Kelvin and Rossby wave components of the MJO circulation intensify (Figure 10 and Figure 11), and the precipitation features and Rossby gyres have a larger scale (Figure 7 and Figure 11). TCG continues to be enhanced in the ascending branch of the Kelvin wave circulation (Figure 10), and where the cyclonic low-level Rossby gyres overlap enhanced precipitation (Figure 11), but there are more TCG events in these locations than in the control run. In the LAM SSP585 run, TCG is enhanced by 170 percent above the monthly climatology on the western side of the convective envelope, compared with just 73 percent in the control run. This means that if high emissions of greenhouse gases continue, there could be a dramatic increase in TCG in the MJO’s convective envelope by the end of this century.
Previous studies that have examined MJO modulation of TCG in the Indian Ocean, Western Pacific, and near Australia have connected enhanced TCG within the MJO to a greater number of pre-curser convective systems, enhanced low-level vorticity, reduced wind shear, low- or mid-level moisture perturbations, and upward motion [35,37,38,59,60,62,63,64]. Most if not all of these perturbations can be attributed to the MJO’s Kelvin and/or Rossby wave circulations. For example, the MJO’s Kelvin wave circulation, which includes upward motion in the convective envelope, converges moisture that accounts for most of the MJO’s rainfall perturbation [50]. There is also enhanced low-level vorticity on the the poleward edges of the Kelvin wave westerlies on the western edge of the convective envelope. As noted in previous studies, the MJO’s low-level cyclonic Rossby gyres contribute positive vorticity perturbations and enhanced surface fluxes on the western edge of the MJO [25,60,63], and the low-level anticyclonic gyres to the east of of the MJO help to build up moisture in advance of the MJO through meridional moisture advection [50,57,65]. Therefore, if both the Kelvin and Rossby wave circulations within the MJO intensify, it is logical to expect TCG to intensify as well. In a previous observational study, we noted that the MJO’s Kelvin wave circulation has already increased in amplitude in recent decades, and there is some evidence the Rossby gyres are getting larger with time [52]. These circulation changes have been accompanied by a slight increase in TCG enhancement near the western edge of the MJO’s convective envelope in recent decades, as well as a stronger reduction in TCG ahead of the MJO (see Figure 12 from [52]).
While this study has focused on MJO modulation of TCG in the region where the MJO is convectively active, including the western Pacific and Indian Oceans, it is quite possible that MJO modulation of TCG in the eastern Pacific and Atlantic basins could also increase in time. Previous studies have associated MJO enhancement of TCG in these locations with the MJO’s Kelvin wave circulation and/or upper-level divergence fields [40,41], and our results suggest that these circulations will intensify with time. However, the current version of the LAM does not simulate TCG as accurately in these regions, possibly due to insufficient resolution for accurately simulating precursor disturbances such as easterly waves. Consequently, we did not examine MJO modulation of TCG in these regions for this study, and leave this question for future research. As we enhance the parallel capabilities of the LAM, we hope to conduct higher resolution runs that better resolve precursor disturbances to TCG in the Atlantic and Eastern Pacific, and we also hope to couple the LAM to our Lagrangian Ocean Model [66], so that we can capture MJO and tropical cyclone feedbacks to sea surface temperatures, which are not included in the present study.

Author Contributions

Y.L. carried out the LAM simulations and developed the method to identify tropical cyclones. P.H. constructed composite MJO circulations, decomposed them into Kelvin and Rossby components, and analyzed TCG data in the frame of reference of the MJO convective envelope. P.H. wrote this paper, and Y.L. provided editorial comments. All authors have read and agreed to the published version of the manuscript.

Funding

Patrick Haertel’s contribution to this paper was supported by the National Science Foundation grant AGS-2140281. Yu Liang’s work was supported by the Schmidt AI in Science Postdoctoral Fellowship.

Data Availability Statement

Data for the composite MJO simulated in the LAM control run are available at https://ducky.net/lom/cmp_mjo_lam_con.zip.

Conflicts of Interest

The authors declare no conflicts of interest.

References

  1. Madden, R.A.; Julian, P.R. Detection of a 40–50 day oscillation in the zonal wind in the tropical Pacific. J. Atmos. Sci. 1971, 28, 702–708. [Google Scholar] [CrossRef]
  2. Madden, R.A.; Julian, P.R. Description of global-scale circulation cells in the tropics with a 40–50 day period. J. Atmos. Sci. 1972, 29, 1109–1123. [Google Scholar] [CrossRef]
  3. Zhang, C. Madden-julian oscillation. Rev. Geophys. 2005, 43, RG2003. [Google Scholar] [CrossRef]
  4. Madden, R.A.; Julian, P.R. Observations of the 40–50-day tropical oscillation—A review. Mon. Weather. Rev. 1994, 122, 814–837. [Google Scholar] [CrossRef]
  5. Wheeler, M.; Kiladis, G.N.; Webster, P.J. Large-scale dynamical fields associated with convectively coupled equatorial waves. J. Atmos. Sci. 2000, 57, 613–640. [Google Scholar] [CrossRef]
  6. Wu, M.L.C.; Schubert, S.; Huang, N.E. The development of the South Asian summer monsoon and the intraseasonal oscillation. J. Clim. 1999, 12, 2054–2075. [Google Scholar] [CrossRef]
  7. Lorenz, D.J.; Hartmann, D.L. The effect of the MJO on the North American monsoon. J. Clim. 2006, 19, 333–343. [Google Scholar] [CrossRef]
  8. Haertel, P.; Boos, W.R. Global association of the Madden-Julian Oscillation with monsoon lows and depressions. Geophys. Res. Lett. 2017, 44, 8065–8074. [Google Scholar] [CrossRef]
  9. Mundhenk, B.D.; Barnes, E.A.; Maloney, E.D.; Baggett, C.F. Skillful empirical subseasonal prediction of landfalling atmospheric river activity using the Madden–Julian oscillation and quasi-biennial oscillation. NPJ Clim. Atmos. Sci. 2018, 1, 20177. [Google Scholar] [CrossRef]
  10. Green, M.R.; Furtado, J.C. Evaluating the joint influence of the Madden-Julian oscillation and the stratospheric polar vortex on weather patterns in the Northern hemisphere. J. Geophys. Res. Atmos. 2019, 124, 11693–11709. [Google Scholar] [CrossRef]
  11. Barnes, E.A.; Samarasinghe, S.M.; Ebert-Uphoff, I.; Furtado, J.C. Tropospheric and stratospheric causal pathways between the MJO and NAO. J. Geophys. Res. Atmos. 2019, 124, 9356–9371. [Google Scholar] [CrossRef]
  12. Needham, H.F.; Keim, B.D.; Sathiaraj, D. A review of tropical cyclone-generated storm surges: Global data sources, observations, and impacts. Rev. Geophys. 2015, 53, 545–591. [Google Scholar] [CrossRef]
  13. Blake, E.S.; Landsea, C.; Gibney, E.J. The Deadliest, Costliest, and Most Intense United States Tropical Cyclones from 1851 to 2010 (and Other Frequently Requested Hurricane Facts); NOAA: Washionton, DC, USA, 2011.
  14. Liang, Y.; Fedorov, A.V. Linking the Madden–Julian Oscillation, tropical cyclones and westerly wind bursts as part of El Niño development. Clim. Dyn. 2021, 57, 1039–1060. [Google Scholar] [CrossRef]
  15. Liang, Y.; Fedorov, A.V.; Haertel, P. Intensification of Westerly Wind Bursts Caused by the Coupling of the Madden-Julian Oscillation to SST During El Niño Onset and Development. Geophys. Res. Lett. 2021, 48, e2020GL089395. [Google Scholar] [CrossRef]
  16. Slingo, J.; Rowell, D.; Sperber, K.; Nortley, F. On the predictability of the interannual behaviour of the Madden-Julian Oscillation and its relationship with El Niño. Q. J. R. Meteorol. Soc. 1999, 125, 583–609. [Google Scholar] [CrossRef]
  17. Jones, C.; Carvalho, L.M. Changes in the activity of the Madden–Julian oscillation during 1958–2004. J. Clim. 2006, 19, 6353–6370. [Google Scholar] [CrossRef]
  18. Oliver, E.C.; Thompson, K.R. A reconstruction of Madden–Julian Oscillation variability from 1905 to 2008. J. Clim. 2011, 25, 1996–2019. [Google Scholar] [CrossRef]
  19. Cui, J.; Li, T. Changes in MJO characteristics and impacts in the past century. J. Clim. 2022, 35, 577–590. [Google Scholar] [CrossRef]
  20. Arnold, N.P.; Branson, M.; Kuang, Z.; Randall, D.A.; Tziperman, E. MJO intensification with warming in the superparameterized CESM. J. Clim. 2015, 28, 2706–2724. [Google Scholar] [CrossRef]
  21. Takahashi, C.; Sato, N.; Seiki, A.; Yoneyama, K.; Shirooka, R. Projected future change of MJO and its extratropical teleconnection in east Asia during the northern winter simulated in IPCC AR4 models. Sola 2011, 7, 201–204. [Google Scholar] [CrossRef]
  22. Adames, A.F.; Kim, D.; Sobel, A.H.; Del Genio, A.; Wu, J. Changes in the structure and propagation of the MJO with increasing CO2. J. Adv. Model. Earth Syst. 2017, 9, 1251–1268. [Google Scholar] [CrossRef] [PubMed]
  23. Carlson, H.; Caballero, R. Enhanced MJO and transition to superrotation in warm climates. J. Adv. Model. Earth Syst. 2016, 8, 304–318. [Google Scholar] [CrossRef]
  24. Jones, C.; Carvalho, L.M. Stochastic simulations of the Madden–Julian oscillation activity. Clim. Dyn. 2011, 36, 229–246. [Google Scholar] [CrossRef]
  25. Haertel, P. Sensitivity of the Madden Julian Oscillation to Ocean Warming in a Lagrangian Atmospheric Model. Climate 2018, 6, 45. [Google Scholar] [CrossRef]
  26. Haertel, P. Prospects for Erratic and Intensifying Madden-Julian Oscillations. Climate 2020, 8, 24. [Google Scholar] [CrossRef]
  27. Bui, H.X.; Hsu, P.C. Projected Changes in the Seasonal Cycle of Madden-Julian Oscillation Precipitation and Wind Amplitude. Geophys. Res. Lett. 2023, 50, e2022GL101773. [Google Scholar] [CrossRef]
  28. Du, D.; Subramanian, A.C.; Han, W.; Chapman, W.E.; Weiss, J.B.; Bradley, E. Increase in MJO predictability under global warming. Nat. Clim. Chang. 2024, 14, 68–74. [Google Scholar] [CrossRef]
  29. Maloney, E.D.; Adames, Á.F.; Bui, H.X. Madden–Julian oscillation changes under anthropogenic warming. Nat. Clim. Chang. 2019, 9, 26–33. [Google Scholar] [CrossRef]
  30. Klotzbach, P.J.; Wood, K.M.; Schreck III, C.J.; Bowen, S.G.; Patricola, C.M.; Bell, M.M. Trends in global tropical cyclone activity: 1990–2021. Geophys. Res. Lett. 2022, 49, e2021GL095774. [Google Scholar] [CrossRef]
  31. Camargo, S.J.; Wing, A.A. Tropical cyclones in climate models. Wiley Interdiscip. Rev. Clim. Chang. 2016, 7, 211–237. [Google Scholar] [CrossRef]
  32. Sobel, A.H.; Wing, A.A.; Camargo, S.J.; Patricola, C.M.; Vecchi, G.A.; Lee, C.Y.; Tippett, M.K. Tropical cyclone frequency. Earth’s Future 2021, 9, e2021EF002275. [Google Scholar] [CrossRef]
  33. Walsh, K.J.; McBride, J.L.; Klotzbach, P.J.; Balachandran, S.; Camargo, S.J.; Holland, G.; Knutson, T.R.; Kossin, J.P.; Lee, T.C.; Sobel, A.; et al. Tropical cyclones and climate change. Wiley Interdiscip. Rev. Clim. Chang. 2016, 7, 65–89. [Google Scholar] [CrossRef]
  34. Pérez-Alarcón, A.; Fernández-Alvarez, J.C.; Coll-Hidalgo, P. Global increase of the intensity of tropical cyclones under global warming based on their maximum potential intensity and CMIP6 models. Environ. Process. 2023, 10, 36. [Google Scholar] [CrossRef]
  35. Liebmann, B.; Hendon, H.H.; Glick, J.D. The relationship between tropical cyclones of the western Pacific and Indian Oceans and the Madden-Julian oscillation. J. Meteorol. Soc. Jpn. Ser. 1994, 72, 401–412. [Google Scholar] [CrossRef]
  36. Kim, J.H.; Ho, C.H.; Kim, H.S.; Sui, C.H.; Park, S.K. Systematic variation of summertime tropical cyclone activity in the western North Pacific in relation to the Madden–Julian oscillation. J. Clim. 2008, 21, 1171–1191. [Google Scholar] [CrossRef]
  37. Krishnamohan, K.; Mohanakumar, K.; Joseph, P. The influence of Madden–Julian oscillation in the genesis of north Indian Ocean tropical cyclones. Theor. Appl. Climatol. 2012, 109, 271–282. [Google Scholar] [CrossRef]
  38. Girishkumar, M.; Suprit, K.; Vishnu, S.; Prakash, V.T.; Ravichandran, M. The role of ENSO and MJO on rapid intensification of tropical cyclones in the Bay of Bengal during October–December. Theor. Appl. Climatol. 2015, 120, 797–810. [Google Scholar] [CrossRef]
  39. Bhardwaj, P.; Singh, O.; Pattanaik, D.; Klotzbach, P.J. Modulation of Bay of Bengal tropical cyclone activity by the Madden-Julian oscillation. Atmos. Res. 2019, 229, 23–38. [Google Scholar] [CrossRef]
  40. Maloney, E.D.; Hartmann, D.L. Modulation of eastern North Pacific hurricanes by the Madden–Julian oscillation. J. Clim. 2000, 13, 1451–1460. [Google Scholar] [CrossRef]
  41. Barrett, B.S.; Leslie, L.M. Links between tropical cyclone activity and Madden–Julian oscillation phase in the North Atlantic and northeast Pacific basins. Mon. Weather. Rev. 2009, 137, 727–744. [Google Scholar] [CrossRef]
  42. Klotzbach, P.J.; Oliver, E.C. Modulation of Atlantic basin tropical cyclone activity by the Madden–Julian oscillation (MJO) from 1905 to 2011. J. Clim. 2015, 28, 204–217. [Google Scholar] [CrossRef]
  43. Vitart, F. Impact of the Madden Julian Oscillation on tropical storms and risk of landfall in the ECMWF forecast system. Geophys. Res. Lett. 2009, 36, 2009GL039089. [Google Scholar] [CrossRef]
  44. Jiang, X.; Zhao, M.; Waliser, D.E. Modulation of tropical cyclones over the eastern Pacific by the intraseasonal variability simulated in an AGCM. J. Clim. 2012, 25, 6524–6538. [Google Scholar] [CrossRef]
  45. Camp, J.; Wheeler, M.C.; Hendon, H.H.; Gregory, P.A.; Marshall, A.G.; Tory, K.J.; Watkins, A.B.; MacLachlan, C.; Kuleshov, Y. Skilful multiweek tropical cyclone prediction in ACCESS-S1 and the role of the MJO. Q. J. R. Meteorol. Soc. 2018, 144, 1337–1351. [Google Scholar] [CrossRef]
  46. Lee, C.Y.; Camargo, S.J.; Vitart, F.; Sobel, A.H.; Tippett, M.K. Subseasonal tropical cyclone genesis prediction and MJO in the S2S dataset. Weather. Forecast. 2018, 33, 967–988. [Google Scholar] [CrossRef]
  47. Haertel, P.T.; Straub, K.H. Simulating convectively coupled Kelvin waves using Lagrangian overturning for a convective parametrization. Q. J. R. Meteorol. Soc. 2010, 136, 1598–1613. [Google Scholar] [CrossRef]
  48. Haertel, P.; Straub, K.; Fedorov, A. Lagrangian overturning and the Madden–Julian Oscillation. Q. J. R. Meteorol. Soc. 2014, 140, 1344–1361. [Google Scholar] [CrossRef]
  49. Haertel, P.; Boos, W.R.; Straub, K. Origins of Moist Air in Global Lagrangian Simulations of the Madden–Julian Oscillation. Atmosphere 2017, 8, 158. [Google Scholar] [CrossRef]
  50. Haertel, P. Kelvin and Rossby Wave Contributions to the Mechanisms of the Madden–Julian Oscillation. Geosciences 2022, 12, 314. [Google Scholar] [CrossRef]
  51. Reynolds, R.W.; Rayner, N.A.; Smith, T.M.; Stokes, D.C.; Wang, W. An improved in situ and satellite SST analysis for climate. J. Clim. 2002, 15, 1609–1625. [Google Scholar] [CrossRef]
  52. Haertel, P. The Relationship between Madden–Julian Oscillation Moist Convective Circulations and Tropical Cyclone Genesis. Climate 2023, 11, 134. [Google Scholar] [CrossRef]
  53. Haertel, P.; Straub, K.; Budsock, A. Transforming circumnavigating Kelvin waves that initiate and dissipate the Madden–Julian Oscillation. Q. J. R. Meteorol. Soc. 2015, 141, 1586–1602. [Google Scholar] [CrossRef]
  54. Haertel, P. Kelvin/Rossby wave partition of Madden-Julian oscillation circulations. Climate 2020, 9, 2. [Google Scholar] [CrossRef]
  55. Matsuno, T. Quasi-geostrophic motions in the equatorial area. J. Meteorol. Soc. Jpn. Ser. 1966, 44, 25–43. [Google Scholar] [CrossRef]
  56. Gill, A. Some simple solutions for heat-induced tropical circulation. Q. J. R. Meteorol. Soc. 1980, 106, 447–462. [Google Scholar]
  57. Liang, Y.; Fedorov, A.V.; Zeitlin, V.; Haertel, P. Excitation of the Madden–Julian Oscillation in Atmospheric Adjustment to Equatorial Heating. J. Atmos. Sci. 2021, 78, 3933–3950. [Google Scholar] [CrossRef]
  58. Liang, Y.; Fedorov, A.V. Excitation of the Madden-Julian Oscillation in Response to Transient Ocean Warming in SPCAM. Geophys. Res. Lett. 2022, 49, e2022GL100853. [Google Scholar] [CrossRef]
  59. Camargo, S.J.; Wheeler, M.C.; Sobel, A.H. Diagnosis of the MJO modulation of tropical cyclogenesis using an empirical index. J. Atmos. Sci. 2009, 66, 3061–3074. [Google Scholar] [CrossRef]
  60. Wang, B.; Moon, J.Y. An anomalous genesis potential index for MJO modulation of tropical cyclones. J. Clim. 2017, 30, 4021–4035. [Google Scholar] [CrossRef]
  61. Raymond, D.J.; Sessions, S.L. Evolution of convection during tropical cyclogenesis. Geophys. Res. Lett. 2007, 34. [Google Scholar] [CrossRef]
  62. Hall, J.D.; Matthews, A.J.; Karoly, D.J. The modulation of tropical cyclone activity in the Australian region by the Madden–Julian oscillation. Mon. Weather. Rev. 2001, 129, 2970–2982. [Google Scholar] [CrossRef]
  63. Bessafi, M.; Wheeler, M.C. Modulation of south Indian Ocean tropical cyclones by the Madden–Julian oscillation and convectively coupled equatorial waves. Mon. Weather. Rev. 2006, 134, 638–656. [Google Scholar] [CrossRef]
  64. Chen, J.M.; Wu, C.H.; Chung, P.H.; Sui, C.H. Influence of intraseasonal–interannual oscillations on tropical cyclone genesis in the western North Pacific. J. Clim. 2018, 31, 4949–4961. [Google Scholar] [CrossRef]
  65. Adames, Á.F.; Wallace, J.M. Three-dimensional structure and evolution of the moisture field in the MJO. J. Atmos. Sci. 2015, 72, 3733–3754. [Google Scholar] [CrossRef]
  66. Haertel, P. A Lagrangian Ocean Model for Climate Studies. Climate 2019, 7, 41. [Google Scholar] [CrossRef]
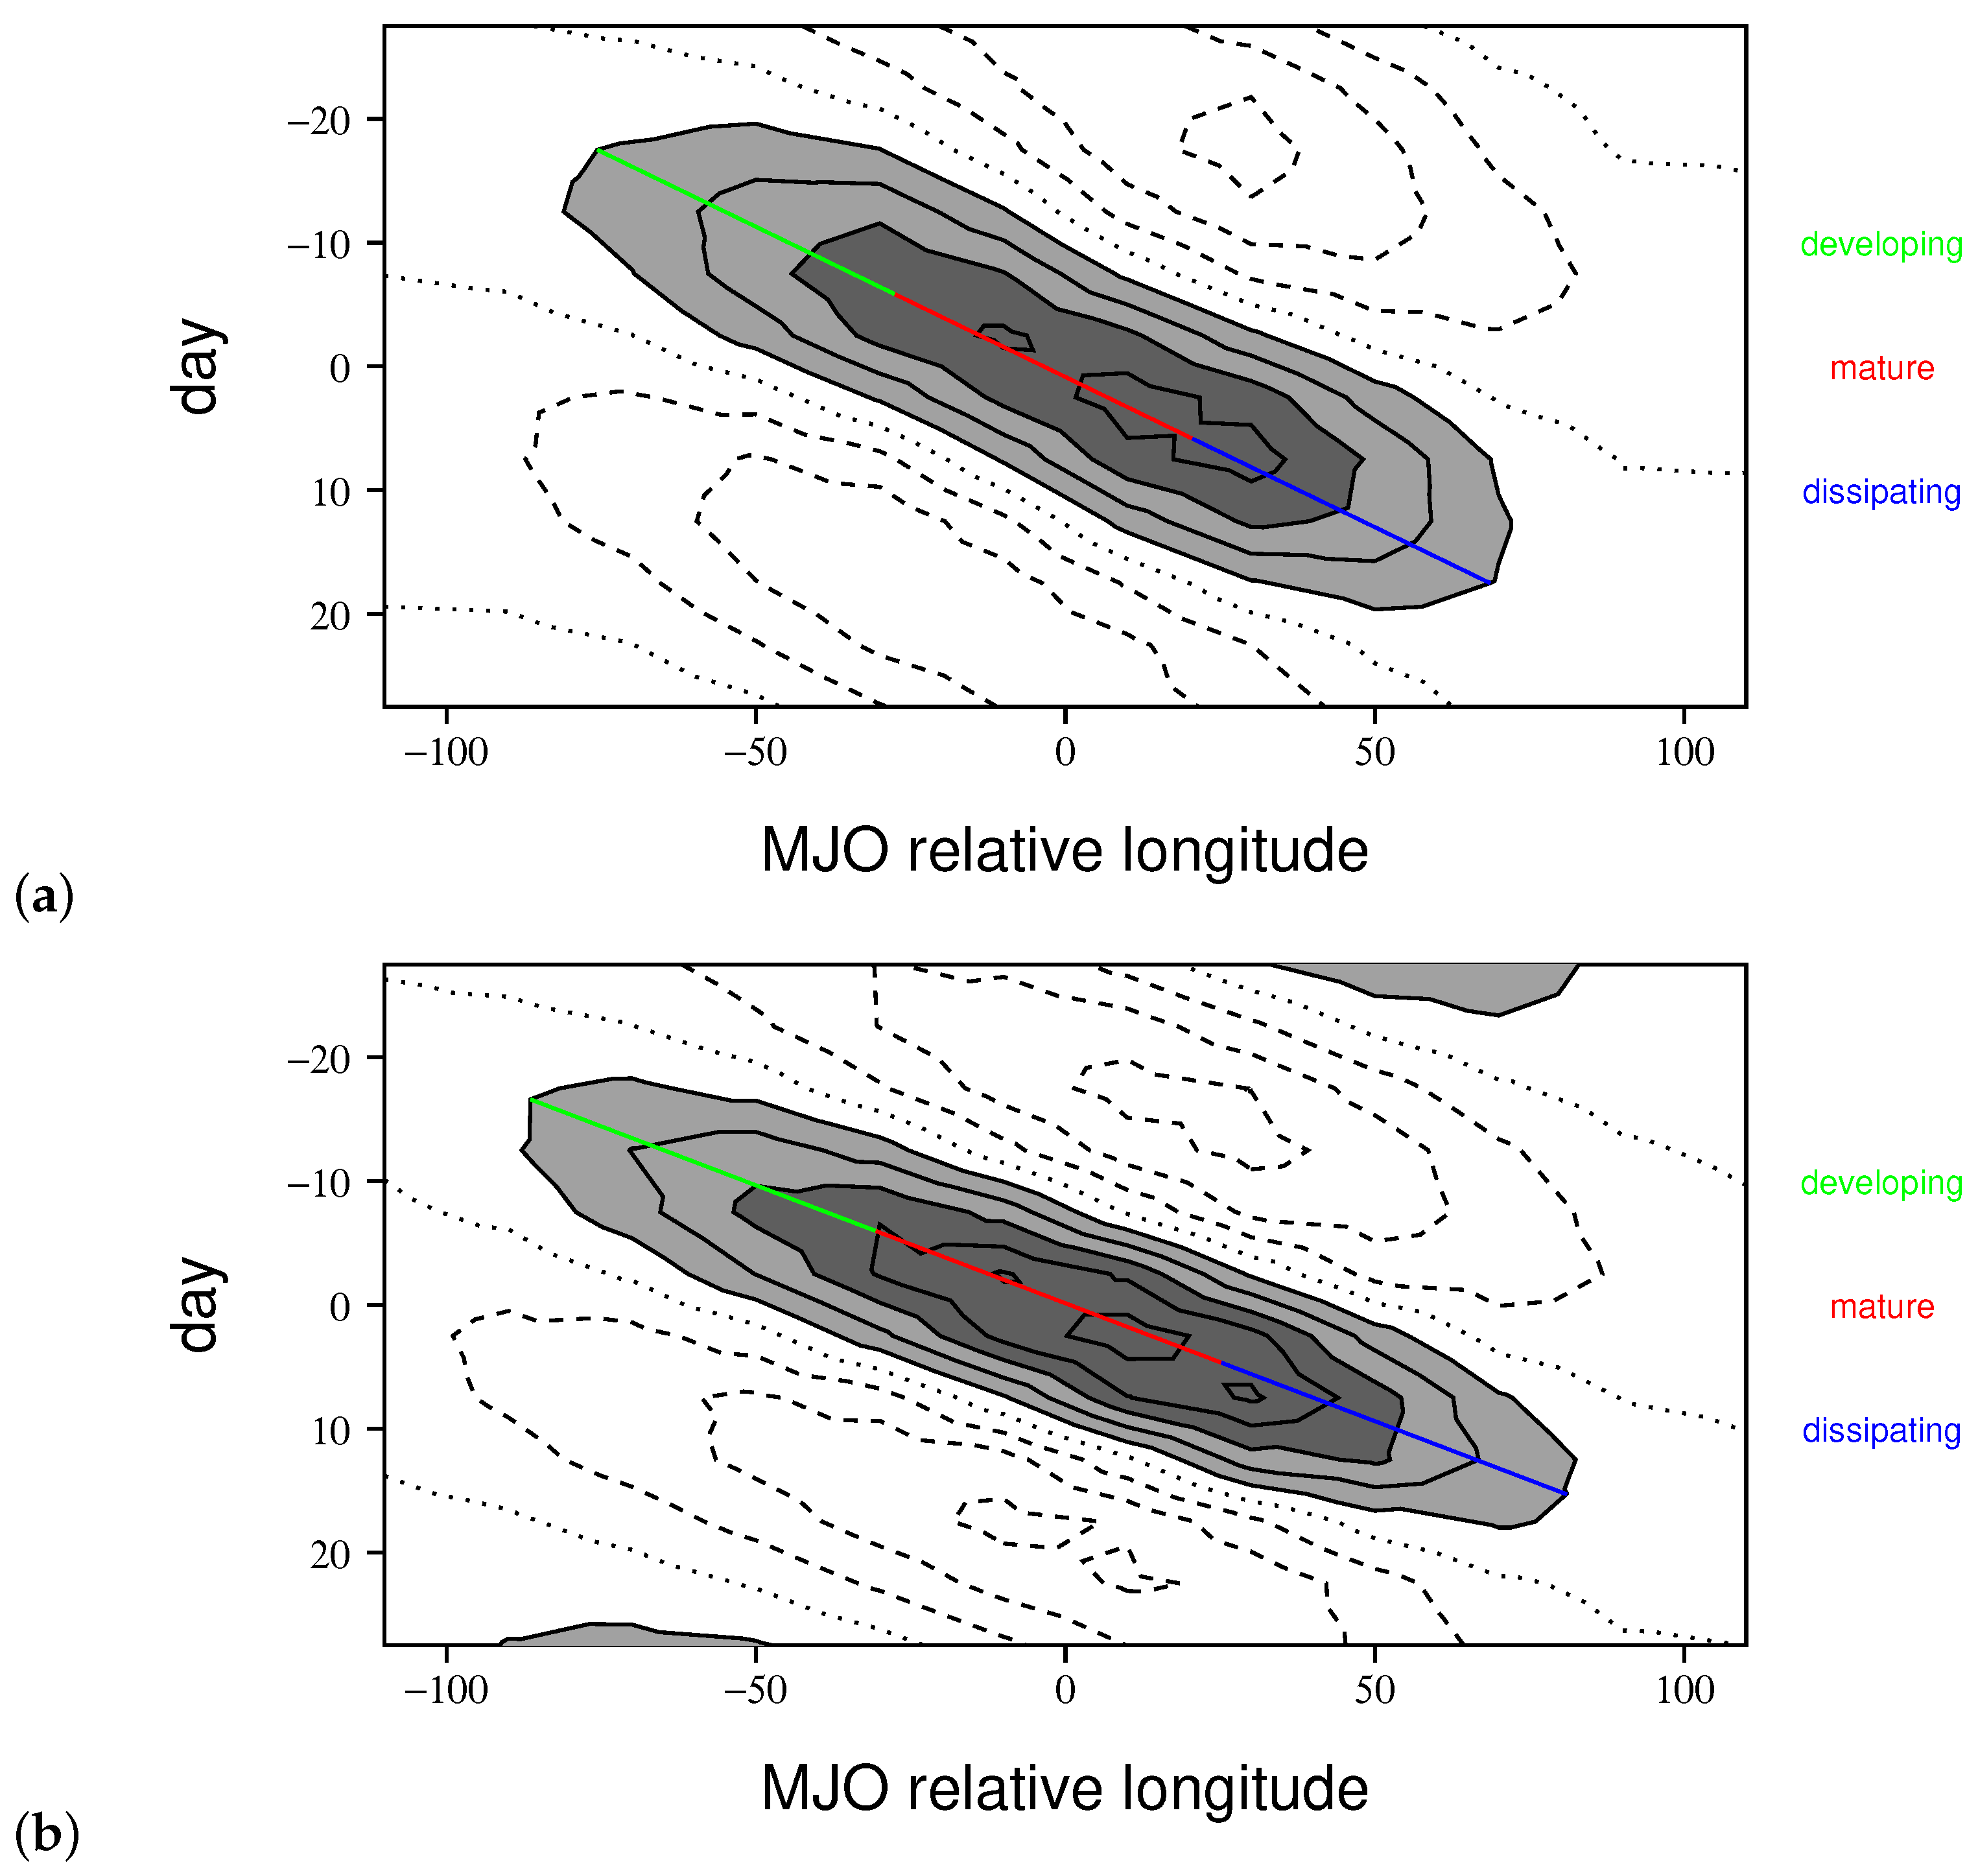
Figure 1. Time-longitue series of rainfall for composite MJOs based on (a) observations and (b) the LAM control run. The contour interval is 0.4 mm/day and values greater than 0.4 (1.2) mm/day are shaded light (dark) gray. The path of the center of the convective envelope is shown with a color coded line for each stage. Panel (a) is from [52].
Atmosphere 15 00655 g001
Figure 2. The horizontal structure of the composite MJO based on (ac) observations and (df) the LAM control run for the developing, mature, and dissipating stages, respectively. Mean 200–850 hPa temperature is contoured, vectors indicate the difference between 850 and 200 hPa flow, and rainfall greater than 1 mm/day (less than −1 mm/day) is shaded dark (light) gray. Panels (ac) are from from [52].
Atmosphere 15 00655 g002
Figure 3. Locations of TCG (green dots) from (a,b) observations from 1979 to 2014 and (c,d) the 38-year LAM control run. Panels (a,c) are for the northern hemisphere tropical storm season (May through November) and panels (b,d) are for the southern hemisphere tropical storm season (December through March). In panels (a,c), blue contours are shown for 1, 5, and 10 storms per latitude/longitude bin (dotted, dashed, solid lines respectively). In panels (b,d), blue contours are shown for 1, 3, and 7 storms per lattitude/longitude bin (dotted, dashed, solid lines respectively). Bins span 10 degrees in longitude and 5 degrees in latitude. Panels (a,b) are adapted from [52].
Atmosphere 15 00655 g003aAtmosphere 15 00655 g003b
Figure 4. The Kelvin wave circulation component for the composite MJO based on (ac) observations and (df) the LAM control run for each of the developing, mature, and dissipating stages of the convective envelope (contoured and shaded as in Figure 2). Locations of TCG are shown with green dots in the frame of reference of the MJO for each stage. Panels (ac) are adapted from [52].
Atmosphere 15 00655 g004
Figure 5. The Rossby wave circulation component for the composite MJO based on (ac) observations and (df) the LAM control run for each of the developing, mature, and dissipating stages of the convective envelope (contoured and shaded as in Figure 2). Locations of TCG are denoted with green dots in the frame of reference of the MJO for each stage. Panels (ac) are adapted from [52].
Atmosphere 15 00655 g005
Figure 6. The number of TCG points divided by the expected number based on monthly climatology for (a) observations from 1979 to 2014 and (b) the LAM control run for each of the developing (dotted), mature (dashed), and dissipating (black) stages of the MJO. The blue line shows the average over all of the stages, with points significant at the 95 percent confidence level marked with blue boxes. TCG counts and climatologies are counted over 30-degree wide longitude bins (including all latitudes). Panel (a) is adapted from [52].
Atmosphere 15 00655 g006
Figure 7. Time-longitude series of rainfall for the composite MJO based on the LAM SSP585 run (contoured and shaded as in Figure 1).
Atmosphere 15 00655 g007
Figure 8. Locations of TCG events (green dots) for the LAM SSP585 run. Panel (a) is for the northern hemisphere tropical storm season (May through November) and panel (b) is for the southern hemisphere tropical storm season (December through March). In panel (a), blue contours are shown for 1, 5, and 10 storms per latitude/longitude bin (dotted, dashed, and solid contours respectively). In panel (b), blue contours are shown for 1, 3, and 7 storms per lattitude/longitude bin (dotted, dashed, and solid contours respectively). Bins span 10 degrees in longitude and 5 degrees in latitude.
Atmosphere 15 00655 g008
Figure 9. (ac) The horizontal structure of the composite MJO for the LAM SSP585 run for the developing, mature, and dissipating stages of the convective envelope, respectively (contoured and shaded as in Figure 2).
Atmosphere 15 00655 g009
Figure 10. (ac) The Kelvin wave circulation component for the composite MJO based on the LAM SSP585 run for each of the developing, mature, and dissipating stages of the convective envelope (contoured and shaded as in Figure 2). Locations of TCG are shown with green dots in the frame of reference of the MJO for each stage.
Atmosphere 15 00655 g010
Figure 11. (ac) The Rossby wave circulation component for the composite MJO based on the LAM SSP585 run for each of the developing, mature, and dissipating stages of the convective envelope (contoured and shaded as in Figure 2). Locations of TCG are denoted with green dots in the frame of reference of the MJO for each stage.
Atmosphere 15 00655 g011
Figure 12. The number of TCG points divided by the expected number based on monthly climatology for the LAM SSP585 run for each of the developing (dotted), mature (dashed), and dissipating (black) stages of the MJO. The blue line shows the average over all of stages, with points significant at the 95 percent confidence level marked with blue boxes. TCG counts and climatologies are counted over 30-degree wide longitude bins (including all latitudes).
Atmosphere 15 00655 g012
Disclaimer/Publisher’s Note: The statements, opinions and data contained in all publications are solely those of the individual author(s) and contributor(s) and not of MDPI and/or the editor(s). MDPI and/or the editor(s) disclaim responsibility for any injury to people or property resulting from any ideas, methods, instructions or products referred to in the content.