Article

The Recovery and Re-Calibration of a 13-Month Aerosol Extinction Profiles Dataset from Searchlight Observations from New Mexico, after the 1963 Agung Eruption

1
Ephyslab, Departamento de Física Aplicada, Área de Física de la Tierra, Universidade de Vigo, Campus Sur, Rúa Canella da Costa da Vela 12, 32004 Ourense, Spain
2
Grupo de Óptica Atmosférica (GOA-UVA), Departamento de Física Teórica, Atómica y Óptica, Facultad de Ciencias, Universidad de Valladolid, Paseo de Belén 7, 47011 Valladolid, Spain
3
School of Earth and Environment, University of Leeds, Leeds LS2 9JT, UK
4
National Centre for Atmospheric Science (NCAS-Climate), University of Leeds, Leeds LS2 9JT, UK
5
NOAA ESRL Global Monitoring Laboratory, Boulder, CO 80305, USA
6
National Centre for Earth Observation (NCEO), University of Leeds, Leeds LS2 9JT, UK
7
Laboratory for Atmospheric and Space Physics, University of Colorado at Boulder, Boulder, CO 80303, USA
8
Shaanxi Atmospheric Detection Technology Support Center, Meteorological Institute of Shaanxi Province, China Meteorological Administration, Xi’an 710014, China
9
Department of Physics and Engineering Physics, Central Connecticut State University, New Britain, CT 06050, USA
10
Air Force Geophysics Laboratory (AFSC), Hanscom Air Force Base, Bedford, MA 01731, USA
*
Author to whom correspondence should be addressed.
Deceased.
Atmosphere 2024, 15(6), 635; https://doi.org/10.3390/atmos15060635
Submission received: 28 March 2024 / Revised: 9 May 2024 / Accepted: 15 May 2024 / Published: 24 May 2024
(This article belongs to the Special Issue Ozone in Stratosphere and Its Relation to Stratospheric Dynamics)

Abstract

:
The recovery and re-calibration of a dataset of vertical aerosol extinction profiles of the 1963/64 stratospheric aerosol layer measured by a searchlight at 32° N in New Mexico, US, is reported. The recovered dataset consists of 105 aerosol extinction profiles at 550 nm that cover the period from December 1963 to December 1964. It is a unique record of the portion of the aerosol cloud from the March 1963 Agung volcanic eruption that was transported into the Northern Hemisphere subtropics. The data-recovery methodology involved re-digitizing the 105 original aerosol extinction profiles from individual Figures within a research report, followed by the re-calibration. It involves inverting the original equation used to compute the aerosol extinction profile to retrieve the corresponding normalized detector response profile. The re-calibration of the original aerosol extinction profiles used Rayleigh extinction profiles calculated from local soundings. Rayleigh and aerosol slant transmission corrections are applied using the MODTRAN code in transmission mode. Also, a best-estimate aerosol phase function was calculated from observations and applied to the entire column. The tropospheric aerosol phase function from an AERONET station in the vicinity of the searchlight location was applied between 2.76 to 11.7 km. The stratospheric phase function, applied for a 12.2 to 35.2 km altitude range, is calculated from particle-size distributions measured by a high-altitude aircraft in the vicinity of the searchlight in early 1964. The original error estimate was updated considering unaccounted errors. Both the re-calibrated aerosol extinction profiles and the re-calibrated stratospheric aerosol optical depth magnitudes showed higher magnitudes than the original aerosol extinction profiles and the original stratospheric aerosol optical depth, respectively. However, the magnitudes of the re-calibrated variables show a reasonable agreement with other contemporary observations. The re-calibrated stratospheric aerosol optical depth demonstrated its consistency with the tropics-to-pole decreasing trend, associated with the major volcanic eruption stratospheric aerosol pattern when compared to the time-coincident stratospheric aerosol optical depth lidar observations at Lexington at 42° N.

1. Introduction

Substantial advances have been achieved in our understanding of large-magnitude explosive volcanic eruptions. Those advances include the simulations and understanding of the volcanic aerosol physico-chemical processes and radiative forcings, e.g., [1], the sometimes-complex interactions with the Earth’s surface climate, e.g., [2], and the atmospheric composition [3]. Current international scientific cooperation on this subject includes two series of multi-model experiments, each investigating a different aspect of the atmospheric effects from the largest volcanic eruptions of the last century. The VolMIP initiative [4] is exploring the climate response to major volcanic eruptions [5] and is aligned with the CMIP6 climate-modeling activity. Additionally, to VolMIP, the ISA-MIP initiative [6] focuses on the aerosol radiative forcing from major eruptions, organized within the framework of the Stratospheric Sulfur and its Role in Climate (SSiRC) initiative, itself part of the World Climate Research Program’s SPARC initiative (Stratosphere–Troposphere Processes And their Role in Climate). The HErSEA experiment within ISA-MIP focuses on the formation and global dispersion of the volcanic aerosol clouds from the three largest tropical eruptions of the 20th century: Agung, El Chichón, and Pinatubo [7]. Among these eruptions, the Agung aerosol cloud is particularly uncertain.
A recent analysis re-assessing the variability in and global distribution of the Agung aerosol cloud [8] raises again the issue of the few available observational datasets. The study also highlights the large differences between the recommended volcanic forcing datasets for the Agung period used for CMIP6 [9] and CMIP5 [10] simulations.
Substantial uncertainty is also present for the 1982 El Chichón eruption (the forcing relying primarily on aircraft lidar observations [11], and to some extent also for the 1991 Pinatubo eruption, due to the SAGE-II gap period [12]. The potential for other observation datasets to potentially reduce the uncertainty in these strong radiative forcings is the primary motivation for a “Data Rescue activity” within SSiRC, specifically focused on the periods after major volcanic eruptions (http://www.sparc-ssirc.org/data/datarescueactivity.html, accessed on 9 November 2023).
The first phase of the SSiRC data activity recovered two important lidar aerosol extinction profile datasets, each adding important constraints about major volcanic aerosol clouds to be analyzed in the ISA-MIP HErSEA activity. First is about the uncertainty in the tropical portion of the Pinatubo aerosol cloud, which was reduced by revising a series of ship-borne lidar aerosol extinction profiles from two series of trans-Atlantic cruises on different Soviet vessels from July to September 1991, and in January and February 1992 [13]. The Professor Zubov ship crossed the Atlantic from Europe to the Caribbean (~40° to 8° N) between July and September 1991 and Professor Vize from Europe to south of the Equator (~4° N to 8° S) between January and February 1992. Second, for the uncertain Agung aerosol forcing, the first ever multi-year program of ground-based lidar observations was recovered and re-calibrated, made from Lexington, Massachusetts from January 1964 to August 1965 [14].
This article reports the recovery and re-calibration of an even earlier active remote-sensing dataset of the Northern Hemisphere-dispersed Agung aerosol cloud, the 550 nm aerosol extinction profiles from a searchlight at White Sands (~32° N), New Mexico, US, between December 1963 and December 1964 [15].

1.1. A Brief Historical Context for the Searchlight Atmospheric Profiling Technique

The application of the searchlight instrument for atmospheric research was first proposed by Synge [16]. Later, Tuve [17] described and tested in a laboratory a method to reach high altitude levels by modulating a searchlight beam with a rotating shutter using a resonant amplifier to select a modulating frequency, allowing to discriminate the scattered light from that from the night sky. A phototube was required for detection. In 1937 the first experiment measuring the light scattered from a beam in a region above the tropopause, up to 22 km, was reported [18]. The detection method was photographing the beam instead of the modulating method cited above. Measured brightnesses for various altitudes up to 22 km were compared with the theoretical brightness of the beam that provided evidence of non-Rayleigh scattering below 11 km. Two years later, using a beam modulated with a rotating shutter, scattering was measured up to 25 km, showing good agreement between the observations and the theory above 8 km, assuming non-Rayleigh scattering as the primary reason for the discrepancies found below 8 km [19].
The searchlight technique continued its development with newer instruments used for atmospheric density observations in several countries such as the US [20], the United Kingdom [21], and the former Soviet Union [22]. However, the invention of the laser by [23], supported by theoretical work on the extension of maser technology to the infrared and visible regions of the spectrum [24], led to the replacement of searchlight projectors by lasers and the birth of lidar. Nevertheless, searchlight observations of the aerosols at White Sands, New Mexico, were conducted from February 1963 until May 1975, supported by the Air Force Cambridge Research Laboratory [25].

1.2. The New Mexico Searchlight Observations and the SSiRC Focus on the Agung Aerosol Cloud

The rescued and re-calibrated dataset of stratospheric aerosols extinction profiles reported in this article is derived from searchlight observations conducted at White Sands, New Mexico, US, between December 1963 and December 1964. The searchlight dataset recovery is the third post-Agung dataset to be rescued and re-calibrated within the SSiRC data rescue activity. First, a 20-month program of 66 lidar-profile observations of 694 nm attenuated backscatter from Lexington, MA, between January 1964 and August 1965 [26], were recovered from dataset tables within a PhD thesis from the Massachusetts Institute for Technology [27]. The recovered 694 nm observations were re-calibrated and converted to the main 550 nm mid-visible wavelength [9]. Second, within the same ESSD paper [9], a high-latitude dataset from nine additional AFCRL lidar profiles from College, Alaska, during July and August 1964, recovered also from Gerald Grams’s PhD thesis, were also re-calibrated, and both datasets were published within an open-access data repository [28]. The re-calibration methodology in both datasets principally involved applying transmission corrections for atmospheric molecular (hereinafter Rayleigh) density, tropospheric and stratospheric aerosol, and ozone profiles [9].
Together with the 1964/65 rescued and re-calibrated aerosol extinction profiles from Lexington, MA, and Fairbanks, AK, the White Sands, NM, dataset presented in this work will provide a 21-month dataset for the vertical profile evolution of the NH-dispersed portion of the Agung aerosol cloud, complementing gaps in the Lexington record, for a complete record from December 1963 through to August 1965.
The earliest available report of the searchlight observations is from Albuquerque, New Mexico, in August 1950 [29]. They used a searchlight projector that was installed at Cedro Peak (2.36 km a.s.l.) and the detector at Sandia Crest (3.54 km a.s.l.), with a distance of 20.5 km between both, and the observations continued until 1952 [30]. Later, Elterman and Campbell [31] described the installation of the searchlight at White Sands, New Mexico, whose location and geometry are described in the next section.
Our approach involves first applying the original methodologies and observations conducted more than 50 years ago and aligns with the philosophy of the SSiRC data rescue activity to secure and preserve the detailed information included in the reports, whenever it is possible. Second, apply and explain the original nomenclature and variable symbols used in the parent articles and reports.
It should be noted that, whereas today the terms extinction and attenuation are used interchangeably, and represent the same physical quantity, within the AFCRL report [32], the term “extinction” was used only for the sum of aerosol and molecular (hereinafter, Rayleigh) extinctions. The term “attenuation” was used when referring to the component Rayleigh and aerosol extinctions. The distinction is illustrated on page 11, second paragraph, second sentence in [32] and in [33] page 13, Section 5.1, definition of Equation (8). Within this article, however, the term extinction is used in all cases (rather than attenuation), with the precursor words “Rayleigh”, “aerosol” or “total” then specifying the corresponding quantity.
In Section 2, the searchlight instrument is described, the equation used for computing the aerosol extinction profiles is shown, and its solution is explained. Section 3 describes the motivations to go beyond the data rescue of the aerosol extinction profiles and conduct its re-calibration, explaining, in brief, its design. Section 4 describes the methods used to re-digitize the aerosol extinction profiles from the AFCRL report’s Figures and to evaluate the errors in this initial step of the dataset’s recovery and re-calibration. Section 5 explains the procedure for retrieving the normalized detector response, the sources of the original variables used, and an evaluation of the errors retrieved from the normalized detector response. Section 6 describes the parameters used to compute the re-calibrated aerosol extinction profiles. Section 7 presents the preliminary re-calibrated aerosol extinction profiles, the limitations found in the procedure, and the adjustments conducted to improve it. This section also includes the quantification of the impact of the updated parameters on the aerosol extinction profiles. In Section 8, the resulting re-calibrated aerosol extinction profiles and the tropospheric and stratospheric aerosol optical depths are shown and discussed. A comparison with the few available aerosol extinction profiles and stratospheric aerosol optical depths is conducted in this section. Also, the estimated errors in the whole procedure from the re-digitized to the re-calibrated aerosol extinction are shown and explained.

2. Searchlight Instrument and Observations Processing

2.1. The Searchlight Instrument

Early searchlight observations of the stratospheric density have already been cited above. In 1964, a new searchlight setup for aerosol observations both in the troposphere and in the stratosphere was installed in White Sands, New Mexico. It consisted of a detector located at Sacramento Peak (32°47′ N, 105°49′ W, 2.76 km a.s.l.) 30 km from the projector, whose exact location was not identified in [31]. It was not identified in the rest of the publications associated with the aerosol’s observation from this searchlight. After multiple searches, the projector location was found at Two Buttes (also called Twin Buttes) 32°42′ N, 106°08′ W, 1388 m [34]. The searchlight geometry is shown in Figure 1 from [31] and reproduced here as Figure 1 also.
The instrument consisted of a searchlight (the projector) beam collimated by a 36-inch mirror and modulated by shutters in front of the projector (Figure 5 in Elterman [32,33]) at 20 cycles s−1, converting the continuous light emission into pulsed signals. The source intensity was measured by an auxiliary detector, mounted on the searchlight that also generated a signal synchronous with the modulation. The intensity level and synchronous signal were transmitted by conventional telephone to the detector site (~30 km distant), where the optical collector, synchronous detector (photomultiplier), amplifier, and recorder were located. The sky background was minimized using the very narrow frequency-band pulses generated by the shutters and the synchronous modulated signal to limit the exposition time of the photomultiplier to the one corresponding to the emitted light pulses.
The beam elevation angle was fixed, while the collector mirror scanned up and down the beam, providing a continuous record of scattered light intensity as a function of altitude. For the detection, a photomultiplier was used with a 550 nm filter with a FWHM of 55 nm. The monitored source intensity, the scattered light intensity, and the elevation angle of the collecting mirror were recorded simultaneously on a chart paper. The 30 km baseline was chosen to provide good spatial resolution for the observations. The starting altitude of the upward scan (0° elevation of the collector mirror) was 2.76 km above sea level.

2.2. Searchlight Observations and Its Original Processing

The dataset consists of 105 aerosol extinction profiles for altitudes between 2.76 and 35 km, measured during the period 12 December 1963 through 12 December 1964 [32]. Individual searchlight aerosol extinction observations were conducted between sunset and sunrise. The date of each consecutive set of observations from sunset to sunrise was selected from the date after 00:00 MST, resulting in 36 nights of observations, with the number of observations ranging from one to a maximum of seven per night and an average of three per night. The list of the 105 observations grouped by the nights they were conducted is in Table S1 (in Supplementary Materials).
According to Elterman [32], five main factors limited the number of profiles acquired in the cited period. They were (verbatim):
(1)
The operational time that could be allowed was limited;
(2)
Operations were conducted only during moonless nights in order to keep noise background at a minimum;
(3)
Operations were canceled when meteorological conditions were unfavorable. This included high winds as well as cloudy skies. July and August seasonally are months when both dust storms and cloudy skies occur daily in New Mexico;
(4)
Equipment difficulties accounted for the absence of data in January 1964 and at other times;
(5)
Failure of site facilities, especially telephone lines, resulted in considerable loss of time. Synchronous rectification and amplification depended on the transmission of the synchronizing signal by telephone.
Applying the energy-transfer equations to the scene geometry shown in Figure 1, assuming the aerosol extinction around 35 km is sufficiently small to be neglected and normalizing to unity at 35.3 km, the aerosol extinction coefficient ( β p h in km−1) was derived [32,33]:
β p z = E r p ( z ) E r p ( 35 )     T R ( 35 ) T R ( z )     T p ( 35 ) T p ( z )     β R 35     P R ( 132 ° ) P p ( φ s ( z ) ) β R z     P R ( φ s ( z ) ) P p ( φ s ( z ) )
where z is the altitude (km), E r p ( z ) is the instrumentation response (volts), E r p ( z ) E r p ( 35 ) is the normalized detector response with respect to E r p ( 35 ) , β p z the aerosol extinction coefficient (km−1),   β R z the Rayleigh extinction coefficient (km−1), P p ( φ s ( z ) ) the normalized aerosol phase function, P R ( φ s ( z ) ) the normalized Rayleigh phase function, φ s ( z ) scattering angle, and T p z and T R z the aerosol and Rayleigh slant transmissions.
According to the Elterman reports [32,33], the vertical profiles of the initial aerosol slant transmission ( T p z I n i t ) and T R z were derived using vertical profiles of β p z and β R z from the Atmospheric Attenuation Model [35], using Equation (15) reported by Elterman [33].
The solution of Equation (1) is not analytic because T p z   is a function of β p z . Therefore, an iterative-convergent procedure was applied. The iterative method, in brief, began by first calculating an initial profile of T p z ,   which is denoted as T p z O r i g , using β p z at 550 nm from the Atmospheric Attenuation Model [36]. Then, T p z O r i g   was used to derive the initial profiles of β p z , and the iteration procedure of the T p z and β p z calculus began until convergence was reached.

3. The Recovery of the Searchlight 550 nm Aerosol Extinction Profiles and Estimated Errors

The goal of the recovery was to produce and store on a public scientific data repository the originally calculated β p z , and here re-digitized β p D i g i t and to evaluate the errors introduced in its re-digitization. The 105 Figures within the AFCRL report [32] consist of dots (for the total, Rayleigh + aerosol, extinction) and crosses for the aerosol extinction, both in units of km−1, plotted on a logarithmic x-axis scale. The y-axis is the altitude, with 58 points for each of the 58 elevation angles (0° to 57°). The detector was retrieved for a complete profile observation [32,33]. Several of the profiles have missing aerosol extinction points above 30 km, which will be discussed below.
The re-digitalization process used the WebPlotDigitizer software, version V4.1 [37], providing among its facilities the capacity to digitize logarithmic plotted profiles. Both total extinction and aerosol extinction profiles were re-digitized, but only the last one was used for the work reported here because only detailed information about the procedure to calculate the aerosol extinction profiles is available. The Rayleigh extinction profiles from the US Standard Atmosphere 1962, as well as ones derived from local soundings, are used. The re-digitized aerosol extinction ( β p D i g i t z ) profiles were checked for consistency, plotted, and compared with the respective individual plots in [33]. Then, each profile was interpolated to the corresponding altitude of the observations. It was already mentioned that several of the profiles are interrupted in the range between 30.44 km (level 52) and 34.41 km (level 57), totaling 135 missing values, representing the 21% from 30.44 km to 34.41 km and 2.3% from 2.76 km to 34.41 km. In the archived datasets version submitted to the PANGAEA open-access dataset repository, all the missing levels of β p D i g i t z were left empty [38]. For the purposes of this research, most of the missing levels were filled in with the daily aerosol extinction profile averages, and the very few remaining were filled by linear extrapolation. Assuming an atmosphere with only two scattering components and the normalization of the detector response, the values of the aerosol extinction profiles in the re-digitized and re-calibrated profiles at the top level 58 (35.2 km) were filled with the values of the Rayleigh extinction at the same altitude from Table 5.11 in Elterman [36], 8.03 × 10⁻⁵ km−1.
To estimate the errors in the re-digitalization process, the tabulation of data for the observations for 13 April 1964 at 00:18 MST in Table S2 in Supplementary Materials was used. Table S2 shows, for each degree of the collector’s elevation angle, two variables completing the description of the geometry of the observation: the scatter volume altitude (km) and the scatter angle (degrees). It also contains the E r p ( z ) E r p ( 35 ) , followed by the β R z and the β p z , denoted by β R T a b z and β p T a b z , respectively. β R T a b z in this Table matches the same variable, after interpolation, in Table 5.11 in Elterman [36], available at 1 km. The tabulated variables are distributed vertically in two lower levels (2.76 and 3.28 km), the top level at 35.28 km for the 21 levels just above the tropopause (12.65 to 23.20 km). The layer between 12.65 and 23.20 km is associated with the detector elevation angles of 20° to 40° (detector zenith angles 70° to 50°). The layer between those altitudes, from that specific day, was identified as the “20 km aerosol layer” and used to illustrate the aerosol and aerosol + Rayleigh slant transmissions that will be shown and discussed below [32,33]. It is important to highlight the fact that Table S2 is the only available source of numerical information to validate the original processing procedure.
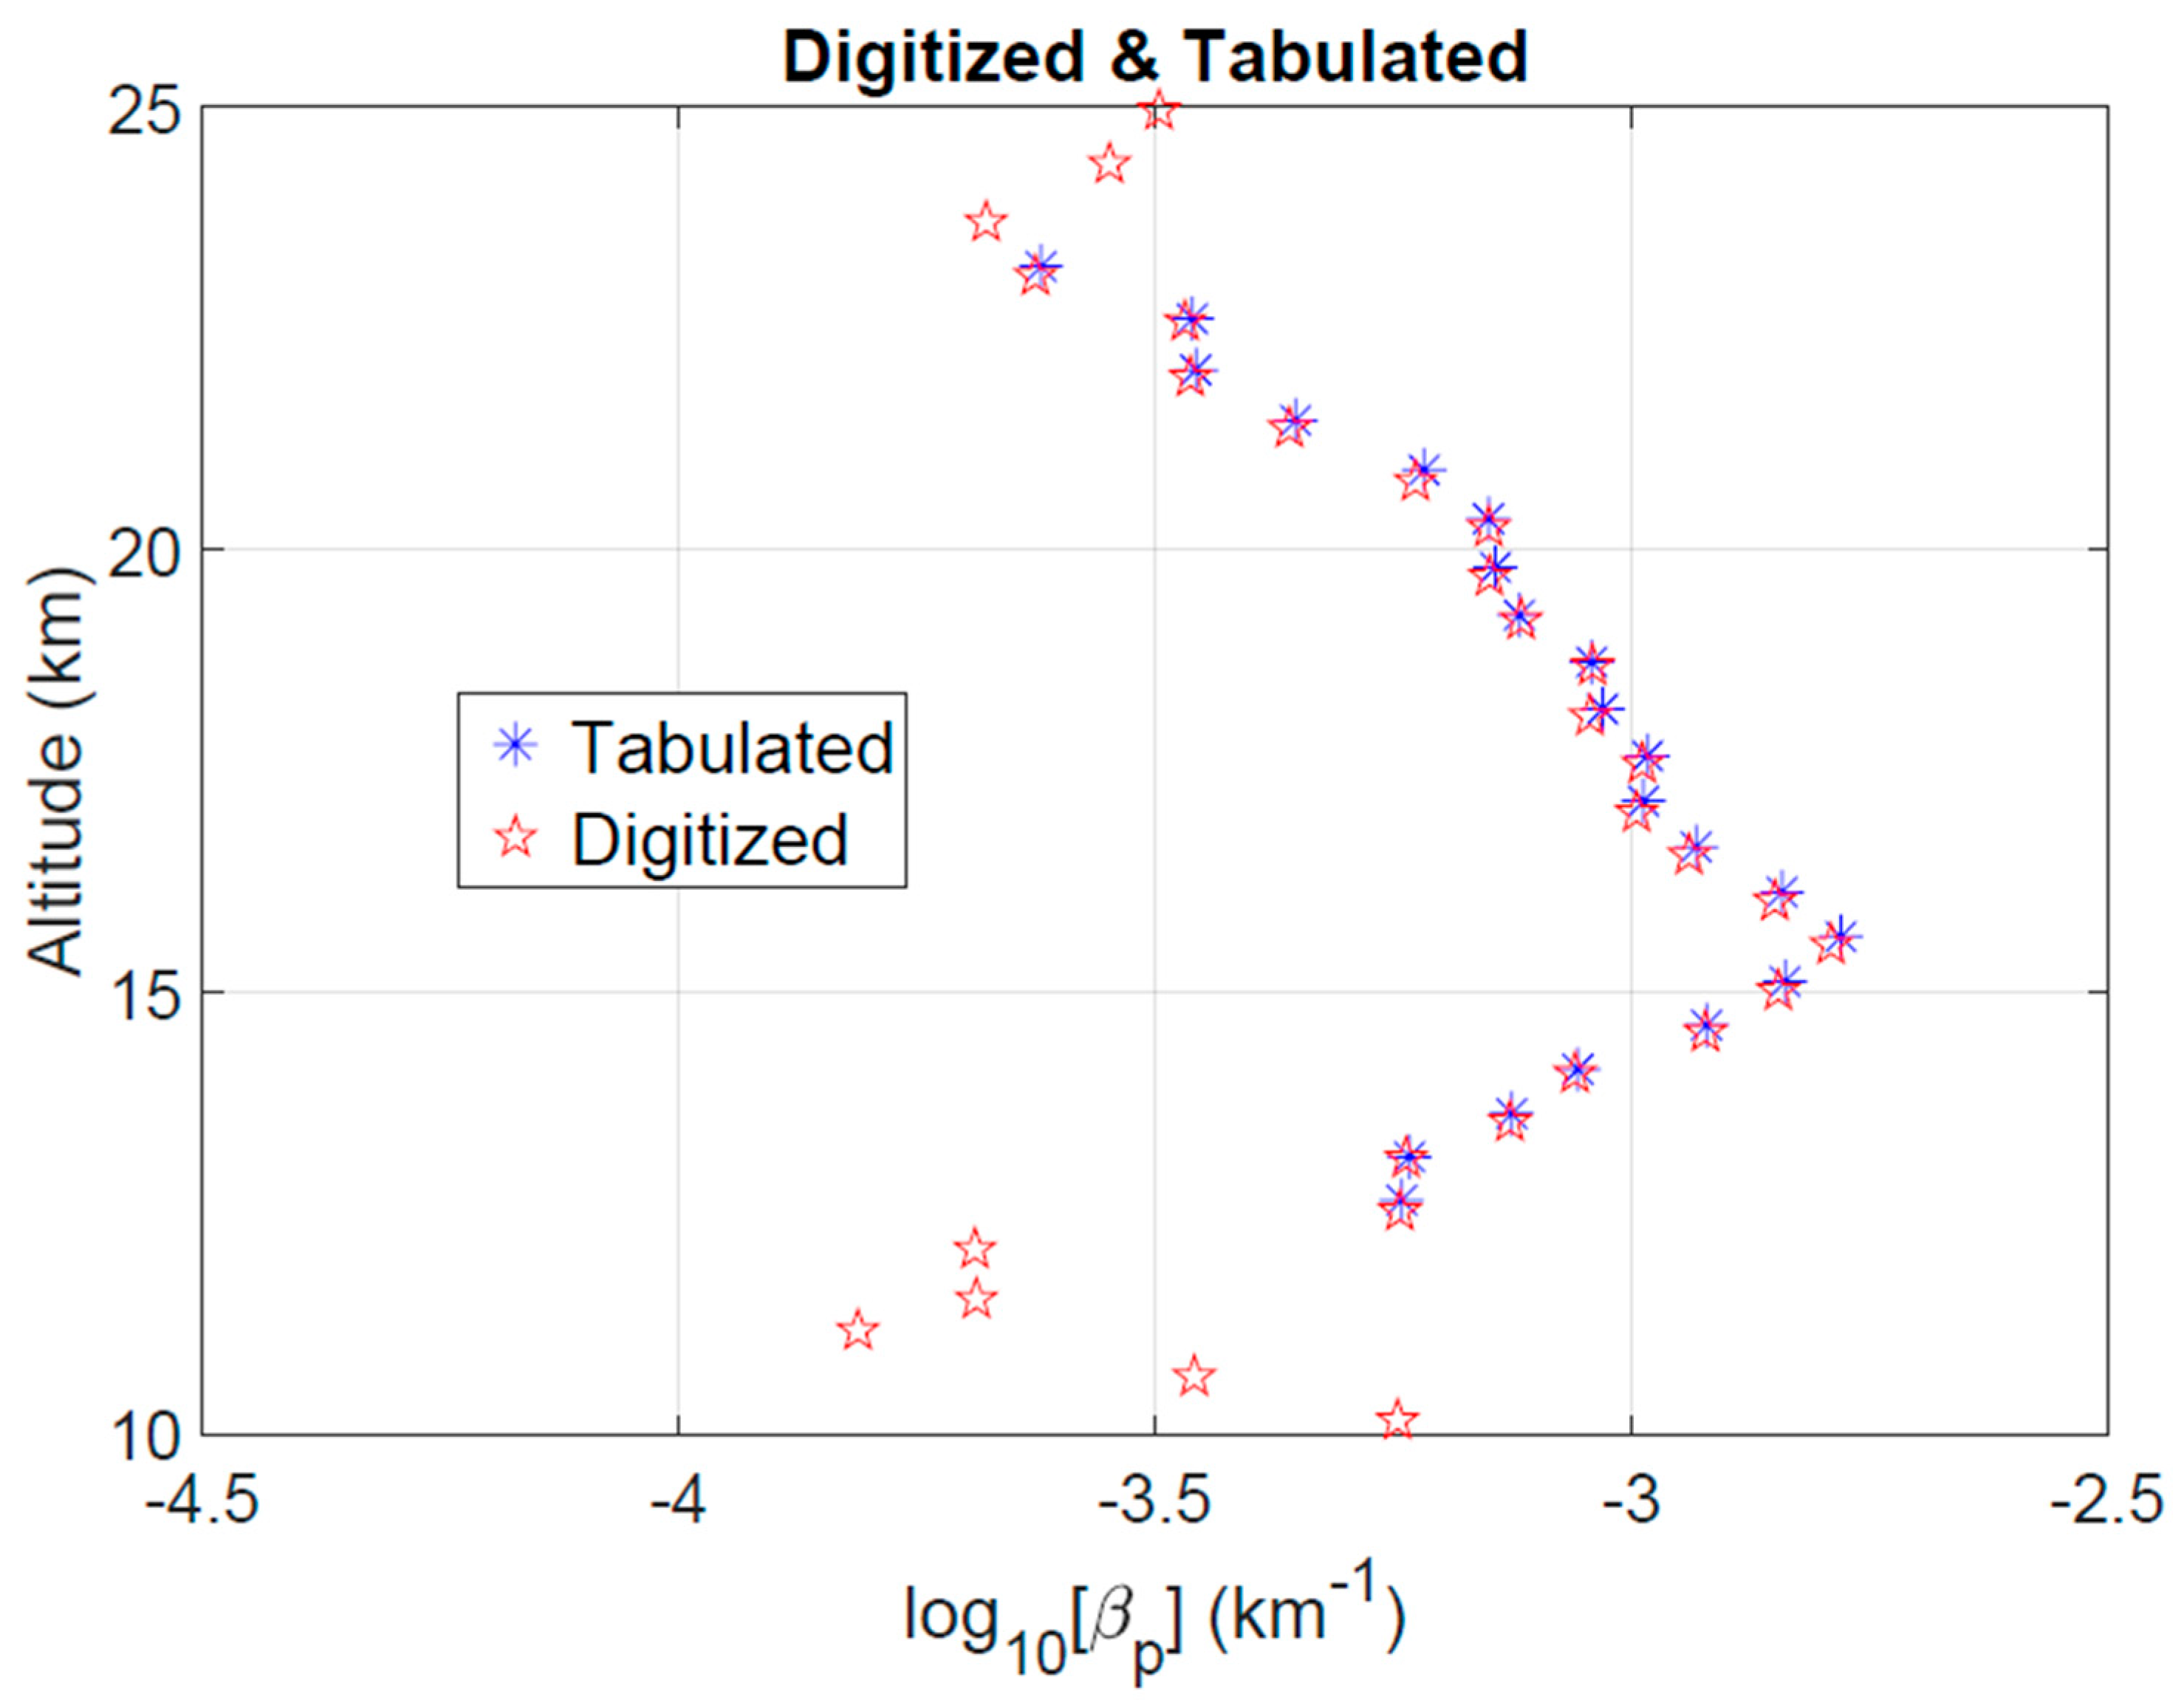
The available levels of the original β p z profile in the Table S2 ( β p T a b z ) and the corresponding levels at the re-digitized β p z profile ( β p D i g i t z ) on the same day were compared. Figure 2 shows the vertical profiles of the logarithms of both the β p D i g i t z and β p T a b z profiles for 13 April 1964 at 00:18. Their values are in the range of 10−2 to 10−4 km−1, showing a very good agreement between 12 and 23 km, with the available tabulated β p T a b z values, shown in Figure 2. The mean value of the differences between β p D i g i t z and β p T a b z for the entire profile section is 1.65 × 10⁻⁵ km−1, i.e., an order of magnitude lower than the values in Figure 2.
The relative differences between the tabulated and the re-digitized aerosol extinction coefficients with respect to the tabulated values are a little lower than 4%, and the average is 1.2%. In the case of the altitude, using its values tabulated in Table S2 and the ones re-digitized, the error produced by the re-digitalization has a mean value of 0.08 km, equivalent to a relative error lower than 1%. This error is inside the 0.05 km to 0.09 km error interval reported for the searchlight altitudes determination [32]. The results discussed above demonstrate that the errors introduced in the re-digitalization procedure do not have a significant impact on the values retrieved using this procedure.

4. The Re-Calibration Procedure: Constrains, Improvements, and Design

The goal of the re-calibration was to produce and store on a public scientific data repository, in addition to the re-digitized β p D i g i t , a re-calibrated version of β p R e c a l z , documenting its constrains and improvements. Potential users, with all the information provided, will judge which of them fits better to their interests.

4.1. Constrains

The constrains are associated with the lack of information about the observed E r p ( z ) E r p ( 35 ) profiles and the lack of T p z profiles to retrieve the observed E r p ( z ) E r p ( 35 ) profiles by inverting Equation (1), as applied in Elterman [32,33]. They limit this work to a re-calibration of the rescued dataset instead of a full re-calculation that includes the iterative-convergent procedure for T p z and β p z . The first constrain, affecting the retrieval of E r p ( z ) E r p ( 35 ) using Equation (2), originates in the smoothing of E r p ( z ) for the last few kilometers applied to deal with the noise and background issues on E r p ( 35 ) , causing negative values in the calculated β p z profiles. The lack of information about the observed E r p z profiles do not allow for testing by applying the mathematical tools used in current lidar processing to deal with background and noise issues. The second constrain, affecting both the retrieval E r p ( z ) E r p ( 35 ) using Equation (2) and the re-calibration of β p z using Equation (1) and the retrieved E r p ( z ) E r p ( 35 ) profiles, is the iteration-convergent procedure. In brief, the adjustments of E r p ( 35 ) in the iterative-convergent procedure were conducted if negative β p z values were present during the iteration-convergent procedure. Then, E r p ( 35 ) was reduced repeatedly by 0.001 until only positive β p z values exist. No information is available about which of the observed profiles were the subject to E r p ( 35 ) reduction by 0.001 at least one time.
In the case of the retrieval of E r p ( z ) E r p ( 35 ) , the lack of information about the final profile of T p z does not allow for inverting the iteration procedure until the first T p z profile was calculated from the β p z at 550 nm from the Atmospheric Attenuation Model [36]. There was still the option to use the set of β p D i g i t z , which is, in fact, the final β p z used to calculate the final T p z . However, as will be shown in Section 5.2 below, using the only piece of information available re-digitized sections of T p z and T R + p z , a MODTRAN-validated algorithm for slant transmission calculations does not reproduce it. Then, it was not possible to retrieve the observed E r p ( z ) E r p ( 35 ) but a sort of proxy of it, named retrieved E r p ( z ) E r p ( 35 ) . In Section 5, the comparison of the retrieved E r p ( z ) E r p ( 35 ) and the observed E r p ( z ) E r p ( 35 ) profiles for 13 April 1964 at 00:18 MST are discussed, showing reasonably good results and supporting the conduct of the retrievals.
For the re-calibration, the option of using the iteration-convergent procedure was evaluated. However, it was decided to avoid it whenever it would be possible, due to the fact that, in the cases of negative values in the initial β p z profiles, the new adjustments caused by the reduction of E r p ( z ) in 0.001 in the original adjusted retrieved E r p ( z ) E r p ( 35 ) poses a high risk of causing spurious values of it then being transferred to the β p z profiles.

4.2. Improvements

The improvements associated with using an updated set of variables (hereinafter identified as “updated parameters” to avoid any confusion with the original variables) will be discussed in Section 7.3, and the implementation of a slant transmission algorithm validated with the MODTRAN-4 code operating in transmission mode will be discussed in Section 5.2.

4.3. Design of the Re-Calibration

Considering the limitations described above, the re-calibration procedure was designed. It begins with obtaining the retrieved E r p ( z ) E r p ( 35 ) profiles by inverting Equation (1) and using the same originally used values/profiles variables described by Elterman [32,33], except for the original slant transmissions for the reasons explained in Section 5.2 below.
Then, Equation (1) was used to calculate the first set of β p z profiles ( β p o z ) using all the updated variables except T p z , which was assumed equal to one at all altitude levels. The ozone slant transmission, not used in the original processing [32,33], is included in this step. In the next step, T p o z was calculated using β p o z . Finally, using again Equation (1), β p o z is corrected by the slant transmission T p o z to produce β p R e c a l z , and the process stops. The iteration-convergent procedure for adjusting β p R e c a l z with a new T p z was not conducted to avoid the risk of spurious β p R e c a l z , due to the fact that an unknown amount of the retrieved E r p ( z ) E r p ( 35 ) profiles are not the original ones, because they were adjusted by the iterative convergent procedure. This issue will be discussed further in Section 7.2.
It is important to note that the designed methodology deals with three series of E r p ( z ) E r p ( 35 ) profiles. The first two are related to processing conducted by Elterman [32,33]. The observed E r p ( z ) E r p ( 35 ) and the final E r p ( z ) E r p ( 35 ) correspond, respectively, to the one from the instrumental observations, and the second the one results in the last iteration of the iteration-convergent procedure. Only in the cases that no negative value in the β p z profile was present in the first iteration, the observed and final E r p ( z ) E r p ( 35 ) are the same. The third associated to this study is the retrieved E r p ( z ) E r p ( 35 ) resulting from the inversion of Equation (1).

5. Retrieving the Normalized Detector Response

5.1. Retrieval Procedure of the Normalized Detector Response

The re-calibration processes involve retrieving the normalized detector response using parameters and variables that were not available in the early 1960s or have been improved afterward. In that sense, the first step was inverting Equation (1) to retrieve E r p ( z ) E r p ( 35 )   , leading to the expression:
E r p ( z ) E r p ( 35 ) =       β p z + β R z     P R ( φ s ( z ) ) P p ( φ s ( z ) )     T R z T p z P p ( φ s ( z ) ) C 1
where C1 is a constant combining the values of several of the former variables at the normalization altitude of 35 km C 1 = β R 35   T R ( 35 ) T p ( 35 ) P R ( 132 ° ) .
The retrieval of E r p ( z ) E r p ( 35 ) uses the original variables and parameters reported to be used for the determination of β p z , all of them with the superscript “Orig” to identify them. Following it, it is described how they were obtained, and the reasons to be used to replace the corresponding original variable were discussed.

5.2. Slant Transmission Algorithm

Figure S1 in the Supplement is the only piece of information about the final T p z . This is Figure 9 in Elterman [32,33] showing the aerosol and Rayleigh + aerosol slant path transmissions in the “20 km aerosol layer”, cited above regarding the tabulated output section in Table S2. Differently than the plots of the β p z profiles and the printed outputs from a computer [32,33], this Figure is more like an artwork.
The curves of T p z O r i g and T p z O r i g × T R z O r i g were re-digitized from Figure S1 in the Supplement. T R z O r i g was calculated by dividing T p z O r i g × T R z O r i g by T p z O r i g . It is important to note that the cited Figure S1 is different from the 105 plots of β p z , where the magnitude of β p z at each level was represented by a marker. Elterman [32] reports “the resulting aerosol attenuation coefficients were plotted automatically from the punch card computer output…”. The two curves in Figure S1 are more an artwork compared to the β p z plots, introducing an uncertain level of errors when they were re-digitized. However, it was the only source of information on slant transmission to contrast our calculations.
The attempts to reproduce T p z O r i g and T R z O r i g from Figure S1 by using Equation (15) in Elterman [32,33] were unsuccessful. It could be associated with the fact that Figure S1 is not exactly a plot, like the ones for β p z in Elterman [32]. Then, an algorithm was designed considering the geometry of the searchlight setup in Figure 1. It was tested with the commercially available MODTRAN-4 atmospheric radiation transfer code run in the transmission mode [39] to be confident of the results of the re-calibration.
The algorithm used to calculate T r * ( z ) , T p * ( z ) , and T O 3 * ( z ) was validated with the commercially available MODTRAN-4 atmospheric radiation transfer code run in the transmittance mode [39]. In the cases of T r * ( z ) and T O 3 * ( z ), the validation was conducted using the molecular and ozone profiles from the 1976 US Standard Atmosphere [40], both for the algorithm and for MODTRAN-4. In the case of T p * ( z ) , the combined profiles for desert aerosol extinction in the troposphere and moderate volcanic stratospheric aerosols in the stratosphere aerosols, in the embedded in the MODTRAN-4 code, was used. The purpose of this combined profile was to resemble the conditions at White Sands, both in the designed algorithm and in MODTRAN-4.
Figure S2 shows the transmissions calculated by the self-designed algorithm and the MODTRAN-4 code. It shows a high level of agreement at all levels for both T r * ( z ) and T O 3 * ( z ) and almost at all except for around 5 km for T p * ( z ) .The mean values of the absolute percent differences between the transmission calculated using the slant path algorithm and calculated using the MODTRAN-4 code showed that transmission errors are 0.17% for T r * ( z ) , 0.04% for T O 3 * ( z ), and 1.17% for T p * ( z ) in the 5 to 35 km layer. The error for T p * ( z ) from 12 to 35 km decreases to 0.8%.
The slant transmission profiles used for the validation of the algorithm with MODTRAN-4 were identified with a plus sign, T R + ( z ) , T p + ( z ) , and T O 3 + ( z ). The tests were conducted using the Rayleigh and ozone profiles from the 1976 US Standard Atmosphere [40] both for the algorithm and for MODTRAN-4 for T R + ( z ) and T O 3 + ( z ) . The aerosol extinction profile for desert aerosols embedded in the MODTRAN-4 code was used, also for testing the algorithm, in the case of T p + ( z ) . The validation of the algorithm results showed that the mean values of the absolute percent differences between the slant transmission calculated using the slant path algorithm and calculated using the MODTRAN-4 code showed that slant transmission errors are on the order of 1% for T p + ( z ) and lower than that for both T R + ( z ) and T O 3 + ( z ). Details are provided in section A1 and Figure S2 in the Supplement.
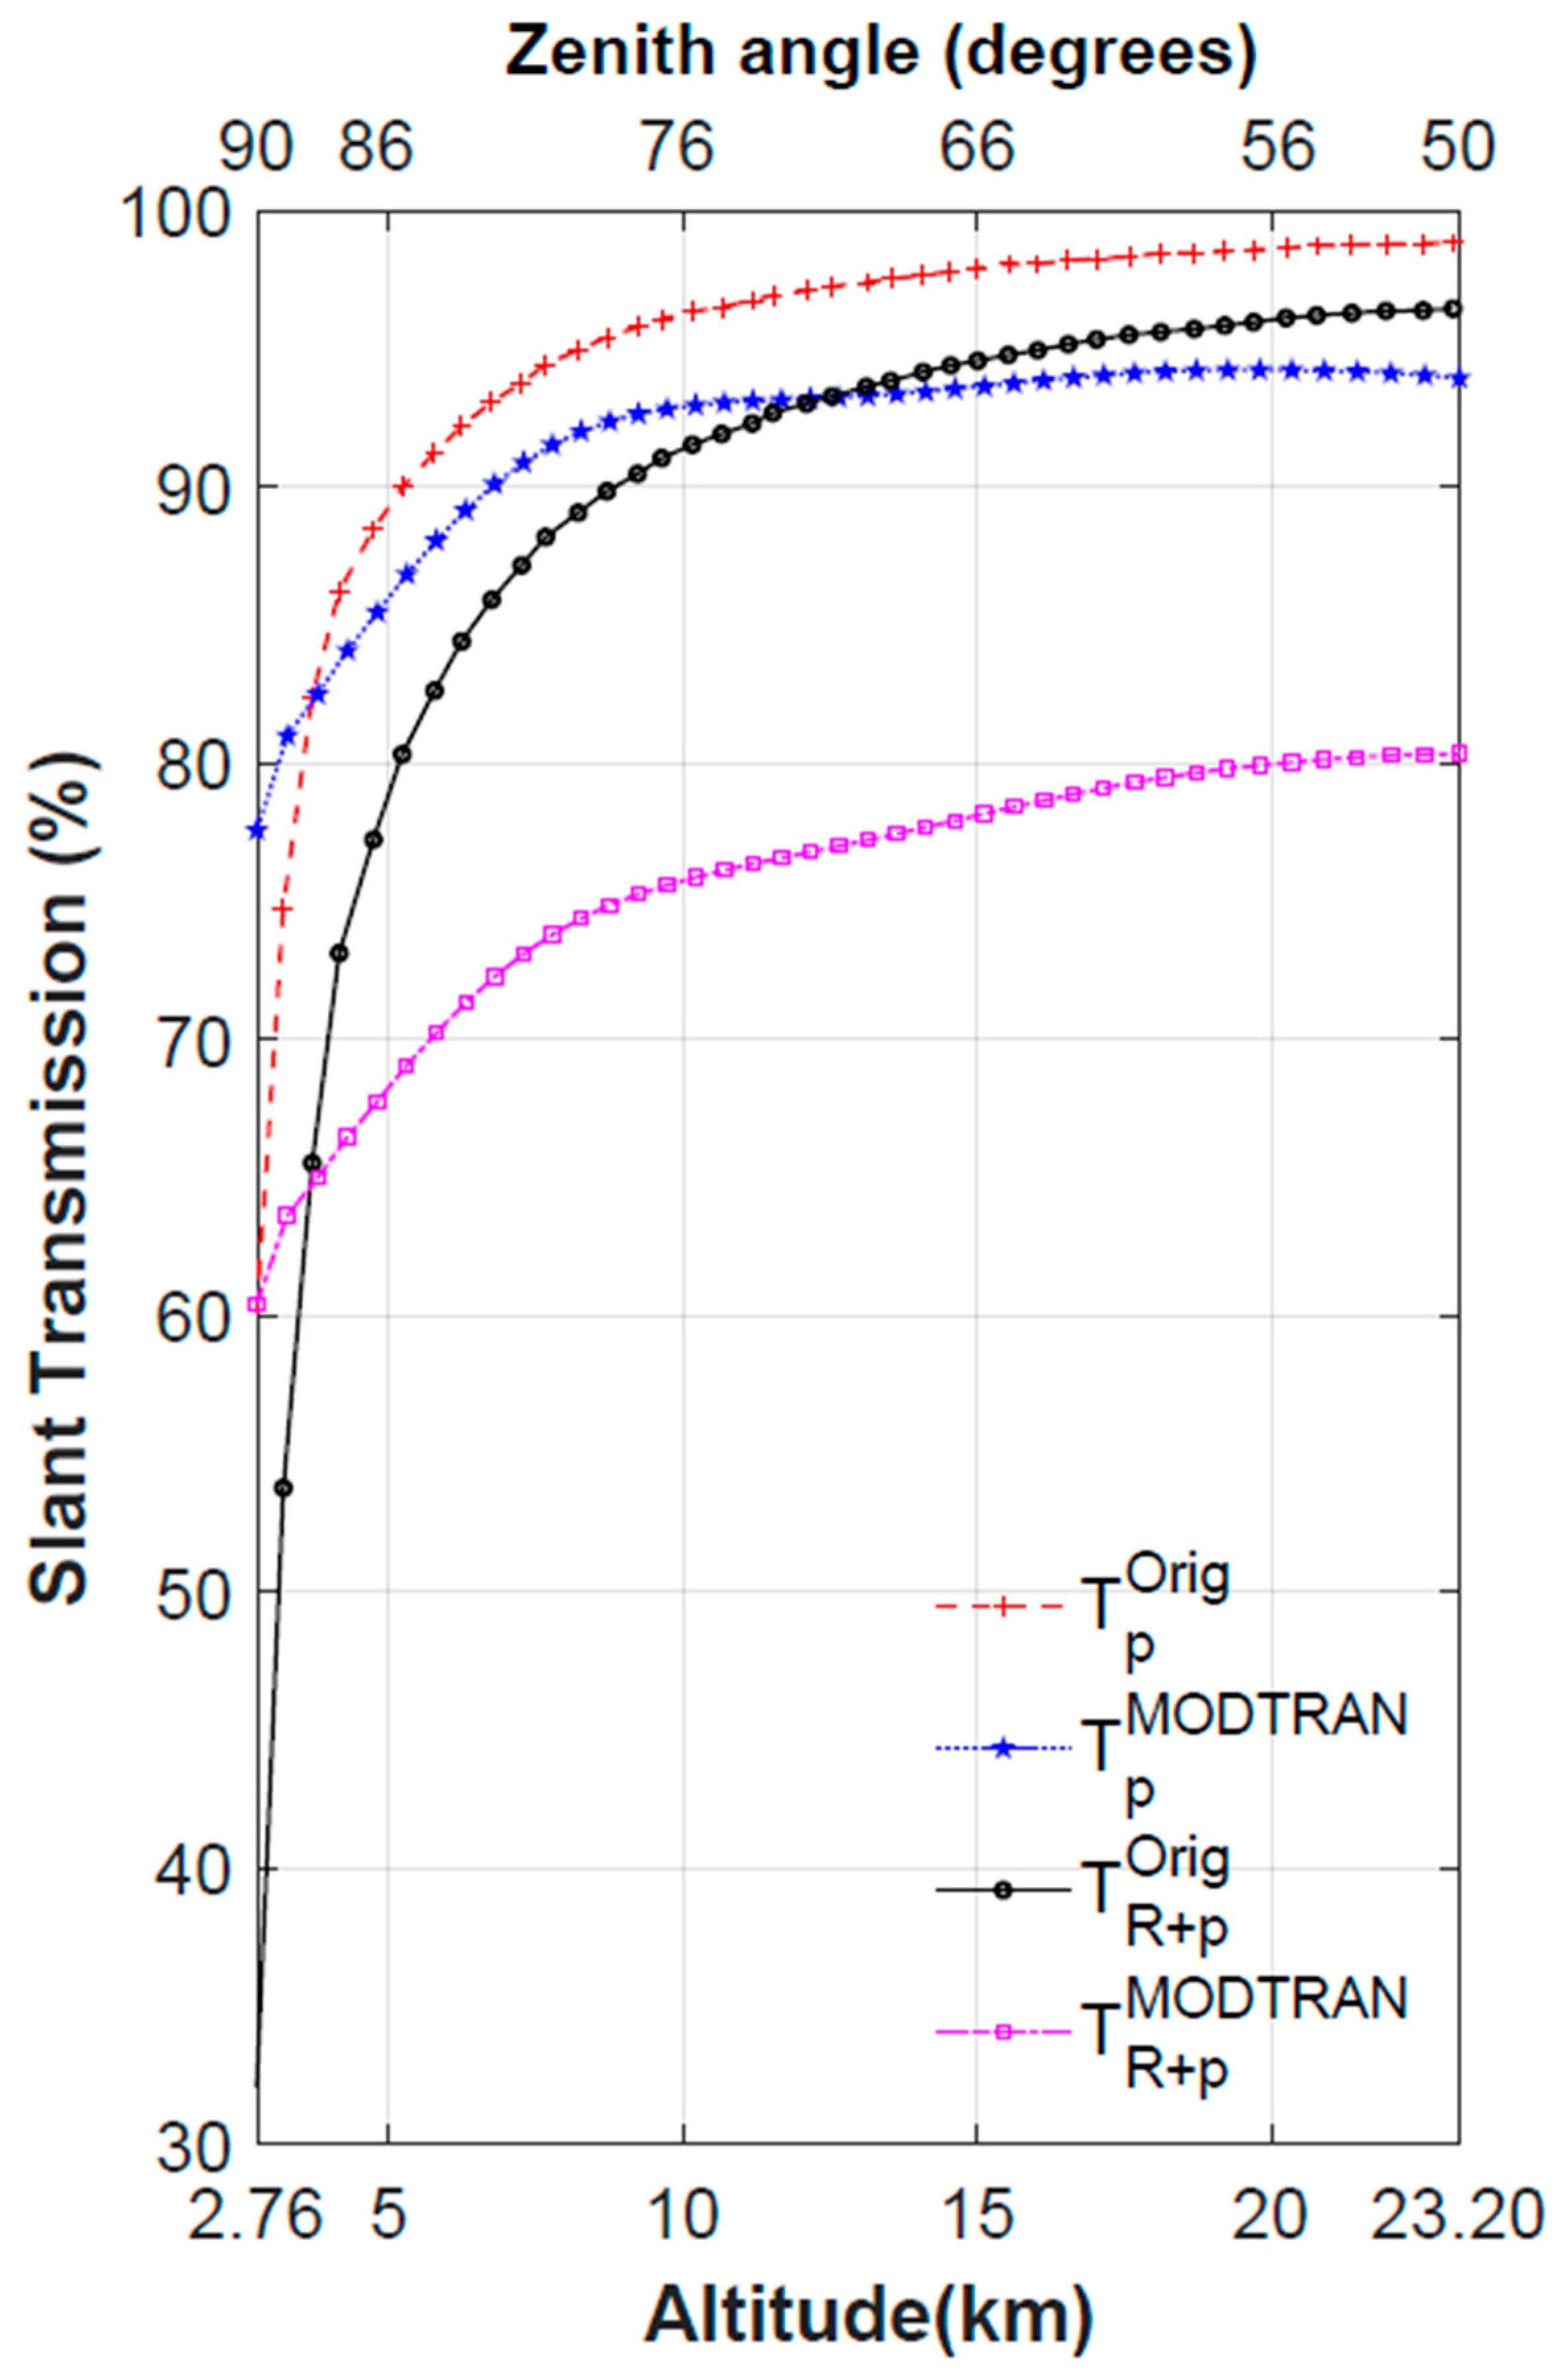
Following this, it was attempted again to reproduce T p z O r i g and T R z O r i g from Figure S1 but, in this case, using the algorithm validated with MODTRAN-4. It was unsuccessful, as can be appreciated in Figure 3. The relative differences between T p z O r i g and T p + ( z ) are 4%, while between T R + p z O r i g and T R + p + ( z ) , it is 16%, consistent with a relative difference of 4% for T R z O r i g and T R + ( z ) . The consistent 4% higher magnitudes in T p z O r i g and T R z O r i g introduced a 16% underestimation in the β p z magnitudes reported in Elterman [32] because the β p z and T p z × T p z in Equation (1) are inversely proportional.

5.3. Variables Used for the Retrieval

The re-digitized profiles of T R z O r i g and T p z O r i g from Figure 9 in Elterman [32,33], cited in the former section, were discarded and replaced by new T p z O r i g and T R ( z ) O r i g . These two transmissions were derived using the same vertical profiles that were reportedly used by Elterman [32] to calculate his T p z O r i g and T R ( z ) O r i g , β p z O r i g and β R ( z ) O r i g at 550 nm from Table 5.9 in the Atmospheric Attenuation Model [35], but using the algorithm validated with the MODTRAN-4 (Section 5.2).
According to Elterman [32,33], the P p φ s z O r i g used to calculate β p z was derived from surface aerosol observations conducted by the Observatory and Meteorological Institute of the University of Jena, Germany [41], but the procedure is not explained with enough details to be reproduced. However, both normalized P p φ s z O r i g and P R φ s z O r i g are shown in Figure 5 of Elterman [32,33], from which P p φ s z O r i g was re-digitized and later interpolated to the 58 altitudes the observations were conducted.
In the case of P R φ s z O r i g , it was not digitized because it was defined by the equation [32,33]:
P R φ s z O r i g = 0.75   1 + c o s 2 φ s z
P R φ s z O r i g was calculated from Equation (3) at the 58 altitudes the observations were conducted.
No precise information was found about the normalization procedure applied to P p φ s z O r i g and P R φ s z O r i g . However, several clues were followed beginning with the common Figure 5 in [32,33], where P p φ s z O r i g intercepts with P R φ s z O r i g at the normalized value one at a scattering angle between 40° and 60°, much more towards 60°, according to the scattering-angle axis labels. Another clue was found in a report studying atmospheric background aerosols with observations from a balloon-borne nephelometer, which addresses the inferences from angular scattering behavior and makes explicit reference to the normalization of the aerosol phase function reported in [33] at the scattering angle of 50° [42]. Then, the normalization angle was determined by solving expression (3) for φ s z with P R φ s z O r i g = 1 , resulting in 55°, matching the cited Figure 5 from Elterman [32,33] and very near the value cited by Gibson [42]. Then, 55° was the normalization angle for the updated tropospheric and stratospheric aerosol phase functions used for the re-calibration procedures that are described in Section 6.2.1 and Section 6.2.2 below.

5.4. Retrieved Normalized Detector Response

While deriving the normalized detector response, Equation (2) was used, and the profiles of the variables were identified with the superscript “Orig”, as described above, and β p z D i g i t . One-hundred five E r p ( z ) E r p ( 35 ) were retrieved corresponding to the same amount of β p z D i g i t profiles. Errors of the retrieved E r p ( z ) E r p ( 35 ) were estimated by comparing the retrieved E r p ( z ) E r p ( 35 ) for 13 April 1964 at 00:18 MST with that tabulated on the same day in Table S2 in the Supplement. Table S2 is Table 2 in Elterman [32,33], providing the only existing information about sections of the final E r p ( z ) E r p ( 35 ) profile for that observation.
Figure 4 shows the retrieved E r p ( z ) E r p ( 35 ) profile for the same day as the one in Table S2 between 2.76 and 35.28 km (red asterisks) and the tabulated E r p ( z ) E r p ( 35 ) profile between 12.65 and 23.19 km (blue stars). Also, the tabulated values for the lower levels (2.76 and 3.27 km) and the top of the profile 35.28 km are shown. Except at the two lower levels, the tabulated E r p ( z ) E r p ( 35 ) section profile shows a good agreement with the corresponding retrieved E r p ( z ) E r p ( 35 ) section. It should be noted that the monotonous decrease in the retrieved E r p ( z ) E r p ( 35 ) is interrupted by an inflection point at 4.3 km (level 4), with the following three points downward decreasing in magnitude and not matching the first two levels tabulated in Table S2. This inflection point occurs in all of the 105 individual E r p ( z ) E r p ( 35 ) profiles and is also present in the 36 daily averaged E r p ( z ) E r p ( 35 ) profiles, with the last ones shown in Figure S3 in the Supplement. In this region, below 5 km, it was reported that the convergence of the iteration procedure generally fails because of the presence of heavy dust or thin clouds [32,33]. Because of this fact, the re-calibrated values below 5 km are recommended to not be used. Then, the rescued and re-calibrated profiles above 5 km are used in the next sections. The average of the absolute differences and the percent magnitude for the 24 coincident points between both vertical sections is 0.1 and 0.6%, respectively.

6. Parameters Used to Re-Calibrate β p z

The updated parameters were selected among the current atmospheric information available about the original variables that was not available or used for the calculation of β p [32,33]. The parameters selected represent better the conditions of the atmospheric column in the region where the searchlight observations were conducted than the original similar variables. The error estimates of the β p ( z ) calculations already reported by Wells [43] were also considered. It consisted of a Monte Carlo procedure to evaluate the errors caused by neglecting the multiple scattering from the searchlight beam, the ozone absorption, and the error caused using P p φ s z O r i g for the Reeger–Siedentopf phase function [41]. That study concluded that the main source of error was P p φ s z O r i g , with errors of between 15% and less than 25%. In the following, each of the updated parameters used for the re-calibration is described in detail, and the reasons for the replacement of the original variables are explained.

6.1. Daily Rayleigh Extinction Profiles from Radiosondes

Elterman [32,33] discussed the benefit of using in the searchlight β p z calculations the smooth molecular density profiles from the 1962 US Standard Atmosphere to calculate the Rayleigh extinction instead of the less-smooth density profiles derived from radiosonde observations. He cited the potential erratic, and in some cases negative, values of β p z and T R z when radiosonde observations were used. However, he recognized that the use of radiosonde observations instead of the Standard Atmosphere is justified in cases when the radiosondes have a good accuracy [25].
That was the reason to use the set of soundings conducted at 12 UTC (05 MST) the same 36 nights the searchlight observations took place, the Santa Teresa site, code USM00072364 at 32.8728° N, 106.6981° W and 1254.0 m asl in the north of Texas, at 132 km from Sacramento Peak. Those 36 soundings have a lower percentage of data gaps among the Sacramento Peak-surrounding sounding stations found in the Integrated Global Radiosonde Archive, Version 2 database, (IGRA-2). IGRA-2 is a global quality-controlled set of soundings from 1905 to the present [44]. It is the result of a long-term effort to produce methods and algorithms to conduct robust automated quality control of radiosonde-observed variables and make available those variables that comply with the established standards [45].
The pressure and temperature profiles of each of the soundings were interpolated at 1 km vertical resolution from 1 to 30 km, linearly for the temperature and logarithmically for the pressure. Monthly mean profiles for December 1963 and for each month of 1964 were calculated. Those mean values were used to fill the few gaps on some of the daily profiles, all located between 22 and 30 km, mainly at the higher altitudes. Then, the pressure and temperature in each sounding, from 32 to 36 km, were filled using monthly mean values from the COSPAR International Reference Atmosphere—COSPAR-86 [46]. The results of the temperature profiles gap-filling between 32 to 36 km with the CIRA-86 models’ atmosphere do not show discontinuity, as is shown in Figure S4 in section A2 in the Supplement, where the reasons for using CIRA-86 are discussed. Then, β R * ( z ) were calculated using the algorithm for Rayleigh scattering applied for CALIOP [47] at 550 nm.
Additionally, the β R * ( z ) ¯ derived from the 36 soundings ( β R S o n d e ( z ) ) was tested against the β R * ( z ) ¯ derived from the ERA5 reanalysis temperature and pressure profiles ( β R E R A 5 ( z ) ) for the 36 nights the searchlight observations were conducted. ERA5 is the third generation of re-analyses, which combines the state-of-the-art ECMWF operational medium-range forecasting system with a hybrid incremental four dimensions’ data assimilation [48]. The maximum differences between β R S o n d e z and β R E R A 5 ( z ) are on the order of 10−5 km−1. Figure S5, in the Supplement, show the plots of the differences ( δ ) and percent differences ( ) between β R S o n d e ( z ) and β R E R A 5 ( z ) minus β R z O r i g . The left panel of Figure S5 shows that the maximum and minimum values of δ β R S o n d e z and δ β R E R A 5 z are on the order of 10−4 km−1, an order of magnitude higher than the maximum differences between β R S o n d e z and β R E R A 5 ( z ) . In addition, δ β R S o n d e z and δ β R E R A 5 z show a similar pattern, mainly with negative values in the troposphere and positive in the stratosphere, but with the δ β R E R A 5 z showing slightly higher differences in both layers and positive values between 26 and 32 km. In Figure S5, the right panel shows the differences between β R S o n d e z , with a smooth profile up to around 30 km and β R E R A 5 z , with a smooth profile up to around 16 km, but above the profile exhibits notable variability. The mean values of β R S o n d e z and β R E R A 5 z between 5 km and the tropopause are −0.6% and −1.4%, respectively, while between the tropopause and 20 km, they are 4% and 6%. Both β R S o n d e z and β R E R A 5 ( z ) provide updated information with respect to β R z O r i g . However, the smooth character of β R S o n d e z , considering its potential impact on the calculation of β p z described at the beginning of the section, supported the decision to use β R S o n d e z for the re-calibration.

6.2. Tropospheric and Stratospheric Aerosol Phase Functions

It has already been cited above that P p φ s z O r i g has been considered the major source of error in determining β p z . P p φ s z O r i g was derived from observations conducted in Jena, Germany before 1945 [41], located around 50° N and in a region with different geographical conditions than White Sands, NM. In addition, the observations used to derive P p φ s z O r i g were conducted at the time when there was no relevant amount of volcanic aerosol present in the stratosphere. However, it was extrapolated to represent stratospheric aerosols during a period characterized by the presence of stratospheric aerosols from the 1963 Agung volcanic eruption. The cited study conducted a Monte Carlo simulation of several individual observations of the scattered light from a searchlight beam, reporting in one of the simulations around a 15% increase in the scattered intensities at the detector, with E r p ( z ) for a P p φ s z 30% higher than P p φ s z O r i g . Another simulation showed decreases between 15% and 20% for E r p ( z ) in the case of a P p φ s z lower than P p φ s z O r i g by factors between 1.59 and 3.1 [43]. Those results agree with the proportionality relation between P p φ s z and E r p z , as shown in Equation (2).
The original aerosol phase function was replaced with two phase functions, corresponding to the tropospheric and stratospheric aerosols, respectively. The first was applied from the surface to the tropopause altitude and was derived from AERONET observations between 2006 to 2021. The second was applied above the lower tropopause altitude to the top of the searchlight profile, calculated using particle-size observations conducted in the Northern Hemisphere’s stratosphere in 1963, right after the Agung eruption. The original Rayleigh phase function P R φ s z O r i g remained unchanged in the re-calibration procedure. They are described in the following two sections.

6.2.1. Tropospheric Aerosol Phase Function

The P p φ s z O r i g in the troposphere (2.76 to 10.7 km) was replaced by the tropospheric aerosol phase function ( t P p φ s z ) ; monthly means values were calculated using almucantar sun photometer observations from the White Sands High Energy Laser Systems Test Facility (HELSTF) AERONET site (32°38′ N, 106°20′ W, 1207 m asl) [49]. The site is located in the Tularosa Basin, New Mexico, at the White Sands Missile Range. It should be considered that the Tularosa Basin was identified above as the region where the searchlight projector was installed at least between 1963 and 1965. AERONET calculates the t P p φ s z values for 83 scattering angles at wavelengths corresponding to sky radiance observations [50]. The AERONET monthly means of t P p φ s z from 2006 to 2021 at the two near wavelengths 440 and 675 nm, above and below 550 nm, were used. Those monthly means, 119 for 440 nm and 156 for 675 nm, were averaged at each wavelength; its results are shown in the Figure S6 left panel (in the Supplement) from 0° to 180°. Later, they were interpolated between 75° and 132° at 1° resolution, corresponding to the 58 altitudes where the observations were conducted. Then the two resulting t P p φ s z at the 440 and 675 nm wavelengths were used to calculate the t P p φ s z at 550 nm by linear interpolation. Figure S6’s right panel is a zoom of the left panel to better show the scatter angle’s region corresponding to the observation’s geometry, but it includes the interpolated t P p φ s z at 550 nm together with t P p φ s z at 440 and 675 nm. Finally, t P p φ s z at 550 nm was normalized at the angle of 55° (see Section 5.3 for details). The normalized t P p φ s z at 550 nm is plotted in Figure S7 (in the Supplement) together with the other normalized phase functions: s P p φ s z , P p φ s z O r i g , and P R φ s z O r i g . The mean value of the percent differences between t P p φ s z and P p φ s z O r i g in the troposphere, between 5 km and the tropopause altitude (corresponding to the scattering angles between 79° and 93°), shows a 26% increase in magnitude with respect to   P p φ s z O r i g , supporting its use in the re-calibration and replacing P p φ s z O r i g in the troposphere. The average particle-size distribution (PSD), derived from the monthly means for the same period 2006 to 2021, from the HELSTF AERONET site is shown in Figure S8 in the Supplement. Table S3, also in the Supplement, shows the averages of the effective radius (ER) and the volume median radius (VMR) for the total, coarse, and fine modes, derived from the monthly means of the ER and VMR for the period 2006 to 2021.

6.2.2. Stratospheric Aerosol Phase Function

No phase function for the stratospheric aerosols from the 1963 Agung volcanic eruption for the Northern Hemisphere was found in the literature. However, it was found that there were four PSDs derived from NASA ER-2 aircraft samples taken at 18.3 km from April to August 1963 in the Northern Hemisphere as part of the Project Stardust High Altitude Sampling Program sponsored by the Defense Atomic Support Agency of the U.S. [51]. There are four observations of the sampling of the stratospheric aerosol cloud in the Northern Hemisphere from the Mt Agung 1963 eruption. Although the PSD observations were only conducted at 18.3 km, they are a better assumption to represent the stratospheric aerosol PSDs from 10 to 30 km than the phase function from Reeger and Siedentopf [41] used by Elterman [32,33]. The dates, latitude, longitude, and sampling altitude of the four PSDs are in the Table S4 in Section A3 (in the Supplement). Figure S9, also in the former section, shows the average of the four PSDs, characterized by the effective and mean radius being 0.386 μm and 0.340 μm, respectively. Using the average of the four PSDs, the stratospheric aerosol phase function ( s P p φ s z ) was then derived using an improved version of the Mie code [52]. Then, the s P p φ s z was interpolated between 75° and 132° at 1° resolutions, corresponding to the 58 altitudes the searchlight observations were conducted. Finally, the s P p φ s z was normalized at the angle of 55° (see Section 5.3 for details). The normalized s P p φ s z at 550 nm is also among the normalized phase functions plotted in Figure S7 (in the Supplement) already cited in the section above. Similarly to how it was conducted above for the t P p φ s z , it was determined the mean value of the percent differences between s P p φ s z and P p φ s z O r i g , but in the stratosphere between the tropopause altitude and 35 km (corresponding to the scattering angles between 94° and 132°), resulting in a 28% increase in magnitude with respect to P p φ s z O r i g , also supporting its use in the re-calibration replacing P p φ s z O r i g in the stratosphere.

6.3. Rayleigh, Aerosol, and Ozone Slant Transmissions

The MODTRAN validated algorithm (Section 5.2) was used in the re-calibration procedure to calculate the Rayleigh, aerosol, and ozone slant transmissions, T R * z , T p * ( z ) , and T O 3 * ( z ) , respectively. Herein the asterisks in the slant transmissions will represent a re-calibrated slant transmission and the rest of the updated parameters. The T R * ( z ) used for the first-step re-calibration were calculated using the β R * ( z ) derived from the 12 UTC (05 MST) soundings for all 36 searchlight-observation nights between 1 December 1963 and 31 December 1964, cited in Section 5.1. Then, each of the 36 T R * ( z ) profiles were assigned for the re-calibration of the observations conducted on the same nights. In the case of the T p * ( z ) profiles, in the first step to calculate β p 0 ( z ) , they were assumed to be equal to one, and for the second step, they were calculated from the β p 0 ( z ) resulting from the first step.
In the first step, the assumption T O 3 * ( z ) = 1 remained [32,33], and in the second, T O 3 * ( z ) was introduced. It was calculated with the ozone mean seasonal density profiles (μg m−3) from the observations between 1963 and 1965 at the University of New Mexico, Albuquerque, (35° N, 106.6° W) ozone sonde site [53]. The seasonal profiles of the ozone absorption coefficient at 532 nm were calculated using the profile of ozone cross sections provided by [54] in the temperature range of 193 to 293 °K, explained in detail in the Supplement of [9]. A set of 4 T O 3 * ( z ) profiles, one per season, was produced.

6.4. Tropopause Altitudes

The re-calibration using different aerosol phase functions for the troposphere and stratosphere requires the selection of the tropopause altitude that better represents the limit between the troposphere and the stratosphere. That will also be necessary to define the integration limits to calculate the respective tropospheric and stratospheric aerosol optical depths. The site of the searchlight instrument was located in the latitudinal belt from 30° N to 40° N, where the maximum of multiple tropopause events occurs [55], resulting from the latitudinal migration of the tropical tropopause over the extratropical one [56]. That feature was already part of the empirical scientific knowledge, as revealed in several of the articles and reports related to the searchlight observations conducted at White Sands. Based on the nearby sounding observations, in all the articles and reports related to the searchlight observations, the altitude of the extratropical tropopause, defining the lower limit of the stratosphere in this region, was located at 12 km [10,32,33]. Using local soundings and the ERA5 reanalysis [48], the monthly mean altitude of the extratropical tropical tropopause in the region was verified to be around 12 km. Then, the assumption of the tropopause 12 km altitude, made for the original calculations of β p z , was maintained. It will represent in the re-calibration the limit between the troposphere and stratosphere that is to be applied, respectively, t P p φ s z and s P p φ s z .

7. Re-Calibration, Adjustments, Errors Not Accounted for in the Original β p Dataset, and Estimated β p R e c a l Errors

The re-calibration, briefly described in Section 4, consisted of using Equation (1) together with the retrieved E r p ( z ) E r p ( 35 ) and the updated parameters β R * ( z ) ¯ , T O 3 * ( z ) , t P p φ s z , s P p φ s z , T R * ( z ) , and T p * ( z ) , to calculate β p R e c a l z . The procedure consists of two steps. The first uses all the updated parameters, except T p * ( z ) , which is in this case assumed T p * z = 1 at all levels for all observation nights, producing a first set of 105 β p z profiles ( β p o z ) . The second’s only purpose was to apply the aerosol’s slant transmittance correction to the 105 β p o z profiles derived in the first step. To that end, a new set of 105 T p * z profiles is calculated using the set of 105 β p o z profiles and the MODTRAN-validated transmission algorithm, which will replace the initial assumption of T p * z = 1 . That is, the second step consists of repeating the first step with the same updated parameters as before, except for the new set of 105 T p * z profiles, producing the final set of 105 β p R e c a l z profiles, one per each observation night.

7.1. Preliminary Re-Calibrated Results

The results of the re-calibration first step showed approximately 20% negative values and around 5% extremely high values of the β p 0 ( z ) profiles, which were randomly distributed in time and altitude. Several tests showed that among the most probable reasons behind this was the hourly variability of individual retrieved E r p ( z ) E r p ( 35 ) profiles on the same day. These were associated with the daily variability of β R * ( z ) and T R * ( z ) , and also, the adjusted E r p ( z ) E r p ( 35 ) was used instead of the observed E r p ( z ) E r p ( 35 ) . In addition, abrupt changes in the β p R e c a l z profiles were present just below the tropopause, which were associated with the discontinuity produced by the different aerosol phase functions in the troposphere and the stratosphere.
The ideal solution in this case is to retrieve the observed E r p ( z ) E r p ( 35 ) from the final adjusted E r p ( z ) E r p ( 35 ) , including the inversion of the iteration-convergent procedure, which is possible if all the information necessary would be available. That information includes the original variables already used in retrieving the adjusted E r p ( z ) E r p ( 35 ) and, in addition, the final slant transmission profiles corresponding to the final β p z . However, it has been discussed in Section 4.1, regarding the lack of information about the final T p z , and in the Section 5.2, regarding the impossibility of reproducing the final T p z from the final β p z . Then, a search for another solution was conducted.

7.2. Subsequent Adjustments of the Updated Parameters

Next, several adjustments were introduced in the original design of the retrieval and re-calibration, aimed at dealing with the effect of the diurnal variability of the 105 β p z D i g i t profiles and the inter-diurnal variability in the set of 36 daily β R * z profiles. For the retrieval of E r p ( z ) E r p ( 35 ) , the adjustment consisted of averaging daily the individual 105 β p z D i g i t profiles, according to Table S1 (Supplement), producing a set of 36 daily original aerosol extinction profiles (hereinafter β p z D i g i t ¯ ). Then, the retrieval was conducted, using in Equation (2) the 36 calculated β p z D i g i t ¯ together with the same variables β R z O r i g ,     T R z O r i g ,   T p z O r i g ,     P R φ s z O r i g , and P p φ s z O r i g used before. A set of 36 daily normalized detector responses (hereinafter E r p ( z ) E r p ( 35 ) R e t ¯ ) was retrieved.
For the re-calibration, three adjustments were introduced, all of them in both the first and second steps. The first two were adjustments to deal with the variability between the 36 daily β R * z and T R * z profiles. The first consisted of using a single profile β R * ( z ) ¯ , resulting from an average of the 36 daily β R * z , and the second adjustment is calculated using a single profile for T R * ( z ) ¯ using the single profile β R * ( z ) ¯ with the MODTRAN-4-validated slant transmission algorithm. The third adjustment was implemented to deal with the discontinuity in the β p R e c a l z profiles below the tropopause altitude. It consisted of smoothing the transition between t P p φ s z and s P p φ s z just below the tropopause. It replaced the β p R e c a l ( z ) at 11.7 km by the average of the β p R e c a l ( z ) values at 11.2 and 12.2 km, which are the levels above and below 11.7 km.
The rest of the variables were unchanged. Together with the 36 daily profiles E r p ( z ) E r p ( 35 ) R e t ¯ in Equation (1), these adjustments produced a set of 36 β p o z profiles derived in the first step. Then, 36 T p * z profiles were calculated using the 36 β p o z profiles. In the second step, the 36 T p * z profiles replaced the initial assumption of T p * z = 1 , producing the final set of 36 daily β p R e c a l ( z ) profiles. No negative values were present in the set of 36 daily β p R e c a l ( z ) profiles, complying with the goal of avoiding the iterative convergent procedure applied by [32,33] whenever it would be possible. Neither abrupt changes in the daily β p R e c a l ( z ) profiles below the tropopause were present.

7.3. Errors Not Accounted for in the Original β p DatasetOK

The original error estimate considered a 6% increase in E r p z ; the original estimated errors in β p ( z ) were in the range between 33% and 40% [32,33]. Further research evaluated the error introduced by three variables. It considered the errors produced by neglecting the effect of multiple scattering of the light scattered from the searchlight beam and neglecting the ozone absorption. The third possible source of error considered was the error that could result from the fact that P p φ s z O r i g [41]. The Monte Carlo calculations showed that the effects of multiple scattering and ozone absorption were approximately equal in magnitude but opposite in effect. The conclusion was that the neglect of ozone absorption and multiple scattering did not introduce any significant error in Elterman’s calculations of the β p ( z ) profiles. The major source of error in determining the β p ( z ) profile from single-scattering theory was found to be in the use of P p φ s z O r i g that was measured at a different time and geographical location than that used for the searchlight experiment. Quantitatively, P p φ s z O r i g introduced an error ranging between ~15% and 25% in the estimates of E r p z reported Wells (1968). In addition, in Section 5.2, it was estimated that there was a 4% error in both T p z and T R z , a 16% error for the product T p z × T R z , when the reported slant transmissions from the observation on 13 April 1964 at 00:18 MST were compared with the ones from the MODTRAN-validated algorithm.
The improvements produced by the updated parameters β R * ( z ) ¯ , T O 3 * ( z ) , t P p φ s z , and s P p φ s z in the re-calibrated β p ( z ) profiles were estimated, which in fact, are estimates of the unaccounted errors produced by using β R z O r i g and P p φ s z O r i g and neglecting T O 3 * ( z ) . To that end, the first step of the re-calibration procedure described in Section 6.1 was conducted, with the adjustments described in Section 7.2 aiming to calculate β p 0 z ¯ , the average of the 36 β p 0 z profiles. Those β p 0 z profiles were calculated using the retrieved E r p z E r p 35 and β R z O r i g , P R φ s z O r i g , and P p φ s z O r i g the same variables used to retrieve E r p z E r p 35 . In addition, no slant transmission correction for ozone, equivalent to T O 3 ( z ) O r i g = 1 at all levels, is described in Section 6.
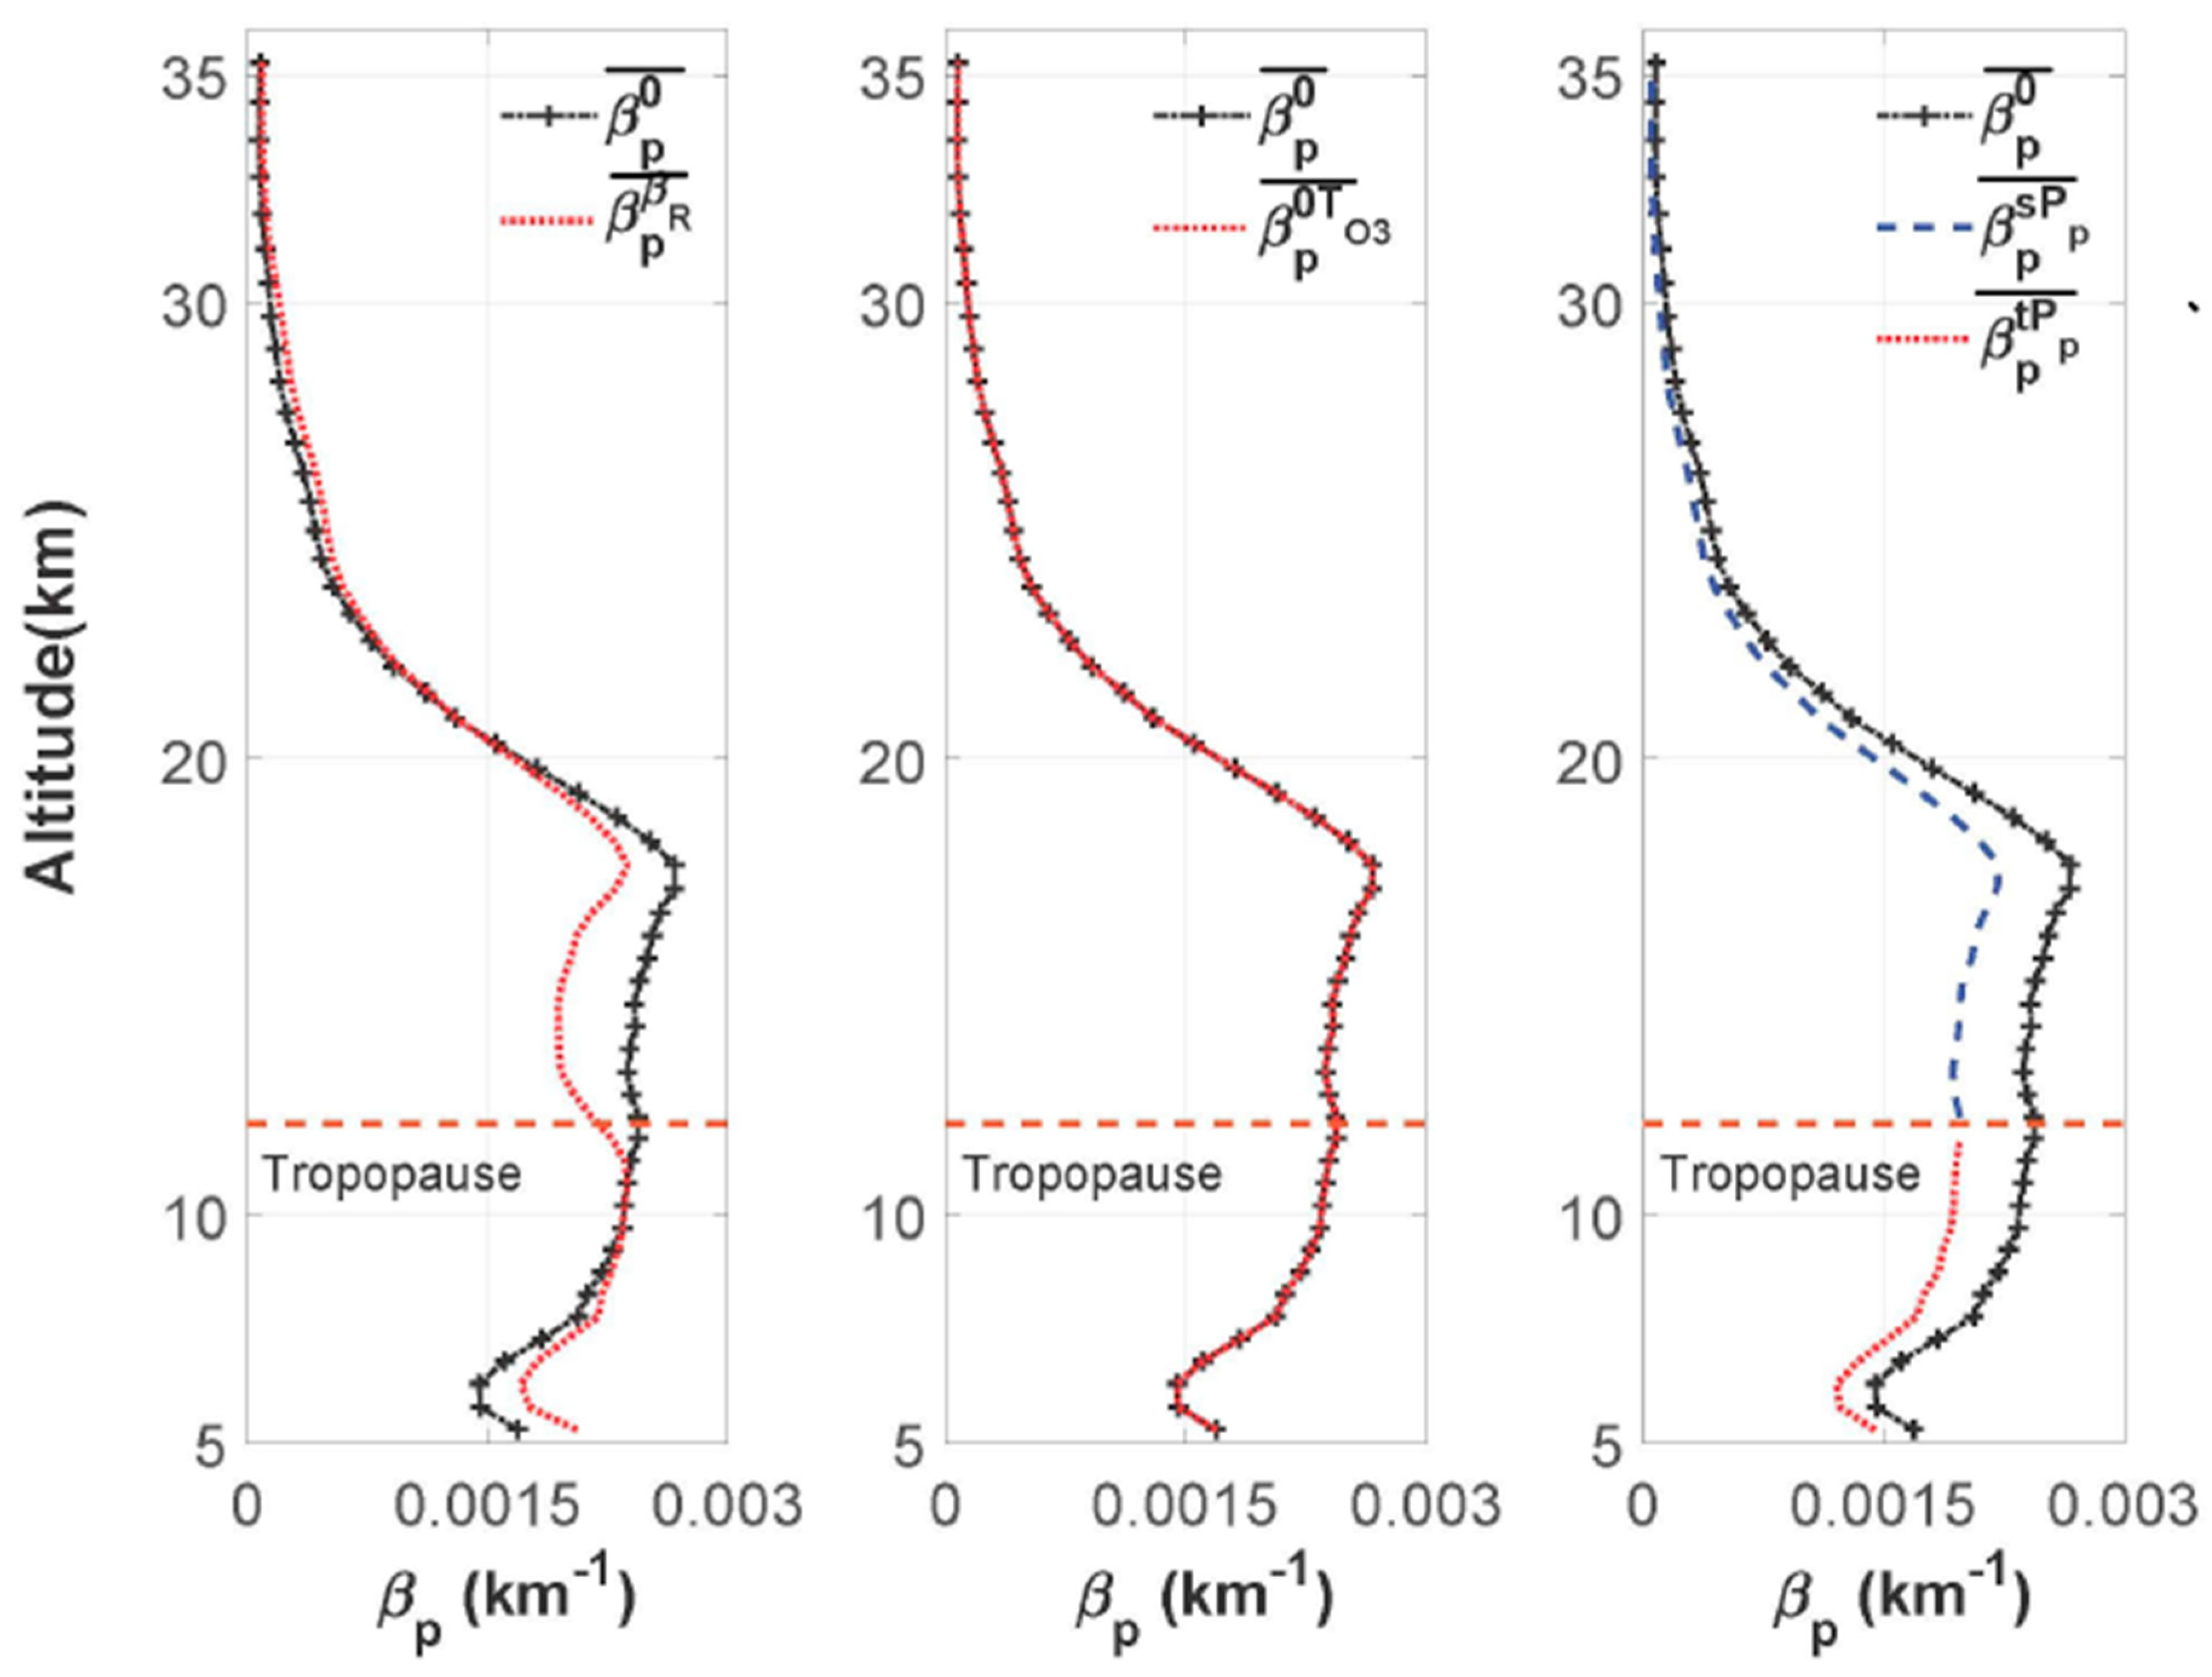
Following this, the procedure described above was repeated, but replacing each time only one of the original variables by the respective updated parameters β R * ( z ) ¯ , T O 3 * ( z ) , t P p φ s z and s P p φ s z . The results were a set of 36 daily aerosol extinction profiles for each of the parameters that were then averaged β p 0 R z ¯   ,   β p 0 O 3 z ¯ , β p 0 t P p z ¯ , and β p 0 s P p z ¯ .
Those profiles are shown in Figure 5, where the β p 0 z ¯ profile has been plotted in each panel as a reference. The left panel shows that β p 0 R z ¯ is larger than β p 0 z ¯ just below the tropopause, becoming β p 0 R z lower than β p 0 z until around 20 km; from there up to 35 km, β p 0 R z is slightly larger than β p 0 z ¯ . This pattern is associated with the pattern of the differences δ β R S o n d e ( z ) = β R S o n d e ( z ) ¯ β R z O r i g shown in Figure S5 in the Supplement, considering that in Equation (1) β R is directly proportional to β p but with a minus sign. The higher values of β p 0 R z ¯ below the tropopause are associated with the negative values of t δ β R S o n d e ( z ) in that layer in Figure S5. The lower values of β p 0 R z ¯ above the tropopause up to around 20 km are associated with the positive values of δ β R S o n d e ( z ) in Figure S5. In the center panel of Figure 5, the profiles of β p 0 z ¯ and β p 0 T O 3 z ¯ match, showing no appreciable differences. That is, the updated T O 3 * z profiles have no relevant impact on the re-calibration.
The right panel of Figure 5 shows β p 0 t P p z ¯ and β p 0 s P p z ¯ are always lower than β p 0 z ¯ ; that is, both t P p φ s z and s P p φ s z reduce the tropospheric and stratospheric magnitudes of β p R e c a l z . This fact is associated with the higher magnitudes of t P p φ s z and s P p φ s z with respect to P p φ s z O r i g , as shown on Figure S7, and the inversely proportional relation, in both terms of the right side of Equation (1), between β p z and b o t h   t P p φ s z and s P p φ s z .
The differences between β p 0 z ¯ and each of β p 0 R z ¯   ,   β p 0 O 3 z ¯ , β p 0 t P p z ¯ , and β p 0 s P p z ¯ , derived for each of the updated parameters, were calculated for the troposphere and the stratosphere. The magnitude of the differences and its relative values in %, with respect to β p D i g i t ( z ) , are shown in Table 1 for the troposphere and the stratosphere.
In Table 1  t P p produce a 12% decrease in the troposphere while s P p produce a 21% decrease in the stratosphere. The next parameter in Table 1 is the β R * ( z ) ¯ , with a 3% increase in the troposphere and a 9% decrease in the stratosphere. The bottom one, T O 3 * ( z ) , has only an impact on the order of 10−1% in the stratosphere because of the presence of the ozone layer, which is negligible compared to the rest of the updated parameters.
The results above agree with the former report from Wells (1968), where P p φ s z O r i g was considered the major source of error in determining β p z , and the error introduced by using T O 3 * ( z ) negligible. In fact, replacing P p φ s z O r i g with t P p and s P p , decreases the magnitudes of the β p z to 12% and 21% in the troposphere and the stratosphere, respectively, matching the inversely proportional relation between β p z and P p φ s z in Equation (1). In the next section, it will be corrected to the original error estimated in [32,33] and then produce an estimated error for β p z R e c a l .

7.4. Estimated β p R e c a l Errors

Considerations on the error of the β p z -calculated profiles are discussed in detail in [33]. They include instrumental errors as well as the ones associated with the adjustments to the E r p 35 value during the iterative procedure cited above. The maximum total errors were estimated to be between 33% and 48%, around 41% on average. One of the sources of error not accounted for is the iteration-convergent procedure. But, as discussed in Section 4.1, there is almost a complete lack of information that allows for reproducing it, and the only piece of information available is not verified and trusted information.
Further evaluation of the error, described in the former section, determined that P p φ s z O r i g introduced errors ranging between ~15% and 25% in the estimates of E r p z . In addition, in Section 5.2, a 4% error each in T p z and T R z was estimated when the reported slant transmissions from 13 April 1964 at 00:18 MST were compared with the ones from the MODTRAN-validated algorithm, as shown in Figure 3. Considering a 20% error from P p φ s z O r i g and a 16% one from the product of T p z × T R z , a new estimate of the original range of errors for the β p z calculated profiles is achieved. Both unaccounted error estimates, totaling 36%, increase the original error range to between 69% and 84%. This is a gross estimate, still with unaccounted sources of errors because neither the sets of observed E r p z and the final T p z are available. This estimate is narrower than the ones from the lidar-derived β p z profile datasets from Lexington, MA, (42° N) and Fairbanks, AK, (64° N) during 1964 and 1965. Those estimate ranges, between 43% and 162% for Lexington and between 42% and 125% for Fairbanks, were calculated with a rigorous algorithm having a reasonable amount of information available [9].
Taking into consideration the re-calibration, the total absolute magnitudes of its improvements (in %) introduced by the updated parameters β R * ( z ) ¯ , t P p φ s z , and s P p φ s z , replacing β R z O r i g and P p φ s z O r i g , as reported in Table 1, amount to 15% for the troposphere and 29% for the stratosphere. Finally, the estimates of the error ranges, considering the corrected original error range between 69% and 84%, and improvements introduced by the re-calibration are between 54% and 69% in the troposphere and between 40% and 55% in the stratosphere. Both the corrected estimates of the original error range and the post-re-calibration estimated error ranges for the troposphere and the stratosphere are quite-low error values, the result of unaccounted error sources due to the lack of information. However, comparing them allows for visualizing the improvements introduced by the re-calibration.

8. Results and Discussion

Although the goal of this work is rescuing and re-calibrating the stratospheric aerosols from the Mt. Agung 1963 eruption, the aerosols in the troposphere are also of interest because of their impact on the tropospheric component of the total aerosol slant transmission, a very important parameter in the re-calibration process. In addition, their profiles could be a valuable source of information for diverse atmospheric research fields. Those are the main reasons to present and discuss the results of the entire aerosol extinction profiles and the tropospheric and stratospheric aerosol optical depths.

8.1. Rescued Profiles of β p O r i g ( z )

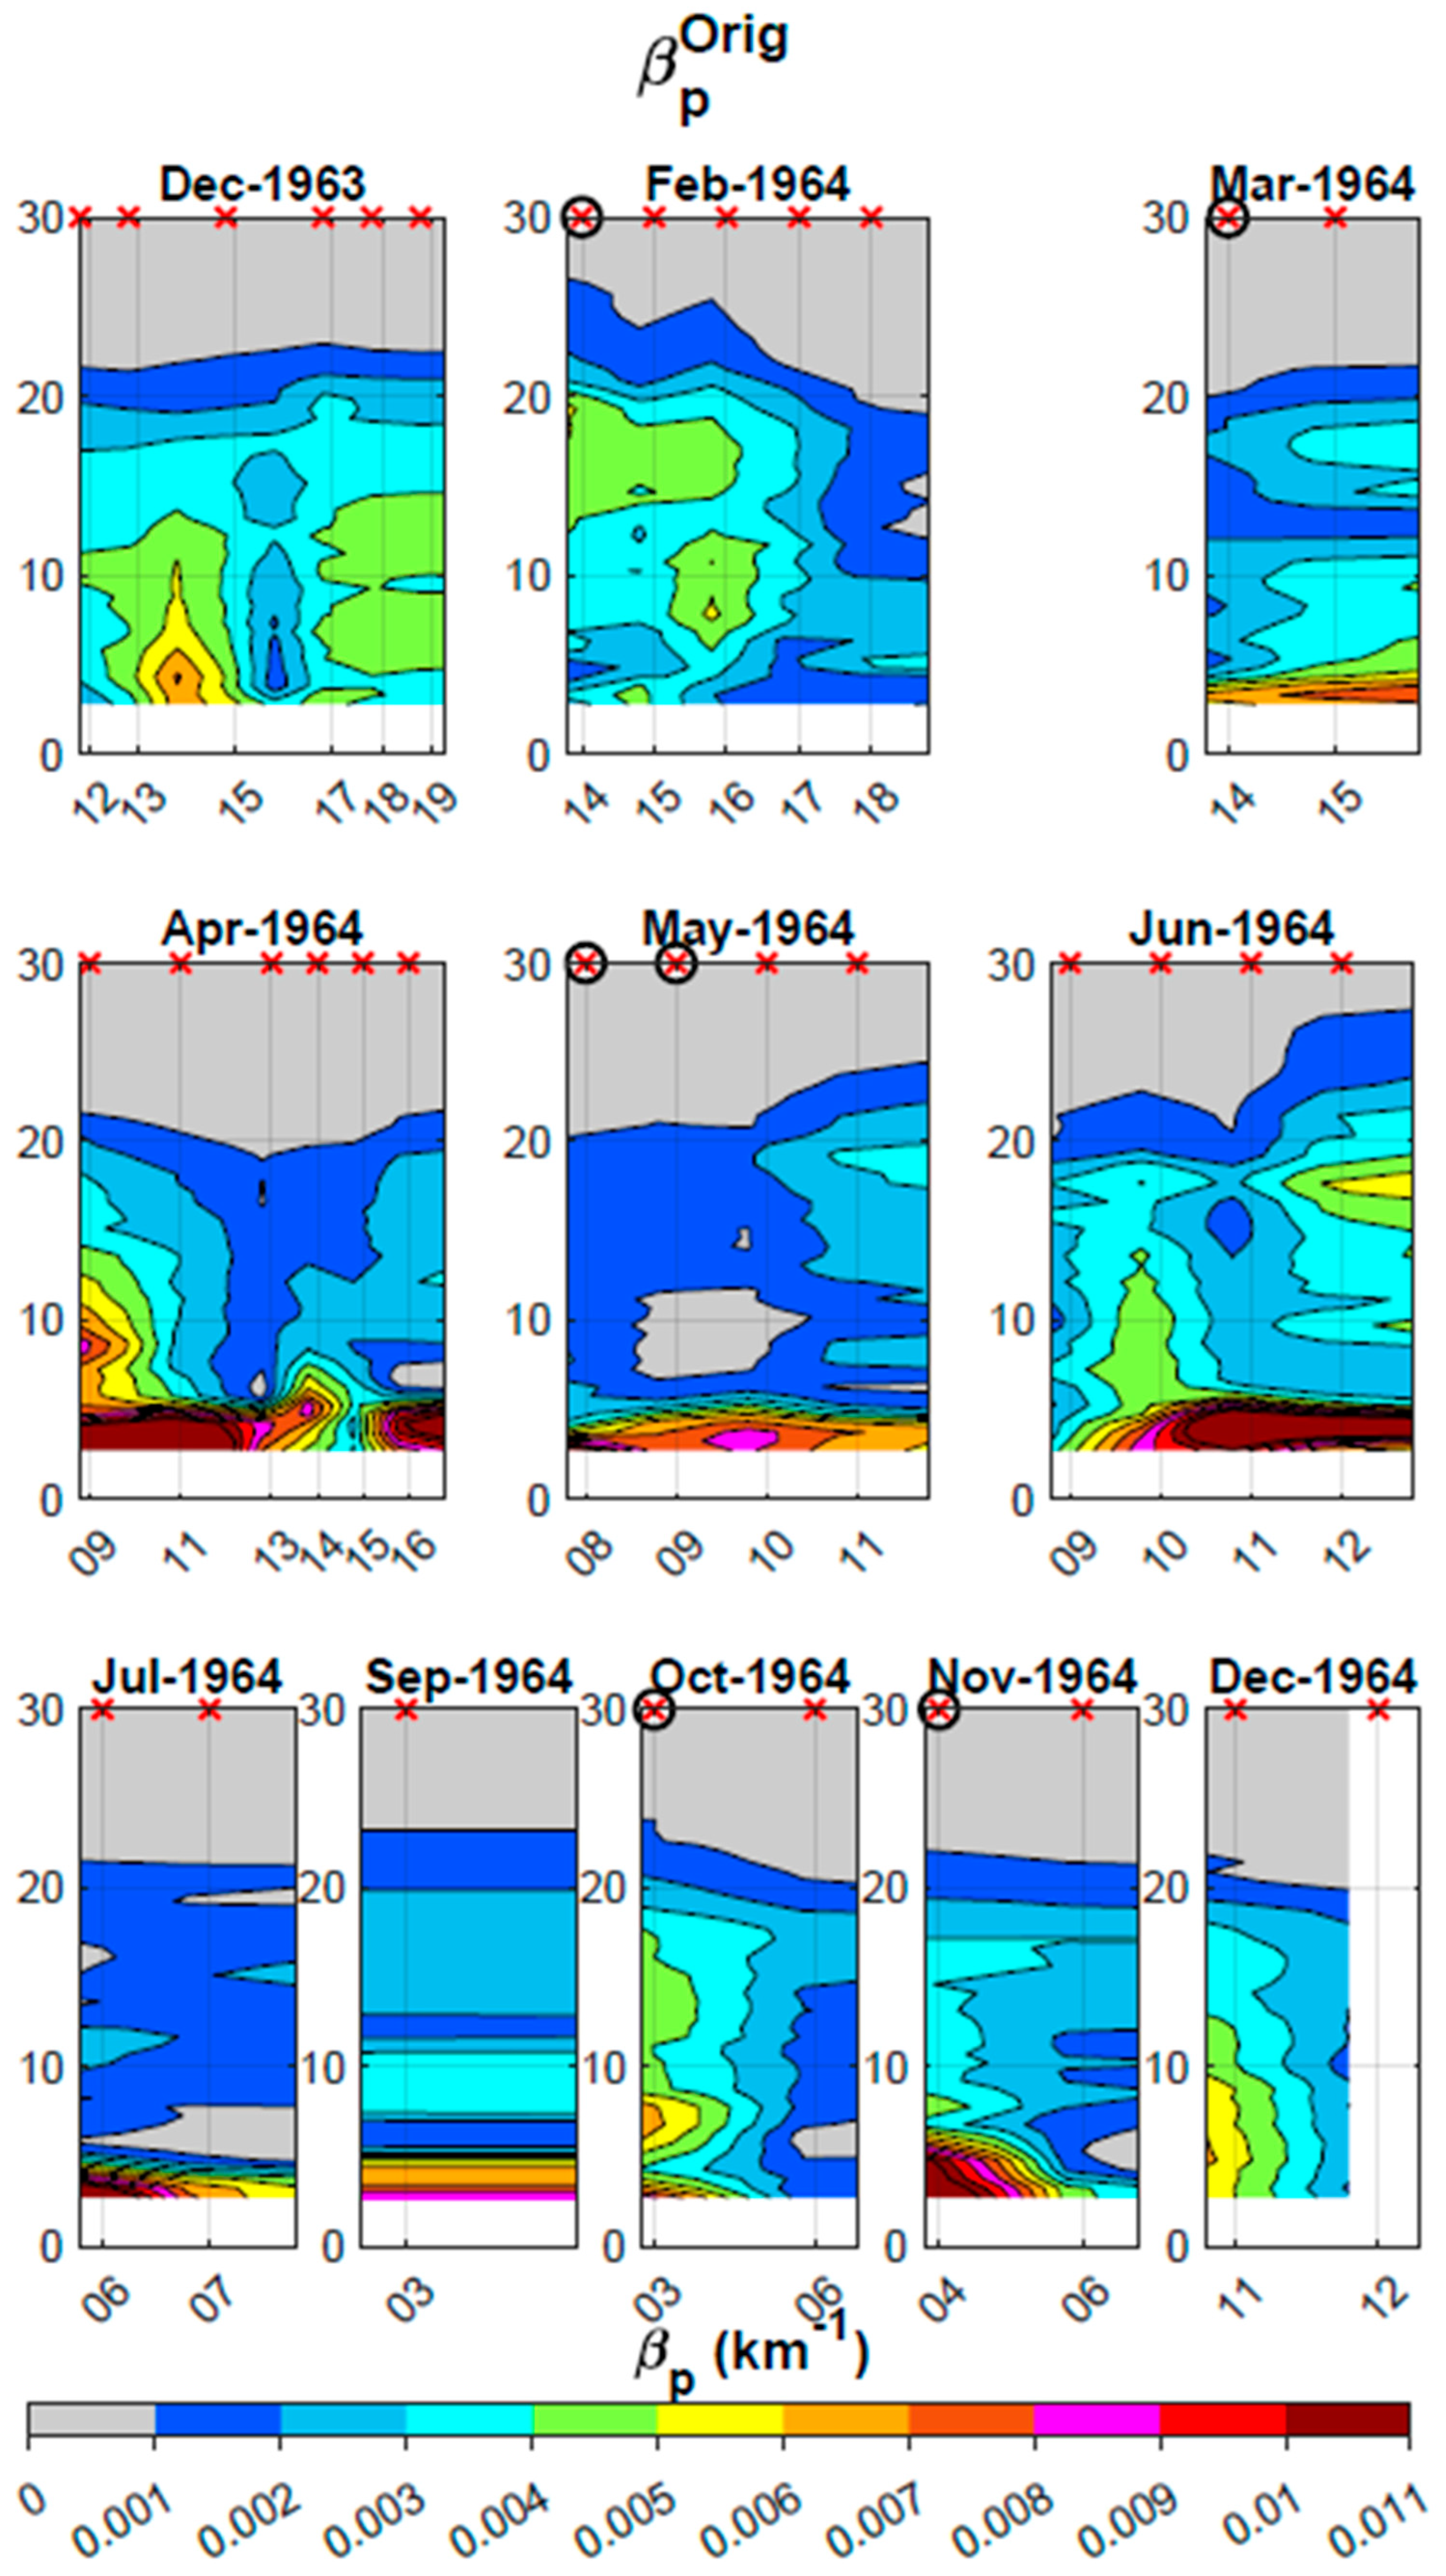
The 36 β p O r i g ( z ) daily averages of the 105 β p ( z ) re-digitized profiles were interpolated in time and altitude. The resulting cross sections are in Figure 6, showing only the months when observations are available. The red crosses on top of the panels, at the 30 km altitude, indicate the dates the daily average observations were conducted. Higher values of β p O r i g ( z ) were registered in the lower troposphere mainly near the lower altitude level of 2.76 km, with the maxima of 1.85 × 10⁻² km−1 at 2.76 km of altitude on 11 April 1964. The black circles encircling the red crosses indicate when tropospheric blowing dust (visibility less than 11 km) was reported at nearby weather stations the day of the nocturne searchlight observation.
Those tropospheric blowing-dust events were defined as dust raised by the wind to moderate heights above the ground, restricting horizontal visibility to less than 11 km [57]. Reports of blowing dust from the White Sands weather station (WSWS) White Sands Missile Range, New Mexico, (32°23′ N, 106°29′ W, 1296 m) from 1954–1973 and the Holloman weather station Holloman (HWS) Air Force Base, New Mexico, (32°51′ N, 106°05′ W, 1247 m) from 1960–1973 were reviewed for the period searchlight observations were conducted, 12 December 1963 to 12 December 1964. Those stations are located at 48 and 17 km, respectively, from Two Buttes (32°42′ N, 106°08′ W, 1388 m), which is the location where the projector was installed [34].
Table 2 shows the reports of blowing-dust events reported at the cited weather stations. For the days the seven blowing-dust events were reported the values of the β p O r i g ( z ) cross sections are equal to or higher than 7 × 10⁻³ km−1, with the reports on February 14th being the exception. This fact contributes to the confidence in the original dataset to represent the real aerosol features in the conditions at White Sands.

8.2. Re-Calibrated Profiles β p R e c a l ( z )

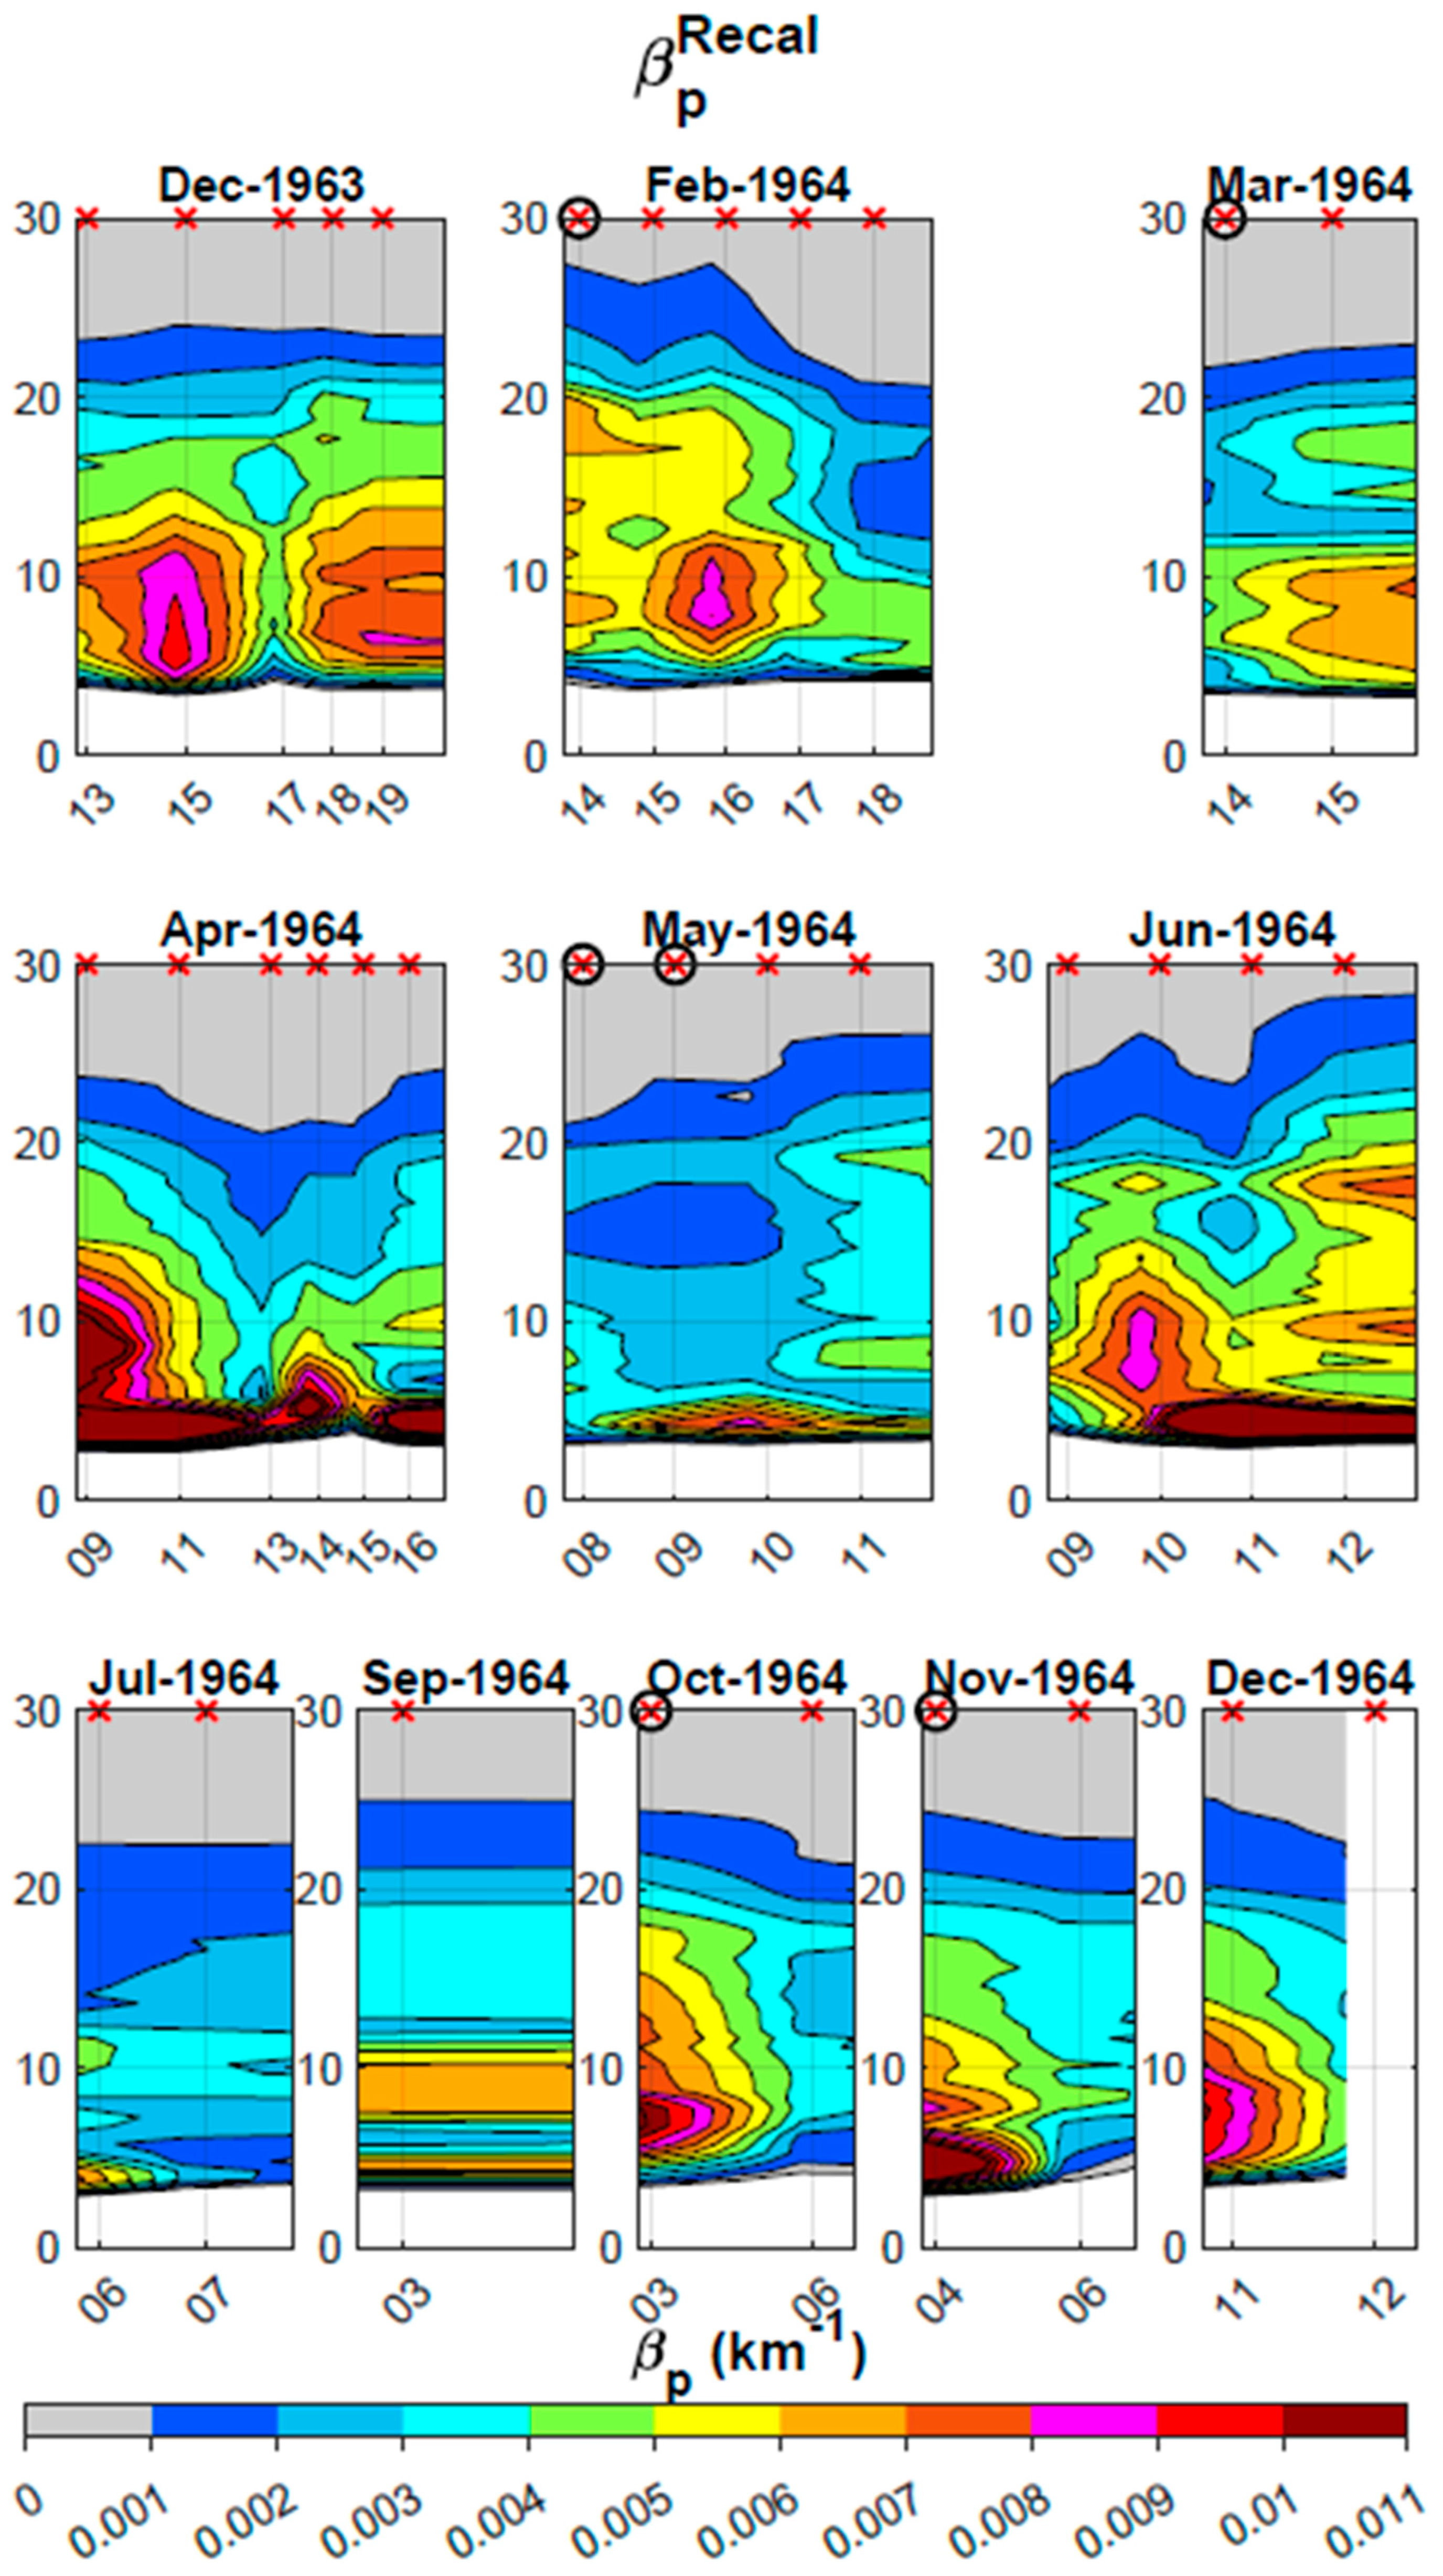
Figure 7 is similar to Figure 6, except that it displays the daily average of the re-calibrated cross sections β p R e c a l ( z ) . The β p R e c a l ( z ) magnitudes increase at almost all levels, but particularly in the layers near the lower tropopause altitude (11 km). At the tropopause, maxima values of β p O r i g ( z ) and β p R e c a l ( z ) are 6.25 × 10⁻³ km−1 and 1.09 × 10⁻² km−1, respectively, both at 11.7 km on 9 April 1964. The increase in the maxima from β p O r i g ( z ) to β p R e c a l is 75%.
Both β p O r i g ( z ) to β p R e c a l match, in general, the two-layer structure and their altitudes, around 18 km for the stratospheric layer and 8 km for the tropospheric, as reported from different contemporary observations. At the same latitude, the searchlight was installed, using twilight observations [58], the mean height of the stratospheric aerosols layer was determined to be at 17.8 km over Tucson, Arizona (32° N) late in 1963. That report corrects their preliminary estimate of 22 km [59]. Routine ozone soundings showed a dust layer at 20–21 km height at Boulder, Colorado (40° N) during March 1964 [60]. Observations with a lidar at Lexington, Massachusetts (42° N), report heights of 18 km in January 1964 and 16.5 km in November 1964 [22], which were also present on the re-calibrated profiles of this rescued dataset [9]. Photometric processing of the photographs taken in the twilight, the first taken by a spacecraft, from spaceship Vostok-6 over the southern coast of Africa on 17 June 1963, showed a two-layer structure, with a major aerosol layer at 19.5 km and a minor one at 11.5 km [61,62].

8.3. Averaged Rescued and Re-Calibrated Aerosol Extinction Profiles

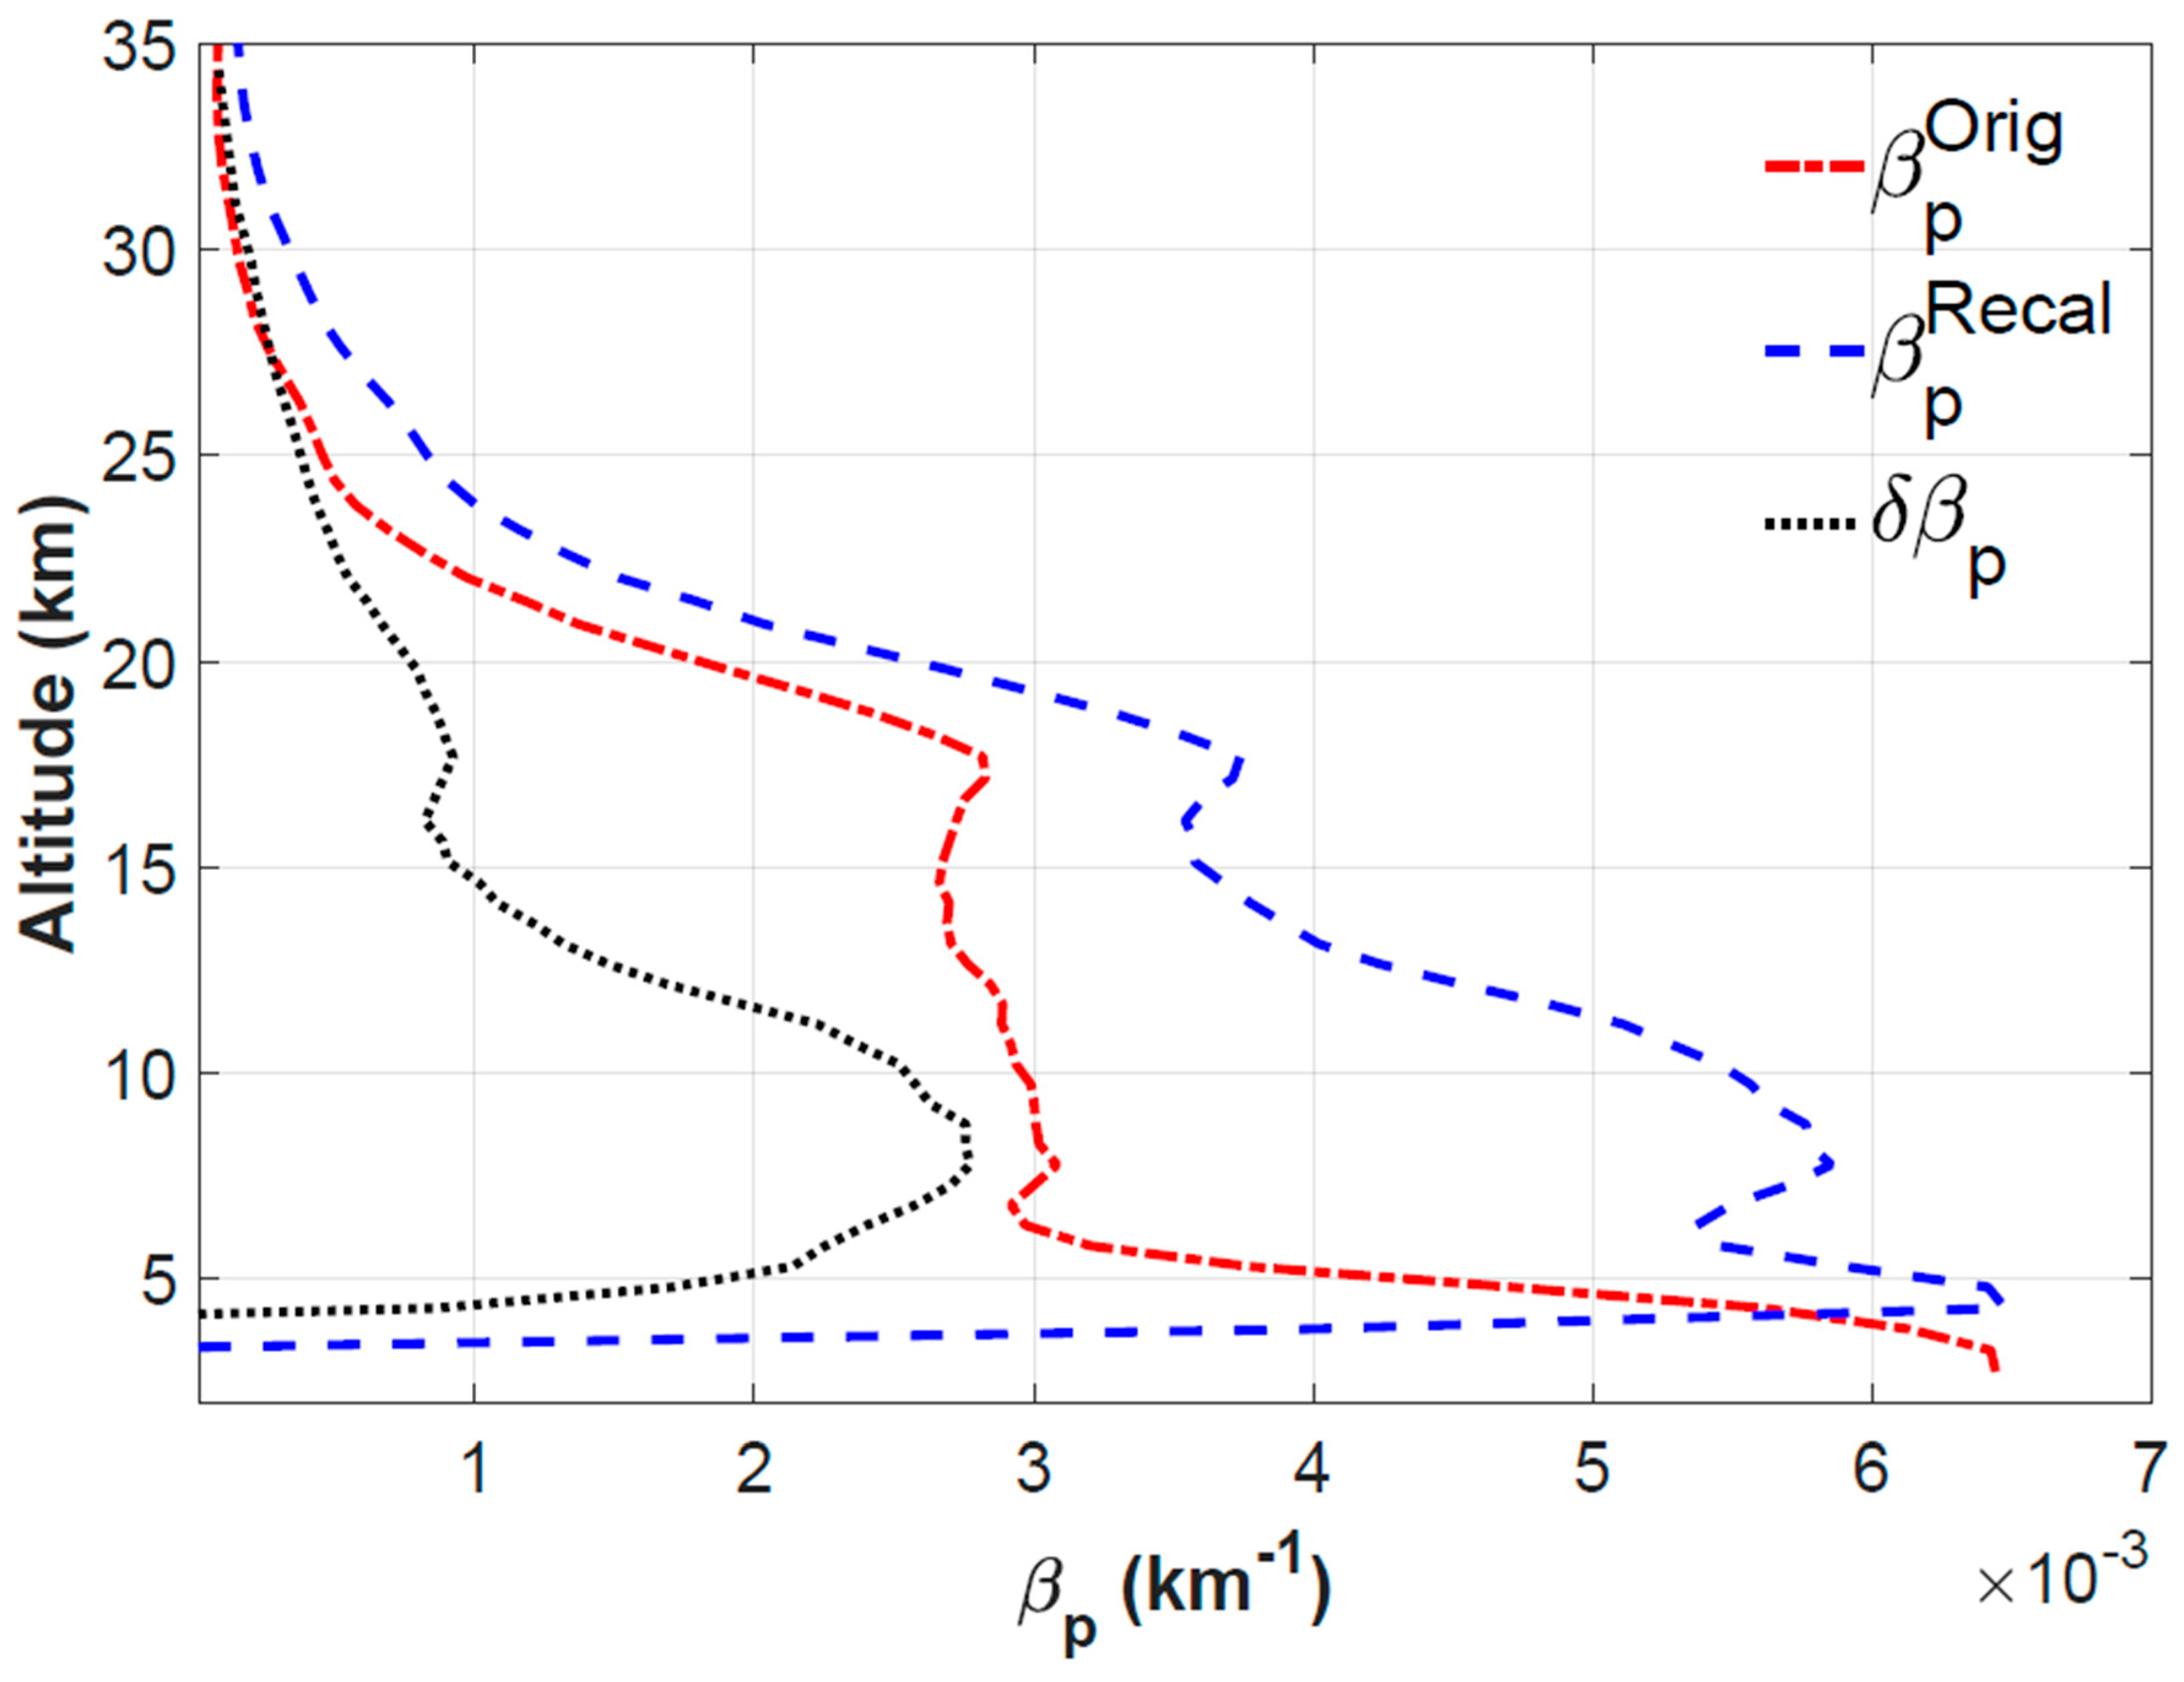
Figure 8 depicts the averaged profiles of β p O r i g ( z ) and β p R e c a l ( z ) ( β p O r i g ( z ) ¯ and β p R e c a l ( z ) ¯ ) and their difference ( β p = β p R e c a l z ¯ β p O r i g ( z ) ¯ ) . Almost the entire β p R e c a l ( z ) ¯ profile shows magnitudes well above the β p O r i g ( z ) ¯ , except for the three points below 5 km associated with the same anomalous behavior shown by the retrieved E r p ( z ) E r p ( 35 ) profile, shown in Figure 4 and Figure S3 in the Supplement and discussed in Section 5.4. The values of β p R e c a l ( z ) below 5 km should be considered cautiously.
Both average profiles show the two layers’ feature with peaks around 18 and 8 km, where average magnitudes of β p R e c a l ( z ) ¯ are 3.73 × 10⁻³ and 5.85 × 10⁻³ km−1 respectively. Those magnitudes represent an increase of 34 and 90% with respect to the β p O r i g ( z ) ¯ magnitudes at the same levels. The magnitudes of the AOD in the troposphere (5 to 12 km) from β p O r i g ( z ) ¯ and β p R e c a l ( z ) ¯ are, respectively, 0.0181 and 0.0323, increasing by 78%. In the stratosphere (12 to 35 km), they are 0.0307 and 0.04564, corresponding to an increase of 48%. Both the averaged β p R e c a l ( z ) ¯ and the corresponding AOD showed a higher increase in the troposphere than in the stratosphere.
Those increases are associated with several of the variables in Equation (1), in first place, to the mean T p ( z ) and T R ( z ) contributions to β p R e c a l z increases. The T p z contribution to the increase in β p R e c a l ( z ) was determined from the β p z and β p R e c a l z profiles resulting from the first and second steps of the recalibration, whose only difference was the introduction of the calculated T p z using the β p z from the first step. Then, the T p z contribution consisted of the 51% ± 2% in the troposphere and the 35% ± 6% in the stratosphere, resulting from the combination of the higher magnitudes of the β p z of the desert dust in the troposphere with the 4% increase in the slant transmission from the MODTRAN-validated algorithm discussed in Section 5.2. The T R z contribution was determined from the T R O r i g z calculated using the β R O r i g z from the US Standard Atmosphere and the T R * z using the β R z ¯ calculated from the 36 soundings coincident with the observation nights. The result was contributions of 11% ± 1% in the troposphere and 8% ± 1% in the stratosphere. The total contributions were 62% in the troposphere and 43% in the stratosphere. Another minor contribution was the 3% increase in the troposphere of β R z ¯ with respect to β R O r i g z . The former analysis shows that the use of a MODTRAN-verified slant transmission algorithm for T p z and T R z , together with the higher magnitudes of the β p z from the desert dust in the troposphere, were the major contributors to the re-calibration.

8.4. Daily Tropospheric AOD from the Rescued and Re-Calibrated Aerosol Extinction Profiles

In Figure 9, the series of daily original tropospheric AOD (hereinafter tAODOrig) and daily re-calibrated tropospheric AOD (tAODRecal) values (both from 4.8 to 10.7 km) are shown by the red triangles and blue stars, respectively. This is in addition to the monthly mean AOD at 550 nm and its standard deviation (black squares and whiskers) for the period 2006 to 2021 from the White Sands HELSTF AERONET site located at 1207 m asl (AODAERONET). This is the only nearby source of tropospheric AOD information found. It is 20 km from the projector location in Twin Buttes and 52 km from the detector at Sacramento Peak.
Both tAODOrig and tAODRecal agree in general with the lower values in winter for AODAERONET but are in general far below during the rest of the year. The agreement in winter could be explained by contemporary estimates of the average boundary-layer height diurnal cycle at White Sands. The boundary-layer heights were determined for the period from 1961 through 1972 using 8236 radiosonde soundings from the White Sands Desert Site (32°24′ N, 106°22′ W and 1216 m MSL). Soundings were conducted on an irregular basis, with schedules depending on mission and special project requirements. The mixing height averages and standard deviations were calculated for the entire period, at every hour between 0530 to 2030 MST, for the months of December, March, June, and September (Norton and Hoidale, 1976). The diurnal cycle average boundary-layer height for December showed a maximum of 929 m (2145 m MSL) at 1430 MST and minimums lower than 10 m in the earliest and latest hours. In the case of June, there was a maximum of 3418 m (4634 m MSL) at 1530 MST, a minimum of 18 m at 530 MST, and 137 m at 2330 MST.
During the whole year, the average of the maximum values of the boundary-layer height is predominantly below the altitude of the lower point used for the tAODOrig and tAODRecal integration, 4800 m. Then, for the entire year, only on the days when the boundary-layer height is above 4.8 km, the aerosols associated with the boundary-layer turbulent mixing could reach above that altitude. Then, only the aerosols associated with dust storms or other transport processes will contribute to the tAODOrig and tAODRecal shown in Figure 9.
Contemporary studies conducted at White Sands demonstrate that searchlight observations, conducted at night, sampled the troposphere well beyond the local boundary layer because of the detector located at 2.76 km asl. The first of those studies reported that the low-level jet, often registered by soundings at White Sands Missile Range (WSMR), has wind speed maxima in the upper portion (100–1000 m) of the planetary boundary layer [63].
A second study reported the climatology of the mixing height, reporting that in general, at night, the MH is at a minimum because of the radiative cooling of the ground and heat loss from the air to the ground [64]. The MH reaches its maxima during the afternoon because of solar heating of the ground and the subsequent heat exchange with the air. Relevant features of climatological MH at the White Sands Desert Site (32°24′ N, 106°22′ W; 1216 m asl) from that study, computed using 8236 diurnal radio soundings from 1961 through 1972 between 5:30 and 20:30 MST, are shown in Table 3. Although it does not provide precise information about the nocturnal climatological MH height, the extreme hours 05:30 and 20:30 MST in Table 3 provide a clue that the nocturnal MH was far below the altitude where the searchlight detector was located, 2.76 km, which is the altitude where the aerosol extinction begins.
The former conclusion implies that the boundary-layer aerosol at White Sands did not reach the altitude necessary to be observed by the searchlight. That leaves only the possibility that the extinction measured in the middle-upper troposphere corresponds to dust storms or clouds. That possibility was seriously limited by the fact (described in Section 2.2) that the observations were canceled in case of unfavorable meteorological conditions, including high winds and cloudy skies. This explains the relatively flat curve of tropospheric AOD derived for both the original and re-calibrated aerosol extinction profiles in comparison to the monthly mean tAOD bell-shaped curve from the White Sands HELSTF AERONET site between 2006 and 2021.

8.5. Stratospheric AOD from the Rescued (Original) and Re-Calibrated Aerosol Extinction Profiles

8.5.1. Daily Original and Re-Calibrated sAOD

Figure 10 shows the daily original stratospheric AOD (hereinafter sAODOrig) and daily re-calibrated stratospheric AOD (hereinafter sAODRecal). Two series of monthly means sAOD for the same period after the Agung 1963 eruption are also shown for illustrative purposes. The first, the most commonly used source of information, is the monthly mean sAOD in the whole Northern Hemisphere (hereinafter sAODSatoNH) from [10], relying especially for the period from 1960 to 1978 on the astronomical observations summarized by [65]. The sAODSato dataset also used, for the same period, the coarser information from the analysis of lunar eclipses throughout this period [66]. The second is the monthly mean sAOD between 20° N and 40° N (hereinafter sAODStothersNH) from [67], using astronomical observations and pyrheliometric direct-sunlight observations taken from the published literature.
The 67% of the sAODOrig values are higher than the corresponding monthly mean value of sAODStothersNH, while in the case of the sAODRecal, it is 92%. When the comparison is conducted with sAODSatoNH, those percents decrease to 28% for sAODOrig and 58% for sAODRecal. The sAODRecal values show a better agreement with the monthly mean sAODSatoNH, considering that they are almost evenly distributed around the monthly mean sAODSatoNH, rather than the sAODOrig, which shows 70% of its values lower than sAODSatoNH. This feature demonstrates that the daily sAODRecal agrees better with the most trusted source of information about the global and hemispheric sAOD distribution.
Table 4 shows the basic statistics for the series of sAODOrig and sAODRecal values. The mean values of sAODRecal (0.046) increased 48% with respect to the mean of the sAODOrig (0.032), while the standard deviations (σ) only increased 32%. That feature is better seen with the relative variability (rV = σ/Mean), showing for the sAODOrig a higher (42%) magnitude than for the sAODRecal (37%). Although there is a 48% mean increase in the daily sAODRecal with respect to the daily sAODOrig, the re-calibration caused a 5% decrease in the sAOD daily variability.
Estimates of the standard deviations for the daily observations used to derive sAODSato and sAODStothers are not available, and only a subjective estimate of a typical 25% error with a minimum uncertainty of 0.01, in the period 1915–1990, is available [10]. Based on that information, the minimum daily sAODOrig and sAODRecal values of 0.011 and 0.020, in Table 4, are above the minimum uncertainty of the sAODSato.
One of the methods to estimate the sAOD (sAODEclipse) from volcanic aerosols is the observations of changes in the Moon’s brightness during its total eclipses, which is one of the data sources used to calculate the monthly mean in the sAODSato series [10]. Two observations were conducted at the State University of Iowa Observatory, 24 km west of the Iowa city [68] around 41° N, the first on 30 December 1963 [69] and the second on 19 December 1964 [70]. A third one was conducted at the Ondřejov Observatory, 35 km southeast of Prague, Czech Republic, (49°54′55″ N 14°46′52″ E, 500 m asl) on 24–25 June 1964 [71,72]. These three astronomical observations were among a set of brightness records from 21 lunar eclipses during 1960–1982 that were used to estimate the aerosols load from the volcanic eruptions in that period [66]. After converting the visual stellar magnitude to equivalent attenuations of the full moon brightness and the comparison with theoretical values of moon brightness under non-volcanic aerosols conditions, the attenuation by volcanic aerosols is calculated. As reported in Table 2 from [66], the estimated sAODEclipse were 0.13, 0.08, and 0.05, respectively for 30 December 1963, 24–25 June, and 19 December 1964, respectively. The nearest days in the searchlight observations to the three cited sAODEclipse estimates and the respective daily sAODRecal are 30 December 1963, with 0.060, around half of the sAODEclipse 0.13; 12 June 1963, with 0.084, like the sAODEclipse of 0.08; and 12 December 1964, with 0.028, which is lower than the sAODEclipse of 0.05. However, regarding their magnitudes, the sAODEclipse doubles the values of the daily sAODRecal in December 1963 and 1964, while they have a similar value in June 1963. Moreover, the maximum daily magnitudes of sAODRecal (0.084) in Table 4 are similar to the maximum AODEclipse of 0.08 for 1964 and well below the absolute maxima of the three AODEclipse observations.
The main outcomes of Figure 10 are that daily sAODRecal shows a better agreement with sAODSatoNH than sAODOrig. In addition, the magnitudes of the daily sAODOrig are mainly between sAODSatoNH and sAODStothersNH, while daily sAODRecal values are above sAODStothersNH and in the range of the magnitudes of sAODSatoNH. The maximum daily sAODRecal magnitudes are on the order of the maxima sAODEclipse for 1964 and below the maxima sAODEclipse for 1963. Also, the magnitudes of daily sAODRecal show a 5% decrease in the daily variability with respect to the daily sAODOrig. Following the impact of the re-calibration on the monthly mean, the sAOD is evaluated.

8.5.2. Monthly Mean sAOD

Monthly mean sAODOrig and sAODRecal, together with the most relevant sAOD contemporary observations, are plotted in Figure 11. They include the sAODSatoNH and sAODStothersNH already used in Figure 10, but now also the monthly means sAODSatoSH and sAODStothersSH. Also, the monthly means of sAOD from the lidar observations conducted at Lexington, 42° N (sAODLex), MA, and Fairbanks, 64° N (sAODFair), AK, [9] are included in Figure 11. Finally, the sAODEclipse, three astronomical observations from lunar eclipses during 1963 and 1964, are used to estimate the aerosols load from volcanic eruptions [66].
The general features described in the previous subsection for daily sAOD series are more evident in Figure 11, with sAODSatoSH and sAODStothersSH showing that the monthly mean sAODRecal values are below monthly mean sAOD observed in the Southern Hemisphere. The former comparison is complemented by the inclusion of the sAODEclipses, showing again that monthly mean sAODRecal values are realistic because its magnitudes are similar to or lower than the highest magnitudes of the other instruments’ sAOD observations. Monthly mean sAODOrig values match in general the sAODStothersNH and, at the same time, are below the sAODSatoNH values. In the case of the monthly mean sAODRecal values, they are always higher than the sAODStothersNH, and in most of the cases, they are also higher than the sAODSatoNH values.
In Figure 11, it could be also appreciated that the decreasing trends of the monthly means sAODOrig and sAODRecal were in agreement with the well-known time decay of stratospheric aerosols of volcanic origin in the years after the eruptions. However, the sAODSatoNH and sAODStothersNH trends show an increasing tendency, while for the same series but for the Southern Hemisphere, sAODSatoSH and sAODStothersSH show the expected decreasing trend. It may be worthwhile to revisit the data sources used for the estimates of the sAOD from [10,67] to evaluate the possible re-calibration of the original datasets. The eclipse measurements from [66] with sAODEclipse 0.13, 0.08, and 0.05, respectively for 30 December 1963, 24–25 June, and 19 December 1964, described in the former section, clearly show a decreasing trend, which is in agreement with the tendencies shown for the daily and monthly means of sAODOrig and sAODRecal. The sAODEclipse also represents a sort of upper limit or extreme among the observed sAOD values, with monthly mean sAODRecal values far away from the two first observations and still below the third, which is very near to the sAODSatoNH. This fact is an indicator of the consistency of the sAODRecal.
Table 5 lists the basic statistics of the monthly mean sAODs for sAODOrig, sAODRecal, sAODSatoNH, sAODSatoSH, sAODStothersNH, and sAODStothersSH. N is the number of monthly mean values available between December 1963 and December 1964, both inclusive, that were used to calculate the respective means. Comparing the means of monthly means sAODRecal and sAODOrig in Table 5, the first is 48% higher, which is the same magnitude as the means of the daily sAODRecal and sAODOrig in Table 4. In Table 5, the monthly mean sAODOrig is lower than sAODSatoSH, an estimate for the whole Northern Hemisphere, and slightly higher than sAODStothersNH, estimated for the 20° N to 40° N latitude band. In contrast, the monthly mean sAODRecal is higher than both the sAODSatoNH and sAODStothersNH estimates. The maxima of the monthly mean sAODRecal increased by 43% with respect to the monthly mean sAODOrig and sAODStothersNH, and by 30% with respect to the maxima of sAODSatoNH. Also from Table 5, the relative variability of the monthly mean sAODOrig and sAODRecal were calculated, resulting in 24% and 21%, respectively. In this case, like for the daily sAODs, sAODOrig has a higher variability than the monthly mean sAODRecal, showing that re-calibration caused a 3% decrease in the sAOD monthly mean variability.
Because Mt Agung is in the tropics, the stratospheric aerosols main latitudinal transport is directed in both hemispheres to the respective polar regions, generating a pattern of decreasing sAOD from the tropics to each polar region. The monthly mean sAOD from lidar observations conducted at Lexington 42° N (sAODLex), MA, and Fairbanks, 64° N (sAODFairb), AK, ref. [9] included in Figure 11 allows for evaluating if the monthly means sAODOrig and sAODRecal comply with this established transport pattern. In the case of Fairbanks, the northernmost of the two lidar observation sites, the only coincident monthly means of sAODOrig and sAODRecal in July 1964 show higher magnitudes than the monthly mean sAODFairb, complying both with the pattern at that latitudinal scale. Then, comparing with monthly mean sAODLex, all the monthly mean sAODOrig always have lower values than the coincident monthly mean sAODLex. In the case of monthly mean sAODRecal from the six coincident months with monthly mean sAODLex, in four of them, the monthly mean sAODRecal have higher values and are lower in the other two. Those lower monthly mean sAODRecal values, with respect to monthly mean sAODLex, may have originated from the well-documented meridional inhomogeneity of the stratospheric aerosol clouds. The former comparison demonstrated that the monthly mean sAODRecal complies better than the monthly mean sAODOrig with the monthly mean sAOD latitudinal pattern after the major volcanic eruption in the tropical regions.

9. Conclusions

The aerosol extinction profiles dataset is rescued and its re-calibrated version is being made available to the scientific community. This constitutes a new piece of information that could be used to improve our understanding of the changes in the stratospheric aerosol following the Mt. Agung eruption in 1963. The errors in the rescuing process, conducted by re-digitalization of the plotted aerosol extinction profiles, have been calculated using the available original tabulated data from one of the profiles, showing lower error magnitudes than the error of the retrieved aerosol extinction. The re-calibration used all the available information about the original procedure, the algorithms used to compute the aerosol extinction profiles, and the tabulations of sections of variables used to calculate profiles. But still, it was incomplete regarding the fact that the only piece of information about aerosol and Rayleigh slant transmissions was not reproduced by the slant transmission cited in [32,33], and neither used the MODTRAN-4-validated algorithm implemented for that purpose. A consequence of this limitation was that it was not possible to reproduce the final T p z from the final β p z , eliminating the possibility of including in the retrieval of E r p ( z ) E r p ( 35 ) the inversion of the iterative convergent procedure to retrieve the observed E r p ( z ) E r p ( 35 ) . Another limitation was the lack of detailed information about the convergent iteration procedure applied to solve Equation (1) to adjust β p z and T p z . In particular, there is no information at all about what profiles required adjustments in E r p ( 35 ) and, again, about the final T p z profiles. Then, there is a high risk that conducting the iterative convergent procedure in the re-calibration will produce spurious β p z values. It was demonstrated that the use of a MODTRAN-verified slant transmission algorithm for T p z and T R z , together with the higher magnitudes of the β p z from the desert dust in the troposphere, were the major contributors to the re-calibration.
Comparisons of the properties of the rescued and re-calibrated searchlight observations with all the available contemporary reports from several different instruments were conducted, showing reasonable agreements for both datasets. The enhancement in the re-calibrated aerosol extinction profiles and in the corresponding AODs in the troposphere and stratosphere are within the ranges of the same variables from most of the other instruments. The ~50% increase in the re-calibrated sAOD with respect to the original sAOD is much more consistent with the transport of stratospheric aerosol due to a major volcanic eruption from tropics to poles, causing a latitudinal decreasing sAOD pattern when both are compared to the time-coincident sAOD observations from the Lexington lidar at 42° N.
This work can be considered as one of the initial steps in the long-overdue process of re-compiling, re-calibrating, and reconciling the existing records of the stratospheric aerosol optical and microphysical properties produced by the 1963 Agung eruption.

Supplementary Materials

The following supporting information can be downloaded at https://www.mdpi.com/article/10.3390/atmos15060635/s1, Figure S1: Figure 9 from Elterman [32,33]; Figure S2: Comparison of the molecular, aerosol and ozone transmissions, calculated with the algorithm we designed (red discontinuous lines) and the MODTRAN 4 code (markers in blue); Figure S3: Plot of the 36 daily averaged E r p ( z ) E r p ( 35 ) profile, showing the inflection point in all the profiles in a point located at 4.3 km (level 4); Figure S4: Rayleigh extinction profiles derived from local sounding at New Mexico with temperature and pressure profiles filled from 31 to 36 km with CIRA-86 model atmosphere; Figure S5: Plots of the differences ( δ β R ) and percent differences ( β R ) between β R S o n d e ( z ) and β R E R A 5 ( z ) minus β R z O r i g ; Figure S6: Plots of the averaged t P p φ s z at 440 nm and 675 nm, for the scattering angles from 0° to 180°; Figure S7: Plot of the normalized original and updated phase functions; Figure S8: Average Particle Size Distribution, derived from the monthly means for the period 2006 to 2021, from HELSTF AERONET site; Figure S9: Average of four Particle Size Distributions (PSD) observed at 18.3 km between April and August 1963 in the northern hemisphere. The PSD effective radius and mean radius are 0.386 μm and 0.340 μm respectively. Data from Table 11, pp. 109–110 in Feely et al., (1967) [73]; Table S1: List of the observations grouped by each of the 36 nights they were conducted; Table S2: Table 1 both in Elterman [32,33]; Table S3: Averages of the effective radius (ER) and the volume median radius (VMR) for the total, coarse and fine modes, derived from the monthly means for the period 2006 to 2021, from HELSTF AERONET site; Table S4: Metadata of the four PSD used to calculate the mean PSD for Agung northern hemisphere between 31° N and 33° N. References [32,33,40,45,46,73,74,75,76] are cited in Supplementary Materials.

Author Contributions

L.E. and his team made the original searchlight observations and their processing, reporting details and tabulated data of both activities in multiple reports and articles that allowed not only the data rescue but its re-calibration; J.-C.A.-M. conducted the search that found the dataset and the complementary datasets and designed and mainly conducted the re-calibration of the searchlight observations, the error evaluation, and the complementary datasets processing; J.-C.A.-M. and G.W.M. both contributed to the design of the paper and the progression of the Figures and text of the article; Z.L. contributed to the digitization of the aerosol profiles, the quality control of them, and the preliminary data processing and analysis; J.B. and N.S. contributed with their expertise on bi-static lidar systems and also to the analysis of the searchlight results and to the selection of the tropospheric aerosol phase function; A.C. contributed to the calculation of the aerosol and Rayleigh slant transmissions, applying the MODTRAN code in transmission mode; V.E.C. contributed to the calculation of the stratospheric aerosol phase function, applying an improved Mie code she developed; T.D. provided advice on the specifics of the stratospheric aerosol phase function; G.W.M., Z.L. and S.S.D. contributed to the analysis of the results; All co-authors contributed to advising/coordinating the data recovery, writing sections of the paper, and/or reviewing drafts of the paper. All authors have read and agreed to the published version of the manuscript.

Funding

The New Mexico 1963/64 searchlight observations recovered and re-calibrated in this study were part of a much broader program of atmospheric observations funded by the US government within the US Air Force Cambridge Research Laboratory (AFCRL), within the meteorological section of the AFCRL program, see, e.g., the two AFCRL research reports for 1963-65 (AFCRL, 1965) and 1965-67 (AFCRL, 1967). We are grateful for the US government’s support for this substantial atmospheric observations program. We acknowledge funding from the U.K. National Centre for Atmospheric Science (NCAS) for Dr. Sandip Dhomse via the UK’s Natural Environment Research Council (NERC) multi-center Long-Term Science program on the North Atlantic climate system (ACSIS: NERC grant NE/N018001/1). The NERC standard grant project MeteorStrat (grant number NE/R011222/1) provided investigator funding for GM, and a small amount of directly incurred funding for ZL and SD, which partly enabled this stratospheric aerosol research. We also acknowledge financial support from the Copernicus Atmospheric Monitoring Service (CAMS), one of six services that together form Copernicus, the EU’s Earth observation program. The global aerosol development tender (CAMS43), within the second phase of CAMS, provided funding for GM and SD during 2021 re: volcanic aerosol modeling, which helped enable their advice and support for the analysis of the searchlight observations. AFCRL (1965), report on research at AFCRL for the period July 1963 to July 1965, AFCRL report 65-595, downloaded copy at https://homepages.see.leeds.ac.uk/~amtgwm/AFCRL_ResearchReport_1963to1965.pdf (accessed on 7 May 2022). AFCRL (1967), report on research at AFCRL for the period July 1965 to July 1967, and AFCRL report 68-0039, https://ia800703.us.archive.org/27/items/DTIC_AD0666484/DTIC_AD0666484.pdf (accessed on 7 May 2022).

Institutional Review Board Statement

Not applicable.

Informed Consent Statement

Not applicable.

Data Availability Statement

Data described in this work are available at the PANGAEA open-access dataset repository: Antuña Marrero, J.-C., Mann, G. W., Barnes, J., Calle, A., Dhomse, S. S., Cachorro Revilla, V. E., Deshler, T., Li, Z. and Sharma, Tropospheric and stratospheric aerosol extinction and stratospheric aerosol optical depth from searchlight measurements conducted at White Sands, New Mexico, US between December 1963 and December 1964 [dataset publication series]. PANGAEA, https://doi.org/10.1594/PANGAEA.949377, 2023 (accessed on 18 November 2023).

Acknowledgments

To the memory of Louis Elterman and the team he led for their extraordinary achievements both technologically and scientifically. The developments of the searchlight technology they conducted had a profound impact on the early developments of lidars. In addition, their two scattering component assumption for the atmosphere, to solve the searchlight equation, was also assumed to solve the lidar equation and led to its further developments. To Claudia Timmreck for contributing to the search and location of an important article to clarify the source data used by Louis Elterman for the calculation of the aerosol phase function he used in the searchlight data processing. Juan Carlos Antuña-Marrero recognizes the support from the Optics Atmospheric Group, Department of Theoretical, Atomic, and Optical Physics, University of Valladolid, Spain. We also recognize role of the University of Leeds’s Institute for Climate and Atmospheric Science, within the School of Earth and Environment, re: the “Climate and Atmospheric Science” Master of Research degree program that provided ZL the opportunity to re-digitize and analyze the New Mexico searchlight observations.

Conflicts of Interest

The authors declare no conflicts of interest.

References

  1. Timmreck, C. Modeling the climatic effects of large explosive volcanic eruptions. WIREs Clim. Chang. 2012, 3, 545–564. [Google Scholar] [CrossRef]
  2. Robock, A. Volcanic eruptions and climate. Rev. Geophys. 2000, 38, 191–219. [Google Scholar] [CrossRef]
  3. Kremser, S.; Thomason, L.W.; von Hobe, M.; Hermann, M.; Deshler, T.; Timmreck, C.; Toohey, M.; Stenke, A.; Schwarz, J.P.; Weigelet, R.; et al. Stratospheric aerosol—Observations, processes, and impact on climate. Rev. Geophys. 2016, 54, 278–335. [Google Scholar] [CrossRef]
  4. Zanchettin, D.; Khodri, M.; Timmreck, C.; Toohey, M.; Schmidt, A.; Gerber, E.; Hegerl, G.; Robock, A.; Pausata, F.; Ball, W.T.; et al. The Model Intercomparison Project on the climatic response to volcanic forcing (VolMIP): Experimental design and forcing input data. Geosci. Model Dev. 2016, 9, 2701–2719. [Google Scholar] [CrossRef]
  5. Zanchettin, D.; Timmreck, C.; Khodri, M.; Schmidt, A.; Toohey, M.; Abe, M.; Bekki, S.; Cole, J.; Fang, S.-W.; Feng, W.; et al. Effects of forcing differences and initial conditions on inter-model agreement in the VolMIP volc-pinatubo-full experiment. Geosci. Model Dev. 2022, 15, 2265–2292. [Google Scholar] [CrossRef]
  6. Timmreck, C.; Mann, G.W.; Aquila, V.; Hommel, R.; Lee, L.A.; Schmidt, A.; Brühl, C.; Carn, S.; Chin, M.; Dhomse, S.S.; et al. The Interactive Stratospheric Aerosol Model Intercomparison Project (ISA-MIP): Motivation and experimental design. Geosci. Model Dev. 2018, 11, 2581–2608. [Google Scholar] [CrossRef]
  7. Dhomse, S.S.; Mann, G.W.; Antuña Marrero, J.C.; Shallcross, S.E.; Chipperfield, M.P.; Carslaw, K.S.; Marshall, L.; Abraham, N.L.; Johnson, C.E. Evaluating the simulated radiative forcings, aerosol properties, and stratospheric warmings from the 1963 Mt Agung, 1982 El Chichón, and 1991 Mt Pinatubo volcanic aerosol clouds. Atmos. Chem. Phys. 2020, 20, 13627–13654. [Google Scholar] [CrossRef]
  8. Niemeier, U.; Timmreck, C.; Krüger, K. Revisiting the Agung 1963 volcanic forcing—Impact of one or two eruptions. Atmos. Chem. Phys. 2019, 19, 10379–10390. [Google Scholar] [CrossRef]
  9. Luo, B. Stratospheric Aerosol Data for Use in CMIP6 Models Data Description. 2016. Available online: ftp://iacftp.ethz.ch/pub_read/luo/CMIP6/Readme_Data_Description.pdf (accessed on 12 January 2022).
  10. Sato, M.; Hansen, J.E.; McCornick, M.P.; Pollack, J.B. Stratospheric aerosol optical depths, 1850 to 1990. J. Geophys. Res. 1993, 98, 22987–22994. [Google Scholar] [CrossRef]
  11. McCormick, M.P.; Swissler, T.J. Stratospheric aerosol mass and latitudinal distribution of the El Chichón eruption cloud for October 1982. Geophys. Res. Lett. 1983, 10, 877–880. [Google Scholar] [CrossRef]
  12. Thomason, L.W.; Ernest, N.; Millán, L.; Rieger, L.; Bourassa, A.; Vernier, J.-P.; Manney, G.; Luo, B.; Arfeuille, F.; Peter, T. A global space-based stratospheric aerosol climatology: 1979–2016. Earth Syst. Sci. Data 2018, 10, 469–492. [Google Scholar] [CrossRef]
  13. Antuña-Marrero, J.-C.; Mann, G.W.; Keckhut, P.; Avdyushin, S.; Nardi, B.; Thomason, L.W. Shipborne lidar measurements showing the progression of the tropical reservoir of volcanic aerosol after the June 1991 Pinatubo eruption. Earth Syst. Sci. Data 2020, 12, 2843–2851. [Google Scholar] [CrossRef]
  14. Antuña-Marrero, J.-C.; Mann, G.W.; Barnes, J.; Rodríguez-Vega, A.; Shallcross, S.; Dhomse, S.S.; Fiocco, G.; Grams, G.W. Recovery of the first ever multi-year lidar dataset of the stratospheric aerosol layer, from Lexington, MA, and Fairbanks, AK, January 1964 to July 1965. Earth Syst. Sci. Data 2021, 13, 4407–4423. [Google Scholar] [CrossRef]
  15. Elterman, L.; Toolin, R.B.; Essex, J.D. Stratospheric Aerosol Measurements with Implications for Global Climate. Appl. Opt. 1973, 12, 330–337. [Google Scholar] [CrossRef] [PubMed]
  16. Synge, E.H. A method of investigating the higher atmosphere. Phil. Mag. 1930, 9, 1014–1020. [Google Scholar] [CrossRef]
  17. Tuve, M.A.; Johnson, E.A.; Wulf, O.R. A new experimental method for study of the upper atmosphere. Terr. Mag. 1935, 40, 452–454. [Google Scholar] [CrossRef]
  18. Hulburt, E.O. Observations of a searchlight beam to an altitude of 28 kilometers. J. Opt. Soc. Amer. 1937, 27, 377–382. [Google Scholar] [CrossRef]
  19. Johnson, E.A.; Meyer, R.C.; Hopkins, R.E.; Mock, W.H. The measurement of light scattered by the upper atmosphere from a searchlight beam. J. Opt. Soc. Amer. 1939, 29, 512–517. [Google Scholar] [CrossRef]
  20. Friedland, S.S.; Katzenstein, J.; Zatzick, M.R. Pulsed searchlighting the atmosphere. J. Geophys. Res. 1956, 61, 415–434. [Google Scholar] [CrossRef]
  21. Dodd, K.N. The Determination of Upper Atmosphere Densities by Scattering of Searchlight Beam; Technical Note No. M.S. 58; Royal Aircraft Establishment: Farnborough, UK, 1959. [Google Scholar]
  22. Rozenberg, G.V. (Ed.) Prozhetornyi Luch v Atmosfere (Searchlight Beams in the Atmosphere); lzd-vo AN SSSR: Moskow, Russia, 1960. [Google Scholar]
  23. Maiman, T. Stimulated Optical Radiation in Ruby. Nature 1960, 187, 493–494. [Google Scholar] [CrossRef]
  24. Schawlow, A.L.; Townes, C.H. Infrared and Optical Masers. Phys. Rev. 1958, 112, 1940–1949. [Google Scholar] [CrossRef]
  25. Elterman, L. Aerosol measurements since 1973 for normal and volcanic stratospheres. Appl. Opt. 1976, 15, 1113–1114. [Google Scholar] [CrossRef]
  26. Grams, G.W.; Fiocco, G. Stratospheric aerosol layer during 1964 and 1965. J. Geophys. Res. 1967, 72, 3523–3542. [Google Scholar] [CrossRef]
  27. Grams, G.W. Optical Radar Studies of Stratospheric Aerosols. Ph.D. Thesis, Massachusetts Institute for Technology, Cambridge, MA, USA, 1966. Available online: https://dspace.mit.edu/handle/1721.1/13502 (accessed on 10 May 2024).
  28. Antuña Marrero, J.-C.; Mann, G.W.; Barnes, J.; Rodríguez-Vega, A.; Shallcross, S.; Dhomse, S.S.; Fiocco, G.; Grams, G.W. The first ever multi-year lidar dataset of the stratospheric aerosol layer, from Lexington, MA, and Fairbanks, AK, Jan 1964 to Jul 1965. In PANGAEA Open-Access Dataset Repository; PANGAEA: Bremen, Germany, 2020. [Google Scholar] [CrossRef]
  29. Elterman, L. The measurement of stratospheric density distribution with the searchlight technique. J. Geophys. Res. 1951, 56, 509–520. [Google Scholar] [CrossRef]
  30. Elterman, L. Seasonal trends of temperature, density, and pressure to 67.6 km obtained with the searchlight probing technique. J. Gephys. Res. 1954, 59, 351–358. [Google Scholar] [CrossRef]
  31. Elterman, L.; Campbell, A.B. Atmospheric Aerosol Observations with Searchlight Probing. J. Atmos. Sci. 1964, 21, 457–458. [Google Scholar] [CrossRef]
  32. Elterman, L. An Atlas of Aerosol Attenuation and Extinction Profiles for the Troposphere and Stratosphere; Report AFCRL-66-828; AFCRL: Bedford, MA, USA, 1966; 128p, Available online: https://apps.dtic.mil/sti/pdfs/AD0649778.pdf (accessed on 3 May 2022).
  33. Elterman, L. Aerosol Measurements in the Troposphere and Stratosphere. Appl. Opt. 1966, 5, 1769–1776. [Google Scholar] [CrossRef]
  34. Hinds, B.D.; Kimberlin, R.F., III; Hoidale, G.B. Boundary Layer Dust Occurrence. I: Atmospheric Dust over the White Sands Missile Range, New Mexico, Area; ECOM-DR-75-2; Atmospheric Sciences Laboratory, US Army Electronics Command: White Sands Missile Range, NM, USA; 67p.
  35. Elterman, L. Rayleigh and Extinction Coefficients to 50 km for the Region 0.27 μ to 0.55 μ. Appl. Opt. 1964, 3, 1139–1147. [Google Scholar] [CrossRef]
  36. Elterman, L. Atmospheric Attenuation Model, 1964, in the Ultraviolet, Visible, and Infrared Regions for Altitudes to 50 km. AFCRL-64-740; 1964; 40p. Available online: https://apps.dtic.mil/sti/pdfs/AD0607859.pdf (accessed on 3 May 2022).
  37. Rohatgi, A. WebPlotDigitizer. 2022. Available online: https://automeris.io/WebPlotDigitizer (accessed on 17 September 2022).
  38. Antuña Marrero, J.-C.; Mann, G.W.; Barnes, J.; Calle, A.; Dhomse, S.S.; Cachorro Revilla, V.E.; Deshler, T.; Li, Z.; Sharma, N. Tropospheric and stratospheric aerosol extinction from searchlight measurements conducted at White Sands, New Mexico, US between December 1963 and December 1964. [dataset publication series] 2023. In PANGAEA Open-Access Dataset Repository; PANGAEA: Bremen, Germany, 2023. [Google Scholar] [CrossRef]
  39. Berk, A.; Bernstein, L.S.; Anderson, G.P.; Acharya, P.K.; Chetwynd, J.H.; Adler-Golden, S.M. MODTRAN cloud and multiple scattering upgrades with application to AVIRIS. Remote Sens. Environ. 1998, 65, 367–375. [Google Scholar] [CrossRef]
  40. U.S. Standard Atmosphere—1976; U.S. Government Printing Office: Washington, DC, USA, 1976. Available online: https://www.ngdc.noaa.gov/stp/space-weather/online-publications/miscellaneous/us-standard-atmosphere-1976/us-standard-atmosphere_st76-1562_noaa.pdf (accessed on 5 October 2022).
  41. Reeger, E.; Siedentopf, H. Die Streufunktion des Atmospharischen Dunstes nach Scheinwerfer Messungen. Optik 1946, 1, 15–41. [Google Scholar]
  42. Gibson, F. Atmospheric Aerosol Scattering Background Observations, AFGL-TR-88-0146; Environmental Research Paper No.1006; Air Force Geophysics Lab: Hanscom Air Force Base, MA, USA, 1988; 34p, Available online: https://apps.dtic.mil/sti/tr/pdf/ADA206752.pdf (accessed on 23 May 2022).
  43. Wells, M.B. Monte Carlo Analysis of Searchlight Scattering Measurements; AFCRL-68-0311, AD0675153; Air Force Cambridge Research Laboratories, Office of Aerospace Research, United States Air Force: Bedford, MA, USA, 1968; 23p, Available online: https://apps.dtic.mil/sti/pdfs/AD0675153.pdf (accessed on 11 May 2022).
  44. Durre, I.; Yin, X.; Vose, R.; Applequist, S.; Arnfield, J. Integrated Global Rad iosonde Archive (IGRA), Version 2; NOAA National Centers for Environmental Information: Asheville, NC, USA, 2016. [CrossRef]
  45. Durre, I.; Yin, X.; Vose, R.S.; Applequist, S.; Arnfield, J. Enhancing the Data Coverage in the Integrated Global Radiosonde Archive. J. Atmos. Ocean. Technol. 2018, 35, 1753–1770. [Google Scholar] [CrossRef]
  46. Fleming, E.L.; Chandra, S.; Barnett, J.J.; Corney, M. Zonal mean temperature, pressure, zonal wind, and geopotential height as functions of latitude, COSPAR International Reference Atmosphere: 1986, Part II: Middle Atmosphere Models. Adv. Space Res. 1990, 10, 11–59. [Google Scholar] [CrossRef]
  47. Hostetler, C.A.; Liu, Z.; Regan, J.; Vaughan, M.; Winker, D.; Osborn, M.; Hunt, W.H.; Powell, K.A.; Trepte, C. CALIOP Algorithm Theoretical Basis Document (ATBD): Calibration and Level 1 Data Products, Doc. PC-SCI-201; Langley Research Center: Hampton, VA, USA, 2006. Available online: https://www-calipso.larc.nasa.gov/resources/pdfs/PC-SCI-201v1.0.pdf (accessed on 19 December 2022).
  48. Hersbach, H.; Bell, B.; Berrisford, P.; Hirahara, S.; Horányi, A.; Muñoz-Sabater, J.; Nicolas, J.; Peubey, C.; Radu, R.; Schepers, D.; et al. The ERA5 global reanalyses. Q. J. R. Meteorol. Soc. 2020, 146, 1999–2049. [Google Scholar] [CrossRef]
  49. AERONET. White Sands. 2022. Available online: https://aeronet.gsfc.nasa.gov/cgi-bin/data_display_aod_v3?site=White_Sands&nachal=2&level=3&place_code=10 (accessed on 5 January 2022).
  50. AERONET. AERONET Inversion Products (Version 3). 2022. Available online: https://aeronet.gsfc.nasa.gov/new_web/Documents/Inversion_products_for_V3.pdf (accessed on 5 January 2022).
  51. Friend, J.P. Properties of the stratospheric aerosol. Tellus 1966, 465, 465–473. [Google Scholar] [CrossRef]
  52. Cachorro, V.E.; Salcedo, L.L. New Improvements for Mie Scattering Calculations. J. Electromagn. Waves Appl. 1991, 5, 913–926. [Google Scholar] [CrossRef]
  53. Borden, T.R.; Hering, W.S. Ozonesonde Observations over North America; AFRCRL-64-30(IV); Air Force Cambridge Research Laboratories, Office of Aerospace Research, U.S. Air Force: Hanscom Field, MA, USA, 1964; 365p, Available online: https://catalog.hathitrust.org/Record/102197526 (accessed on 7 June 2022).
  54. Serdyuchenko, A.; Gorshelev, V.; Weber, M.; Chehade, W.; Burrows, J.P. High spectral resolution ozone absorption cross sections—Part 2: Temperature dependence. Atmos. Meas. Tech. 2014, 7, 625–636. [Google Scholar] [CrossRef]
  55. Añel, J.A.; Antuña, J.C.; de la Torre, L.; Castanheira, J.M.; Gimeno, L. Climatological features of global multiple tropopause events. J. Geophys. Res. 2008, 113, D00B08. [Google Scholar] [CrossRef]
  56. Randel, W.J.; Seidel, D.J.; Pan, L.L. Observational characteristics of double tropopauses. J. Geophys. Res. 2007, 112, D07309. [Google Scholar] [CrossRef]
  57. NWS. Surface Observations: Abridged from Federal Meteorological Handbook No. 1 for FAA, LAWR, and A-Type Stations; National Weather Service: Silver Spring, MD, USA, 1973; 318p. Available online: https://babel.hathitrust.org/cgi/pt?id=mdp.39015018277957&seq=7 (accessed on 26 July 2022).
  58. Meinel, A.B.; Meinel, M.P. Height of the glow stratum from the eruption of Agung on Bali. Nature 1964, 201, 657–658. [Google Scholar] [CrossRef]
  59. Meinel, M.P.; Meinel, A.B. Late Twilight Glow of the Ash Stratum from the Eruption of Agung Volcano. Science 1963, 142, 582–583. [Google Scholar] [CrossRef]
  60. Pittock, A.B. A thin stable layer of anomalous ozone and dust content. J. Atmos. Sci. 1966, 23, 538–542. [Google Scholar] [CrossRef]
  61. Rozenberg, G.V.; Nikolaeva-Tereshkova, V.V. Stratospheric aerosol according to measurements from a spacecraft. In Izvestiya AN SSSR: Physics of the Atmosphere and Ocean; Izvestiya Akademii Nauk SSSR: Moscow, Russia, 1965; Volume 1, pp. 386–394. (In Russian) [Google Scholar]
  62. Sushkevich, T.A. To the 55th Anniversary of the Discovery of Stratospheric Aerosol Layers from Space: Volcanoes and Climate Problems (Dedicated to the 65th Anniversary of the M.V. Keldysh Institute of Applied Mathematics and Its Achievements in Manned Astronautics). 2018; 32p. Available online: http://library.keldysh.ru/preprint.asp?id=2018-125 (accessed on 4 July 2022). (In Russian).
  63. Rider, L.J.; Armendariz, M. Nocturnal Maximum Winds in the Planetary Boundary White Sands Missile Range. New Mex. J. Appl. Meteorol. 1971, 10, 1154–1161. [Google Scholar] [CrossRef]
  64. Norton, C.L.; Hoidale, G.B. The Diurnal Variation of Mixing Height by Season over White Sands Missile Range. New Mex. Mon. Weather Rev. 1976, 104, 1317–1320. [Google Scholar] [CrossRef]
  65. Dyer, A.J.; Hicks, B.B. Global spread of volcanic dust from the Bali eruption of 1963. Q. J. R. Meteorol. Soc. 1968, 94, 545–554. [Google Scholar] [CrossRef]
  66. Keen, R.A. Volcanic aerosols and lunar eclipses. Science 1983, 222, 1011–1013. [Google Scholar] [CrossRef]
  67. Stothers, R.B. Major optical depth perturbations to the stratosphere from volcanic eruptions: Stellar extinction period, 1961-1978. J. Geophys. Res. 2001, 106, 2993–3003. [Google Scholar] [CrossRef]
  68. Matsushima, S. Site selection for a small observatory in the Midwest. Publ. Astron. Soc. Pac. 1964, 76, 224–230. [Google Scholar] [CrossRef]
  69. Matsushima, S.; Zink, J.R. Three-Color Photometry of Mare Crisium during the Total Eclipse of 30 December 1963. Astron. J. 1964, 69, 481–484. [Google Scholar] [CrossRef]
  70. Matsushima, S.; Zink, J.R.; Hansen, J.E. Atmospheric Extinction by Dust Particles as Determined from Three-Color Photometry of the Lunar Eclipse of 19 December 1964*. Astron. J. 1966, 71, 103–110. [Google Scholar] [CrossRef]
  71. Bouska, J.; Mayer, P. Photoelectric observation of the lunar eclipse of 24–25 June 1964. Bull. Astron. Inst. Czechoslov. 1964, 16, 252–254. [Google Scholar]
  72. Matsushima, S. Atmospheric extinction: Czech lunar photometry of the 25 June 1964 eclipse. Publ. Astron. Soc. Pac. 1967, 79, 178–180. [Google Scholar] [CrossRef]
  73. Feely, H.W.; Katzman, D.; Seitz, H.; Davidson, B.; Friend, J.P. Final Report on Project Stardust; DASA 2166-1 Report, Chapters 1–6; Isotopes Inc.: Westwood, NJ, USA, 1967; Volume I, 223p, Available online: https://apps.dtic.mil/sti/pdfs/AD0850378.pdf (accessed on 3 June 2022).
  74. Fleming, E.L.; Chandra, S.; Schoeberl, M.R.; Barnett, J.J. Monthly mean global climatology of temperature, wind, geopotential height, and pressure for 0–120 km. In NASA Technical Reports Server; NASA TM-100697; NASA: Washington, DC, USA, 1988; 85p. Available online: https://ntrs.nasa.gov/api/citations/19880013119/downloads/19880013119.pdf (accessed on 5 June 2022).
  75. SPARC. The SPARC Intercomparison of Middle Atmosphere Climatologies. J. Clim. 2004, 17, 986–1003. [Google Scholar] [CrossRef]
  76. U.S. Standard Atmosphere 1962; U.S. Government Printing Office: Washington, DC, USA, 1962. Available online: https://ntrs.nasa.gov/api/citations/19630003300/downloads/19630003300.pdf (accessed on 5 October 2022).
Figure 1. Searchlight scene geometry in New Mexico. Projector elevation angle ϕp = 75°; beam and collector field divergences are adjusted to 1.7° and 2.0°, respectively. Both divergences are exaggerated in this Figure. (From Elterman, [32,33]).
Atmosphere 15 00635 g001
Figure 2. Re-digitized and tabulated aerosol extinction profile for 13 April 1964 at 00:18.
Atmosphere 15 00635 g002
Figure 3. Plot of the re-digitized aerosol extinction transmission ( T p z O r i g ) and Rayleigh transmission ( T R + p z O r i g ) from Figure 9 in Elterman [32,33], the Figure T2 in this Supplement. T p z M O D T R A N and T R + p z M O D T R A N are the aerosol extinction and Rayleigh transmissions, respectively, calculated with the slant path transmission algorithm verified with MODTRAN-4 code using the β p z D i g i t re-digitized profile of 13 April 1964 at 00:18 MST and β R z O r i g from the Table 5.9 in the Atmospheric Attenuation Model [36].
Atmosphere 15 00635 g003
Figure 4. Retrieved and tabulated normalized detector response for 13 April 1964 at 00:18 MST.
Atmosphere 15 00635 g004
Figure 5. Averaged profiles of the aerosol extinction calculated for each of the updated parameters independently ( β R z * , P R φ s z * , and P p φ s z * ), using for the rest of the variables the originals ( β R z O r i g , P R φ s z O r i g , and P p φ s z O r i g ). β p 0 z ¯ is the average of the β p 0 z calculated using the retrieved E r p z E r p 35 and β R z O r i g , P R φ s z O r i g , and P p φ s z O r i g the same variables used to retrieve E r p z E r p 35 . In left panel β p 0 R z ¯ ; center panel β p 0 O 3 z ¯ and left panel β p 0 t P p z ¯ and β p 0 s P p z ¯ . Also, β p 0 z ¯ is plotted in each panel.
Atmosphere 15 00635 g005
Figure 6. Cross sections of the original aerosol extinction profiles ( β p O r i g ( z ) ) for the set of days available each month. The red crosses on top of the panels, at the 30 km altitude, indicate the dates the daily average observations were conducted. The red crosses inside a black circle indicate that blowing dust (visibility less than 11 km) was reported at nearby weather stations the day the nocturne searchlight measurement was conducted.
Atmosphere 15 00635 g006
Figure 7. Idem to Figure 6 except that it is for recalibrated aerosol extinction ( β p R e c a l ( z ) ).
Atmosphere 15 00635 g007
Figure 8. Averaged original and recalibrated aerosol extinction profiles ( β p O r i g ( z ) ¯ and β p R e c a l ( z ) ¯ ) and their differences ( δ β p ) .
Atmosphere 15 00635 g008
Figure 9. Time series of the original and recalibrated tropospheric daily aerosol optical depth (tAODOrig and tAODRecal) (4.8 to 10.7 km). Also, monthly mean aerosol optical depth from the White Sands HELSTF AERONET site (AODAERONET) at 550 nm for the period 2006 to 2021. The whiskers in monthly mean AODAERONET curve represent the standard deviations.
Atmosphere 15 00635 g009
Figure 10. Original and recalibrated daily stratospheric aerosol optical depths (sAODOrig and sAODRecal) and the Southern Hemisphere monthly means of stratospheric aerosol optical depths from [10,67], (sAODSatoSH and sAODStothersSH, respectively).
Atmosphere 15 00635 g010
Figure 11. Original and recalibrated monthly means stratospheric aerosol optical depth (sAODOrig and sAODRecal) and also Southern and Northern Hemisphere monthly means of stratospheric aerosol optical depths from [10,67] (sAODSatoSH, sAODSatoNH, sAODStothersSH, and sAODStothersNH, respectively). In addition, the monthly means sAOD from lidar observations conducted at Lexington 42° N (sAODLex), MA, and Fairbanks, 64° N (sAODFairb), AK, from [9]. Finally, the sAODEclipse, three astronomical observations from lunar eclipses during 1963 and 1964 used to estimate the aerosols load from volcanic eruptions [66].
Atmosphere 15 00635 g011
Table 1. Mean differences in β p (km−1) produced by each of the updated parameters and the implemented slant transmission algorithm. The relative magnitudes (%) were calculated with respect to the layers’ averages from β p D i g i t ( z ) ¯ .
Updated
Parameters
5–12 km12–35 km
δ β p (km−1)% δ β p (km−1)%
t P p −3.5 × 10⁻⁴−12-------
s P p ------- −2.2 × 10⁻⁴−20
β R * z 1.0 × 10−43−1.2 × 10⁻⁴−9
T O 3 * ------- 2.0 × 10−70
Table 2. Reports of blowing dust in the vicinity of the projector location. The acronyms are time of day (ToD): quarter of the day in LST during which the bulk of the blowing dust occurred, the LST: local sidereal time, and DD: the wind direction. Original data from [34].
DurationMonthYearDayToD (LST)DDStation
55 min21964121200–1800WWSWS
134 min21964141200–1800SWHWS
210 min31964131200–1800SWHWS
403 min51964071200–1800WWSWS
568 min51964071200–1800SWHWS
49 min101964021200–1800CHWS
59 min111964030600–1200NEHWS
Table 3. Mixing height for White Sands 1961–1972.
MonthHeight (05:30)Height (20:30)Max. HeightMax. Time
December37 m8 m929 m14:30 MST
March68 m148 m2257 m14:30 MST
June18 m137 m3418 m15:30 MST
September40 m49 m1784 m13:30 MST
Table 4. Statistics of the daily sAOD. The term rV is the relative variability, σ/Mean in %.
VariableMeanσrVMax.Min.
sAODOrig0.0320.01342%0.0600.011
sAODRecal0.0460.01737%0.0840.020
Table 5. Statistics of the monthly means sAOD. N is the number of monthly mean values available between December 1963 and December 1964, both inclusive.
VariableMeanσMax.Min.N
sAODOrig0.0290.0070.0380.01811
sAODRecal0.0430.0090.0560.02811
sAODLex0.0410.0060.0480.0347
sAODSatoNH0.0400.0020.0430.03613
sAODSatoSH0.1050.0130.1320.08513
sAODStothersNH0.0250.0060.0390.01513
sAODStothersSH0.0810.0290.1480.04713
Disclaimer/Publisher’s Note: The statements, opinions and data contained in all publications are solely those of the individual author(s) and contributor(s) and not of MDPI and/or the editor(s). MDPI and/or the editor(s) disclaim responsibility for any injury to people or property resulting from any ideas, methods, instructions or products referred to in the content.