Abstract
The unprecedented reductions in anthropogenic emissions over the COVID-19 lockdowns were utilised to investigate the response of ozone (O3) concentrations to changes in its precursors across various UK sites. Ozone, volatile organic compounds (VOCs) and NOx (NO+NO2) data were obtained for a 3-year period encompassing the pandemic period (January 2019–December 2021), as well as a pre-pandemic year (2017), to better understand the contribution of precursor emissions to O3 fluctuations. Compared with pre-lockdown levels, NO and NO2 declined by up to 63% and 42%, respectively, over the lockdown periods, with the most significant changes in pollutant concentrations recorded across the urban traffic sites. O3 levels correspondingly increased by up to 30%, consistent with decreases in the [NO]/[NO2] ratio for O3 concentration response. Analysis of the response of O3 concentrations to the NOx reductions suggested that urban traffic, suburban background and suburban industrial sites operate under VOC-limited regimes, while urban background, urban industrial and rural background sites are NOx-limited. This was in agreement with the [VOC]/[NOx] ratios determined for the London Marylebone Road (LMR; urban traffic) site and the Chilbolton Observatory (CO; rural background) site, which produced values below and above 8, respectively. Conversely, [VOC]/[NOx] ratios for the London Eltham (LE; suburban background) site indicated NOx-sensitivity, which may suggest the [VOC]/[NOx] ratio for O3 concentration response may have had a slight NOx-sensitive bias. Furthermore, O3 concentration response with [NO]/[NO2] and [VOC]/[NOx] were also investigated to determine their relevance and accuracy in identifying O3-NOx-VOC relationships across UK sites. While the results obtained via utilisation of these metrics would suggest a shift in photochemical regime, it is likely that variation in O3 during this period was primarily driven by shifts in oxidant (OX; NO2 + O3) equilibrium as a result of decreasing NO2, with increased O3 transported from Europe likely having some influence.
1. Introduction
The coronavirus pandemic has been one of the largest challenges faced globally in recent years, with 675 million total cases and 6.87 million deaths over 2 years [1,2]. The UK response involved enforcing social distancing measures (18 March 2020) and national lockdowns, with the first starting on 23 March 2020. The initial lockdown lasted around three months with restrictions being lifted on 4 July 2020 [3,4,5]. Following this were two subsequent lockdowns: 5 November 2020 to 2 December 2020 and 6 January 2021 to 21 June 2021. All lockdowns involved similar restrictions (but to varying degrees), mainly related to limits on non-essential gatherings (including at workplaces and schools), non-essential travel and non-essential services [4,5]. Restrictions were gradually eased from 12 April 2021 [3]. The strict limitations placed on the population resulted in social and economic disruption and a significant reduction in pollution as a result. An astonishing 69% reduction of traffic (by vehicle count) was observed in total across the UK, and this drastic decrease in human activity caused an unprecedented fall in pollution in the UK and across the globe [4,5,6,7]. Furthermore, industrial activity across the globe was reduced between 25% and 45%, in turn reducing the emissions of O3 precursors, such as NOx and VOCs [8]. Conversely, during this time, a substantial increase in tropospheric O3 was reported in many areas [9].
It is generally agreed that O3 generation exists under two main regimes: NOx-limited and VOC-limited. Under NOx-limited regimes, O3 formation is predominantly driven by the reaction of the HO2 or RO2 radicals with NO whereas in VOC-limited regimes, O3 formation is driven by VOC oxidation. In NOx-limited regimes, a reduction in NOx will result in a reduction of O3. Conversely, in VOC-limited regimes, a reduction in NOx can result in an increase in O3 generation due to reduced NO titration [10,11,12,13,14,15,16]. As a result, there is a delicate balance to be achieved when reducing NOx, a common target of air quality-related legislation [17], in order not to inadvertently increase O3, which has a range of its own negative impacts [1,12,18,19,20,21,22,23,24]. This has presented an interesting challenge in design of air quality legislation where either location-specific or dual-pollutant control strategies are likely to be required [9,10,12,25].
While there is a clear link between the NOx reduction during UK lockdowns and elevated O3, there are confounding factors that also require consideration. Namely, the role of meteorology, inter-annual variability, influence of long-term NOx reductions and shifts in equilibrium between intrinsically linked species [6,9]. For example, in the 3 months prior to the first UK COVID-19 lockdown (January–March 2020), roadside concentrations were reduced by 30%, compared with the 2017–2019 average, via the introduction of clean Atlantic air into the UK by prevailing westerly winds in January and February [9]. Similarly, O3 elevation was likely amplified by the unusually warm, dry weather experienced during the initial UK lockdown [9]. Given the coupled nature of NOx and O3, oxidising species may be combined to give a joint ‘oxidant’ term, OX (NO2 + O3). This is often done to more succinctly describe the short-duration exchanges between the two compounds. As these species exist in a state of equilibrium, variation of one may impact the other; this is another important factor to consider when assessing the impacts of lockdown on tropospheric O3.
Nevertheless, the pandemic had a clear impact on air pollutant concentrations. On a global scale, satellite observations by the TROPOMI (Tropospheric Monitoring Instrument) indicated that total anthropogenic emissions of NOx in April 2020 decreased by 14.8 ± 2.3% in comparison with the 2010–2019 baseline [18,26]. In a business-as-usual scenario, this reduction corresponds to 15 ± 4 years of global NO2 reductions [27]. In the UK, declines of 50% and 38% were observed for NO2 and VOCs, respectively, in comparison with the same period in 2019 [1]. Similarly, roadside NO2 concentrations between April and June 2020 were 42% lower than those of the previous 3 years [9]. Therefore, meteorology and air quality regulations alone cannot account for the changes in pollution over the course of 2020, with the global lockdowns clearly displaying a disproportionate contribution to the observed decreases in NO2.
Accordingly, the end of lockdown restrictions in 2021 led to increases in NO2 concentrations and a reduction in O3 formation, decreasing mean O3 concentrations by 3% compared with the highest value recorded in 2020 [9]. The reduction of anthropogenic NOx emissions, as seen under the COVID-19 lockdowns, is typically regarded as beneficial to air pollution and climate change [18]. However, the significant resultant increase in O3 concentrations across many regions of the UK and the world has challenged this perspective. Tropospheric ozone has a positive radiative force and is harmful to human health, so its increase is, by definition, not beneficial to either climate change mitigation or air quality improvement [18]. In VOC-limited O3 generation regimes, in particular, decreasing NOx emissions increases O3 via a reduction in O3 loss by NO titration. Therefore, to control O3 pollution, it is vital to understand the role of O3-NOx-VOC sensitivity under different environments to prevent ineffective pollution reduction policies. With such a unique set of conditions, the COVID-19 pandemic thus provides an opportunity to investigate how O3 production and sensitivity changes under monumental reductions in anthropogenic emissions.
A number of studies have been conducted regarding the impact of the pandemic on air quality globally [1,28,29,30,31,32]. Similarly, a number of studies have looked at the impact in the UK specifically [5,7,33]. However, these studies have not considered the impact of the pandemic on O3 generation sensitivity and lack context regarding the non-linearity of O3 response to its precursors under different production regimes. The lockdowns in the UK provide an unprecedented opportunity to assess and test the robustness of commonly used metrics relating to such processes and investigate the complex relationships between tropospheric pollutants in extraordinary circumstances. As such, this investigation examined monitoring data from 60 stations covering different environmental types situated around the UK to assess the variability of pollutants pre-lockdown and during lockdown. Additionally, where possible, a number of indicators were employed and compared to elucidate the O3 generation regime of a given site and any shifts as a result of pollution reduction during lockdown restrictions. The study also shows the effect of the lockdown response in terms of increasing O3 and decreasing NO2 to the decreasing NOx by changes in the oxidant partitioning.
2. Materials and Methods
To determine the difference between the pandemic and ‘normal’ conditions, we analysed measurement data for O3 and NOx (=NO + NO2) over a 3-year period (1 January 2019–31 December 2021) encompassing the COVID-19 pandemic, as well as pre- and post-pandemic periods. These data were then compared with data from 2017 (1 January–31 December) to provide a pre-lockdown representation without potential impacts from early behaviour change or seasonal skewing that could result from solely considering the months directly preceding the UK lockdowns. Ground-level readings for these pollutants were obtained from the Automatic Urban and Rural Monitoring Network (AURN), supplied by the Department for Environment, Food and Rural Affairs (DEFRA), which records measurement data on various pollutants across 170 Air Quality Monitoring Stations (AQMS) throughout the UK [34]. O3 concentrations at these stations were obtained through UV absorption, while NO and NO2 measurements were recorded by chemiluminescence [34]. Measurement data for each pollutant were collected as time-resolved hourly readings in units of μg m−3 but were subsequently converted into molecule cm−3 for analysis purposes.
Only monitoring stations with sufficient (>70%) data coverage for O3, NO and NO2 over the specified time periods were used for analysis in this study (Figure 1). Of the 170 current monitoring sites, this constituted a total of 60 sites that met said data coverage requirements. More details about the site selection are shown in Figure 2. These covered a range of environments including urban, suburban, rural, industrial and traffic sites [35], with some variation observed in the representation of each site type. Larger quantities of data were generally recorded at the urban background and rural background sites, with the urban background environment contributing the greatest proportion of the measurement sites analysed (38 sites; 63.3%) (see Appendix A, Table A1). As a result, data reported for the urban background sites is a much more reliable representation of the environment type, as it contains data averaged over 38 sites, as opposed to the much fewer sites represented by the urban industrial (3 sites), suburban background (3 sites) and suburban industrial (1 site) data. In terms of geographical representation, the data were mainly concentrated across England, with only a small number of sites in Scotland (5 sites), Wales (4 sites) and Northern Ireland (1 site) having sufficient data for analysis. Of the sites in England, there was a clear distribution disparity (Figure 1) and a total of 7 of these monitoring stations were situated in London.
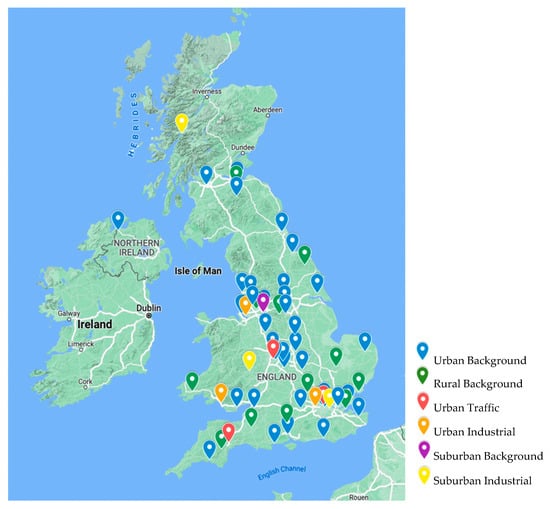
Figure 1.
Map of the UK plotting the locations of the 60 sites used for the data analysis in this study.

Figure 2.
Site selection procedure.
Data on the relevant VOCs were similarly obtained from DEFRA’s Automatic Hydrocarbon Network, albeit for only 3 sites (London Eltham, Suburban background; London Marylebone Road, Urban traffic; Chilbolton Observatory, Rural background), as this network consists of just 5 current monitoring stations and only 3 of these recorded sufficient VOC data over the time periods considered (Appendix A, Table A2) [36]. An automatic PerkinElmer gas chromatograph was used to record data on a total of 29 VOCs (12 alkanes, 10 alkenes, 6 aromatic hydrocarbons, 1 alkyne), with an uncertainty of 15% in the measurements [36]. Of these 29 VOCs, 16 were selected as most relevant to this study, based on the magnitude of their impact on surface ozone formation (Table 1) [5,36].

Table 1.
Table of the 16 volatile organic compound (VOC) pollutants for which there was sufficient data coverage to be used in this study, alongside their emission sources.
Although alkanes are often emitted from ozone production analyses, due to their comparatively low reactivity as VOCs, they have recently been shown to play a substantial role in tropospheric ozone formation. At the monitoring stations of both London Eltham (LE) and London Marylebone Road (LMR), alkanes accounted for 60% (3 out of 5) of the greatest contributors to ozone production, along with ethene and propene [25]. A study at LMR also suggested the importance of certain alkanes, demonstrating that approximately 75% of the total ozone formation potential (OFP) at this site was accounted for by ethene, propene, m + p-xylene, toluene, isopentane, n-butane, o-xylene and iso-butane [5].
The urban traffic site LMR received special attention in this study due to the various species measured, the good data coverage of these measurements and its nature as a traffic site with significant local, anthropogenic emissions. Additional analysis relating to oxidant (OX) variation is also conducted at this site. Where this is carried out, data were filtered to include only daylight hours (due to the photochemical nature of conversion between the two oxidants O3 and NO2) and overt O3 photochemical episodes (defined as [O3] > 50 ppb) were removed from analysis (Appendix B).
Pollutant concentration data of the individual sites for the time period of January 2019 to December 2021 were averaged across the environment type (e.g., urban background, urban traffic, urban industrial, rural background, suburban background, suburban industrial), which were then monthly averaged to produce a focused analysis of concentration changes under each environment. The average monthly pollutant concentrations for the calendar year of 2020 against that of 2017 were also produced, which revealed a parallel analysis of how concentrations of pollutants changed across different environments under the significantly reduced pollution conditions of pandemic restrictions and the normal conditions of a pre-pandemic year. Uncertainty was represented using standard deviation.
VOC data obtained from LMR, LE and Chilbolton Observatory (CO) were used in combination with O3 and NOx measurements for the 3 sites to identify the NOx vs VOC ozone generation sensitivities displayed by the varying site types. A number of established indicators were used to analyse the O3 generation sensitivity at each site.
The first of the indicators utilised is the most common; the photochemical [VOC]/[NOx] ratio [5]. Naturally, there is a strong correlation between the rate of tropospheric O3 production and the concentrations of its precursors [13,37]. O3 production efficiency can, therefore, be described by the ratio of the rate of O3 generation against the rate of NOx removal, represented by Equation (1).
where [VOC] and [NOx] are the concentrations and kOHVOC and kOHNOx are the rate constants for reactions of VOCs and NOx with OH, respectively.
The boundary between VOC- and NOx-limited regimes has been stated to be ~8, or between 8 and 10 according to the California Air Resources Board (CARB) [5,13,37]. Reportedly, any value below 8 is representative of a VOC-limited O3 generation regime, whereas values of above 8 are instead suggestive of NOx-limited conditions [37].
The second indicator utilised was the [NO]/[NO2] ratio (Equation (2)). NOx is well known for playing a dual role in both the formation and destruction of O3 [14]. With the photolysis of NO2 playing an important role in the formation of O3 and NO playing an important role in O3 destruction, an increase in the NO:NOx ratio can be assumed to result in a reduction in O3 and vice versa [1].
Despite the existence of other indicators, VOCs/NOx and [NO]/[NO2] are the most appropriate for use in the contexts considered here.
3. Results and Discussion
3.1. Timeline of the COVID-19 Restrictions in the UK
Many previous studies have looked at the impacts of the restrictions implemented during the first COVID-19 lockdown (23 March–4 July 2020) on UK pollution levels, as this was the strictest of the three total lockdowns imposed by the government over the course of the pandemic [5,38] (Figure 3). The first lockdown lasted for approximately 14 weeks and resulted in low levels of traffic and other anthropogenic activity, providing the most significant contrast with pre-pandemic years [38]. Studies such as those of Lee et al. [39] and Higham et al. [33] have consequently compared this time period with previous years to indicate the role of lockdown restrictions on the pollutant levels, with substantial decreases and increases observed in NOx and O3 concentrations, respectively. However, as this initial lockdown occurred over the course of spring and early summer months, a reduction in NOx levels and an elevation of O3 concentrations would be expected due to elevated photo dissociative O3 generation, regardless of restrictions [9,10,20]. Therefore, there was difficulty in determining the extent to which lockdown restrictions contributed to these changes in concentration.
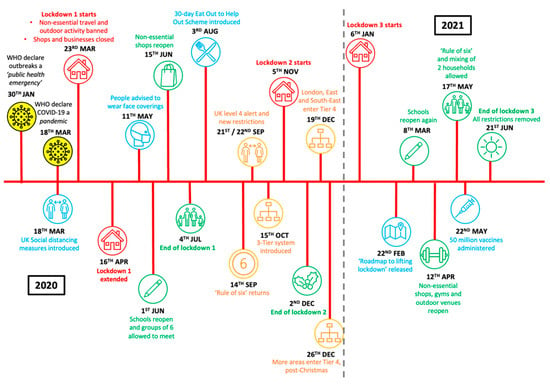
Figure 3.
Graphical representation of the timeline of the UK COVID-19 pandemic with key restrictions and events from January 2020 to June 2021.
While many studies have been conducted on the impacts of lockdown on air quality, such studies have often not considered the effects of the post-lockdown time period, or subsequent restrictions, which could potentially be of more value [7,38]. The two subsequent lockdowns began in November 2020 and January 2021, respectively; months in which NOx would typically be elevated, and O3 reduced [3,10,20]. Hence, a reduction in NOx or an increase in O3 over these months would be a stronger indication of the contribution of reduced anthropogenic activity to the observed pollutant changes. As a result, extending the analysis of pollutant concentration changes to include these subsequent lockdowns can be greatly beneficial in analysing the impact that the COVID-19 pandemic had on ambient levels of NOx, and thus on O3 production and sensitivity.
3.2. Pollutant Variations across the Site Types for 2019–2021
Considering measurement data for NO, NO2 and O3 between July 2019 and July 2021, it is clear that the responses of pollutants varied considerably depending on the site environment (Figure 3). While drastic changes were seen between pollutant concentrations in the pre- and post-lockdown time periods at urban traffic sites, rural background sites experienced only very minimal changes to pollutant concentrations, if any. Urban and suburban background and industrial sites fell between these two extremes, showing some changes in atmospheric concentrations of the three compounds. These site types recorded concentrations closer to those of rural background sites than those of urban traffic sites.
At the urban traffic sites, a reduction in NOx concentrations was observed from November 2019–April 2020. This was primarily driven by a rapid and substantial decline in NO concentrations. This corresponds to a simultaneous and similarly large increase in O3 concentrations, reaching its peak between April and May. This peak fell amid the initial lockdown restrictions, which may have been due to the typical seasonal variation of O3 rather than the impact of said restrictions—the individual influence of each was difficult to discern [4,5,9]. This was compounded by reported increases in O3 concentration as a result of NOx reduction policies as well as the unusually warm weather experienced across the restriction periods [6,7,9]. In fact, Jephcote et al. utilised meteorological measurements to demonstrate that the conditions experienced over the initial lockdown made April 2020 the fifth warmest April since 1884, as well as the sunniest April since 1929, accounting for as much as 69% of the observed changes in O3 and NOx concentrations [7].
However, observed NOx concentrations remained low at all urban sites after the initial lockdown, failing to return to the same levels that would typically be expected between November and January in 2020 [40,41]. This was particularly apparent from the urban traffic data, and is likely due to the re-implementation of restrictions later on in the year, starting from 14 September 2020 with the ‘rule of six’ (Figure 4), followed by further lockdowns in November and January 2021 [38]. As a result, there were, again, significant reductions in traffic emissions and, therefore, in NOx concentrations. As a result, urban and industrial environments, typically sitting in a VOC-limited ozone generation regime, saw elevated O3 levels persist after the initial lockdown [13]. Where the minimum monthly concentration of O3 in 2019 at urban background sites was around 3.9 × 10¹¹ molecule cm−3, 2020–2021 saw values of (5.0–5.5) × 1011 molecule cm−3; this constitutes an increase of 28–41% in minimum O3 concentration at these sites.
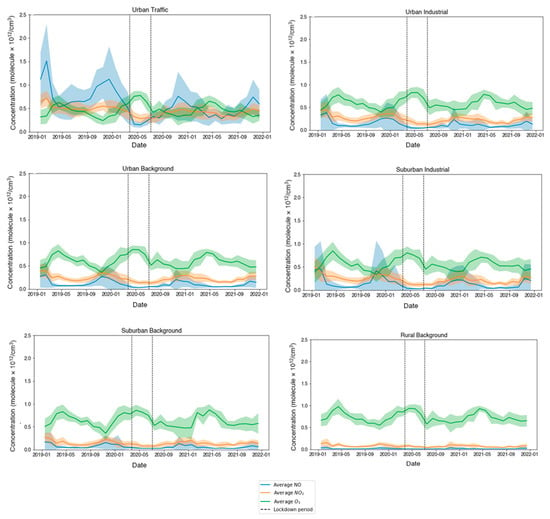
Figure 4.
Averaged monthly concentrations of NO, NO2 and O3, January 2019–December 2021 for all sites analysed, averaged by their environment type, with standard deviation represented using continuous, translucent error bars and hashed black lines indicating the first lockdown in 2020 (23 March–4 July).
Similar but less substantial increases (~5%) in minimum O3 concentrations were seen at rural background sites. However, it is possible this smaller increase could be simply accounted for by the general year-on-year increase in O3 reported since the 1990s [6,20].
3.3. Comparison of Pre-Lockdown and Lockdown Monthly Pollutant Concentrations
At urban traffic sites, seasonal variations in NOx are driven by anthropogenic activity and see depletion in summer months compared with the winter (Figure 5). Peaks in NOx concentrations occurred in November and January, in the pre-lockdown (2017) and lockdown (2020) periods, as would typically be expected due to increased fossil fuel combustion across a range of industries [41]. However, the average NO concentration in November dropped from 1.70 × 10¹² molecule cm−3 in 2017, to 0.59 × 10¹² molecule cm−3 in 2020, representing a 65% decline and demonstrating the impact of the second lockdown (5 November–2 December 2020). Similarly, over the first lockdown period (23 March–4 July 2020) NO concentrations decreased by 58–67% compared with the same months in 2017. The reductions in NO2 concentrations were smaller than those of NO, with average concentrations decreasing from 2017 by approximately 43% for November, and by 37–45% over March to June. This is consistent with values obtained by Higham et al. [33] from a study of six polluted UK cities, who determined reductions of 61% in NO and 42% in NO2 over the first lockdown, compared with averaged concentrations from 2013 to 2019. As it has been suggested that meteorology does not play a significant role in the variation of NOx concentrations, these changes are likely to be predominantly due to the substantial changes in anthropogenic activity [41,42].
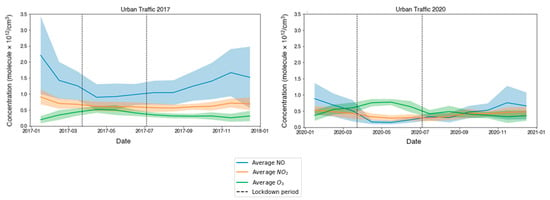
Figure 5.
Average monthly concentrations of NO, NO2 and O3 from the urban traffic sites over 2017 and 2020, represented using continuous, translucent error bars and hashed black lines indicating the lockdown period in 2020 as well as the same time period in 2017, in which there was no lockdown, for comparison.
These reductions in NOx corresponded with increases in O3 of 31% in March, 25% in April, 30% in May and 33% in June. In comparison with NO, concentrations of O3 are much more reliant on meteorological conditions and are elevated in summer months and inhibited over winter months [12,20,41]. However, if, as Jephcote et al. [7] suggest, meteorology is assumed to account for 69% of these changes in pollutant concentration, the lockdown restrictions would still have accounted for a 9% increase in O3 concentrations, compared with the same period in 2017, as well as reductions of approximately 20% in NO and 13% in NO2.
When lockdown restrictions were subsequently removed in July, the return to business-as-usual anthropogenic activity increased NOx emissions, increasing NO titration of O3. Hence, despite the heightened photochemical activity at this time of year, which would typically be expected to increase O3 levels, concentrations of O3 dropped significantly. Concentrations of O3 in July 2020 were as low as those of January 2020, indicating the significant effect of the lockdown restrictions on tropospheric pollutant concentrations, independently of meteorological effects.
Other urban site types saw similar variations in the pollutants across the considered time period, likely due to similar anthropogenic exposure profiles (Figure 6). O3 concentrations showed a decrease of 6–7% compared with pre-lockdown levels. In general, smaller changes were seen between the pre-lockdown and the lockdown period for all other site types compared with those seen at urban traffic sites. Conversely, suburban site types showed small increases in O3 (6–7%) compared with pre-lockdown levels. Given that all site types experienced an overall reduction in NO and NO2 concentrations across the period considered, this result implies that while urban sites considered operated under a NOx-limited O3 generation regime, suburban sites considered operated under a VOC-limited O3 generation regime.
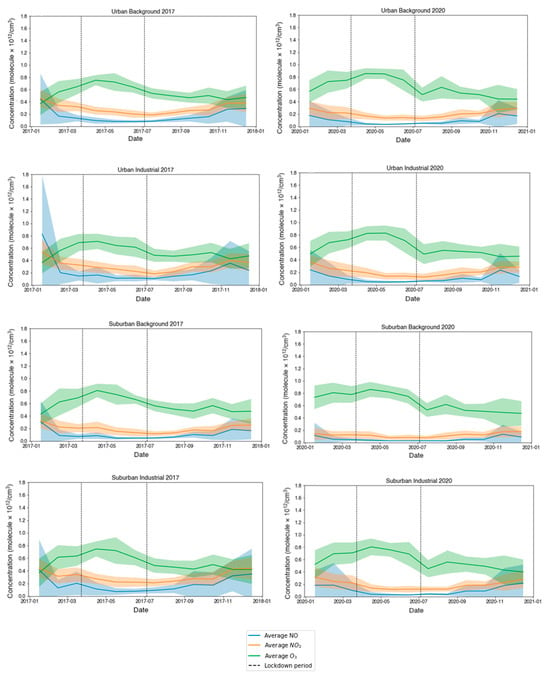
Figure 6.
Average monthly concentrations of NO, NO2 and O3 for the urban background, urban industrial, suburban background and suburban industrial sites over 2017 and 2020. Standard deviation is represented using continuous, translucent error bars and hashed black lines indicate the lockdown period in 2020 as well as the same time period in 2017, in which there was no lockdown.
Across all sites, an unusual increase in O3 concentrations was observed in August 2020. These increases are likely due to meteorology. In the first half of August 2020, a major summer heatwave took place across the UK, with temperatures exceeding 34 °C on six consecutive days and reaching a peak of 36.4 °C at Heathrow and Kew Gardens in London [43]. This escalated O3 production in August, causing the spikes in O3 seen across the board.
Rural background sites showed similar patterns to those observed elsewhere but recorded the smallest overall changes in levels of NOx and O3 in 2020, compared with pre-lockdown (Figure 7). O3 in 2020 peaked ~5.6% higher than the average peak concentrations recorded pre-lockdown. This is consistent with what we would expect, as levels of anthropogenic NOx emissions typically experienced around sites are insignificant; hence, the lockdown restrictions on human mobility and traffic would not have had a noticeable impact on these areas.
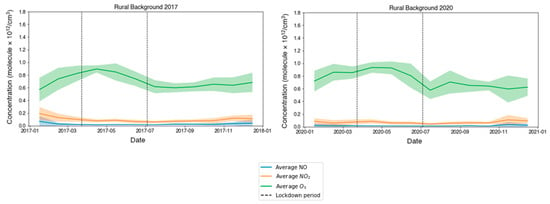
Figure 7.
Averaged monthly concentrations of NO, NO2 and O3 from the rural background sites over 2017 and 2020, with the hashed black lines indicating the lockdown period in 2020 and the same time period in 2017, in which there was no lockdown. Standard deviation is represented using continuous, translucent error bars.
3.4. O3-NOx-VOC Sensitivity
Of the sites analysed thus far, only three have sufficient data to perform O3 production sensitivity analyses: LMR (urban traffic), LE (urban background) and CO (rural background).
Urban traffic sites were most impacted by the behaviour changes enforced during the lockdowns. This was mirrored in the significant variation in pollutants seen across the periods considered. Large reductions in both NO and NO2 were seen at LMR (Figure 8a,b) with proportionately larger reductions in NO due to the influence of direct exhaust emissions at this site [41]. As a result, NO titration of O3 was substantially diminished at LMR, leading to considerable O3 elevation in 2020 compared with 2017 (Figure 8c). Measured O3 concentrations peaked in April–May 2020, during the initial lockdown. Conversely, this same period saw the lowest measured VOC concentrations, confirming the influence of NOx variation on O3 elevation [5]. Ozone concentrations peaked in April 2020, at almost double the concentrations of those in April 2017 (84% increase), corresponding to reductions of 88% and 53% reductions in NO and NO2, respectively, compared with 2017. This supports results presented by Zhang and Stevenson [5], who reported an O3 increase at the LMR site in April 2020 of 26 ppb compared with April concentrations of the previous 20 years, corresponding with a 70% decrease in NOx concentrations. The singular anomalous spike in ozone, depicted in August, was as a result of the extreme temperatures experienced across the UK during this month [43].
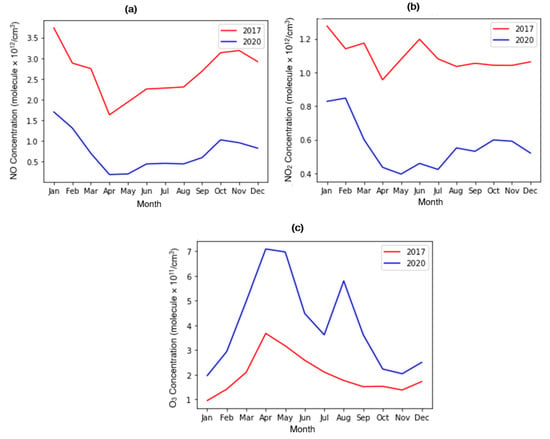
Figure 8.
Time series plots of monthly averaged concentrations for (a) NO, (b) NO2 and (c) O3 at the London Marylebone Road (LMR) air quality monitoring station, for the years 2017 and 2020.
Conversely, at urban and rural background sites (LE and CO), NO concentrations showed little variance between 2017 and 2020, though NO2 concentrations were notably lower in 2020, as was observed at LMR. Data for NO, NO2 and O3 at the urban background site (LE) were consistent with the general fluctuations in the average concentrations for the suburban background site type data presented previously (Figure 9), suggesting these site types may be comparable in some instances. At the rural background site, due to low influence of traffic emissions, it is likely these decreases in NO2 were primarily driven by national reductions as a result of policy intervention, with the COVID-19 lockdowns and meteorological variation as additional contributors [6,9].
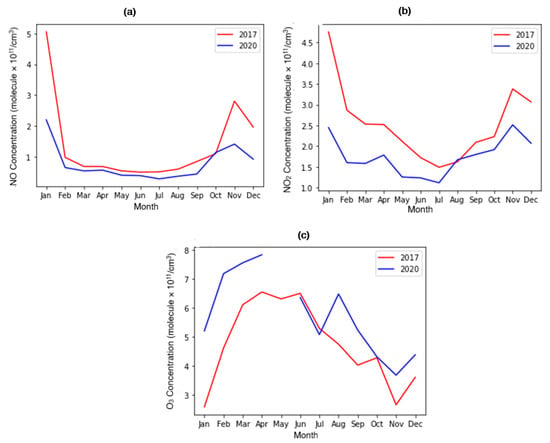
Figure 9.
Time series plots of monthly averaged concentrations for (a) NO, (b) NO2 and (c) O3 at the London Eltham (LE) air quality monitoring station, for the years 2017 and 2020.
In particular, unusually high temperatures and solar radiation experienced in 2020 are likely to have increased NO2 photodissociation, decreasing its concentration and driving an increase in O3 (Figure 10) [41,43]. NO2 concentrations generally follow the expected seasonal cycle apart from an anomalous peak in April. With the population instructed to remain at home in the unusually warm weather in April, there was a significant increase in the number of barbeques (BBQs) held across the UK, with 21 million in April alone, constituting a 391% rise in the typical number of BBQs held in April [44]. This behaviour change may have contributed to this unexpected increase in NO2. This is supported by preliminary analysis of particulate matter (PM) concentrations at this site during the same year, which also show a significant peak in April (Figure 11).
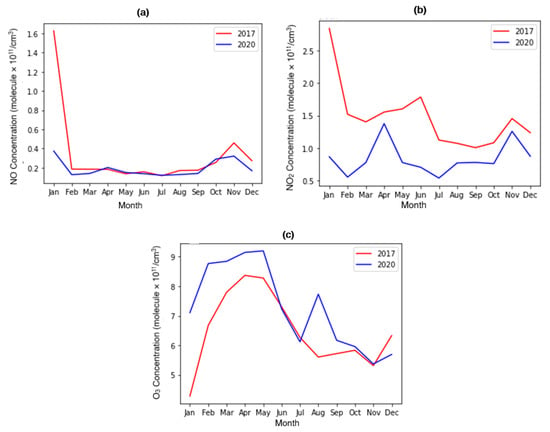
Figure 10.
Time series plots of monthly averaged concentrations for (a) NO, (b) NO2 and (c) O3 at the Chilbolton Observatory (CO) air quality monitoring station, for the years 2017 and 2020.
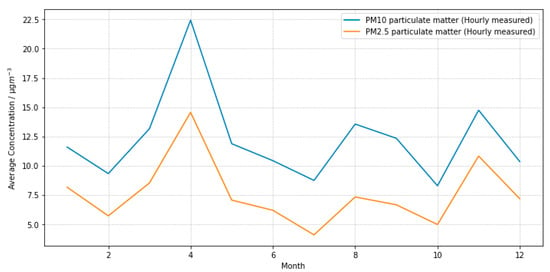
Figure 11.
Time series plots of monthly averaged concentrations for PM10 and PM2.5 at the Chilbolton Observatory (CO) air quality monitoring station for 2020.
In terms of O3 generation sensitivity, two main indicators were utilised as described previously: [VOC]/[NOx] and [NO]/[NO2]. Ozone generation regimes are typically defined by [VOC]/[NOx] ratio with values below 8 indicating a VOC-limited regime and values greater than 8 indicating a NOx-limited regime [5,13,37]. Correspondingly, increases in the [NO]/[NO2] ratio are correlated to a reduction in O3 concentrations as, typically, NO2 is associated with the formation of O3, via photodissociation, whereas NO plays a key role in ozone titration [1].
From Figure 8, Figure 9 and Figure 10, it is clear restrictions during the lockdowns had a significant impact on O3 levels. The indicators utilised suggest this was due to variation of the O3 generation regime. Prior to the pandemic, in 2017, [VOC]/[NOx] values consistently fell between 2 and 7 in a VOC-limited regime, never once exceeding the [VOC]/[NOx] ratio of ~8–10 to transition to a NOx-limited regime (Figure 12).
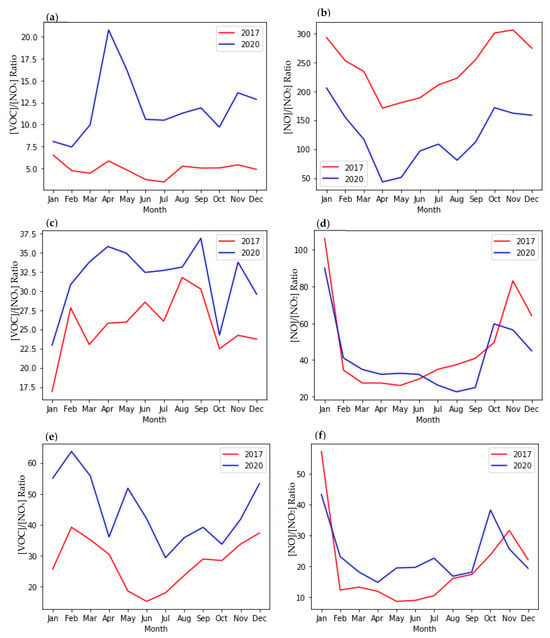
Figure 12.
Time series plots of monthly averaged VOC/NOx and [NO]/[NO2] ratios, respectively, for LMR, (a,b), LE, (c,d), and CO, (e,f), for the years 2017 and 2020.
Conversely, in 2020, a large spike in the [VOC]/[NOx] ratio occurred between March and June, peaking at over 20 in April at the height of the restrictions. This effect was also observed in Delhi by Rathod et al. [1], who determined a transition from a VOC- to a NOx-limited regime in Delhi, over their lockdown in March and April.
The [NO]/[NO2] ratio at LMR decreased substantially from 2017 to 2020, as was expected from the proportionally larger decrease in NO concentrations observed, compared with those of NO2. This is also consistent with the study of Rathod et al., where a decrease in [NO]/[NO2] was seen with indicated transition to a NOx-limited regime [1].
Once restrictions began to be relaxed in July, the [VOC]/[NOx] ratio quickly dropped back down to ratios indicative of mixed-sensitive or VOC-limited regimes at LMR, with a corresponding increase in the [NO]/[NO2] ratio. This was, however, not the case at other sites considered. The [VOC]/[NOx] ratio at LE indicates a NOx-limited O3 generation regime with values in 2017 of ~17–32. Interestingly, this is not entirely consistent with the pollutant variations presented, which show an increase of O3 with a decrease in NOx suggestive of a VOC-limited regime. This could indicate a NOx-sensitive bias of the [VOC]/[NOx] ratio or that changes in pollutant levels have an alternate explanation.
NOx-limited O3 generation regimes were also expected in rural areas due to low NOx concentrations. This is supported by analysis utilising sensitivity indicators. For 2017, the rural background site (CO) displays [VOC]/[NOx] values of ~20–40 in agreement with the current literature [10,13]. In 2020, a considerable increase in [VOC]/[NOx] ratio is seen with values ~30–65 indicating O3 formation was particularly sensitive to NOx concentrations during the lockdowns. Comparison between these years demonstrates the consistency of rural background sites; at these sites, the best way to control O3 pollution is reduction of NOx.
A reasonable availability of NOx and O3 data across the UK AQMS can give an extensive analysis of ozone’s response to changes in NOx concentrations. However, the study of the analysis of ozone sensitivity changes with VOCs is limited due to insubstantial quantities of VOC data, which are only available at three of the four automatic hydrocarbon network sites. These sites, in turn, represent only 4 of the 170 total AQMSs and only three of the six different environment types. The sites with specific environments also had limited data, with suburban industrial, suburban background, urban industrial and urban traffic lacking substantial data and representing only one, three, three, and three sites, respectively.
3.5. Oxidant (OX) Partitioning
In the UK, the photochemical ozone production timescale is of the order of 2 to 10 h. Given this short timescale, variation seen in O3 levels is unlikely to be as a result of the variation in the O3 generation regime, despite what is indicated by common metrics. This is especially true at LMR, where the transport time of pollutants from the road to the monitor station is likely on the order of seconds. While the indicators utilised would suggest variation in the photochemical regime, there is an alternate explanation in oxidant partitioning.
Rapid partitioning between NO, NO2 and O3 conserve NOx and OX (O3 + NO2) on timescales of seconds to minutes, so can better account for the changes seen during the lockdown period. As NOx levels increase, O3 levels drop towards zero. Conversely, as NOx decreases, O3 levels increase to a maximum approximately equivalent to background O3 levels. These variations result in shifting of the dominance of one oxidant over the other while conserving overall OX levels. For example, as NOx decreases, oxidant partitioning shifts to O3 dominance. Generally, O3 is imported into the centre of London by winds that are south-westerly to north-westerly in the winter and early spring, respectively. As a result, good agreement is seen between maximum O3 measurement at LMR and the background concentrations measured at Mace Head, Ireland during the pre-lockdown period (Figure 13). Accordingly, at LMR, with increasing NOx, O3 declines quickly from levels comparable with the Mace Head baseline towards zero. This is due to the rapid reaction between O3 and NO from local traffic; NO emissions from traffic pollution readily overwhelm the transported O3 baseline source.
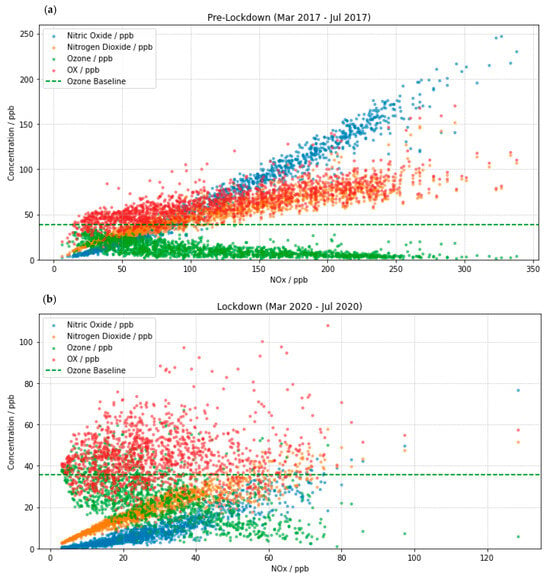
Figure 13.
Scatter plot of nitric oxide, nitrogen dioxide, ozone and OX concentrations (in ppb) against NOx concentrations for (a) the time period covering the initial UK lockdown (March–July) in 2017, representing a pre-lockdown period, and (b) data collected during the initial UK lockdown in 2020. Green dashed line on each plot indicates the O3 baseline for the time period calculated as an average of O3 collected from Mace Head, Ireland.
The additional source of oxidants at LMR is the direct emission of NO2 from diesel-engine motor vehicles. Specifically, diesel-engine buses are a major source of directly emitted NO2 at LMR. The new Transport for London (TfL) buses have particle traps where combustion conditions are adjusted to oxidise trapped carbon [45]. This results in NO2 formation in the engine with the excess exhausted into the roadway. During the pre-lockdown period, OX increases with increasing NOx with ~20% of local NOx emissions emitted as NO2. This remains the case during the lockdown period.
During lockdown, some similarities are seen between pollutant variation along with some significant differences. The first major difference is the range of NOx concentration measured with lower maximums of ~120 ppb during lockdown as opposed to maximums of ~250 ppb in the pre-lockdown period. This is clearly attributable to the much-reduced traffic flow at LMR during this period. The second major difference is the considerable scatter in the measured O3 concentration during lockdown compared with the pre-lockdown period. Furthermore, O3 and OX levels during the lockdown period do not agree with the O3 baseline from Mace Head, providing a third major difference.
Despite the huge reduction in NOx during the lockdown period, the NO2/NOx fraction remains comparable (Figure 14). For O3, we see the same behaviour as that in pre-lockdown, where O3 decreases with increasing NOx. However, O3 during the lockdown period was highly variable and shows a large amount of scatter. This is possibly due to the photochemical O3 formation in the south-east region surrounding LMR. This suggests that, despite removing overt photochemical episode days from the data (where O3 < 50 ppb at nearby background site, St Osyth, Appendix B), photochemical production of O3 was still influencing the measurements taken at LMR to varying extents. Almost all wind directions would transport some photochemically generated O3 but would be highly variable depending on relevant precursor emission sources. Despite variation, there is still some overlap in O3 levels during both time periods considered.
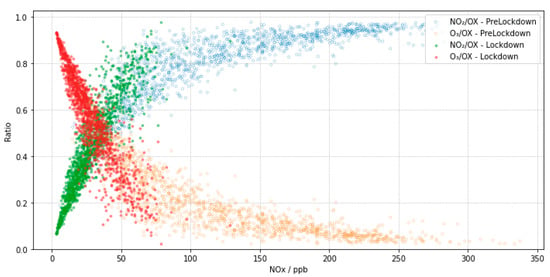
Figure 14.
Scatter plot of NO2/OX and O3/OX concentration ratios across the time period covering the initial UK lockdown (March–July) in 2017, representing a pre-lockdown period, and during the actual lockdown in 2020.
Additionally, with local VOC sources, it is conceivable that there may be local photochemical O3 sources too, hence the variability in the O3 levels. For example, biogenic sources could include isoprene from nearby Regent’s Park, though road traffic has been shown to have a notable influence on isoprene emissions in this area too [46]. However, given the very short time between the emission and measurement of VOCs at LMR (given the proximity of the sensor to the road), it is more likely that heighted O3 during this time was due to an increase in transported O3. During the lockdown period in the UK, a higher European O3 baseline was reported [47]. Pollutants, either O3 itself or long-lived VOCs that act as O3 precursors, transported from the continent may have had an impact on the measured O3 concentrations. Average meteorological footprints generated utilising NAME, an atmospheric dispersion model, for February–October 2020, show notable transport from the continent during this period (see Appendix C, Figure A1).
At LMR, NO2 levels decreased during the lockdown due to reduced traffic and a corresponding rise in O3 levels is seen. However, total OX was roughly conserved. So rather than an increase in O3 production due to a shift in photochemical production, rising levels are more likely to be a result of shifting oxidant partitioning as a result of NOx decrease. However, it remains difficult to entirely rule out the influence of locally generated and/or transported photochemical O3 to O3 measured at LMR during the lockdown period. O3 concentrations measured at LMR during the lockdown period do appear to exceed the baseline O3 concentrations recorded at Mace Head to a much greater extent compared with those of the pre-lockdown period. Furthermore, if there was an increase in locally generated O3 it is difficult to confidently ascertain whether that was due to shifts in photochemical O3 generation regime, as suggested by commonly used metrics.
In summary, the decreases in NOx concentrations at urban traffic, suburban background and suburban industrial environments increased surface O3, instead of reducing it, suggesting these all operate under VOC-limited O3 generation regimes. NOx emission reductions alone are, therefore, not an effective solution for universally reducing pollution levels. Reductions of NO and NO2 are still important to reduce NOx pollution itself but, at VOC-limited sites, it is more important to reduce emissions of the key VOCs contributing to ozone formation, such as ethene, propene, m + p-xylene, toluene, isopentane, n-butane, o-xylene and iso-butane [5,25,48]. This avoids escalating levels of harmful tropospheric O3, which not only has negative health impacts but also contributes to global warming. Although meteorology has been suggested to account for around 69% of these increases in ozone [7], due to unusually elevated temperatures and solar radiation over the initial lockdown, an increase from 2017 of around 9% in ozone at urban traffic sites is still unaccounted for in the data analysed. Hence, reductions in anthropogenic emissions over the COVID-19 pandemic played a significant role in increased O3 concentrations, regardless of the conditions. Increases in O3 observed at the VOC-limited sites were also consistent with the observed decreases in the [NO]/[NO2] ratios at these sites during the COVID-19 lockdowns. Decreased [NO]/[NO2] ratios typically correspond to increased levels of ambient O3, as the removal of O3 by NO titration is reduced compared with the production of O3 by NO2 photodissociation. This was facilitated by the large reductions in traffic emissions, as vehicle NOx emissions from combustion are predominantly in the form of NO. The environments that displayed NOx-limited sensitivity, such as the rural background and urban background sites, comparatively witnessed a larger reduction in NO2 than NO, increasing the [NO]/[NO2] ratio slightly. [VOC]/[NOx] ratios, on the other hand, increased significantly across the board as a result of the pandemic restrictions, with all sites becoming more NOx-limited over the lockdowns. London Marylebone Road transitioned from a VOC- to a NOx-limited regime during this time but, once restrictions were released, it quickly transitioned back to a VOC-limited O3 generation regime, according to this indicator. Hence, short periods of strict NOx reductions are not sufficient to convert VOC-sensitive areas to NOx-limited regimes indefinitely.
4. Conclusions
During the UK COVID-19 lockdowns, urban traffic sites saw drastic variation in pollutant concentration while rural background sites experienced small variations. For both lockdowns experienced in 2020, changes in concentrations of approximately 63%, 42% and 30% for NO, NO2 and O3, respectively, were recorded across the urban traffic sites when compared with pre-lockdown levels. Understanding the response of O3 production to these precursors is vital in the effective implementation of pollution reduction policies, as misinterpreting their roles in O3 formation under different environments can lead to increased pollution levels. The investigation of O3 concentration response with [NO]/[NO2] and [VOC]/[NOx] showed good agreement with O3-NOx-VOC relationships across UK sites. However, the [VOC]/[NOx] ratio may have a slight NOx-sensitive bias, as the values obtained for the London Eltham site suggested that it was NOx-sensitive, while the pollutant concentrations, in contrast, displayed a VOC-sensitive O3 response. Analysis of OX variation at LMR across the same period provides an alternate explanation for O3 increases relating to shifting atmospheric equilibrium in place of increased O3 production. However, it is difficult to reconcile all the data to either one of these conclusions. It is likely the majority of the O3 increase during the lockdown was due to a combination of meteorological influence, as discussed, along with OX partitioning shifts with a small influence of shifting O3 generation regime resulting in increased local O3 generation. However, the results discussed here must be considered with caution due to poor coverage of relevant VOCs by the current monitoring system and also the very limited number of monitoring sites in specific environmental types used in the analysis.
Author Contributions
R.H., E.S. and K.S. investigated the data; R.H. and K.S. wrote the paper; R.H., D.E.S. and M.A.H.K. conceived and designed the project; D.E.S., M.A.H.K., E.S. and R.G.D. reviewed and edited the manuscript. All authors have read and agreed to the published version of the manuscript.
Funding
We thank Bristol ChemLabS and the Primary Science Teaching Trust under whose auspices various aspects of this work were supported.
Institutional Review Board Statement
Not applicable.
Informed Consent Statement
Not applicable.
Data Availability Statement
Publicly available datasets were analyzed in this study. This data can be found here: https://uk-air.defra.gov.uk/data (accessed on 4 April 2024).
Acknowledgments
We thank the Department for Environment, Food and Rural Affairs (Defra) for supporting UK monitoring network data.
Conflicts of Interest
Author Richard G. Derwent was employed by the company Rdscientific. The remaining authors declare that the research was conducted in the absence of any commercial or financial relationships that could be construed as a potential conflict of interest.
Appendix A

Table A1.
The number of individual sites used in the data analysis for different environment types.
Table A1.
The number of individual sites used in the data analysis for different environment types.
| Environment Type | Environment Type Description | No of Individual Sites |
|---|---|---|
| Urban background | Continuously built-up urban area where the pollution level is not influenced significantly by any single source | 38 |
| Urban traffic | Continuously built-up urban area where the pollution level is influenced by the emissions from nearby traffic | 3 |
| Urban industrial | Continuously built-up urban area where the pollution level is influenced predominantly by emissions from industrial sources | 3 |
| Suburban background | Largely built-up urban area where the pollution level is not influenced significantly by any single source | 3 |
| Suburban industrial | Largely built-up urban area where the pollution level is influenced predominantly by emissions from industrial sources | 1 |
| Rural background | Rural area with natural ecosystems, forest or crops where the area is not influenced by any single source. | 12 |

Table A2.
Sixteen volatile organic compound (VOC) pollutants analysed in this study and the percentage data coverage at the three sites for which there was sufficient VOC data availability (Chilbolton Observatory, rural background; London Eltham, suburban background; London Marylebone Road, urban traffic). The colours represent sufficient data coverage (green; >70%), intermediate data coverage (orange; 50–70%) and insufficient data coverage (red; <50%), respectively [5,48].
| Pollutants | Chilbolton Observatory (CO) | London Eltham (LE) | London Marylebone Road (LMR) |
|---|---|---|---|
| Propane | 82.6 | 84.0 | 79.5 |
| Iso-butane | 82.8 | 84.0 | 79.7 |
| n-Butane | 82.8 | 84.0 | 79.7 |
| Iso-pentane | 79.1 | 83.4 | 78.4 |
| n-Pentane | 82.7 | 84.0 | 79.8 |
| Ethene | 85.9 | 87.5 | 85.9 |
| Propene | 85.1 | 88.7 | 85.0 |
| 1-Butene | 82.8 | 84.0 | 79.8 |
| 1-Pentene | 73.7 | 90.4 | 70.5 |
| Isoprene | 77.7 | 79.6 | 67.5 |
| Benzene | 51.7 | 82.2 | 74.5 |
| Toluene | 82.0 | 83.8 | 74.5 |
| Ethylbenzene | 80.6 | 79.6 | 73.2 |
| m + p-Xylene | 78.5 | 82.0 | 73.6 |
| o-Xylene | 80.5 | 83.2 | 75.2 |
| 1,2,4-Trimethylbenzene | 71.6 | 83.3 | 68.2 |
Appendix B
Daylight hours were defined according to average sunrise and sunset times for London extracted from worlddata.info [49].
Photochemical episode days were defined as days where O3 concentrations approached or exceeded 50 ppb at a nearby background site, St Osyth. These days were as followed: 30 March; 16, 28, 30 April; 3, 24, 28, 31 May; 1, 2, 3, 6, 9, 16 June; and 2 July [34].
Appendix C
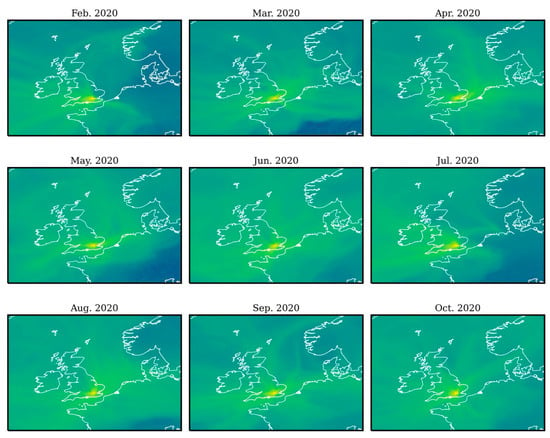
Figure A1.
Monthly average NAME footprints for February–October 2020.
References
- Rathod, A.; Sahu, S.; Singh, S.; Beig, G. Anomalous behaviour of ozone under COVID-19 and explicit diagnosis of O3-NOx-VOCs mechanism. Heliyon 2021, 7, e06142. [Google Scholar] [CrossRef]
- World Health Organisation. WHO Coronavirus (COVID-19) Dashboard. Available online: https://covid19.who.int (accessed on 18 February 2023).
- Sherrington, A. 2 Years of COVID-19. Available online: https://gds.blog.gov.uk/2022/07/25/2-years-of-covid-19-on-gov-uk/ (accessed on 18 February 2023).
- Wyche, K.P.; Nichols, M.; Parfitt, H.; Beckett, P.; Gregg, D.J.; Smallbone, K.L.; Monks, P.S. Changes in ambient air quality and atmospheric composition and reactivity in the South East of the UK as a result of the COVID-19 lockdown. Sci. Total Environ. 2020, 755, 142526. [Google Scholar] [CrossRef]
- Zhang, C.Y.; Stevenson, D. Characteristic changes of ozone and its precursors in London during COVID-19 lockdown and the ozone surge reason analysis. Atmos. Environ. 2022, 273, 118980. [Google Scholar] [CrossRef]
- Kroll, J.H.; Heald, C.L.; Cappa, C.D.; Farmer, D.K.; Fry, J.L.; Murphy, J.G.; Steiner, A.L. The complex chemical effects of COVID-19 shutdowns on air quality. Nat. Chem. 2020, 12, 777–779. [Google Scholar] [CrossRef]
- Jephcote, C.; Hansell, A.L.; Adams, K.; Gulliver, J. Changes in air quality during COVID-19 ‘lockdown’ in the United Kingdom. Environ. Pollut. 2020, 272, 116011. [Google Scholar] [CrossRef]
- Le Quéré, C.; Jackson, R.B.; Jones, M.W.; Smith, A.J.P.; Abernethy, S.; Andrew, R.M.; De-Gol, A.J.; Willis, D.R.; Shan, Y.L.; Canadell, O.S.; et al. Temporary reduction in daily global CO emissions during the COVID-19 forced confinement. Nat. Clim. Chang. 2020, 10, 647–653. [Google Scholar] [CrossRef]
- Department for Environment Food and Rural Affairs. Air Quality Statistics in the UK 1987 to 2021. Available online: https://www.gov.uk/government/statistics/air-quality-statistics (accessed on 11 February 2023).
- Liu, C.; Shi, K. A review on methodology in O3-NOx-VOC sensitivity study. Environ. Pollut. 2021, 291, 118249. [Google Scholar] [CrossRef]
- Liu, Z.Z.; Doherty, R.M.; Wild, O.; O’Connor, F.M.; Turnock, S.T. Correcting ozone biases in a global chemistry-climate model: Implications for future ozone. Atmos. Chem. Phys. 2022, 22, 12543–12557. [Google Scholar] [CrossRef]
- Lu, X.; Zhang, L.; Shen, L. Air Pollution Affects Climate. In Air Pollution, Climate, and Health: An Integrated Perspective on Their Interactions; Gao, M., Wang, Z., Carmichael, G., Eds.; Elsevier: Amsterdam, The Netherlands, 2021; pp. 15–46. [Google Scholar]
- Sillman, S. Tropospheric Ozone and Photochemical Smog. Treatise Geochem. 2003, 9, 612. [Google Scholar] [CrossRef]
- Jenkin, M.E.; Clemitshaw, K.C. Ozone and other secondary photochemical pollutants: Chemical processes governing their formation in the planetary boundary layer. Atmos. Environ. 2000, 34, 2499–2527. [Google Scholar] [CrossRef]
- Gligorovski, S.; Strekowski, R.; Barbati, S.; Vione, D. Environmental Implications of Hydroxyl Radicals (•OH). Chem. Rev. 2015, 115, 13051–13092. [Google Scholar] [CrossRef]
- Brune, W.H.; Baier, B.C.; Thomas, J.; Ren, X.; Cohen, R.C.; Pusede, S.E.; Browne, E.C.; Goldstein, A.H.; Gentner, D.R.; Keutsch, F.N.; et al. Ozone production chemistry in the presence of urban plumes. Faraday Discuss. 2016, 189, 169–189. [Google Scholar] [CrossRef] [PubMed]
- United Kingdom National Air Pollution Control Programme. Available online: https://assets.publishing.service.gov.uk/media/63e508428fa8f50509bdd926/Revised_National_Air_Pollution_Control_Programme__NAPCP_.pdf (accessed on 31 January 2024).
- Akimoto, H.; Tanimoto, H. Rethinking of the adverse effects of NO-control on the reduction of methane and tropospheric ozone —Challenges toward a denitrified society. Atmos. Environ. 2022, 277, 119033. [Google Scholar] [CrossRef]
- Council, N.R. Rethinking the Ozone Problem in Urban and Regional Air Pollution; National Academies Press: Washington, DC, USA, 1992. [Google Scholar]
- Ebi, K.L.; McGregor, G. Climate Change, Tropospheric Ozone and Particulate Matter, and Health Impacts. Environ. Health Perspect. 2008, 116, 1449–1455. [Google Scholar] [CrossRef]
- Parker, J.D.; Akinbami, L.J.; Woodruff, T.J. Air Pollution and Childhood Respiratory Allergies in the United States. Environ. Health Perspect. 2009, 117, 140–147. [Google Scholar] [CrossRef]
- Jerrett, M.; Burnett, R.T.; Pope, C.A.; Ito, K.; Thurston, G.; Krewski, D.; Shi, Y.L.; Calle, E.; Thun, M. Long-Term Ozone Exposure and Mortality. N. Engl. J. Med. 2009, 360, 1085–1095. [Google Scholar] [CrossRef]
- American Lung Association. Ozone. Available online: https://www.lung.org/clean-air/outdoors/what-makes-air-unhealthy/ozone (accessed on 16 February 2023).
- Di, Q.; Dai, L.Z.; Wang, Y.; Zanobetti, A.; Choirat, C.; Schwartz, J.D.; Dominici, F. Association of Short-term Exposure to Air Pollution With Mortality in Older Adults. JAMA 2017, 318, 2446–2456. [Google Scholar] [CrossRef] [PubMed]
- Holland, R.; Khan, A.H.; Derwent, R.G.; Lynch, J.; Ahmed, F.; Grace, S.; Bacak, A.; Shallcross, D.E. Gas-phase kinetics, POCPs, and an investigation of the contributions of VOCs to urban ozone production in the UK. Int. J. Chem. Kinet. 2023, 55, 350–364. [Google Scholar] [CrossRef]
- Miyazaki, K.; Bowman, K.; Sekiya, T.; Jiang, Z.; Chen, X.; Eskes, H.; Ru, M.; Zhang, Y.; Shindell, D. Air Quality Response in China Linked to the 2019 Novel Coronavirus (COVID-19) Lockdown. Geophys. Res. Lett. 2020, 47, e2020GL089252. [Google Scholar] [CrossRef]
- Cooper, M.J.; Martin, R.V.; Hammer, M.S.; Levelt, P.F.; Veefkind, P.; Lamsal, L.N.; Krotkov, N.A.; Brook, J.R.; McLinden, C.A. Global fine-scale changes in ambient NO2 during COVID-19 lockdowns. Nature 2022, 601, 380–387. [Google Scholar] [CrossRef]
- Sharma, S.; Zhang, M.; Gao, J.; Zhang, H.; Kota, S.H. Effect of restricted emissions during COVID-19 on air quality in India. Sci. Total Environ. 2020, 728, 138878. [Google Scholar] [CrossRef] [PubMed]
- Baldasano, J.M. COVID-19 lockdown effects on air quality by NO2 in the cities of Barcelona and Madrid (Spain). Sci. Total Environ. 2020, 741, 140353. [Google Scholar] [CrossRef] [PubMed]
- Sicard, P.; De Marco, A.; Agathokleous, E.; Feng, Z.Z.; Xu, X.B.; Paoletti, E.; Rodriguez, J.J.D.; Calatayud, V. Ampli fied ozone pollution in cities during the COVID-19 lockdown. Sci. Total Environ. 2020, 735, 139542. [Google Scholar] [CrossRef] [PubMed]
- Munir, S.; Luo, Z.W.; Dixon, T. Comparing different approaches for assessing the impact of COVID-19 lockdown on urban air quality in Reading, UK. Atmos. Res. 2021, 261, 105730. [Google Scholar] [CrossRef] [PubMed]
- Wijnands, J.S.; Nice, K.A.; Seneviratne, S.; Thompson, J.; Stevenson, M. The impact of the COVID-19 pandemic on air pollution: A global assessment using machine learning techniques. Atmos. Pollut. Res. 2022, 13, 101438. [Google Scholar] [CrossRef] [PubMed]
- Higham, J.; Ramírez, C.A.; Green, M.; Morse, A. UK COVID-19 lockdown: 100 days of air pollution reduction? Air Qual. Atmos. Health 2021, 14, 325–332. [Google Scholar] [CrossRef] [PubMed]
- Department for Environment Food and Rural Affairs. Automatic Urban and Rural Monitoring Network (AURN). Available online: https://uk-air.defra.gov.uk/networks/network-info?view=aurn (accessed on 8 March 2023).
- Department for Environment Food and Rural Affairs. Site Environment Types. Available online: https://uk-air.defra.gov.uk/networks/site-types (accessed on 24 April 2024).
- Department for Environment Food and Rural Affairs. Automatic Hydrocarbon Network. Available online: https://uk-air.defra.gov.uk/networks/network-info?view=hc (accessed on 8 March 2023).
- Zou, Y.; Deng, X.J.; Zhu, D.; Gong, D.C.; Wang, H.; Li, F.; Tan, H.B.; Deng, T.; Mai, B.R.; Liu, X.T.; et al. Characteristics of 1 year of observational data of VOCs, NOX and O3 at a suburban site in Guangzhou, China. Atmos. Chem. Phys. 2015, 15, 6625–6636. [Google Scholar] [CrossRef]
- Acosta-Ramírez, C.; Higham, J.E. Impact of SARS-CoV-2 variants on mobility and air pollution in the United Kingdom. Sci. Total Environ. 2022, 851, 158279. [Google Scholar] [CrossRef] [PubMed]
- Lee, J.D.; Drysdale, W.S.; Finch, D.P.; Wilde, S.E.; Palmer, P.I. UK surface NO2 levels dropped by 42% during the COVID-19 lockdown: Impact on surface O3. Atmos. Chem. Phys. 2020, 20, 15743–15759. [Google Scholar] [CrossRef]
- Kalbarczyk, R.; Kalbarczyk, E. Meteorological conditions of the winter-time distribution of nitrogen oxides in Poznan: A proposal for a catalog of the pollutants variation. Urban Clim. 2020, 33, 100649. [Google Scholar] [CrossRef]
- Roberts-Semple, D.; Song, F.; Gao, Y. Seasonal characteristics of ambient nitrogen oxides and ground-level ozone in metropolitan northeastern New Jersey. Atmos. Pollut. Res. 2012, 3, 247–257. [Google Scholar] [CrossRef]
- US Environmental Protection Agency. Nitrogen Oxides (NOx), Why and How They Are Controlled. Available online: https://www3.epa.gov/ttncatc1/dir1/fnoxdoc.pdf (accessed on 15 March 2023).
- Met Office UK. A Look Back at the Weather and Climate in 2020. Available online: https://www.metoffice.gov.uk/about-us/press-office/news/weather-and-climate/2020/2020-round-up (accessed on 16 March 2023).
- Agriculture and Horticulture Development Board. 2020: A BBQ Summer Link No Other. Available online: https://ahdb.org.uk/news/consumer-insight-2020-a-bbq-summer-like-no-other (accessed on 17 March 2023).
- Transport for London. London Low Emission Zone Impacts Monitoring Baseline Report, July 2008; Transport for London: London, UK, 2008.
- Khan, M.A.H.; Schlich, B.-L.; Jenkin, M.E.; Shallcross, B.M.; Moseley, K.; Walker, C.; Morris, W.C.; Derwent, R.G.; Percival, C.J.; Shallcross, D.E. A two-decade anthropogenic and biogenic isoprene emissions study in a London urban background and a London urban traffic site. Atmosphere 2018, 9, 387. [Google Scholar] [CrossRef]
- European Environment Agency. Air Quality e-Reporting (AQ e-Reporting). Available online: https://www.eea.europa.eu/en/datahub/datahubitem-view/3b390c9c-f321-490a-b25a-ae93b2ed80c1 (accessed on 4 April 2024).
- Xue, Y.G.; Ho, S.S.H.; Huang, Y.; Li, B.W.; Wang, L.Q.; Dai, W.T.; Cao, J.J.; Lee, S.C. Source apportionment of VOCs and their impacts on surface ozone in an industry city of Baoji, Northwestern China. Sci. Rep. 2017, 7, 9979. [Google Scholar] [CrossRef] [PubMed]
- Times for Sunrise and Sunset in the United Kingdom. Available online: https://www.worlddata.info/europe/united-kingdom/sunset.php (accessed on 30 January 2024).
Disclaimer/Publisher’s Note: The statements, opinions and data contained in all publications are solely those of the individual author(s) and contributor(s) and not of MDPI and/or the editor(s). MDPI and/or the editor(s) disclaim responsibility for any injury to people or property resulting from any ideas, methods, instructions or products referred to in the content. |
© 2024 by the authors. Licensee MDPI, Basel, Switzerland. This article is an open access article distributed under the terms and conditions of the Creative Commons Attribution (CC BY) license (https://creativecommons.org/licenses/by/4.0/).