Article

Investigation of Temperature, Precipitation, Evapotranspiration, and New Thornthwaite Climate Classification in Thailand

by
Nutthakarn Phumkokrux
1,2,* and
Panu Trivej
1,*
1
Department of Earth Sciences, Faculty of Science, Kasetsart University, Bangkok 10900, Thailand
2
Department of Geography, Faculty of Education, Ramkhamhaeng University, Bangkok 10240, Thailand
*
Authors to whom correspondence should be addressed.
Atmosphere 2024, 15(3), 379; https://doi.org/10.3390/atmos15030379
Submission received: 5 February 2024 / Revised: 25 February 2024 / Accepted: 29 February 2024 / Published: 20 March 2024
(This article belongs to the Section Climatology)

Abstract

:
This study aims (1) to study the trend and characteristics of average annual air temperature (Tann), annual precipitation (Prann), and annual evapotranspiration (PETann) in Thailand over the present period (1987–2021) and (2) to extract the climate pattern in form of a map using the New Thornthwaite Climate Classification method in Thailand considering the present period. The data were prepared by the Thai Meteorological Department. Data variability, the mean of the data calculation in time series, the homogeneity test of data, and abrupt changes were examined. The trends of each variable were calculated using the Mann–Kendal and Sen’s slope test. The results indicated that the high Tann found in Bangkok gradually decreased in the next area. Tann data were heterogeneous with the abrupt change period, and increasing trends were found. Prann values were high in the west side of the southern area and the bottom area of the eastern area; in addition, low rainfall was found in the inner area of the land. Prann data were homogenous with no abrupt change period and slight changes in trends. PETann and %CV spatial distribution were determined for the same pattern of Tann. PETann data were heterogeneous with abrupt change periods and rising trends. The torrid thermal index determined based on the New Thornthwaite Climate Classification results indicated an overall torrid-type climate. A semi-arid climate pattern was found in the small area of the middle of Thailand, and then it shifted toward a moist-type pattern in the next area with an in precipitation. The most climate variability was found to be extreme with the power of temperature changes.

1. Introduction

Global warming and climate change are urgent issues that all sectors should aim to address. From the First Industrial Revolution in 1760 to the Third Industrial Revolution in 1960, which began with steam and internal combustion engine inventions, including trains, cars, planes, and motorbikes, leading to the use of coal and other fossil fuels becoming major energy sources and the generation of electricity [1,2]. This revolution resulted in an increase in greenhouse gases from about 280 parts per million to 414 parts per million [3], as well as the occurrence of deforestation during the Industrial Revolution [4]. The climate change problem is caused by the increase in carbon dioxide (CO2), which can be absorbed and transferred to the atmosphere, ocean, land, and biosphere for decades [5,6,7,8,9,10]. CO2 increases air temperatures and causes the occurrence of abnormal precipitation year by year. This has led to an increase in world temperature up to 1 degree Celsius in the last 150 years, as well as abnormal temperatures in the ocean [6]. Moreover, the climate is varied by latitude, longitude, and altitude, which determine climate characteristics [11,12] and make the ecosystem in each area unique [13]. Wet areas tend to become wetter and dry areas tend to become drier, coincident with an overall intensification in the hydrological cycle in response to global warming, as reported by Walsh et al. (2014) [14].
Thailand is one of the countries in Indochina, located at the lower latitude of the Pacific Ocean in Southeast Asia. There is some evidence pointing to abnormal climate patterns in Thailand; for instance, the mean maximum temperature has particularly increased in summer (February to May), and the total rainfall intensity has also increased, while the number of rainfall days has decreased [15,16,17]; thus, drought has become more intense [18].
Climate classifications have been used to describe climate characteristics and conditions to have a clear understanding of how climate is changed in each area. There are many types of climate classifications such as Köppen, which is widely used worldwide, including in Thailand, with only temperature and precipitation [19,20,21], and Thornthwaite (1954) [22,23], which is less used due to its complex processes. However, evapotranspiration is also important for water balance investigation considering plant and agricultural activities [24,25]. Recent scientific approaches have proven that correctly identifying the evapotranspiration pattern highly influences the climate zone characterization. Also, the classification scheme may also affect the final results [26]. The Thornthwaite Climate Classification (THC) is a worldwide well-known system, and many scholars have sought to modify its components for global use due to its extensive usage [27,28]. Moreover, the THC is appropriate for classifying climate characteristics and conditions in seasonal and annual periods, which have more impact on plant and agricultural activities under moisture indices [22] and water balance metrics in level class patterns [23,29].
Considering the above, the author aimed to (1) study the trend and characteristics of monthly air temperature, monthly precipitation, and evapotranspiration (PET) in Thailand over the recent period (1987–2021) and (2) create a climate pattern map using the new Thornthwaite Climate Classification in Thailand of the recent period. This work can provide clear evidence about climate change for policy planning at the local and national scales. Moreover, the author strongly believes that the knowledge from this work could be adapted to countries in tropical areas using the simple method provided by the New Thornthwaite Climate Classification.

2. Study Boundary

The study area and its features are presented in Figure 1 and Table 1. Thailand is located in the central region of Southeast Asia, between 5°37′ N and 20°37′ N latitude and 97°22′ E and 105°37′ E longitude [29]. It is surrounded by Myanmar, Laos, Cambodia, and Malaysia on the west side, east side, southeast side, and south side, respectively. Thailand is about 517,624 km2 in area, covering 77 provinces [30], with altitudes at approximately −77 to 2565 m above the sea level (MASL.) [31]. The average annual temperature is about 20–30 °C, and the average total annual rainfall is 2000–2500 mm, varying by different topography features [18,32]. Northern and western parts have notable topography, with high mountains alternating with valleys (North to South direction), and the highest altitude and the lowest average temperature are found in these areas. The northeastern part is the largest area with sandstone plateaus considered its distinguished characteristic and meteorological drought is frequent in this area [18,32]. The outstanding feature of the central region is flood plains, and the bottom region connects to the Gulf of Thailand. The highest average annual temperature is also found in this area, especially in Bangkok and its surrounding area, becoming cooler further away from this region. The eastern area (connecting to the Gulf of Thailand) and the western area of the South Peninsular (connecting to the Andaman Sea) until the bottom side have undulating plains as their remarkable feature. The highest rainfall also occurs in these areas due to the southwest monsoon [21,32]. Moreover, the east coast of the South Peninsular is similar to its western area but is affected by the northeast monsoon, leading to high rainfall in the winter. Moreover, 104 meteorological stations were chosen in this study, covering all of Thailand area. Furthermore, the seasons of Thailand were divided according to the Thai Meteorological Department into 3 seasons: summer (February to May), rainy (June to September), and winter (October to the January of next year) [32].

3. Data and Meteorology

3.1. Trend and Characteristics of Monthly Air Temperature, Monthly Precipitation, and Evapotranspiration (PET) in Thailand

Climate parameters which were necessary for Thornthwaite Climate Classification to classify the climate types of each area were mean monthly temperature (°C) and total monthly precipitation (mm) of the present period (1987 to 2021). These data were gathered from 104 meteorological stations, which were prepared by the Southeast Asia Meteorological Telecommunication Centre, Thai Meteorological Department, over Thailand, covering five meteorological regions as presented in Figure 1a and Table 1.

3.1.1. Data Variability

Temperature and precipitation data of 1987 to 2021 required checking for precision by the coefficient of variation (CV) method, with a process from the normal distribution, calculated as Equation (1) [31,33]. The high value refers to a large distribution, and thus, an acceptable value should not be higher than 30%; however, if not, the data are not suitable for the study [34,35].
C V = 100 × σ Y ¯
where σ is the standard deviation of the data, and Y is the mean of the data in N years.

3.1.2. Mean of the Data Calculation in Time Series

The cumulative seasonal means (CSM) method was used to investigate the mean of the data in each of the time series (decade or century scale). Moreover, the value was then used as a reference value to identify the persistence or fluctuation of the data [33,36,37,38,39]. The CSM formula was calculated by Equation (2):
C S M j = 1 j i = 1 j Y i ,     j = 1 ,   2 ,   3 , , N
where Y i refers to temperature or precipitation or others in each year, while N is the number of years under study (decade or century scale).

3.1.3. Homogeneity Test of Data and Abrupt Change Analysis

The homogeneity test of data and abrupt change analysis were investigated by an easy statistical method called Pettitt’s test, to define the homogeneous or heterogeneous data which enabled the detection of the change point in unknown time (t), similarly to the concept of the Mann–Whitney statistic. The null hypothesis (H0) clarifies that the data are homogeneous, while the alternative hypothesis (Ha) refers to there being a date at which there is a change in the data, thus leading the abrupt change detection. Pettitt’s test formula can be calculated by Equation (3) as shown below [40,41,42]:
D i j = s g n x i x j =   1     x i x j < 0 0             x i x j = 0 + 1       x i x j < 0
where x i and x j are random variables from the data, while x t follows x t in time series.
Moreover, if the alternative hypothesis (Ha) happened, the U t , T statistic based on the Mann–Whitney is used to calculate next for all random variables data from 1 to T. A change point happening at time t is detected by Equations (4) and (5) with a suitable significance level as calculated following Equation (6). However, the homogeneity test of data and abrupt change analysis by Pettitt’s test were performed by XLSTAT program (student version) with a significance level at 95% (p-value ≤ 0.05).
U t , T = i = 1 t j = t + 1 T D i j
K T = m a x 1 t < T   U t , T
p = 2 · e x p 6 K T 2 T 2 + T 3
where U t , T depends on D i j , and K T refers to a change point at time t.

3.1.4. Trend Analysis

A non-parametric test called the Mann–Kendall trend test was suggested by the World Meteorological Organization (WMO) to examine trend changes in terms of hydrological data and meteorological data; moreover, normality assumptions of the data are not required [43,44,45,46,47,48,49,50] as presented in Equations (7)–(10), while Sen’s slope is a good estimator to illustrate the trend pattern, relationship and quantification of the time change in two variables in a linear pattern, with no effect from errors or outlying data [43,44,45,46,47,48,49,50]. The Sen’s slope equations are presented in Equations (11)–(13) below:
S = i = j n 1 j = i + 1 n s g n x j x i  
s g n x j x i =   + 1     x i x j < 0 0             x i x j = 0 1       x i x j < 0
v a r ( s ) = n n 1 2 n + 5 i = 1 m t i ( t i 1 ) ( 2 t i + 5 ) 18
      Z = S ± 1 v a r ( s ) 2
where S represents a trend pattern (positive and negative values of S refer to upward and downward trends, respectively, while S = 0 refers to no trend). Meanwhile, v a r ( s ) refers to the variance of the data which is calculated to get the Z value, whereby the high Z value indicates an increasing trend, while the low Z value refers to a decreasing trend.
Q i = ( x j x i ) j i ,   i = 1 ,   2 ,   3 , , N
Q m e d =   Q N + 1 2 ,   i f   N = o d d
Q m e d = Q N 2 + Q N + 1 2 2 ,   i f   N = e v e n

3.2. The New Thornthwaite Climate Classification

Thornthwaite Climate Classification (THC) is one type of climate classification which is appropriate to investigate climate conditions for plant and agricultural activities [24,25]. The first result was obtained in 1943 by an American climatologist named Charles Warren Thornthwaite (1889 to 1963), using the moisture index method which was developed by Karl Linsser [22]. Subsequently, the water balance metrics concept was used to develop the method for presentation in class intervals [23,29]. However, the THC processes were complex and it was difficult to obtain the results, so Carter and Mather (1966) further developed the method by gathering both moisture index and water balance metrics before modifying the equation for simplicity, using only temperature, precipitation, and sun duration [28].
The New Thornthwaite Moisture Index (TMI) was modified by Willmott and Feddema (1992) to achieve fewer complex equations with only monthly precipitation in millimeters and monthly temperature in degrees Celsius [51]. Moreover, it was too difficult to acquire sun duration data for each day at each meteorological station, so Al-Sudani, H. I. Z. (2019) reported adjustment factors (Adj) varying by latitude and month, with different sun durations as presented in Table 2 [52]. The TMI could be calculated by the following Equations (14)–(16) and Table 3 with the values from −1 to 1 (−1 and 1 refer to no precipitation (Pr) and no potential evapotranspiration (PET), while 0 means Pr equal to PET).
T M I = 1 P E T P r   ;   P r > P E T 0     ; Pr = P E T = 0                     P r P E T 1   ; Pr P E T
P E T = 16 · 10 T m I · A d j i ; i n   m m   p e r   m o n t h
I = i = 1 12 T m i 5 1.514
= 6.75 · 10 7 I 3 7.71 · 10 5 I 2 + 1.792 · 10 2 I + 0.49239
where TMI is the New Thornthwaite Moisture Index as modified by Willmott and Feddema (1992) [51], P E T refers to monthly potential evapotranspiration in mm, and P E T A n n is annual potential evapotranspiration. P r denotes monthly precipitation in mm and P r A n n is annual precipitation in mm. I is the Heat Index which depends on the 12 mean monthly temperatures ( T m i ), while T m i is the mean monthly temperature in degrees Celsius. A d j i represents adjustment factors depending on latitude and sun duration per day as illustrated in Table 3.
Air temperature was widely used as a thermal indicator; however, Thornthwaite (1948) realized that temperature alone was not sufficient to declare thermal zones [23]. Moreover, Thornthwaite explained that PET could present the amount of evaporation for a given ecosystem. Therefore, annual PET as illustrated in Equation (18) was used to classify the thermal index for the New Thornthwaite Climate Classification. The climate zones were separated into six classes as presented in Table 4.
P E T A n n = i 12 P E T     ;   i n   m m
Most climate classifications use “winter” and “summer” to define “dry” and “wet” periods; however, Carter and Mather (1966) and Feddema (2005) posed the question “When is winter and summer at equatorial latitudes?” due to the difficulty of defining the seasons [28,53]. Therefore, actual wet and dry periods were considered more suitable to identify climate variability. Moreover, the New Thornthwaite Climate Classification combined the two concepts of the old Thornthwaite classification (1948) [23] and Carter and Mather (1966) [28], presented by Feddema (2005) [53], whereby the Thornthwaite Moisture Index (TMI), which varied by PET and precipitation change, could present the climate variability based on the annual range of monthly TMI data. The climate variability can be calculated following Equation (19) and classified as shown in Table 5.
C l i m a t e   V a r i a b i l i t y = T M I ( M a x ) T M I M i n ; i n   e a c h   y e a r
The climate variability index could be affected by precipitation, thermal factors, or both, and thus, it was necessary to find the causes. The calculation followed Equation (20) and Table 6 when PET and Pr in each month had the same units. If precipitation is a cause of seasonality, the range of maximum to minimum precipitation will be wide. In contrast, a short range of maximum and minimum PET represents the seasonality caused by temperature.
V a r i a b i l i t y   C a u s e = P r ( m a x ) P r ( m i n ) P E T m a x P E T m i n   ;   i n   e a c h   y e a r

3.3. Spatial Distribution Analysis

Spatial distribution analysis was performed by mapping, combined with the GIS analysis software package. Moreover, boundary shapefiles of Thailand and the Meteorological stations were serviced by OCHA (“https://data.humdata.org/dataset/cod-ab-tha? (accessed on 27 March 2022)”) [54] and TMD (“http://climate.tmd.go.th/content/file/75 (accessed on 15 March 2022)”) [55], respectively. The spatial distribution maps for each type of data were drawn by ordinary kriging under a raster interpolation command set. The output cell size was at 400 and there were 12 points around the station which were used for calculation. Then, the maps were exported at 500 dpi. The size of Thailand from the reference is about 517,624 km2 [31]; however, the size was reduced to 516,084.89 km2 (about −0.30% different) after the raster interpolation by kriging method was complete.

4. Results and Discussions

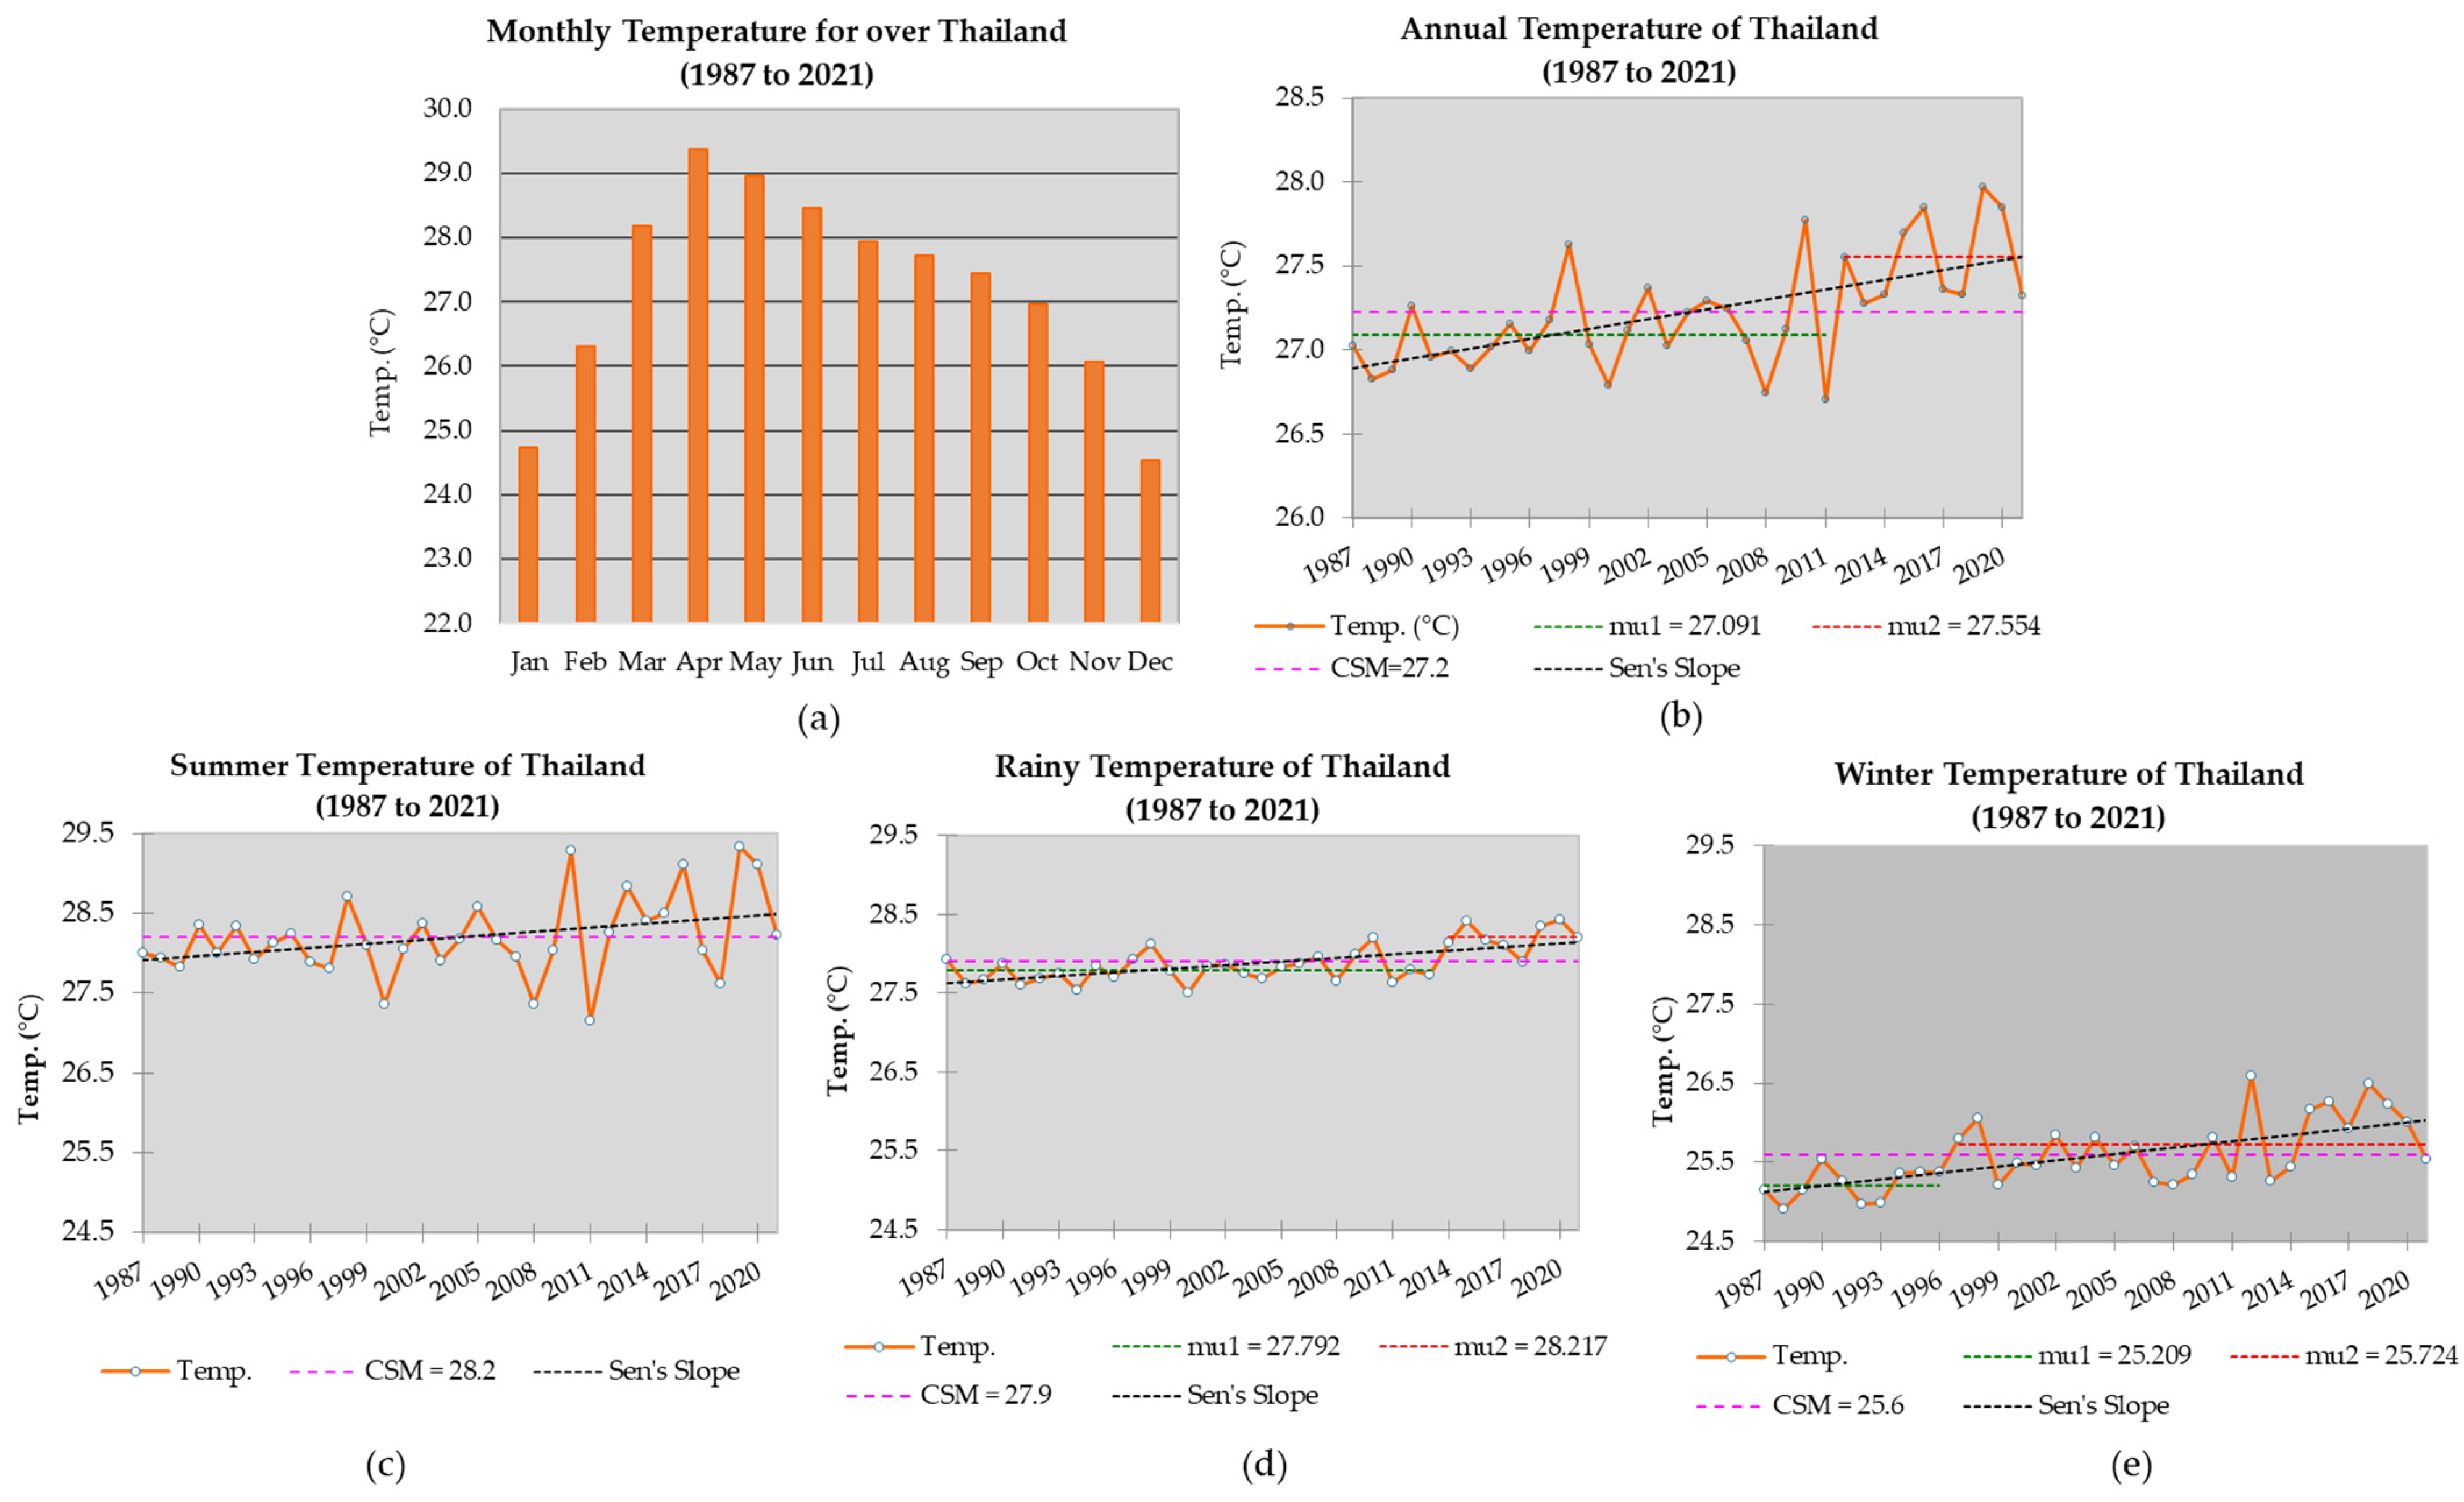
4.1. Temperature during 1987 to 2021

Average annual temperature (Tann) data were analyzed by gathering the Tann from 104 meteorological stations throughout Thailand. The Tann of Thailand during 1987 to 2021 from all stations were about 13.5 to 37.3 °C. The spatial distribution of the Tann map of the present period is illustrated in Figure 2a, confirming that the hottest areas which are determined by Tann were appearing in the Central region of Thailand, and especially in the Bangkok Metropolitan Region, caused by high population density, an increase in high-rise buildings, urban heat, and industrial activities [56,57]. However, the Tann gradually decreased in the next area and reached the lowest values in the northern region of Thailand due to the incident angle of the sun’s rays throughout the year [58,59]. Moreover, a graph of monthly temperature throughout Thailand was drawn as shown in Figure 3a, indicating that the temperature was gradually increasing from the beginning of the year until hitting its peak in April which is the summer season in Thailand, whereupon the values gradually dropped towards the end the year, which is the winter season.
Consideration of data variability was performed by the coefficient of variation (%CV) method. The %CV values as illustrated in Figure 2b and Table 7 were in a range of 0.75–2.91% with an average at 1.21%, which can be accepted. The %CV values for the summer, rainy, and winter seasons were about 1.81%, 0.88%, and 1.69%, respectively. The high %CV values were found at higher latitudes of Thailand (the upper area of Thailand from the central to the northern region), especially in the northern region due to much of the land area, including high mountain ranges and valleys, being a long way from the sea with varying altitude [60], leading to large differences in temperature in different seasons. Moreover, land can absorb heat from solar radiation faster, although land can also release the heat faster by the transpiration and convection processes in the day and night time, leading to the surrounding temperature dropping by more than in the urban areas [61,62]. Furthermore, the influence of the power of the northeast monsoon in winter, which extended variably to higher latitude areas each year, caused the temperature in the upper part of Thailand to fluctuate [63]. However, the low %CV values were found at the lower latitudes of Thailand, especially in the southern region of Thailand which connects to the Andaman Sea and the Gulf of Thailand, thus the temperatures did not differ significantly between seasons and between years [60]. Moreover, ENSO phenomena also affected the temperature, causing fluctuations each year especially in the upper part of Thailand, leading to the observed variability in temperature [64].
The pink line graph as illustrated in Figure 3b–e and the values shown in Table 7 revealed that the cumulative seasonal means (CSM) of Thailand were about 27.2°C. The seasonal CSM values of the summer, rainy, and winter seasons were about 28.2, 27.9, and 25.6°C, respectively. Furthermore, the homogeneity test of data and abrupt change analysis were calculated by Pettitt p-value (two-tailed) at a significance level of 95% as shown by the green line (mu1 = before abrupt change) and red line (mu2 = after abrupt change) of Figure 3b, which revealed that most of the meteorological stations (64 stations) had the values at <0.001 to 0.042, indicating that there was a period at which there was a change in the data (Ha), and also indicating that there was an abrupt change which happened in an increasing direction for temperature in 2013, 1996, and 2011, respectively, for annual, rainy, and winter season. However, there were only 40 meteorological stations which indicated that the data were homogeneous and that no abrupt change (H0) occurred.
Trend analysis was evaluated by the Mann–Kendall trend (Kendall’s Tau) test and Sen’s slope, demonstrating that all meteorological stations had an increasing trend of Tann. Moreover, 62 meteorological stations had an increasing trend at a significant level at 95% with p-values (two-tailed) of about <0.0001 to 0.034. Kendall’s Tau value results were about 0.469 overall for Thailand. Sen’s slope and the Kendall’s Tau spatial distribution as illustrated in Figure 2c,d had the same pattern, whereby the high values were found at higher latitudes and the low values appeared at lower latitudes, with increasing rates at +0.017, 0.014, 0.016, and 0.025 °C/year for annual, summer, rainy, and winter seasons, respectively, as illustrated by the black lines in Figure 3b–e. The changing trends and rates of temperature were similar to Cambodia, Myanmar, and Laos which are located at around the same latitude as Thailand, and exhibited temperature trends that were increasing with the rates at +0.023 to +0.055 °C/year [65,66,67,68].

4.2. Precipitation during 1987 to 2021

Total annual precipitation (Prann) data were analyzed by gathering the Prann from 104 meteorological stations throughout Thailand. The Prann values of Thailand during 1987 to 2021 were between 941.66 to 4895.44 mm. Focusing on the Prann spatial distribution map as shown in Figure 4a, the map indicated that Prann had high values in the southern region (especially in the west side of the region connecting to the Andaman Sea) and in the eastern region (especially in front of the Chanthaburi mountain range connecting to the Gulf of Thailand) due to the southwest monsoon in May–October leading to greater humidity and rainfall in the area [21,69]. Moreover, the northeast monsoon also brought humidity and rainfall to the east side of the southern region where the area meets the Gulf of Thailand in November to February [21,70]. Furthermore, the northeastern region also received high rainfall, especially in the east side of the area due to the influence of tropical storms which could easily affect the area [18,71,72]. However, the rainfall value in the northeastern region gradually decreased to the west side of the area [72] through the Central part and the central part of the northern region because the land is a long way from the nearest sea and there is a friction force which can obstruct tropical storms [18,21]. The upper area of the northern region had higher rainfall in the center of the region due to the high mountain range and abundant forests which can bring orographic rain [73]. Moreover, movement of the Inter-Tropical Convergence Zone (ITCZ) also results in rainfall through the area which the ITCZ passes around [74]. The monthly precipitation was also similar to the Mekong Basin Region which is located at the same latitude and is connected to Thailand. Figure 5a indicated that the precipitation was slowly rising from the beginning of the year into the summer season, and after that the precipitation was rapidly increasing in the rainy season, hitting its peak in September before sharply decreasing until the end of the year in the winter season [68].
The %CV values as presented in Figure 4b and Table 8 were in the range of 12.55% to 33.81%; however, the %CV of most of the meteorological stations were in an acceptable range with an annual average at 10.04%. The %CV values for the summer, rainy, and winter seasons were about 28.19%, 8.03%, and 20.75%, respectively. The highest values were found in the northern part due to the area being far from the sea, coupled with mountain and valley topography which obstructed the wind, humidity, and southwest monsoon power, leading to uncertain rainfall throughout the area [75,76]. Moreover, tropical storms which were travelling into the area and ENSO phenomena with different strengths in each year resulted in further rainfall uncertainty. In addition, the power of the rain shadow also brought unsteady rainfall in the area behind the high mountain ranges (the east side of the Dan Lao, Thanon Thongchai, and Tanaosri mountain ranges which separate Thailand from Myanmar) [77]. The area which connects to the Gulf of Thailand also received tropical storms of different strengths, while the southwest monsoon effects (in the eastern region) and the northeast monsoon effects (in the east side of the southern region) with the difference in power in each year lead to inconsistent rainfall in that area. However, the low %CV values were found in the east side of the northeastern and eastern regions, before gradually increasing in the west side. Moreover, the east side of the southern region also had low %CV due to the amount of rain coming into the area being quite similar in each year [21].
As the pink line graph in Figure 5b–e and the values in Table 8 reveal, CSM values for annual, summer, rainy, and winter were about 1596.3, 376.0, 871.1, and 349.1 mm. The pattern of rainfall values fluctuated, indicating that increasing values alternated with decreasing values throughout the whole period. Moreover, the homogeneity test of data and abrupt change analysis at a significance level of 95% showed that the data were homogeneous in most of the meteorological stations in Thailand, and there was no abrupt change due to the fluctuation of the values.
Furthermore, MK and Sen’s slope statistics as shown in Figure 4c,d indicated that most areas in Thailand had an increasing trend at a significance level of 95% (93 stations) and >95% (11 stations). The dominant increase in rainfall was found in the southern and eastern regions. Bangkok Metropolitan Region also had notable values due to urban heat and convectional rain [78]. However, outstanding decreases in rainfall areas were found around the seam of the Central region and upper northeastern region. Kendall’s Tau value for Thailand was investigated and found to be 0.156 with a p-value at 0.191. The Sen’s slope values were about +4.119, −0.116, 1.1813, and 2.082 mm/year for annual, summer, rainy, and winter, respectively, as presented by the black line of Figure 5b–e and the values in Table 8. This increasing annual rate for Thailand resembled the other countries in the Mekong Region at the same latitude as Thailand, at about +5 to +8 mm/year [65,66,67,68].

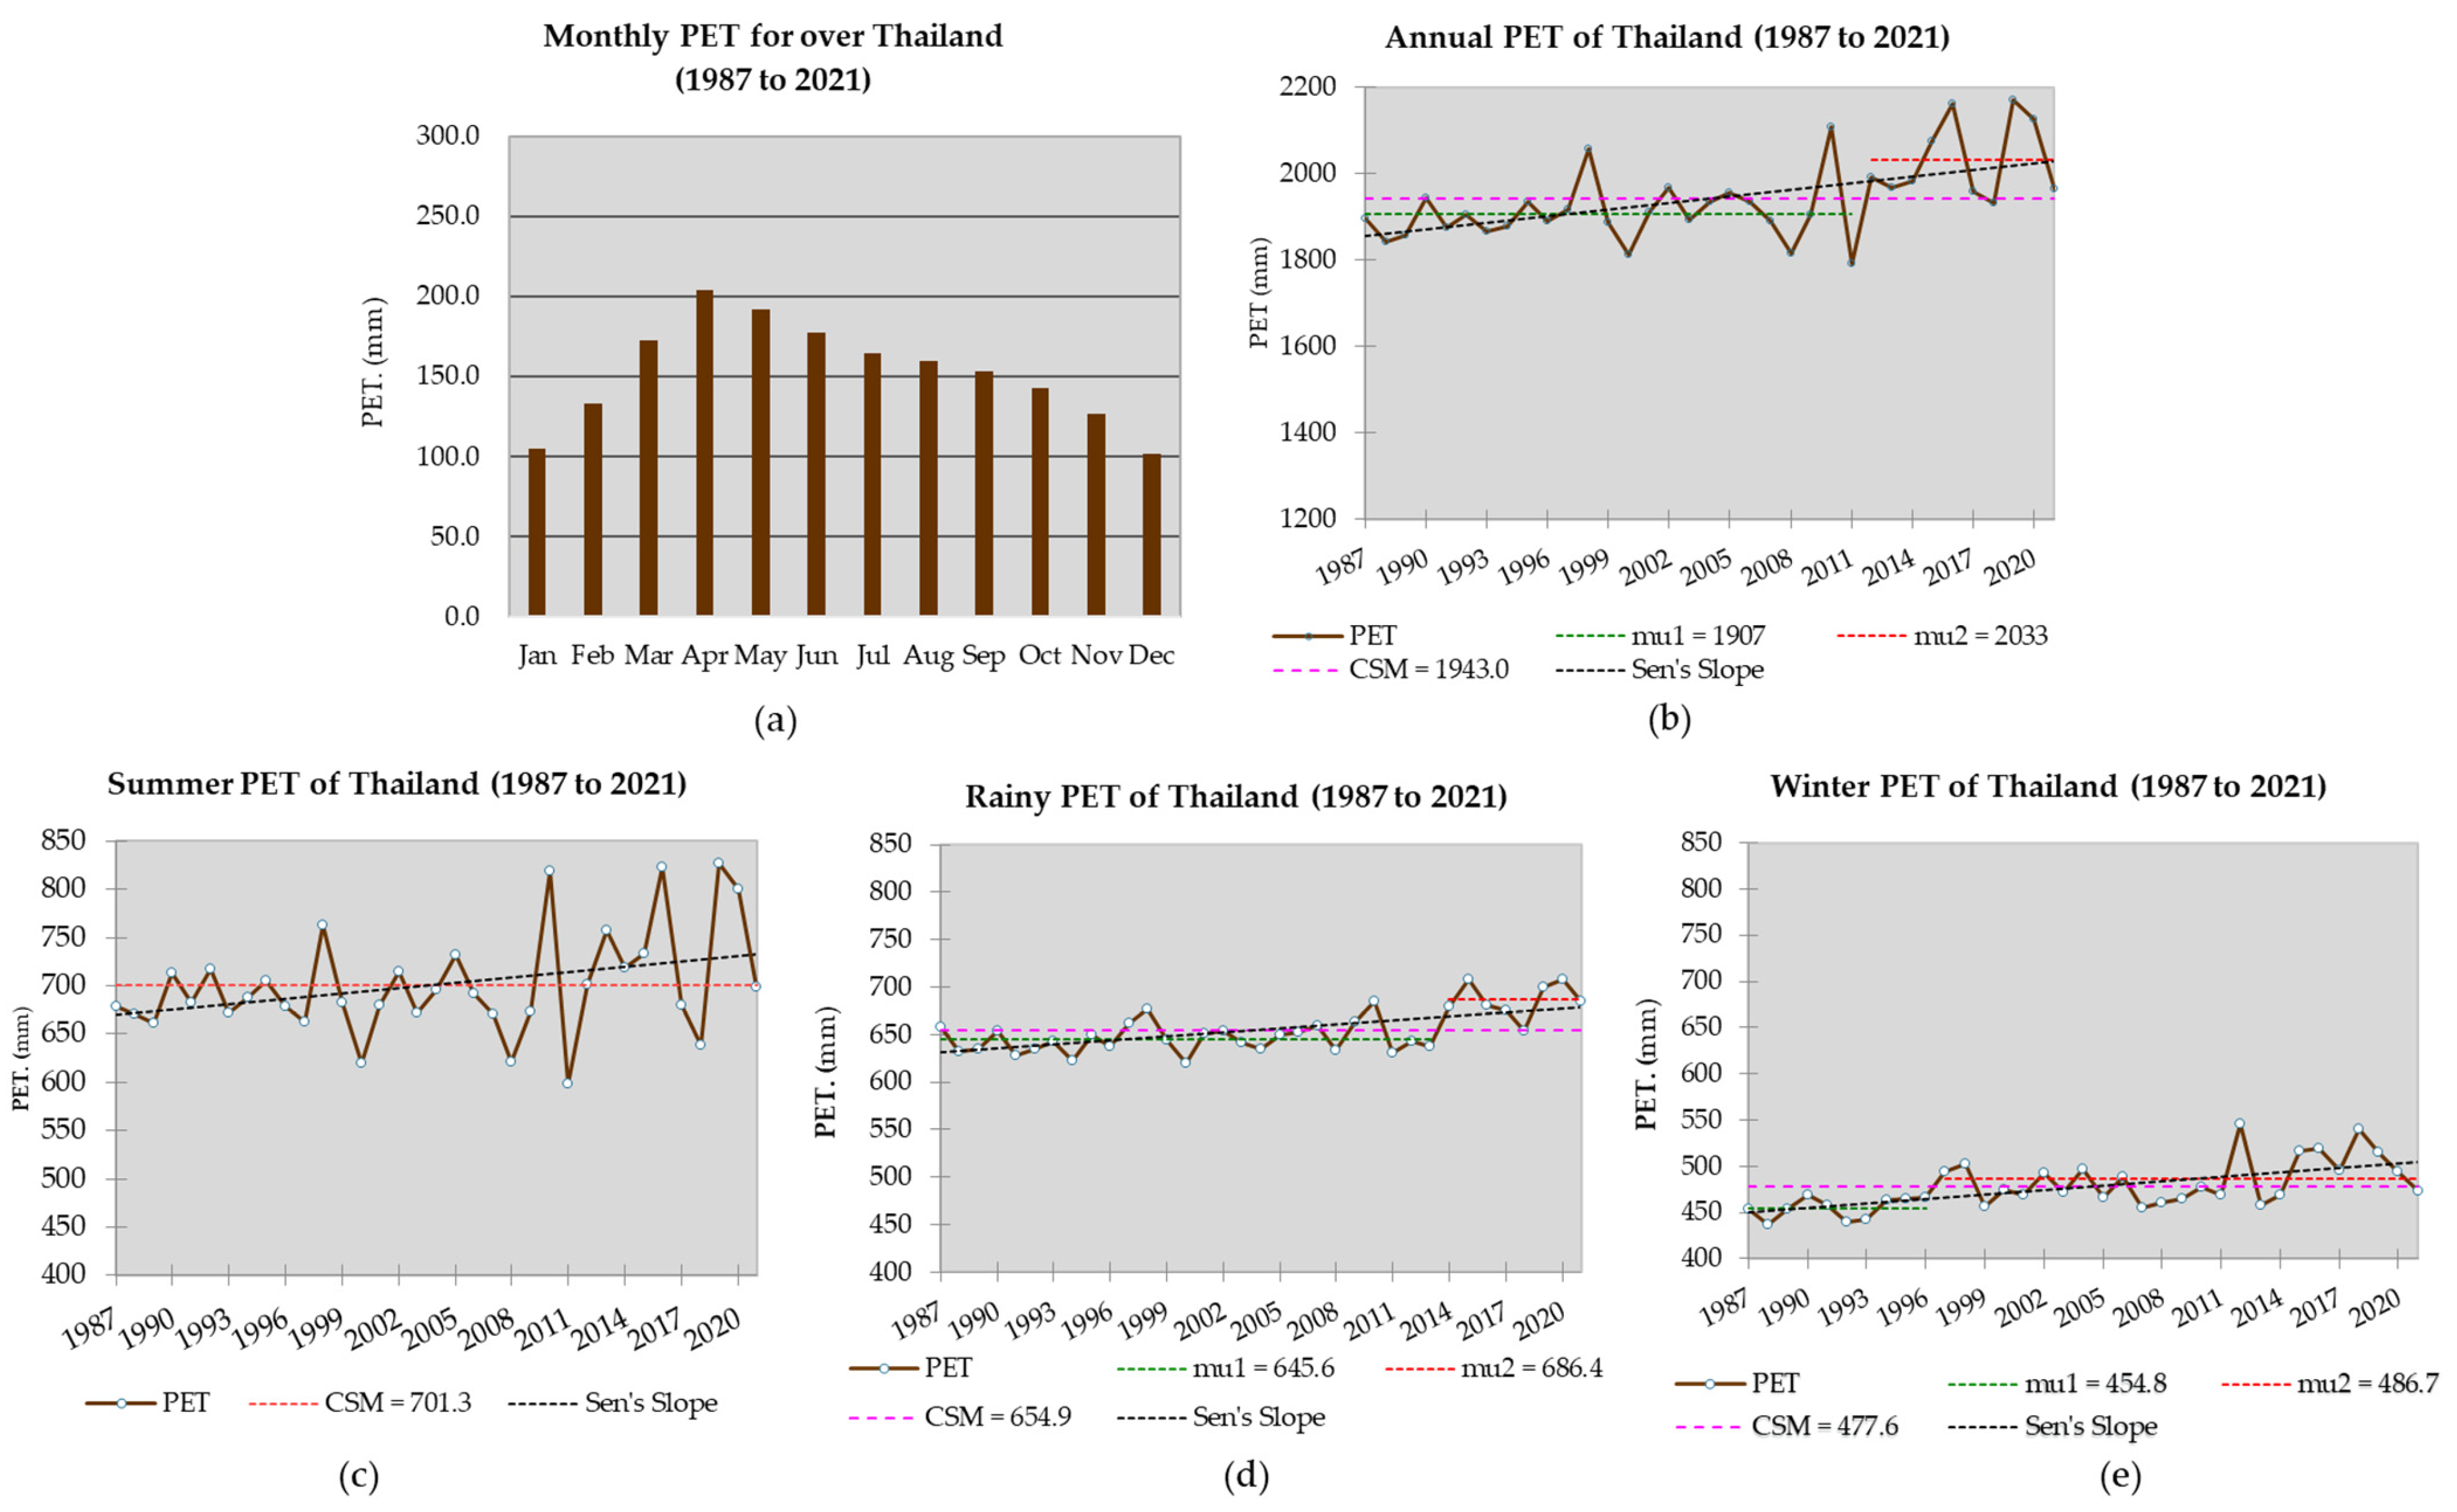
4.3. Potential Evapotranspiration (PET) during 1987–2021

The annual potential evapotranspiration (PETann) values were analyzed by temperature and precipitation data, which were collected from 104 meteorological stations. The PETann values of Thailand were in the range of 963.7 to 2368.2 mm. The spatial distribution map of PETann for 1987 to 2021 is illustrated in Figure 6a, showing that the high PETann pattern was identical to the PETann pattern in the Mekong River Basin, with the high PETann appearing in the Central region of Thailand then gradually fading in the next area [79], similar to the pattern of the Tann spatial distribution as shown in Figure 1a. The monthly PET over Thailand as illustrated in Figure 7a also shows the same pattern as the monthly temperature in Figure 2a, indicating that the PET was rapidly climbing from the first month, then hit the peak in April, and after that the PET was gradually declining until reaching its lowest values in the winter season, especially in December.
The %CV pattern as illustrated in Figure 7b was also similar to Figure 1b in that the high values were usually found in the upper part of the area then gradually dropped in the lower area. The %CV values of annual, summer, rainy, and winter were considered acceptable values at 4.87%, 7.81%, 3.62%, and 5.61%, respectively, as illustrated in Table 9. The brown line graph as illustrated in Figure 7b,e showed that the PET values in time series fluctuated (increasing values alternating with decreasing values) throughout the period; however, CSM of the PET values throughout Thailand for summer, rainy, winter, and annual were approximately at 701.3, 654.9, 477.6, and 1943.0 mm, respectively. Pettitt’s test was performed to analyze the homogeneity test of data and abrupt change analysis, resulting in there being a date at which there was a change in the data, and an abrupt changing period in a rising manner. The abrupt change period was found to be similar to the period of temperature in 2013, 1996, and 2011 for rainy, winter, and annual at a significance level at >95% with p-values (two-tailed) of about 0.004 to 0.006. Furthermore, Kendall’s Tau and Sen’s slope statistics as in Figure 6c,d and Figure 7b–e, and Table 9 indicated that there were significant increasing trends for Sen’s slope in the series of rainy, winter, and annual at +1.468, +1.395, and +4.282 mm/year, with Kendall’s Tau values at 0.408, 0.462, and 0.425, respectively, and p-values (two-tailed) of about 0.000 to 0.001. The increasing rate of precipitation was similar to that of the Mekong River Basin where the values changed by about 2 to 7 mm/year [79]. The rapidly increasing rates appeared in most areas of Thailand (from the central to northern regions) and the slowly increasing rates were focused on the southern region of Thailand, especially on the east side which was connected to the Gulf of Thailand.

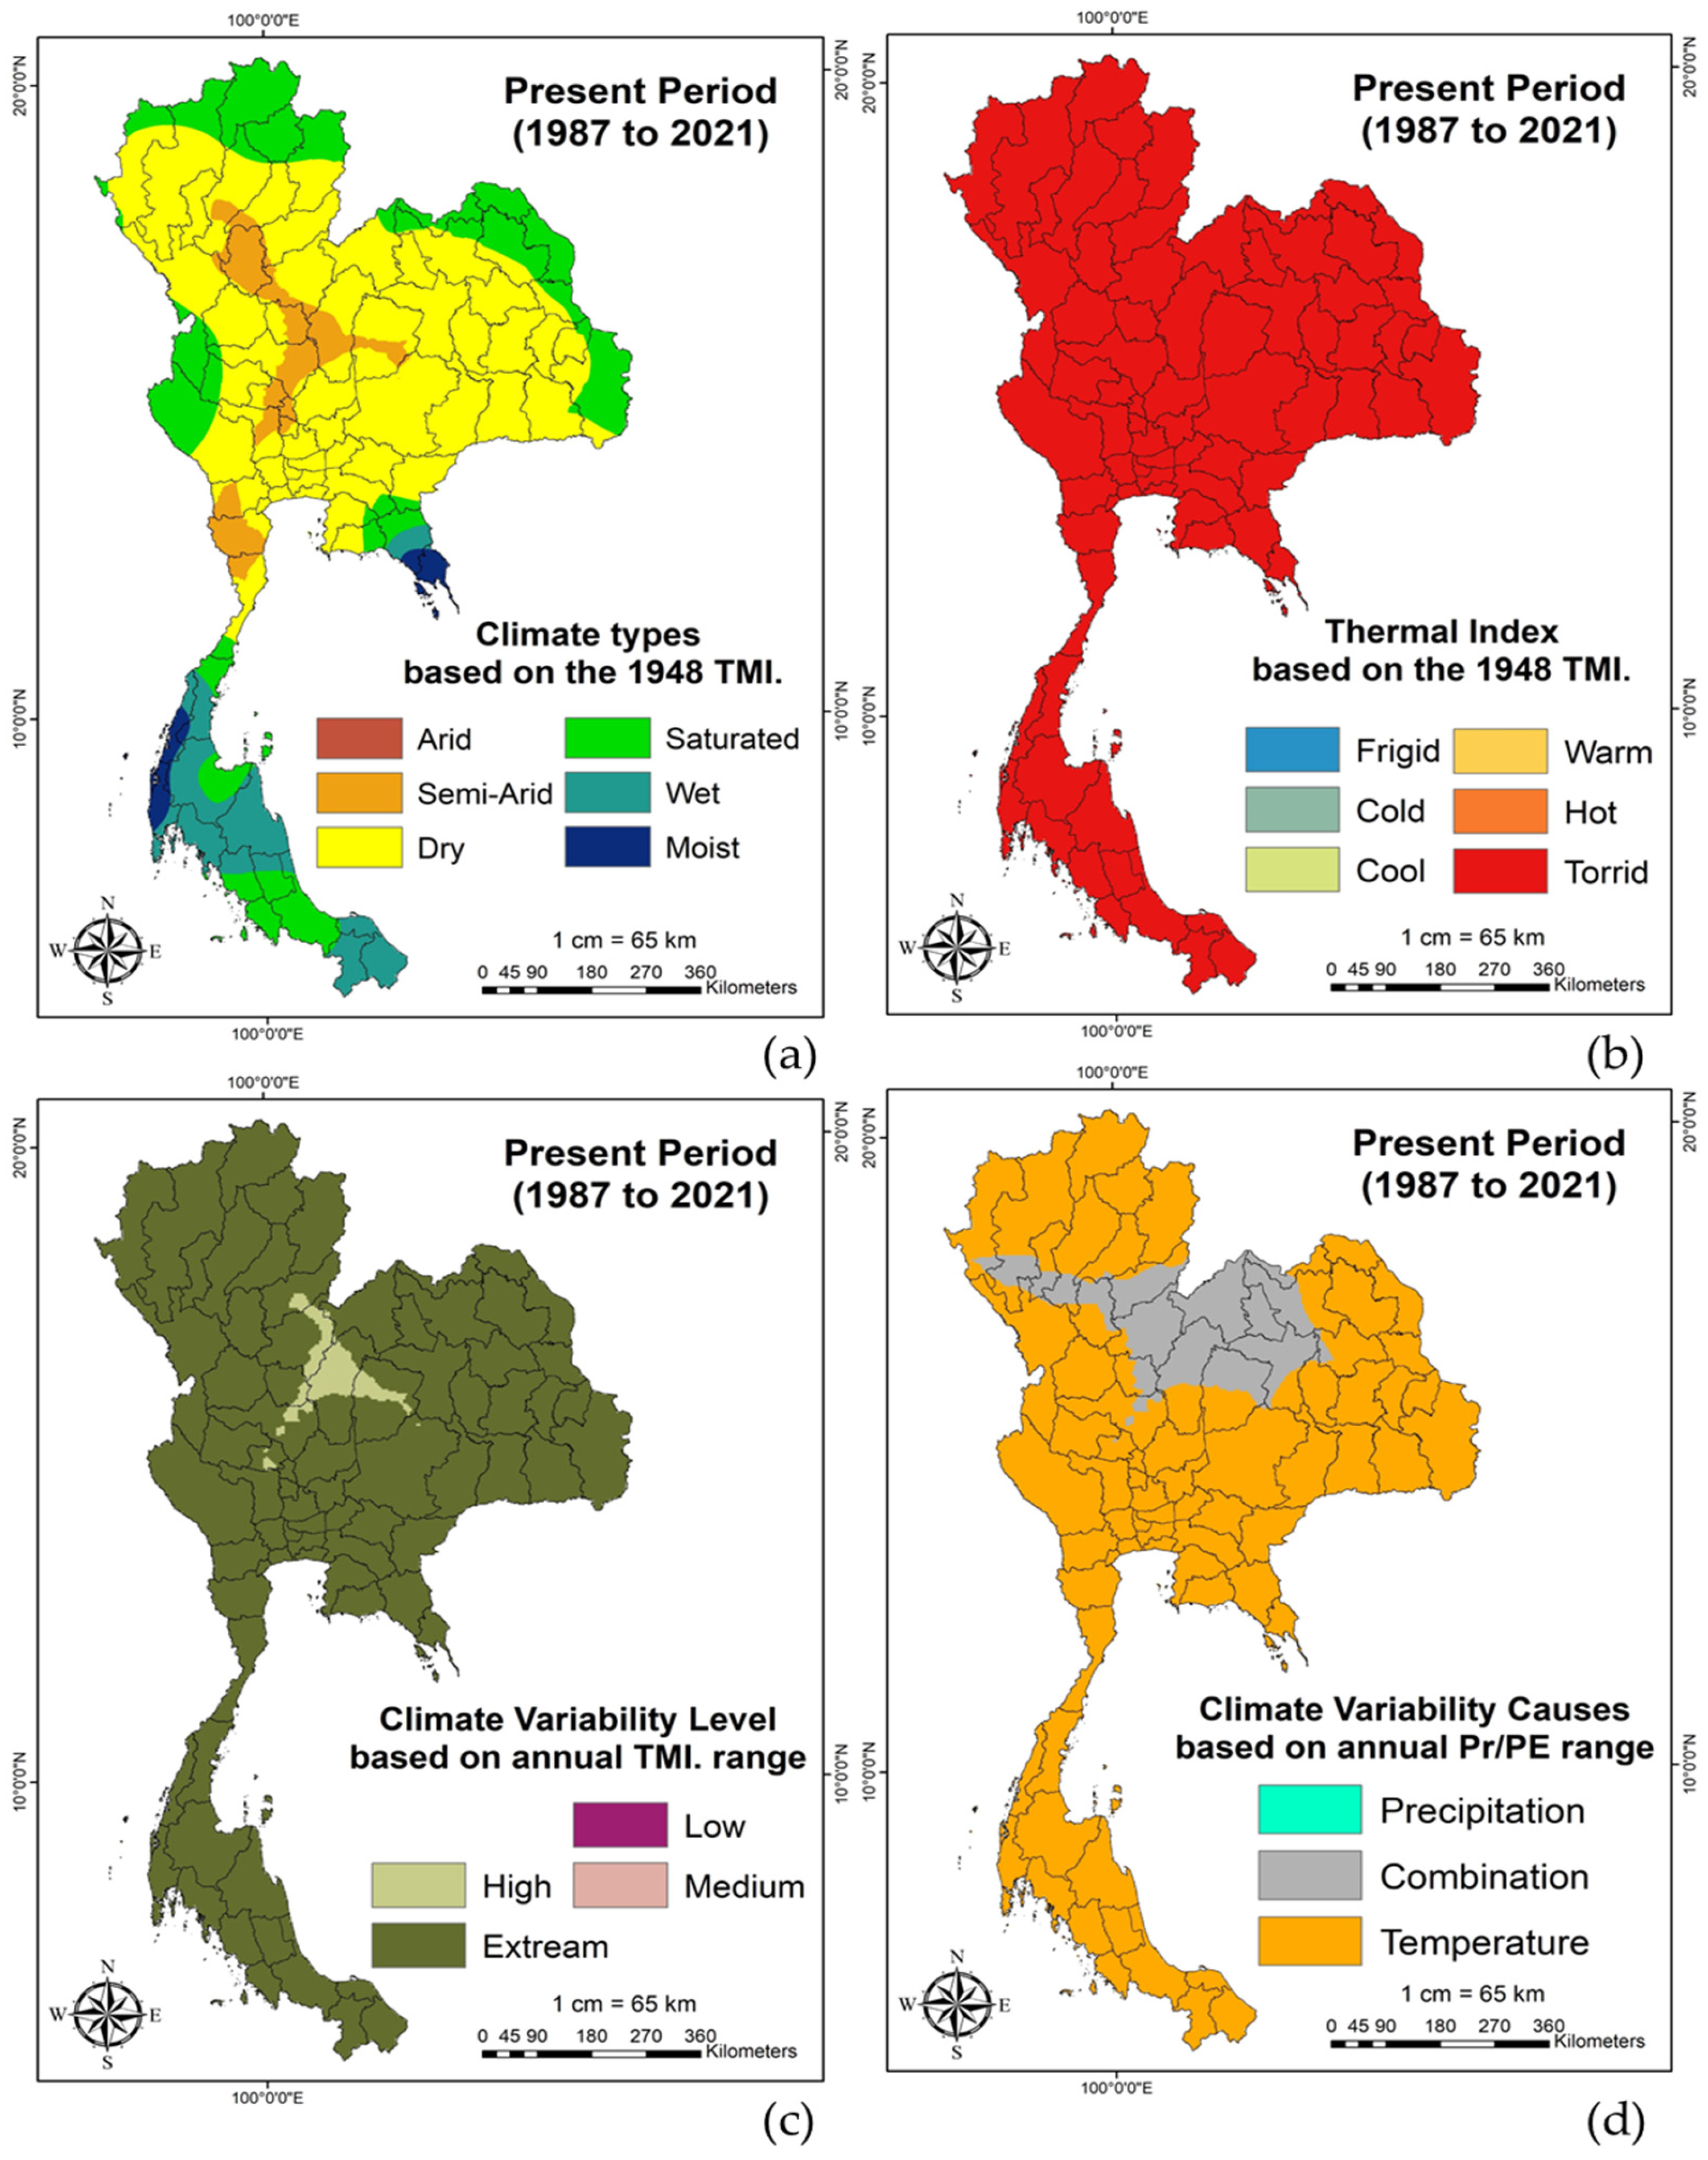
4.4. The New Thornthwaite Climate Classification

The New Thornthwaite Climate Classification was performed by utilizing only temperature and precipitation data for the (1) moisture index, (2) thermal index, (3) climate variability level, and (4) climate variability cause modifiers.
The moisture index was calculated by following the New Thornthwaite Climate Classification method [53] as shown in Equations (14)–(17) and Table 2, then classifying the values by following Table 3. The result is presented in Figure 8a, illustrating that the main TMI type was in a dry series which represented dry (yellow) and semi-arid (orange) climate patterns at about 57.64% of Thailand (297,470.23 km2) and 7.79% of Thailand (40,185.58 km2), respectively, appearing from the middle to the upper part of Thailand in areas which are a long way from the sea and connected to the land of neighboring countries. Moreover, a semi-arid (orange) climate pattern was also found in the middle of the country due to the low rainfall and rain shadow effect. However, the wet series comprised the saturated type (green), wet type (blue), and moist type (dark blue). The saturated type (green) was found in 23.66% of Thailand (122,103.55 km2) appearing at the edge of the country. Furthermore, the wet type (Blue) was found in most areas of the southern region and in small areas in the eastern region amounting to about 9.06% of Thailand (46,778.99 km2). Moreover, the moist type (dark blue) was found in small areas of the west of the southern region and at the tip of the peninsula of the eastern region (around Chanthaburi and Trat Provinces) due to the high rainfall in the area almost all year round, as the results in Figure 4a confirm. These findings could lead to the conclusion that the dry series can usually be found in the land which is far from the sea and surrounded by the land of other countries, while the wet series appeared in the areas which are connected to the sea and receive the influence of the southwest monsoon and tropical cyclones.
The thermal index was assessed via the annual potential evapotranspiration (PETann) using Equation (18), whereupon the values were separated by Table 4. The spatial distribution of the Thermal Index is illustrated in Figure 8b, showing that there was only the torrid type appearing in Thailand due to the high temperature all year round, reflected in the high PET values.
Climate variability level was analyzed by Thornthwaite Moisture Index (TMI) range as in Equation (19), then following Table 5. The spatial distribution of climate variability level is presented in Figure 8c, revealing that climate variability at an extreme level appeared throughout most of Thailand at 96.75% of Thailand (499,318.85 km2), while a high level was found in only 3.25% (16,766.02 km2) of the middle of Thailand.
Climate variability causes were investigated by Prann and PETann values as in Equation (20), then following Table 6. The spatial distribution of climate variability causes is displayed in Figure 8d, indicating that most of Thailand was affected by temperature as a major factor, accounting for about 84.34% of Thailand (435,472.29 km2). However, there was only 15.62% (80,612.52 km2) of Thailand around the middle of the upper side of the country, which is far from the sea and surrounded by mountains that was affected by both temperature and precipitation factors.
The New Thornthwaite Climate Classification was mostly different from the study by Elguindi et al. (2014), which was conducted in the period of 1976 to 2005 [80]. The main moisture index classification was the wet-torrid type in most areas of Thailand (from the upper part of the southern region to the northern region). Moreover, wet-torrid and wet-hot types were found in lower part of the southern region and in the eastern region, while the semi-torrid type appeared in the middle of the country, similarly to the area shown for the combination type (precipitation and temperature effects) in Figure 8d. Furthermore, the climate variability causes and levels are completely different from those in the study of Feddema (2005) [53], which found that Thailand was affected only by precipitation at the extreme level.

5. Conclusions

Temperature, precipitation, and evapotranspiration were examined to present the trend and spatial distribution of these variables. The annual temperature (Tann) in high value concentration was found in the Bangkok Metropolitan Region due to the urban heat island, whereupon the concentration of Tann faded in the next area until reaching its lowest values in the upper-northern region with the abrupt change period and increasing trends found. The annual precipitation (Prann) was concentrated in the west of the southern region (Andaman side) and the tip of the peninsula of the eastern region (around Chanthaburi and Trat Provinces on the Gulf of Thailand side) due to the effects of the southwest monsoon. Moreover, the high Prann value was also found in the small area of the upper-east of the northeastern region (around Nakhon Phanom Province) due to the effect of tropical storms. However, the low Prann value found in the middle of the country was due to rain-shadow effects and the location far from the sea. The Prann values had no abrupt change period and few changes in trends were found. Both temperature and precipitation results were similar to those in studies by Limsakul et al. (2017) [70], Dandridge et al. (2019) [75], Kornkosa et al. (2021) [18], Yang and Han (2020) [71], Pinidluek et al. (2020) [72], Mahavik et al. (2021) [73], Phumkokrux (2021) [21], and Puttanapong et al. (2022) [81]. The annual potential evapotranspiration (PETann) exhibited the highest value in the middle of Thailand then faded in the next area until reaching its lowest levels at the top of the northern region with an abrupt change period and rising trends found due to the effects of high Tann leading to high PETann.
The results for the New Thornthwaite Climate Classification in Thailand revealed that the semi-arid type was found in the middle of the country, whereupon it got wetter in the next area while the wettest was found in the small area in the southern region (Andaman side) and the tip of the peninsula of the eastern region due to the effects of the southwest monsoon. Moreover, most of Thailand was facing climate variability at an extreme level with the changes in temperature the cause, as seen in the temperature and potential evapotranspiration section whereby the patterns of both these sections were similar. These different results from previous studies as mentioned above [53,80] indicated that the wet area would be wetter and the dry area tended to be drier. The climate is changing in Thailand. Moreover, ENSO phenomena are heavily discussed at present, and this can contribute to accelerating climate change [82,83,84,85]. Accordingly, the future climate urgently requires further study in the near future.
Due to the New Thornthwaite Climate Classification focusing only on temperature, precipitation, and potential evapotranspiration with a simple method and formula for easy application, there are fewer parameters required as basic information for local authorities to assess and plan climate change policy in a timely manner. Thus, this work reported only climate change characteristics from these stated parameters. However, the temperature and rainfall data in this work were collected only for 1987–2021 due to the limitation of data access, since some stations did not record or report the values in some years or at some stations. Therefore, older data could instead be approximated through various historical climate simulations, or the values could be extracted from historical satellite images to study the historical climate data further in subsequent works.

Author Contributions

Conceptualization, N.P.; methodology, N.P.; validation, P.T.; formal analysis, N.P.; investigation, N.P.; data curation, N.P.; writing—original draft preparation, N.P.; writing—review and editing, N.P. and P.T.; visualization, N.P.; supervision, P.T.; project administration, N.P. and P.T.; funding acquisition, N.P. and P.T. All authors have read and agreed to the published version of the manuscript.

Funding

This research is funded by Kasetsart University through the Graduate School Fellowship Program.

Institutional Review Board Statement

The Human Subject Research Ethics Sub-Committee of Ramkhamhaeng University, Thailand, has approved this study. Study Code: RU-HRE 65/0107, Approval Date: 5 September 2022, and Expiry Date: 4 September 2023.

Data Availability Statement

Temperature and precipitation data were provided by the Thai Meteorological Department (TMD). The data can be requested from https://www.tmd.go.th/service/tmdData (accessed on 4 February 2024). However, some parts of the data were provided by the South East Asia Meteorological Telecommunication Center, TMD, and can be accessed at http://www.gts.tmd.go.th/indexEn.php (accessed on 4 February 2024). Moreover, boundary shapefiles of Thailand and the Meteorological stations were serviced by OCHA (accessed by https://data.humdata.org/dataset/cod-ab-tha? (accessed on 4 February 2024)) and TMD (accessed by, http://climate.tmd.go.th/content/file/75 (accessed on 4 February 2024)).

Acknowledgments

The authors wish to express sincere thanks to Kasetsart University, Ramkhamhaeng University, and all partners who provided us with support.

Conflicts of Interest

The authors declare no conflicts of interest.

References

  1. Prisecaru, P. Challenges of the fourth industrial revolution. Knowl. Horiz. Econ. 2016, 8, 57. [Google Scholar]
  2. Xu, M.; David, J.M.; Kim, S.H. The fourth industrial revolution: Opportunities and challenges. Int. J. Financ. Res. 2018, 9, 90–95. [Google Scholar] [CrossRef]
  3. IPCC. 2014: Summary for Policymakers. In Climate Change 2014: Mitigation of Climate Change; Contribution of Working Group III to the Fifth Assessment Report of the Intergovernmental Panel on Climate Change; Edenhofer, O., Pichs-Madruga, R., Sokona, Y., Farahani, E., Kadner, S., Seyboth, K., Adler, A., Baum, I., Brunner, S., Eickemeier, P., et al., Eds.; Cambridge University Press: Cambridge, UK; New York, NY, USA, 2013. [Google Scholar]
  4. The Warming Effects of the Industrial Revolution-Global Temperatures. Available online: https://www.climate-policy-watcher.org/global-temperatures/the-warming-effects-of-the-industrial-revolution.html (accessed on 6 October 2023).
  5. Wunsch, C.; Schmitt, R.W.; Baker, D.J. Climate change as an intergenerational problem. Proc. Natl. Acad. Sci. USA 2013, 110, 4435–4436. [Google Scholar] [CrossRef]
  6. Neukom, R.; Steiger, N.; Gómez-Navarro, J.J.; Wang, J.; Werner, J.P. No evidence for globally coherent warm and cold periods over the preindustrial Common Era. Nature 2019, 571, 550–554. [Google Scholar] [CrossRef]
  7. Fleming, R.J. An updated review about carbon dioxide and climate change. Environ. Earth Sci. 2018, 77, 262. [Google Scholar] [CrossRef]
  8. Cox, E.; Spence, E.; Pidgeon, N. Public perceptions of carbon dioxide removal in the United States and the United Kingdom. Nat. Clim. Chang. 2020, 10, 744–749. [Google Scholar] [CrossRef]
  9. Mehmood, I.; Bari, A.; Irshad, S.; Khalid, F.; Liaqat, S.; Anjum, H.; Fahad, S. Carbon cycle in response to global warming. In Environment, Climate, Plant and Vegetation Growth; Fahad, S., Hasanuzzaman, M., Alam, M., Ullah, H., Saeed, M., Ali Khan, I., Adnan, M., Eds.; Springer: Cham, Switzerland, 2020; pp. 1–15. [Google Scholar] [CrossRef]
  10. Voumik, L.C.; Ridwan, M.; Rahman, M.H.; Raihan, A. An investigation into the primary causes of carbon dioxide releases in Kenya: Does renewable energy matter to reduce carbon emission? Renew. Energy Focus 2023, 47, 100491. [Google Scholar] [CrossRef]
  11. Geng, Q.; Wu, P.; Zhao, X.; Wang, Y. Comparison of classification methods for the divisions of wet/dry climate regions in Northwest China. Int. J. Climatol. 2014, 34, 2163–2174. [Google Scholar] [CrossRef]
  12. Aparecido, L.E.D.O.; Rolim, G.D.S.; Richetti, J.; Souza, P.S.D.; Johann, J.A. Köppen, Thornthwaite and Camargo climate classifications for climatic zoning in the State of Paraná, Brazil. Ciência Agrotecnologia 2016, 40, 405–417. [Google Scholar] [CrossRef]
  13. Jylhä, K.; Tuomenvirta, H.; Ruosteenoja, K.; Niemi-Hugaerts, H.; Keisu, K.; Karhu, J.A. Observed and projected future shifts of climatic zones in Europe and their use to visualize climate change information. Weather Clim. Soc. 2010, 2, 148–167. [Google Scholar] [CrossRef]
  14. Walsh, J.; Wuebbles, D.; Hayhoe, K.; Kossin, J.; Kunkel, K.; Stephens, G.; Thorne, P.; Vose, R.; Wehner, M.; Willis, J.; et al. Appendix 3: Climate science supplement. In Climate Change Impacts in the United States: The Third National Climate Assessment; U.S. Global Change Research Program: Washington, DC, USA, 2014; pp. 735–789. [Google Scholar]
  15. Inthacha, S. The Climatology of Thailand and Future Climate Change Projections USING the Regional Climate Model PRECIS. PhD Thesis, University of East Anglia, Norwich, UK, 2011. [Google Scholar]
  16. Phumkokrux, N.; Rukveratham, S. Investigation of mean monthly maximum temperature of Thailand using mapping analysis method: A case study of summer 1987 to 2019. E3S Web Conf. 2020, 158, 01001. [Google Scholar] [CrossRef]
  17. Phumkokrux, N. Trend analysis and prediction of temperature change in the continental, Thailand. Bull. Serbian Geogr. Soc. 2023, 103, 65–86. [Google Scholar] [CrossRef]
  18. Kornkosa, S.; Phumkokrux, N.; Pattanasak, P.; Manajitprasert, S. Analysis and Prediction of Meteorological Drought Area by Using Standardized Precipitation Index in Northeast, Thailand. Int. J. Environ. Sci. Dev. 2021, 12, 372–376. [Google Scholar] [CrossRef]
  19. Köppen, W. Versuch einer Klassifikation der Klimate, vorzugsweise nach ihren Beziehungen zur Pflanzenwelt. Geogr. Z. 1900, 6, 593–611. [Google Scholar]
  20. Geiger, R.; Pohl, W. Eine neue Wandkarte der Klimagebiete der Erde nach W. Köppens Klassifikation (A New Wall Map of the Climatic Regions of the World According to W. Köppen’s Classification). Erdkunde 1954, 8, 58–61. [Google Scholar]
  21. Phumkokrux, N. Köppen-Geiger Climate System Classification and Forecasting in Thailand. Folia Geogr. 2021, 63, 108–134. [Google Scholar]
  22. Thornthwaite, C.W. Problems in the classification of climates. Geogr. Rev. 1943, 33, 233–255. [Google Scholar] [CrossRef]
  23. Thornthwaite, C.W. An approach toward a rational classification of climate. Geogr. Rev. 1948, 38, 55–94. [Google Scholar] [CrossRef]
  24. Gharsallah, O.; Facchi, A.; Gandolfi, C. Comparison of six evapotranspiration models for a surface irrigated maize agro-ecosystem in Northern Italy. Agric. Water Manag. 2013, 130, 119–130. [Google Scholar] [CrossRef]
  25. Ghiat, I.; Mackey, H.R.; Al-Ansari, T. A review of evapotranspiration measurement models, techniques and methods for open and closed agricultural field applications. Water 2021, 13, 2523. [Google Scholar] [CrossRef]
  26. Tegos, A.; Stefanidis, S.; Cody, J.; Koutsoyiannis, D. On the Sensitivity of Standardized-Precipitation-Evapotranspiration and Aridity Indexes Using Alternative Potential Evapotranspiration Models. Hydrology 2023, 10, 64. [Google Scholar] [CrossRef]
  27. Aschonitis, V.; Touloumidis, D.; ten Veldhuis, M.C.; Coenders-Gerrits, M. Correcting Thornthwaite potential evapotranspiration using a global grid of local coefficients to support temperature-based estimations of reference evapotranspiration and aridity indices. Earth Syst. Sci. Data 2022, 14, 163–177. [Google Scholar] [CrossRef]
  28. Carter, D.B.; Mather, J.R. Climatic Classification for Environmental Biology; CW Thornthwaite Associates, Laboratory of Climatology: Elmer, NJ, USA, 1966. [Google Scholar]
  29. Thornthwaite, C.W. The water balance. Public Clim. 1955, 8, 1–104. [Google Scholar]
  30. Sriwongsitanon, N.; Suwawong, T.; Thianpopirug, S.; Williams, J.; Jia, L.; Bastiaanssen, W. Validation of seven global remotely sensed ET products across Thailand using water balance measurements and land use classifications. J. Hydrol. Reg. Stud. 2020, 30, 100709. [Google Scholar] [CrossRef]
  31. Pomoim, N.; Hughes, A.C.; Trisurat, Y.; Corlett, R.T. Vulnerability to climate change of species in protected areas in Thailand. Sci. Rep. 2022, 12, 5705. [Google Scholar] [CrossRef] [PubMed]
  32. TMD Knowledge. Available online: https://tmd-dev.azurewebsites.net/ (accessed on 6 October 2023).
  33. Bran, S.H.; Macatangay, R.; Surapipith, V.; Chotamonsak, C.; Chantara, S.; Han, Z.; Li, J. Surface PM2.5 mass concentrations during the dry season over northern Thailand: Sensitivity to model aerosol chemical schemes and the effects on regional meteorology. Atmos. Res. 2022, 277, 106303. [Google Scholar] [CrossRef]
  34. Jalilibal, Z.; Amiri, A.; Castagliola, P.; Khoo, M.B. Monitoring the coefficient of variation: A literature review. Comput. Ind. Eng. 2021, 161, 107600. [Google Scholar] [CrossRef]
  35. Al-Mutairi, M.; Labban, A.; Abdeldym, A.; Abdel Basset, H. Trend Analysis and Fluctuations of Winter Temperature over Saudi Arabia. Climate 2023, 11, 67. [Google Scholar] [CrossRef]
  36. PimenteL-Gomes, F. Curso de Estatística Experimental, 15th ed.; FEALQ: Piracicaba, Brazil, 2015; p. 451. [Google Scholar]
  37. Ferreira, J.P.; Schmildt, E.R.; Schmildt, O.; Cattaneo, L.F.; Alexandre, R.S.; Cruz, C.D. Comparison of methods for classification of the coefficient of variation in papaya. Rev. Ceres 2016, 63, 138–144. [Google Scholar] [CrossRef]
  38. Conquest, L.L. Assessing the statistical effectiveness of ecological experiments: Utility of the coefficient of variation. Int. J. Environ. Stud. 1983, 20, 209–221. [Google Scholar] [CrossRef]
  39. Al-Kallas, S.; Al-Mutairi, M.; Abdel Basset, H.; Abdeldym, A.; Morsy, M.; Badawy, A. Climatological Study of Ozone over Saudi Arabia. Atmosphere 2021, 12, 1275. [Google Scholar] [CrossRef]
  40. Kamel, A.M.; Abdel Basset, H.; Sayad, T. Rainfall analysis and variability over Egypt. Al-Azhar Bull. Sci. 2017, 28, 41–62. [Google Scholar]
  41. Pavia, E.G.; Graef, F. The recent rainfall climatology of the Mediterranean Californias. J. Clim. 2002, 15, 2697–2701. [Google Scholar] [CrossRef]
  42. Pettitt, A.N. A non-parametric approach to the change-point problem. J. R. Stat. Soc. Ser. C 1979, 28, 126–135. [Google Scholar] [CrossRef]
  43. Das, S.; Banerjee, S. Investigation of changes in seasonal streamflow and sediment load in the Subarnarekha-Burhabalang basins using Mann-Kendall and Pettitt tests. Arab. J. Geosci. 2021, 14, 946. [Google Scholar] [CrossRef]
  44. Mallakpour, I.; Villarini, G. A simulation study to examine the sensitivity of the Pettitt test to detect abrupt changes in mean. Hydrol. Sci. J. 2016, 61, 245–254. [Google Scholar] [CrossRef]
  45. Sa’adi, Z.; Shahid, S.; Ismail, T.; Chung, E.S.; Wang, X.J. Trends analysis of rainfall and rainfall extremes in Sarawak, Malaysia using modified Mann–Kendall test. Meteorol. Atmos. Phys. 2019, 131, 263–277. [Google Scholar] [CrossRef]
  46. Agbo, E.P.; Ekpo, C.M. Trend analysis of the variations of ambient temperature using Mann-Kendall test and Sen’s estimate in Calabar, southern Nigeria. J. Phys. Conf. Ser. 2021, 1734, 012016. [Google Scholar] [CrossRef]
  47. Garba, H.; Udokpoh, U.U. Analysis of trend in meteorological and hydrological time-series using Mann-Kendall and Sen’s slope estimator statistical test in Akwa Ibom state, Nigeria. Int. J. Environ. Clim. Change 2023, 13, 1017–1035. [Google Scholar] [CrossRef]
  48. Gowthaman, T.; Kumar, S.; Bhattacharyya, B. Detecting air pollutants trends using Mann-Kendall tests and Sen’s slope estimates. Environ. Conserv. J. 2023, 24, 157–166. [Google Scholar]
  49. World Meteorological Organization. Guide to Climatological Practices, 2nd ed.; WMO: Geneva, Switzerland, 2018. [Google Scholar]
  50. Aditya, F.; Gusmayanti, E.; Sudrajat, J. Rainfall trend analysis using Mann-Kendall and Sen’s slope estimator test in West Kalimantan. In IOP Conference Series: Earth and Environmental Science; IOP Publishing: Bristol, UK, 2021; p. 012006. [Google Scholar]
  51. Willmott, C.J.; Feddema, J.J. A more rational climatic moisture index. Prof. Geogr. 1992, 44, 84–88. [Google Scholar] [CrossRef]
  52. Al-Sudani, H.I.Z. Temperature–potential evapotranspiration relationship in Iraq using Thornthwaite method. J. Univ. Babylon Eng. Sci. 2019, 27, 16–25. [Google Scholar] [CrossRef]
  53. Feddema, J.J. A revised Thornthwaite-type global climate classification. Phys. Geogr. 2005, 26, 442–466. [Google Scholar] [CrossRef]
  54. Thailand-Subnational Administrative Boundaries. Available online: https://data.humdata.org/dataset/cod-ab-tha? (accessed on 16 October 2020).
  55. Climatological Data for the Period 1981–2010. Available online: http://climate.tmd.go.th/content/file/75 (accessed on 6 October 2023).
  56. Pakarnseree, R.; Chunkao, K.; Bualert, S. Physical characteristics of Bangkok and its urban heat island phenomenon. Build. Environ. 2018, 143, 561–569. [Google Scholar] [CrossRef]
  57. Khamchiangta, D.; Dhakal, S. Physical and non-physical factors driving urban heat island: Case of Bangkok Metropolitan Administration, Thailand. J. Environ. Manag. 2019, 248, 109285. [Google Scholar] [CrossRef] [PubMed]
  58. Jansri, S.; Ketpichainarong, W. Investigating In-Service Science Teachers Conceptions of Astronomy, and Determine the Obstacles in Teaching Astronomy in Thailand. Int. J. Educ. Methodol. 2020, 6, 745–758. [Google Scholar] [CrossRef]
  59. Srivanit, M.; Jareemit, D. Modeling the influences of layouts of residential townhouses and tree-planting patterns on outdoor thermal comfort in Bangkok suburb. J. Build. Eng. 2020, 30, 101262. [Google Scholar] [CrossRef]
  60. History & Geography & Geology. Available online: https://www.tourismthailand.org/Articles/plan-your-trip-history-and-geography-geology (accessed on 6 October 2023).
  61. Yuan, S.; Ren, Z.; Shan, X.; Deng, Q.; Zhou, Z. Seasonal different effects of land cover on urban heat island in Wuhan’s metropolitan area. Urban Clim. 2023, 49, 101547. [Google Scholar] [CrossRef]
  62. Trewartha, G.T. An Introduction to Weather and Climate, 4th ed.; McGraw-Hill: New York, NY, USA, 1968; pp. 27–28. [Google Scholar]
  63. Weather Summary (Yearly). Available online: http://climate.tmd.go.th/content/category/17?lang=en (accessed on 6 October 2023).
  64. ENSO. Available online: http://climate.tmd.go.th/content/category/23?lang=en (accessed on 6 October 2023).
  65. Voladet, S.; Chaleusinh, C. Climate change and water scarcity in Champhone district, Savannakhet province, Lao PDR. In Developmemt and Climate Change in the Mekong Region; Strategic Information and Research Development Centre: Petaling Jaya, Malaysia, 2019; pp. 189–214. [Google Scholar]
  66. Sein, K.K.; Chidthaisong, A.; Oo, K.L. Observed Trends and Changes in Temperature and Precipitation Extreme Indices over Myanmar. Atmosphere 2018, 9, 477. [Google Scholar] [CrossRef]
  67. Mie Sein, Z.M.; Ullah, I.; Syed, S.; Zhi, X.; Azam, K.; Rasool, G. Interannual Variability of Air Temperature over Myanmar: The Influence of ENSO and IOD. Climate 2021, 9, 35. [Google Scholar] [CrossRef]
  68. Thoeun, H.C. Observed and projected changes in temperature and rainfall in Cambodia. Weather Clim. Extrem. 2015, 7, 61–71. [Google Scholar] [CrossRef]
  69. Trakolkul, C.; Satirapod, C. Analysis of PWV derived from the GNSS CORS stations for determining the onset of the southwest monsoon in Thailand. Int. J. Geoinform. 2020, 16, 71–78. [Google Scholar]
  70. Limsakul, A.; Singhruck, P.; Wang, L. Climatology and Spatio-Temporal Variability of Wintertime Total and Extreme Rainfall in Thailand during 1970–2012. Environ. Asia 2017, 10, 162–176. [Google Scholar]
  71. Yang, K.; Han, G. Controls over hydrogen and oxygen isotopes of surface water and groundwater in the Mun River catchment, northeast Thailand: Implications for the water cycle. Hydrogeol. J. 2020, 28, 1021–1036. [Google Scholar] [CrossRef]
  72. Pinidluek, P.; Konyai, S.; Sriboonlue, V. Regionalization of rainfall in Northeastern Thailand. Geomate J. 2020, 18, 135–141. [Google Scholar] [CrossRef]
  73. Mahavik, N.; Tantanee, S.; Masthawee, F. Investigation of ZR relationships during tropical storm in GIS using implemented mosaicking algorithms of radar rainfall estimates from ground-based weather radar in the Yom River basin, Thailand. Appl. Geomat. 2021, 13, 645–657. [Google Scholar] [CrossRef]
  74. Inter-Tropical Convergence Zone. Available online: https://www.noaa.gov/jetstream/tropical/convergence-zone (accessed on 16 October 2020).
  75. Dandridge, C.; Lakshmi, V.; Bolten, J.; Srinivasan, R. Evaluation of Satellite-Based Rainfall Estimates in the Lower Mekong River Basin (Southeast Asia). Remote Sens 2019, 11, 2709. [Google Scholar] [CrossRef]
  76. Duan, X.; Gu, Z.; Li, Y.; Xu, H. The spatiotemporal patterns of rainfall erosivity in Yunnan Province, southwest China: An analysis of empirical orthogonal functions. Glob. Planet. Chang. 2016, 144, 82–93. [Google Scholar] [CrossRef]
  77. Amatayakul, P. Estimating the Monthly Effective Rainfall Using Dependable Rainfall at 80% in Thailand; Thai Meteorological Department: Bangkok, Thailand, 2006; p. 54. [Google Scholar]
  78. Chiu, C.T.; Wang, K.; Paschalis, A.; Erfani, T.; Peleg, N.; Fatichi, S.; Theeuwes, N.; Manoli, G. An analytical approximation of urban heat and dry islands and their impact on convection triggering. Urban Clim. 2022, 46, 101346. [Google Scholar] [CrossRef]
  79. Hu, S.; Mo, X. Attribution of Long-Term Evapotranspiration Trends in the Mekong River Basin with a Remote Sensing-Based Process Model. Remote Sens 2021, 13, 303. [Google Scholar] [CrossRef]
  80. Elguindi, N.; Grundstein, A.; Bernardes, S.; Turuncoglu, U.; Feddema, J. Assessment of CMIP5 global model simulations and climate change projections for the 21st century using a modified Thornthwaite climate classification. Clim. Change 2014, 122, 523–538. [Google Scholar] [CrossRef]
  81. Puttanapong, N.; Luenam, A.; Jongwattanakul, P. Spatial Analysis of Inequality in Thailand: Applications of Satellite Data and Spatial Statistics/Econometrics. Sustainability 2022, 14, 3946. [Google Scholar] [CrossRef]
  82. Huang, X.; Stevenson, S.; Hall, A.D. Future warming and intensification of precipitation extremes: A “double whammy” leading to increasing flood risk in California. Geophys. Res. Lett. 2020, 47, e2020GL088679. [Google Scholar] [CrossRef]
  83. Oakley, N.S.; Cannon, F.; Munroe, R.; Lancaster, J.T.; Gomberg, D.; Ralph, F.M. Brief communication: Meteorological and climato-logical conditions associated with the 9 January 2018 post-fire debris flows in Montecito and Carpinteria, California, USA. Nat. Hazards Earth Syst. Sci. 2018, 18, 3037–3043. [Google Scholar] [CrossRef]
  84. White, A.B.; Moore, B.J.; Gottas, D.J.; Neiman, P.J. Winter storm conditions leading to excessive runoff above California’s Oroville Dam during January and February 2017. Bull. Am. Meteorol. Soc. 2019, 100, 55–70. [Google Scholar] [CrossRef]
  85. Huang, X.; Stevenson, S. Contributions of climate change and ENSO variability to future precipitation extremes over California. Geophys. Res. Lett. 2023, 50, e2023GL103322. [Google Scholar] [CrossRef]
Figure 1. (a) Thailand boundary and meteorological station points, (b) Digital Elevation Model: DEM of Thailand (Applied from USGS Earth Explorer; source: https://earthexplorer.usgs.gov/ (accessed on 31 May 2023)).
Atmosphere 15 00379 g001
Figure 2. The spatial distribution in Thailand during 1987 to 2021 (a) Annual Temperature (Tann), (b) Coefficient of Variation (%CV), (c) Sen’s slope (°C/year), and (d) Kendall’s tau value.
Atmosphere 15 00379 g002
Figure 3. (a) Monthly Temperature in time series during 1987 to 2021, (b) Annual Temperature in time series during 1987 to 2021 (orange line), Cumulative mean: CSM through the period (pink line), CSM before and after abrupt change (green and red lines), Sen’s slope value (black line), (c) Summer Temperature in time series during 1987 to 2021 (orange line), (d) Rainy Temperature in time series during 1987 to 2021 (orange line), and (e) Winter Temperature in time series during 1987 to 2021 (orange line).
Atmosphere 15 00379 g003
Figure 4. The spatial distribution in Thailand during 1987 to 2021 (a) Annual Precipitation (Prann), (b) Coefficient of Variation (%CV), (c) Sen’s slope (mm/year), and (d) Kendall’s tau value.
Atmosphere 15 00379 g004
Figure 5. (a) Monthly Precipitation in time series during 1987 to 2021, (b) Annual Precipitation in time series during 1987 to 2021 (blue line), Cumulative mean: CSM through the period (pink line), CSM before and after abrupt change (green and red lines), Sen’s slope value (black line), (c) Summer Precipitation in time series during 1987 to 2021, (d) Rainy Precipitation in time series during 1987 to 2021 (blue line), and (e) Rainy Precipitation in time series during 1987 to 2021 (blue line).
Atmosphere 15 00379 g005
Figure 6. The spatial distribution in Thailand during 1987 to 2021 (a) Potential Evapotranspiration (PETann), (b) Coefficient of Variation (%CV), (c) Sen’s slope (mm/year), and (d) Kendall’s tau value.
Atmosphere 15 00379 g006
Figure 7. (a) Monthly PET in time series during 1987 to 2021, (b) Annual PET in time series during 1987 to 2021 (brown line), Cumulative mean: CSM through the period (pink line), CSM before and after abrupt change (green and red lines), Sen’s slope value (black line), (c) Summer PET in time series during 1987 to 2021 (brown line), (d) Rainy PET in time series during 1987 to 2021 (brown line), and (e) Winter PET in time series during 1987 to 2021 (brown line).
Atmosphere 15 00379 g007
Figure 8. The spatial distribution in Thailand during 1987 to 2021 according to the New Thornthwaite Climate Classification, (a) moisture type, (b) thermal index, (c) seasonality types, and (d) seasonality causes.
Atmosphere 15 00379 g008
Table 1. Information of the meteorological stations in each region of Thailand.
Met. Reg.No. of ProvincesNo. of Met. Stations
Northern Reg.1524
Northeastern Reg.2025
Central Reg.1816
Eastern Reg.813
Southern Reg.1626
Overall, of Thailand77104
Met. Reg. = Meteorological region. Met. Stations = Meteorological stations.
Table 2. Adjustment factors in the TMI equation, separated by latitude and month (Aj) [52].
Lat./MonthJanFebMarAprMayJunJulAugSepOctNovDec
60° N0.540.670.971.191.331.561.551.331.070.840.580.48
50° N0.710.840.981.141.281.361.331.211.060.900.760.68
40° N0.800.890.991.101.201.251.231.151.040.930.830.78
30° N0.870.9311.701.141.171.161.111.030.960.890.85
20° N0.920.9611.051.091.111.101.071.020.980.930.91
10° N0.970.9811.031.051.061.051.041.020.990.970.96
00°111111111111
10° S1.051.041.020.990.970.960.970.9811.031.051.06
20° S1.101.071.020.980.930.910.920.9611.051.091.11
30° S1.161.111.030.940.890.850.870.9611.071.141.17
40° S1.231.151.040.930.830.780.800.980.991.101.201.25
50° S1.331.191.050.980.750.680.700.821.971.131.271.36
Table 3. Moisture index for the New Thornthwaite Climate Classification [53].
Moisture TypeMoisture Index (TMI)
Saturated0.66 to 1.00
Wet0.33 to 0.66
Moist0.00 to 0.33
Dry−0.33 to 0.00
Semi-Arid−0.66 to −0.33
Arid−1.00 to −0.66
Table 4. Thermal Index for the New Thornthwaite Climate Classification [53].
Thermal IndexAnnual PET (mm)
Torrid>1500.0
Hot1200.0 to 1500.0
Warm900.0 to 1200.0
Cool600.0 to 900.0
Cold300.0 to 600.0
Frigid0.0 to 300.0
Table 5. Climate variability for the New Thornthwaite Climate Classification [53].
Climate VariabilityAnnual TMI Range
Low0.0 to 0.5
Medium0.5 to 1.0
High1.0 to 1.5
Extreme1.5 to 2.0
Table 6. Climate variability cause modifiers for the New Thornthwaite Climate Classification [53].
CauseAnnual Pr Range/Annual PET
Precipitation<0.5
Combination0.5 to 2.0
Temperature>2.0
Table 7. Description of temperature in Thailand during 1987 to 2021.
SeasonMin.
(°C)
Max.
(°C)
CMS. (°C)S.D.Kendall’s taup-ValueSen’s Slope (°C/year)CV
(%)
PettittChanging Period
Summer27.1629.328.20.5100.2300.0530.0141.810.173-
Rainy27.5128.427.90.2460.4250.000 **0.0160.880.006 **2013
Winter24.9126.625.60.4320.4420.000 **0.0251.690.017 *1996
Annual26.7028.027.20.3300.469<0.0001 **0.0171.210.002 **2011
Note: * and ** indicate there was a changing trend or changing period with significant levels at 95% and 99%, respectively.
Table 8. Description of Precipitation in Thailand during 1987 to 2021.
SeasonMin.
(mm)
Max.
(mm)
CMS. (mm)S.D.Kendall’s taup-ValueSen’s Slope (mm/Year)CV
(%)
PettittChanging Period
Summer166.4559.2349.198.4−0.0120.932−0.11628.190.919-
Rainy741.21034.0871.169.90.1500.2111.8138.030.388-
Winter202.8587.8376.078.00.2130.0742.08220.750.152-
Annual1320.42001.01596.3160.30.1560.1914.1191.210.497-
Table 9. Description of Potential Evapotranspiration in Thailand during 1987 to 2021.
SeasonMin.
(mm)
Max.
(mm)
CMS. (mm)S.D.Kendall’s taup-ValueSen’s Slope (mm/year)CV
(%)
PettittChanging Period
Summer599.0826.7701.354.80.2240.0611.2007.810.171-
Rainy619.4708.7654.923.70.4080.001**1.4683.620.006**2013
Winter436.4546.4477.626.80.462<0.0001**1.3955.610.005**1996
Annual1790.92171.41943.094.60.4250.000**4.2824.870.004**2011
Note: ** indicates there was a changing trend or changing period with significant levels at 95% and 99%, respectively.
Disclaimer/Publisher’s Note: The statements, opinions and data contained in all publications are solely those of the individual author(s) and contributor(s) and not of MDPI and/or the editor(s). MDPI and/or the editor(s) disclaim responsibility for any injury to people or property resulting from any ideas, methods, instructions or products referred to in the content.

