Article

The Variation in Atmospheric Turbidity over a Tropical Site in Nigeria and Its Relation to Climate Drivers

by
Olanrewaju Olukemi SoneyeArogundade
1,2,* and
Bernhard Rappenglück
1,2
1
Department of Earth and Atmospheric Sciences, University of Houston, Houston, TX 77204-5007, USA
2
Institute for Climate and Atmospheric Science, University of Houston, Houston, TX 77204-5007, USA
*
Author to whom correspondence should be addressed.
Atmosphere 2024, 15(3), 367; https://doi.org/10.3390/atmos15030367
Submission received: 6 February 2024 / Revised: 28 February 2024 / Accepted: 14 March 2024 / Published: 18 March 2024
(This article belongs to the Section Aerosols)

Abstract

:
Atmospheric turbidity exhibits substantial spatial–temporal variability due to factors such as aerosol emissions, seasonal changes, meteorology, and air mass transport. Investigating atmospheric turbidity is crucial for climatology, meteorology, and atmospheric pollution. This study investigates the variation in atmospheric turbidity over a tropical location in Nigeria, utilizing the Ångström exponent (α), the turbidity coefficient (β), the Linke turbidity factor (TL), the Ångström turbidity coefficient (βEST), the Unsworth–Monteith turbidity coefficient (KAUM), and the Schüepp turbidity coefficient (SCH). These parameters were estimated from a six-month uninterrupted aerosol optical depth dataset (January–June 2016) and a one-year dataset (January–December 2016) of solar radiation and meteorological data. An inverse correlation (R = −0.77) was obtained between α and β, which indicates different turbidity regimes based on particle size. TL and βEST exhibit pronounced seasonality, with higher turbidity during the dry season (TL = 9.62 and βEST = 0.60) compared to the rainy season (TL = 0.48 and βEST = 0.20) from May to October. Backward trajectories and wind patterns reveal that high-turbidity months align with north-easterly air flows from the Sahara Desert, transporting dust aerosols, while low-turbidity months coincide with humid maritime air masses originating from the Gulf of Guinea. Meteorological drivers like relative humidity and water vapor pressure are linked to turbidity levels, with an inverse exponential relationship observed between normalized turbidity coefficients and normalized water vapor pressure. This analysis provides insights into how air mass origin, wind patterns, and local climate factors impact atmospheric haze, particle characteristics, and solar attenuation variability in a tropical location across seasons. The findings can contribute to environmental studies and assist in modelling interactions between climate, weather, and atmospheric optical properties in the region.

1. Introduction

Solar radiation serves as the primary energy source for life-sustaining processes on Earth’s surface, encompassing various environmental, physical, and biological processes [1,2,3,4,5]. In the atmosphere, solar radiation undergoes significant attenuation due to two primary mechanisms: scattering and absorption by air molecules, hydrometeors, and aerosol particles. These processes result in a remarkable reduction in the direct solar component and a moderate increase in the diffuse component [4,6,7,8,9,10,11,12,13,14,15]. The attenuation processes of solar radiation exhibit significant variability due to factors such as the apparent motion of the sun, changes in meteorological conditions, and fluctuations in aerosol properties with time across different regions [8]. The turbidity of a certain area is influenced by both the local emissivity, which includes contributions from natural (such as dust and clouds) and anthropogenic sources (such as emissions from cars, factories, etc.), and the characteristics of air mass (e.g., continental vs. maritime), transporting the aerosol particles [14,16,17].
Atmospheric turbidity is a measure of the reduction in the transparency of the atmosphere, primarily caused by the absorption and scattering of solar radiation by water vapor and tiny aerosol particles suspended in the air. These aerosol particles include dust, smoke particles, water droplets, and ice crystals, along with other atmospheric components [8,11,18,19,20,21]. It is a convenient parameter frequently used to assess the optical characteristics of aerosol particles and other pollutants [22]. The monitoring of these particles is crucial due to their daily, seasonal, and long-term variability and their association with global climate change, atmospheric pollution, reduced visibility, and solar radiation extinction [22]. Typically, atmospheric turbidity increases as a result of greater attenuation of solar radiation, leading to a decrease in the intensity of solar radiation beams. Accurate assessment and understanding of atmospheric turbidity play a vital role across various fields, including urban–rural pollution studies, climate change research, and atmospheric chemistry investigations. Additionally, it is useful for diverse applications such as climate and solar radiation extinction modelling, pollution analysis, and the examination of volcanic eruption signatures [20,22,23,24,25,26,27,28]. Furthermore, accurate determination of atmospheric turbidity is essential for calculating direct and diffuse solar radiation at a specific location and for energy-related applications, notably for the installation and operation of solar energy conversion systems, as it directly influences the efficiency of solar collectors [29,30]. The significant impact of Earth’s atmospheric turbidity on solar irradiance at ground level underscores the necessity of quantifying these effects when assessing solar irradiance in specific locations [31]. Also, investigating the sources and distributions of atmospheric turbidity in different locations is essential since clouds, pollutants, and aerosols exhibit considerable spatial and temporal variations, leading to diverse radiative forcing effects at both regional and global scales [25,32,33,34,35,36,37].
Generally, precise assessments of atmospheric turbidity require clear-sky spectral radiation data, which can be measured using spectroradiometers or multi-wavelength solar photometers. However, due to the limited availability and high cost of these sensors, turbidity is typically quantified, characterized, and estimated using broadband irradiance measurements, a more cost-effective method, and various turbidity factors and indices such as the Linke turbidity factor, the Ångström turbidity coefficient, the Schüepp turbidity factor, and the Unsworth–Monteith turbidity coefficient [14,15,20,35,38,39]. Among these, the most frequently used are the Linke turbidity factor (Linke, 1922) [40] and the Ångström turbidity coefficient [41]. The Linke turbidity factor describes the entire spectrum and quantifies the optical thickness of the atmosphere caused by the absorption and scattering of solar radiation by water vapor and aerosol particles in the visible and near-infrared regions relative to a dry and clean atmosphere [4,11,20,35,42,43,44]. Conversely, the Ångström turbidity coefficient and the Unsworth–Monteith turbidity coefficient [45] serve as representatives of the total column amount of atmospheric aerosol particles [4,11,20,46,47]. These parameters help to characterize the degree of atmospheric turbidity or pollution caused by aerosols and are commonly employed in meteorological observations and related atmospheric environment studies [48,49,50,51]. Spectrally, the Ångström turbidity coefficient and the Schüepp turbidity factor (Schüepp, 1949) [52] correspond to the aerosol optical depth (AOD) at wavelengths of 1 µm (base e) and 0.5 µm (base 10), respectively.
Since the introduction of the Linke turbidity factor by [40] and the Ångström turbidity coefficient by [41], numerous researchers have proposed various models, including those by [22,45,52,53,54,55,56,57,58]. These empirical equations have been used to quantify the impacts of air pollutants and aerosols on horizontal visibility degradation and the reduction in solar radiation received at the Earth’s surface under different weather conditions and locations [4,6,8,11,13,14,15,19,20,22,35,43,59,60,61,62,63,64,65,66,67,68,69,70,71,72,73,74]. The extent of the application of all these indices at both regional and global scales remains unclear.
This paper reports the influence of air masses originating from various source areas on atmospheric turbidity characteristics and behavior during both dry and wet seasons, and it evaluates the correlation between meteorological parameters and the atmospheric turbidity coefficients at a tropical site in Nigeria. To the best of our knowledge, this is the first time that such an analysis has been performed for a location in West Africa, which is sensitive to quite different climate regimes under the influence of the inter-tropical discontinuity. The correlations found between turbidity in the atmosphere and climate drivers could lead to more research into the connections between turbidity in the atmosphere and other climate drivers, such as the El Niño Southern Oscillation (ENSO), the Indian Ocean Dipole, or the weather patterns in the Mediterranean, an area that increasingly faces longer and more severe drought periods while exposed to singular events like the extreme rain events in September 2023 caused by storm Daniel in Greece and Libya. This study could offer insights into both similarities and differences in atmospheric turbidity patterns, particularly during distinct climatic events such as the harmattan winds in Nigeria and similar regional and larger-scale phenomena elsewhere.
Considering the significance of atmospheric turbidity in diverse applications, this article evaluates atmospheric turbidity, utilizing the Ångström exponent and the turbidity coefficient, the Linke turbidity factor, the Unsworth–Monteith turbidity, and the Schüepp turbidity coefficients derived from measured aerosol optical depth (AOD) and solar radiation data. Additionally, this study examines the aerosol size distributions and investigates variations in AOD relative to the monthly mean. The impact of air masses originating from different sources on atmospheric turbidity characteristics and behavior during both dry and wet seasons is analyzed using wind speed, wind direction data, and five-day backward trajectories computed by the HYSPLIT (Hybrid Single Particle Lagrangian Integrated Trajectory) model. Furthermore, this paper evaluates and discusses the correlation between meteorological parameters (such as relative humidity, air temperature, and water vapor pressure) measured at the site and the atmospheric turbidity coefficients.

2. Methodology

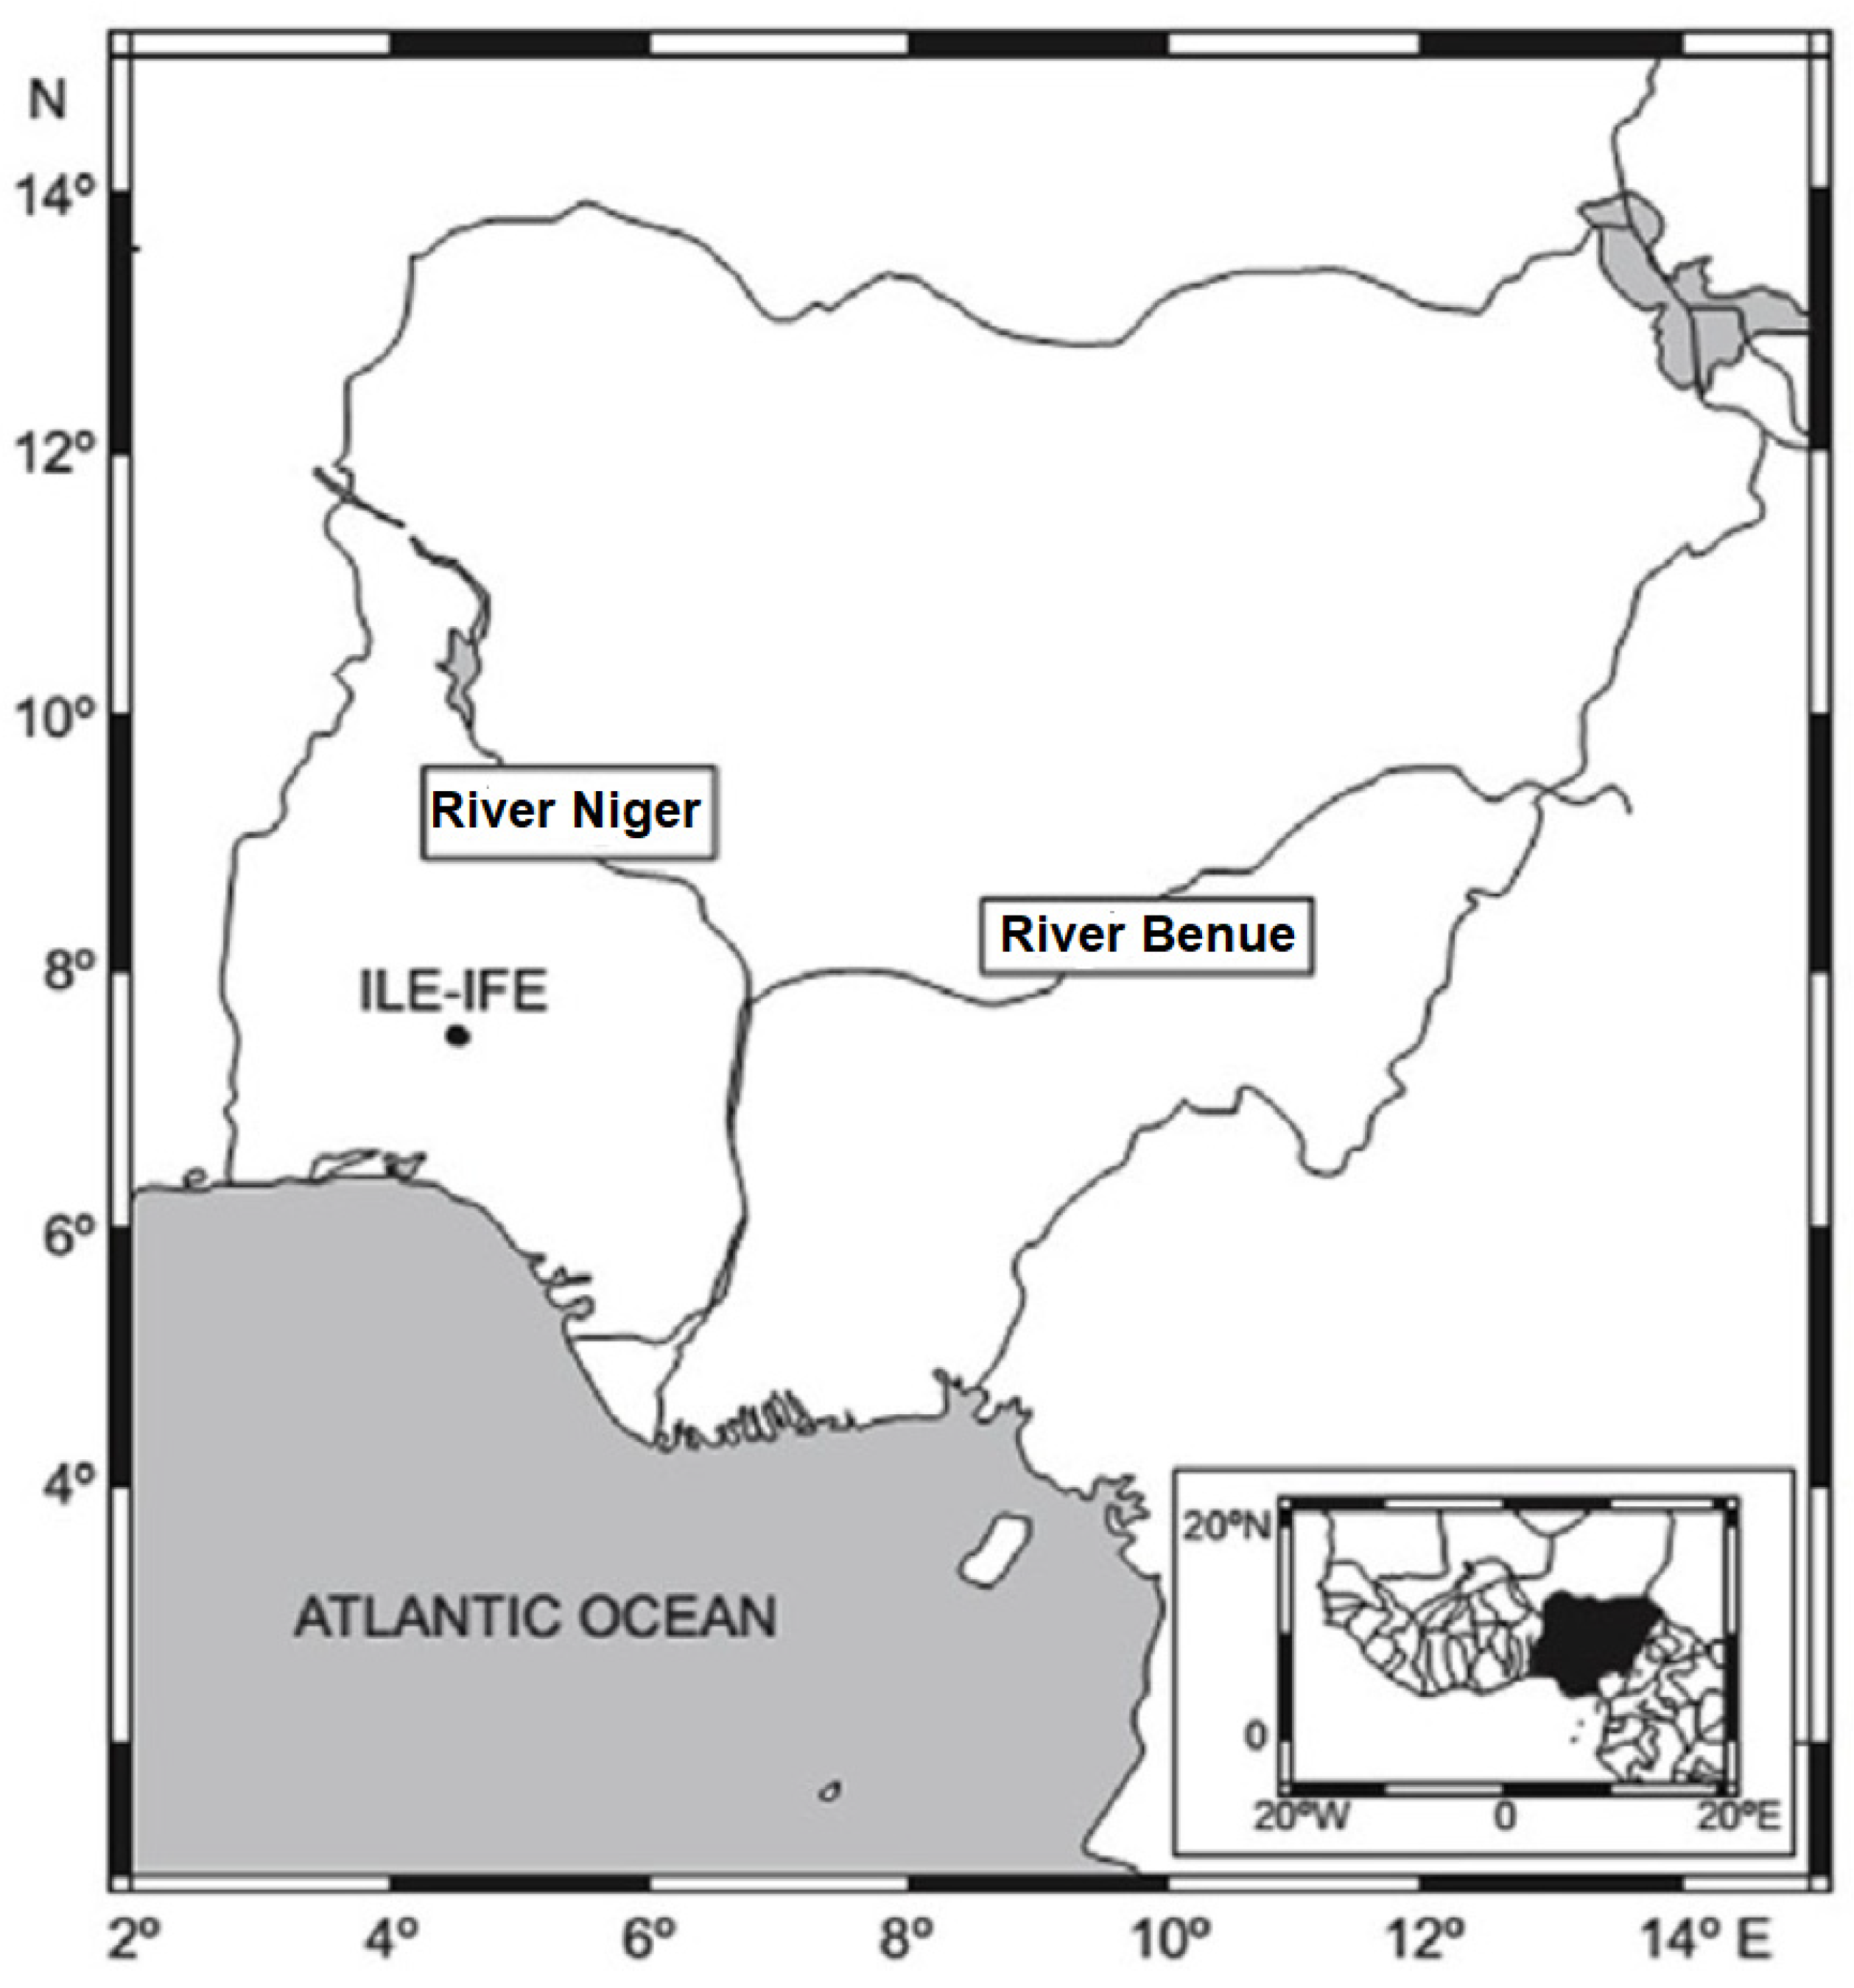
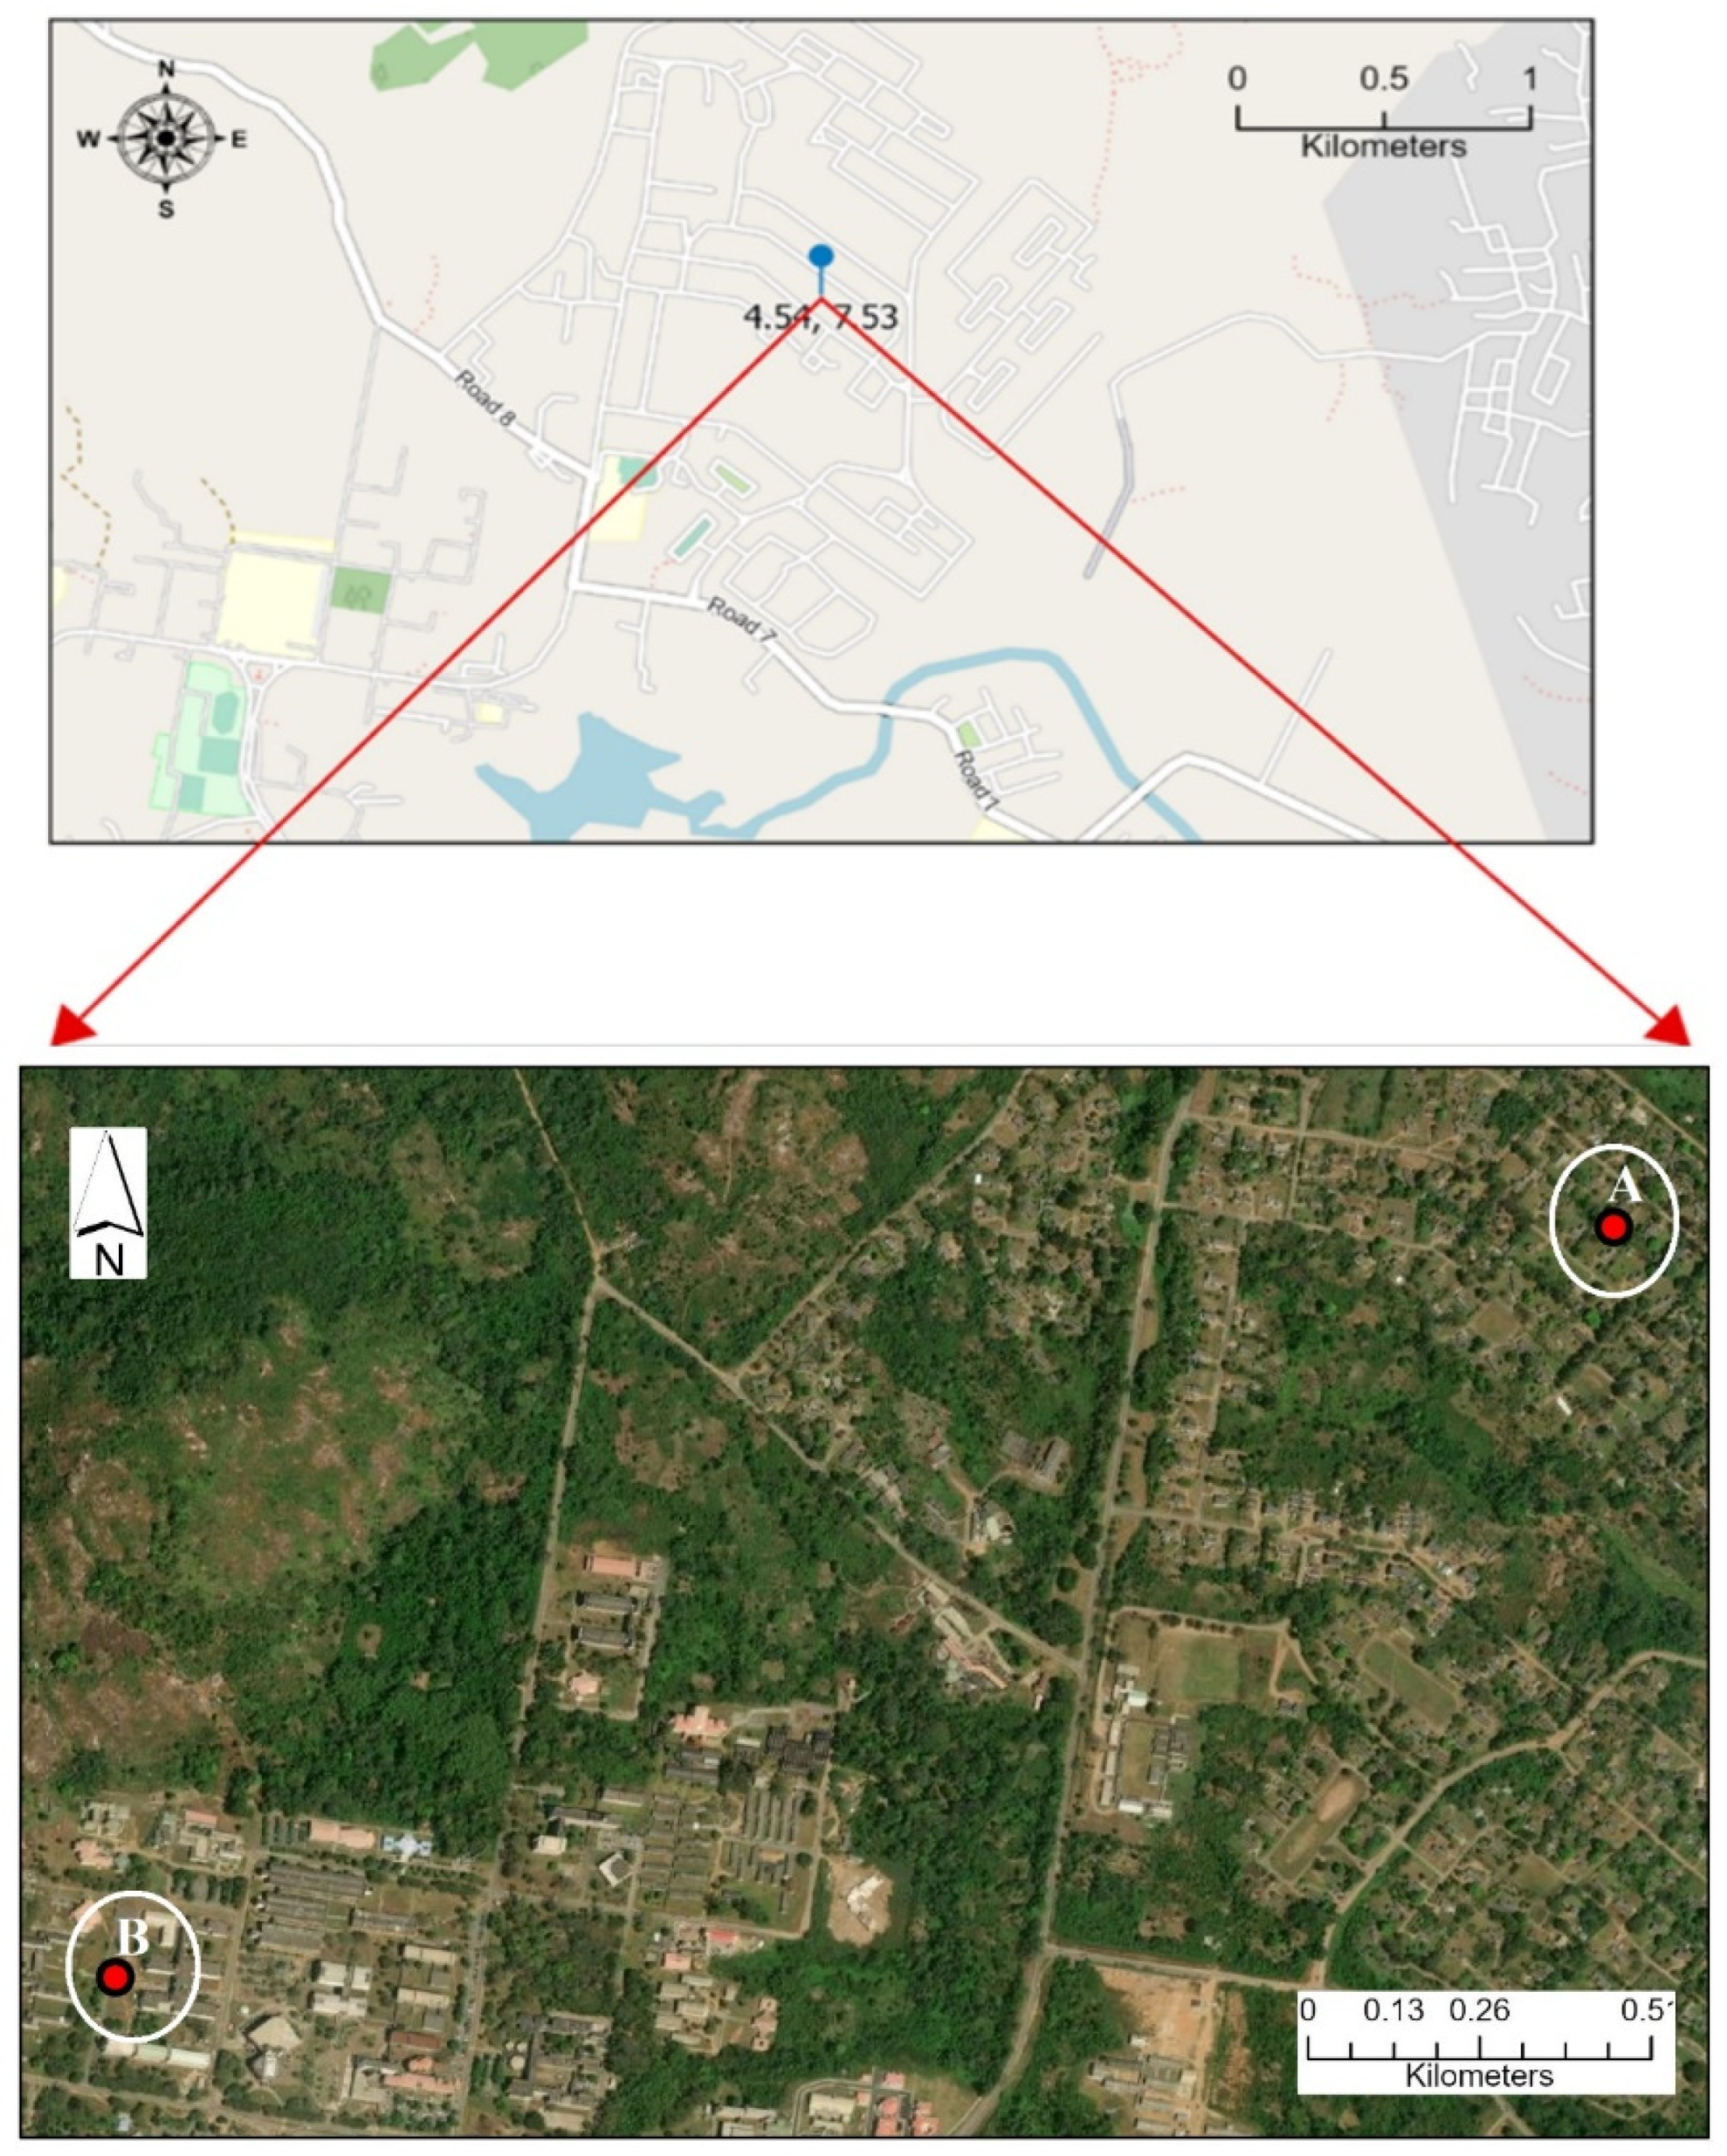
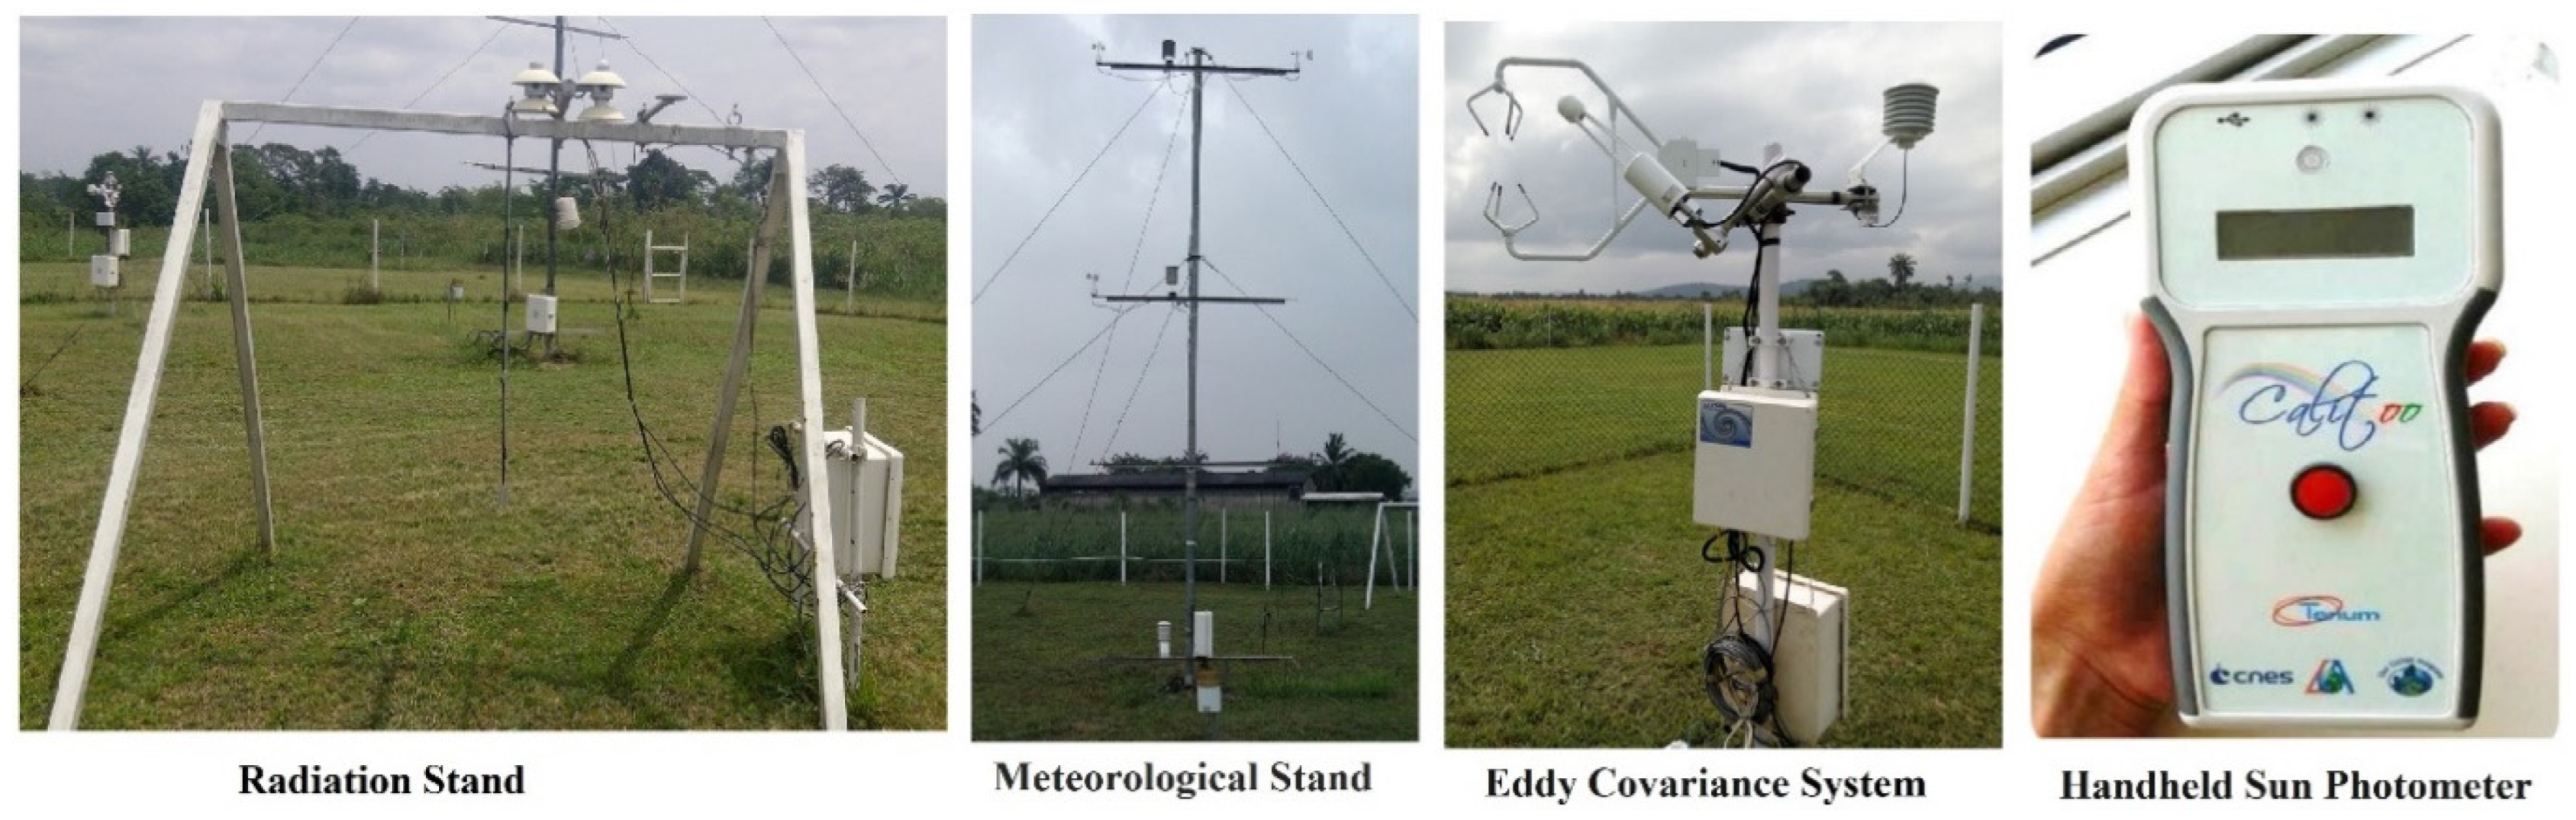
2.1. Study Site and Ground Data

For this research, a one-year dataset covering the period from January to December 2016 of solar radiation and meteorological data and uninterrupted six months aerosol optical depth (AOD) data from January to June 2016 was utilized. These data were obtained from two meteorological points. This timeframe allowed us to observe the transition from the dry to the wet season, which was complemented by visual records of the weather conditions. The two measurement points selected for this study are situated within the Obafemi Awolowo University (OAU)-Met Station at the Teaching and Research (T&R) Farm and on the roof-top of the Department of Physics and Engineering Physics (DP&EP) building at OAU in Ile-Ife, (Latitude: 7.53° N; Longitude: 4.54° E; Elevation: 300 m above sea level) in southwest Nigeria (Figure 1). The measurement point at the T&R farm is covered with short grass and has a sandy–clay–loam soil type. It is located approximately 6 km away from the main campus, in a north-eastern direction.
The study area experiences a monsoonal climate, characterized by two alternating seasons—the dry season and the wet season—in accordance with the movement of the inter-tropical discontinuity (ITD) line. The wet season, lasting from March/April to October, is marked by convective activities and monsoon rains. This is followed by a dry period from November to the end of February that is practically devoid of any convective activity. During the wet season, warm and moist air of maritime origin, from the Gulf of Guinea, moves inland, creating a south-westerly surface airflow over the continental areas of West Africa. In the dry season, a north-easterly surface flow prevails, originating from the Sahara Desert and bringing dry and dusty air known as harmattan dusts ([75,76,77]). The harmattan winds that invigorate dryness occur primarily between November and February/March. These winds are characterized by cold and dry conditions, with temperatures of approximately 9 °C, and a heavy dust-laden wind blowing from north-east to west off the Sahara Desert over West Africa, extending towards the Gulf of Guinea, the Caribbean, and South America [78,79,80,81]. The impact of the harmattan wind includes reduced humidity, a decrease in rainfall, the dispersion of cloud cover, and occasionally the formation of massive dust clouds, resulting in sandstorms. The harmattan wind is considered a natural hazard, because during its passage over the Sahara Desert, it picks up fine dust and large quantities of sand particles, primarily composed of a significant amount of silicon content. These particles typically range in size from 0.5 to 10 µm [82,83]. This accumulation contributes to increased atmospheric turbidity and facilitates the spread of wind-borne diseases across vast distances, spanning thousands of kilometers [80,84]. The surface where these two air masses converge is known as the inter-tropical discontinuity (ITD) line, representing a discontinuity in thermodynamic properties. The ITD line migrates across the subcontinent, ranging from approximately 4°–6° N in January (the peak of the dry season) to reaching up to 22°–25° N in August (the peak of the wet season). Different weather zones exist south of the ITD line as it moves across the subcontinent. The region north of the ITD line, identified as weather zone A, is typically characterized by a lack of convective activity. The weather manifestations over West Africa are influenced by the latitudinal position of the ITD line [5,85,86]. In Ile-Ife, the surface flow is generally weak, with a mean wind speed of less than 1.5 m/s, which is typical for a tropical area. The annual precipitation in Ile-Ife ranges between 1000 and 1500 mm [5,86,87].
The two measurement points met the fetch requirements necessary for allowing unobstructed airflow and also provided favorable conditions for a variety of meteorological measurements and observations because they are situated on open and flat terrains, devoid of obstructions such as trees, walls, or buildings. The roof-top of the DP&EP on the OAU campus was chosen for the measurements of AOD because it afforded optimum exposure to the Calitoo sun photometer sensor without appreciable obstacles for the incoming solar radiation due to its height (12.9 m above ground level). The acquired AOD data were representative of AOD over the two measurement points since both were within the same geographical location [77].
At the T&R station, continuous measurements of incoming solar radiation were conducted using a high-quality SR01 pyranometer (ISO-class) with a spectral range between 0.3 and 2.8 µm, positioned facing upward. This pyranometer was integrated into a four-component net radiometer (model NR01, Hukseflux, North Logan, UT, USA) sensor, which was installed at a height of 2.0 m above the ground surface. Simultaneously, the relative humidity and air temperature were measured using a temperature and humidity probe (model HMP45C, Campbell Scientific, North Logan, UT, USA) positioned at a height of 2 m above the ground surface (see Figure 2). In addition, the wind speed and wind directions were measured using a three-dimensional ultrasonic anemometer (model CSAT3, Campbell Scientific, North Logan, UT, USA), which was incorporated into an eddy covariance system [77,86,88].
On the roof top of the DP&EP building on the OAU campus, a portable (handheld) sun photometer model Calitoo (Tenum Inc., Toulouse Cedex, France) was used to measure the spectral raw measurements of the total atmospheric transmittance, as shown in Figure 3. Manual measurements of the atmospheric transmittance were taken at three different wavelengths—465 nm, 540 nm, and 619 nm—which correspond to the blue, green, and red bands within the visible region of the electromagnetic spectrum. These measurements were conducted approximately at local noon, between 12:30 h and 13:30 h local time (LT), when the sun is at its zenith for clear sky days. The raw values obtained at each wavelength were automatically converted into AOD values, digitized, and manually stored using various in-built tools and software available in the sun photometer [77,89]. Also, a pyranometer (model CS300, Campbell Scientific, USA) was operated at the same location as the sun photometer, installed at a height of 2.0 m, to measure the incoming solar radiation. This measurement was compared with data from other pyranometers installed at the OAU-Met Station at the T&R farm to ensure correlation and consistency. The detailed information about the sensors installed at the site, including their accuracy, is listed in Table S1 in the Supplementary Material.
The actinometric, temperature, and relative humidity data were recorded as one-minute values in units of W/m2. These one-minute measurements were used to calculate the monthly average daily values of incoming solar radiation in W/m2. Further details regarding sensor calibration and maintenance can be found in the works of [5,86]. For wind speed and wind directions, data sampling was performed at a frequency of 10 Hz. The raw data underwent a quality assurance and quality control (QA/AC) protocol to ensure data accuracy and reliability. Subsequently, the data were reduced to 30 min average values, which were used for the subsequent analysis.
For data storage and retrieval, Campbell Scientific programmable data loggers were employed (models CR10X and CR1000, Campbell Scientific, USA) for the actinometric, temperature and relative humidity, wind speed, and wind directions, as shown in Figure 3. On the other hand, Calitoo has an inbuilt microprocessor, memory, measurement, and data processing tools and software that handle measurements and storage in conjunction with a certified Windows-based user software, CDM v2.12.06 WHQL, preinstalled on a laptop. The datasets have been grouped as follows: wet season (April, May, June, July, August, September, and October), transitional periods (November and March), and dry season (December, January, and February). The wind directions data were analyzed into three dominant directions, which are the north-eastern (defined as N to ESE), north-western (defined as W to NNW), and southern (defined as SE to WSW). These directional classifications allowed for a comprehensive examination of the prevailing wind patterns during the study period.

2.2. Computation Methodology

The chosen methods offer flexibility and provide a direct means of obtaining all four turbidity coefficients currently in use without compromising accuracy.

2.2.1. The Linke Turbidity Coefficient

The Linke turbidity factor TL is used to determine the direct normal irradiance over the whole solar spectrum at the Earth’s surface, and its values for the study site were calculated using [8,20]:
T L = 0.9 + 9.4 sin Ψ ln G 0 E 0 S C G b
where G b represents the direct (beam) solar radiation, G 0 is the daily extra-terrestrial solar radiation at the top of the atmosphere, E 0 S C is the eccentricity factor due to the variation in the sun–Earth distance, and Ψ is the solar elevation angle. The units of G b and G 0 are W/m2. The expression used for calculating G 0 is listed Equation (S1) in the Supplementary Materials.
The direct-beam solar radiation was calculated from the values of the incoming solar radiation, diffuse solar radiation, and the solar zenith angle ( θ ) using the relation (Ellouz et al., 2013; El-Metwally, 2013) [11,35]:
G b = G G f cos θ
where G is the measured incoming solar radiation (unit W/m2) and G f is the diffuse solar radiation (unit W/m2). The zenith angle was calculated using the expression in Equation (S9) in the Supplementary Materials.
The water vapor pressure ( e V ) was calculated from the relative humidity ( R H ) and temperature ( T ) using the expression:
e V = R H × 6.1121 e x p 17.502 T T + 240.97 100
The units of e V , R H , and T are hPa, %, and °C, respectively.

2.2.2. The Ångström Turbidity Coefficient

The experimental determination of the Ångström exponent and the turbidity coefficient was obtained from AOD data measured between January and December 2016 at the study site in the wavelengths 465–540 nm where absorption is negligible. The method employed for this determination involved a direct fit of the exponential law, which represents the relationship between AOD and wavelength, to the experimental data. This fit produces a single value for each of the coefficients α and β valid for the whole band. The Ångström exponential law used for the estimation of the Ångström coefficients can be expressed as follows) [8,41,49,71,77]:
K A λ = β λ α
where K A λ is the AOD at the wavelength including attenuation due to all types of aerosol particles, that is, dry or wet particles, β is the Ångström turbidity coefficient, α is the Ångström wavelength exponent and λ is the wavelength in micrometers, μm [77]. α is a fundamental measure of the aerosol size distribution with a typical value ranging from approximately 4, for small particles like biomass burning aerosols or anthropogenic aerosols around industrial areas. On the other hand, for large dust aerosols in areas near the Saharan desert, the α value is less than 0.5 [1,90,91,92,93]. Thus, the value of α for the average continental aerosol particles has been discovered by Ångström and confirmed by other researchers such as [69] to be α = 1.3 [41,77,94]. Ångström turbidity β has typical values that vary between 0 and 0.5 or even higher, with a zero value indicating a clean atmosphere free from aerosol particles [13,71,77,95].
Alternatively, the estimation of the Ångström turbidity coefficient was derived from the solar radiation data [11,22] using the expression:
β = b 1 b 2 1 + 1 + 4 b 2 K A λ b 1 2 0.5 / 2
where b 1 and b 2 are both auxiliary quantities and are parameterized functions which depend on both optical air mass ( m a ) and precipitable water content. These parameters were determined using Equations (S10)–(S20) in the Supplementary Materials.

2.2.3. The Unsworth–Monteith Coefficient

The Unsworth–Monteith coefficient is equal to the AOD, K A λ and was estimated using Equation (6). It is worth noting that this coefficient exhibits only a slight dependence on both the solar zenith angle and the precipitable water content. As a result, K A λ serves as a relatively accurate approximation of a pure turbidity coefficient [11,22,45].
K A λ = 1 m a ln I 0 G b m r K C K W K N T
where m a is the optical air mass, m r is the Rayleigh scattering optical mass, K N T is the tropospheric nitrogen dioxide optical depth = 0.0287, K W is the water vapor optical depth = 0.1119 and K C is the clean dry atmosphere broadband optical depth = 0.1197.
m a = 1 cos θ
m r = cos θ + 0.031141 θ 0.1 92.4836 θ 1.3814 1
Since optical masses are sensitive to the actual constituent vertical density profile, thus, the aerosol, water vapor, and tropospheric nitrogen dioxide profiles are sufficiently close to each other (Gueymard, 1998) [22].

2.2.4. The Schüepp Turbidity Coefficient

The Schüepp turbidity coefficient ( B ) was calculated from β for α = 1.3 using the mathematical expression (Schüepp, 1949; Gueymard, 1998) [22,52]:
B = 2 α β ln 10

2.3. Selection of Clear-Sky Data

To accurately assess clear-sky atmospheric conditions, establishing a precise definition of a clear day is crucial, as the presence of clouds can render the turbidity index unrealistic. Various definitions have been proposed in the literature [1,8,35,44,96] to identify cloudless skies. For this study, the following clear-sky criteria were adopted:
  • The hours during which normal direct solar radiation falls below 200 W/m2 were disregarded to eliminate the early morning and near-sunset hours when diffuse radiation is prevalent.
  • The ratio of daily diffuse radiation to daily incoming solar radiation on the horizontal plane should be 0.3 or less.
  • The dataset with a cloud amount ≤ 0.1, a clearness index ≤ 0.13, and high air temperature between 30 and 38 °C was used for this study [86]. The cloud amount and the clearness index were determined using equations proposed by [97], Equations (S21) and (S22) in the Supplementary Materials [86].
The data that met the above criteria for cloudless skies was selected for analysis in this study. This selection process served as a restrictive factor on the number of measurement periods, ensuring the use of only clear-sky data for the analysis.
The coefficient of variation (CV), which is the ratio of the standard deviation of the daily measurements to the average of these measurements, was calculated to investigate the temporal pattern and departure from the monthly mean (DMM) of the AOD over the study site. The percentage departure from the monthly average was calculated with reference to [98]. In order to study the effect of wind speed and direction on turbidity and identify potential aerosol sources, the wind direction data were analyzed statistically. The data were categorized into the three dominant directions: north-eastern (N, NNE, NE, ENE, E, ESE), north-western (W, WNW, NW, NNW), and southern (SE, SSE, S, SSW, SW, WSW), as well as sixteen sectors.

2.4. Trajectory Modelling (HYSPLIT)

The origin and patterns of the air mass flow arriving at the measurement site in order to characterize the variations and trends shown by the atmospheric turbidity coefficients at the site were carried out using 5-day backward trajectory analysis. The backward trajectories were obtained using the HYSPLIT (Hybrid Single Particle Lagrangian Integrated Trajectory) model, which is a widely used atmospheric transport and dispersion model [99,100,101]. The model utilized the Global Data Assimilation System (GDAS) archive provided by the National Oceanic and Atmospheric Administration (NOAA), with spatial and temporal resolutions of 1.0° and 3 h, respectively, to retrieve the trajectories. For the HYSPLIT analysis we selected some representative days for each season, i.e., dry, wet, transitional (see Section 3.4). For each of the days, the backward trajectories were computed at three heights: 500 m, 1500 m, and 3000 m above ground level (agl). The selected days and heights were carefully chosen to provide a good representative view of the air mass flow pattern for the study site. The lowest level of 500 m and the upper level of 3000 m were selected to capture both the surface air mass origin and the high-altitude, long-range Sahara dust layers [11,93]. This was essential for understanding the potential influence of dust events on aerosol concentrations, as such events are common during the dry season (November–February). Since these trajectories can travel through various geographical sectors before reaching the site, the air mass was assigned to a specific geographical sector if its residence time in that sector is more than 50%, regardless of the point of origin of the backward trajectory [11,102]. This approach allowed for better characterization of the air mass flow from different regions before reaching the study site.

3. Results and Discussion

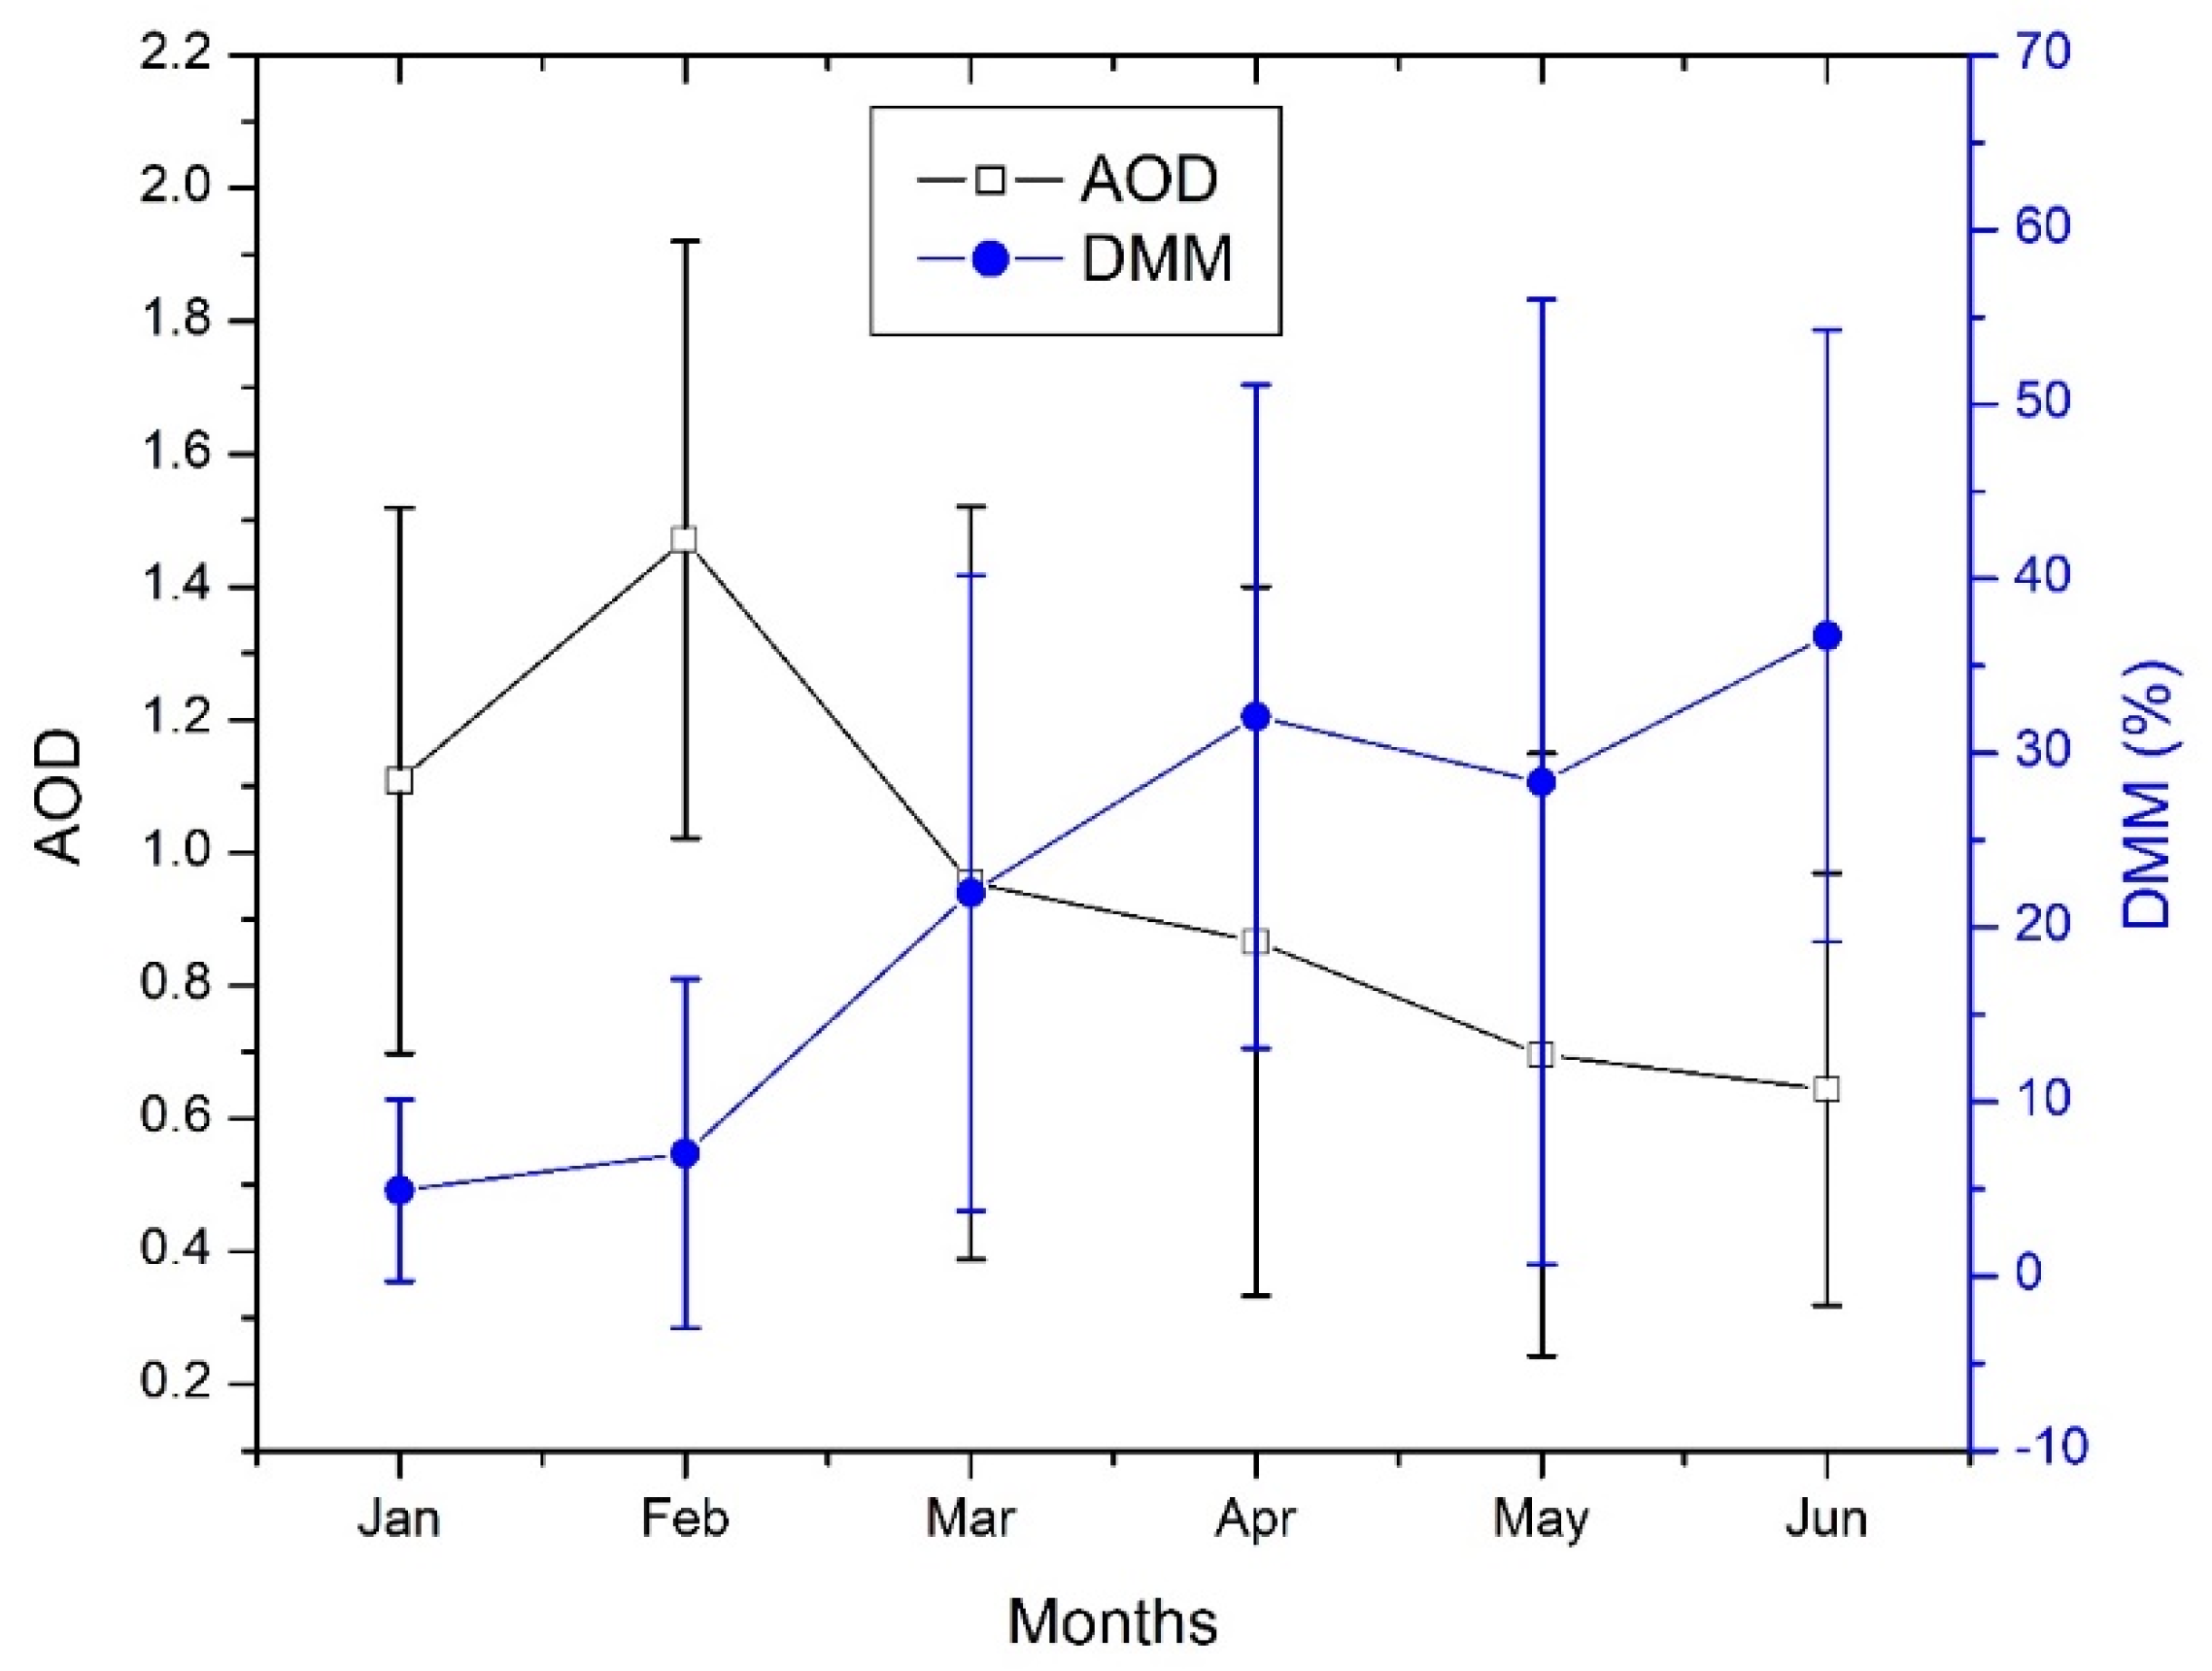
3.1. Variations in Aerosol Optical Depth

Figure 4 illustrates the monthly variation in aerosol optical depth (AOD) and departure from the monthly mean (DMM) at Ile-Ife, Nigeria, with their corresponding standard deviation from January to June 2016. It is evident that higher AOD values correspond to lower DMM values, and vice versa. The monthly mean values of AOD and DMM exhibit seasonal variations, displaying diverse trends with AOD values ranging between 0.64 ± 0.33 and 1.47 ± 0.45 and DMM values between 4.92 ± 5.21% and 36.73 ± 17.56%. A high value of 1.11 ± 0.41 and a low value of 4.92 ± 5.21% were recorded for AOD and DMM, respectively, in the month of January. A similar pattern was observed in February, with a high AOD value of 1.47 ± 0.45 and a low DMM value of 7.04 ± 9.99%. The high values of AOD recorded in January and February can be attributed to the high aerosol loading in the atmosphere caused by the prevalence of Harmattan dust particles and particulates, including fugitive dust from roads and biomass burning aerosol. In the transition months (March and April) from dry to wet seasons, the values of AOD decreased, with the lowest values occurring in the wet months (May and June), while those of the DDM, increased, with the highest values obtained in June. However, among the wet months, the lowest values of approximately 0.64 ± 0.35 were recorded for AOD in June. On the other hand, the highest value of 36.73 ± 17.56% was recorded for DDM in June. The decrease in the values of AOD during the transition and wet months can be attributed to the removal of aerosol particles from the atmosphere by rainfall through wet deposition processes. Several factors contributed to the monthly variation in AOD at the study site. Firstly, the north-eastern winds transport continental aerosols, which contain dust particles to the site, leading to an increase in the concentrations of aerosols, which reached their peak in January and February. The results obtained in this study are similar to the previous studies conducted at the University of Ilorin (8.32° N, 4.33° E), Nigeria, by [49,76], where AOD was reported to have higher mean values during the severe harmattan dust spells.
In order to study the variation in the atmospheric turbidity coefficients, in addition to the Linke turbidity factor, the calculated Ångström turbidity coefficient (βEST) will be considered among the aforementioned coefficients (Unsworth–Monteith, KAUM, and Schüepp, SCH). The Ångström turbidity coefficient has a strong connection to aerosol loading, making it a suitable choice for analysis. Also, both the Ångström and Schüepp turbidity coefficients show similar daily and monthly patterns and variations in previous studies (El-Wakil et al., 2001; El-Metwally, 2013) [6,11]. If an aerosol adheres to Ångström’s idealized model, the use of either the Ångström or Schüepp turbidity coefficient is interchangeable, and the choice between them is a matter of convenience [22]. The daily values of KAUM and SCH range between 0.0018 and 0.67, 0.0042 and 0.82, respectively, which are similar to the values of βEST, which range between 0.023 and 0.70. Likewise, for the monthly values, KAUM ranges between 0.11 and 0.62, SCH at 0.21 and 0.64, and βEST between 0.20 and 0.60.

3.2. Seasonal Variability of the Atmospheric Turbidity

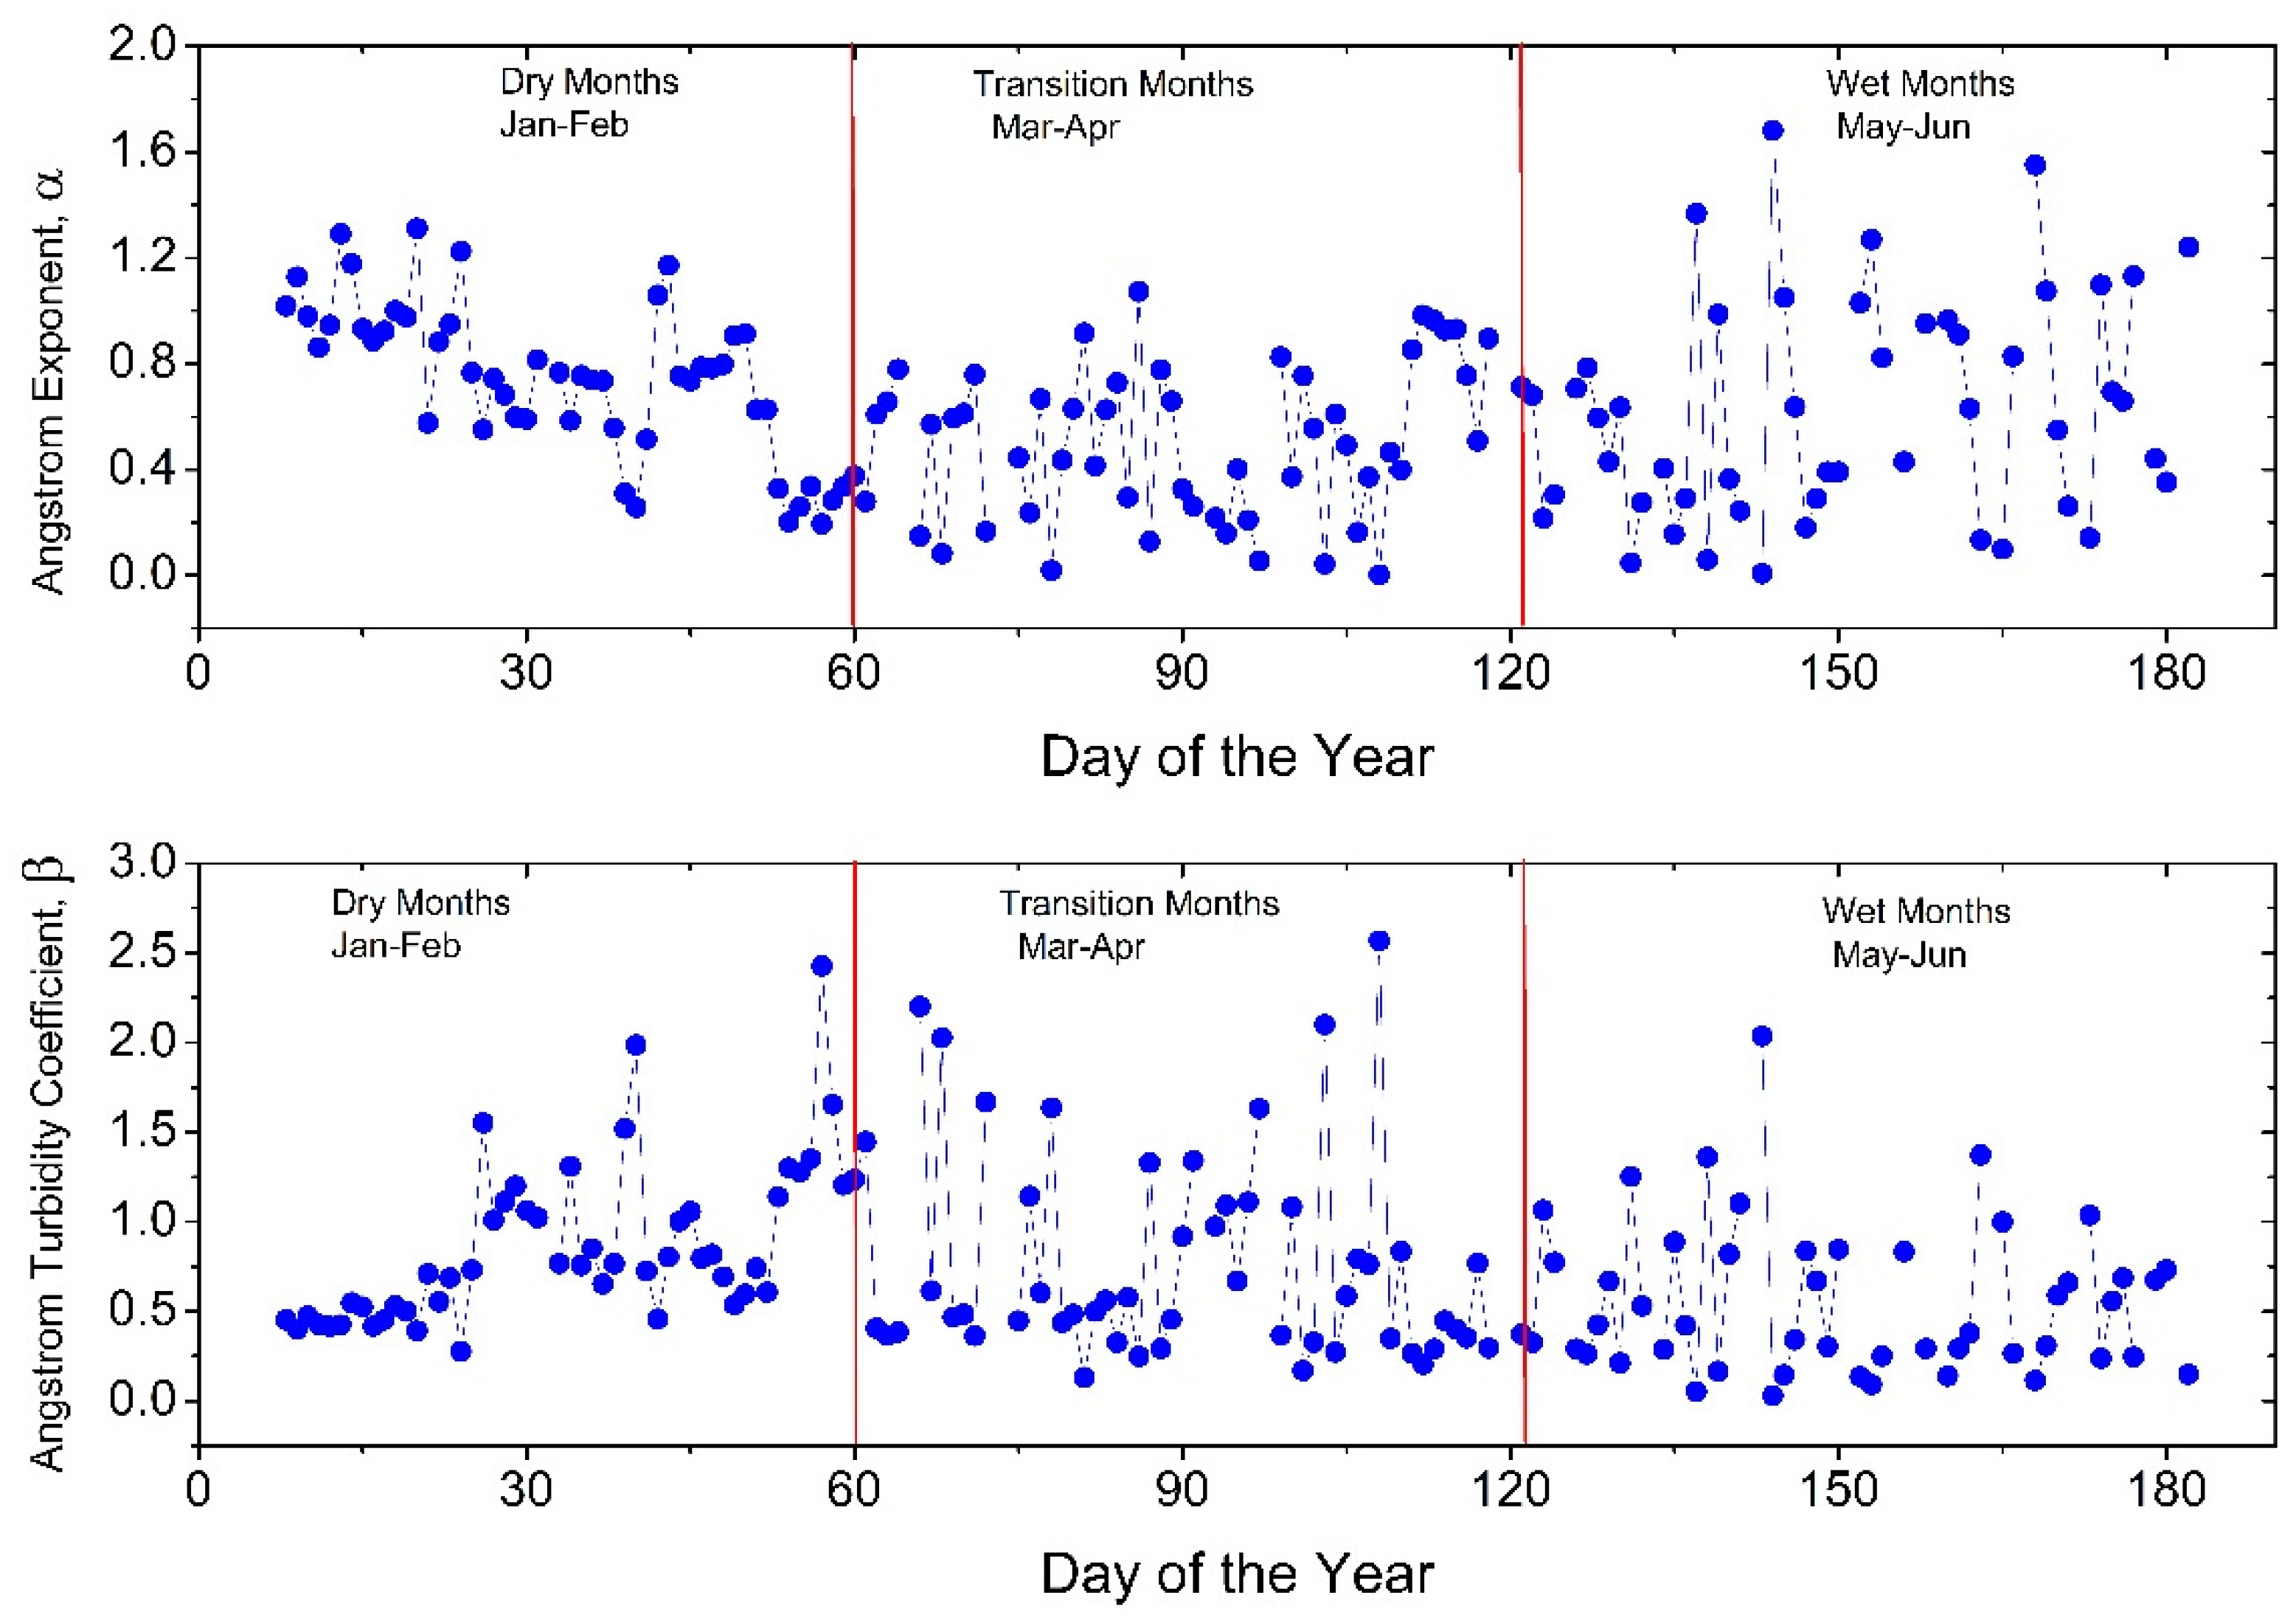
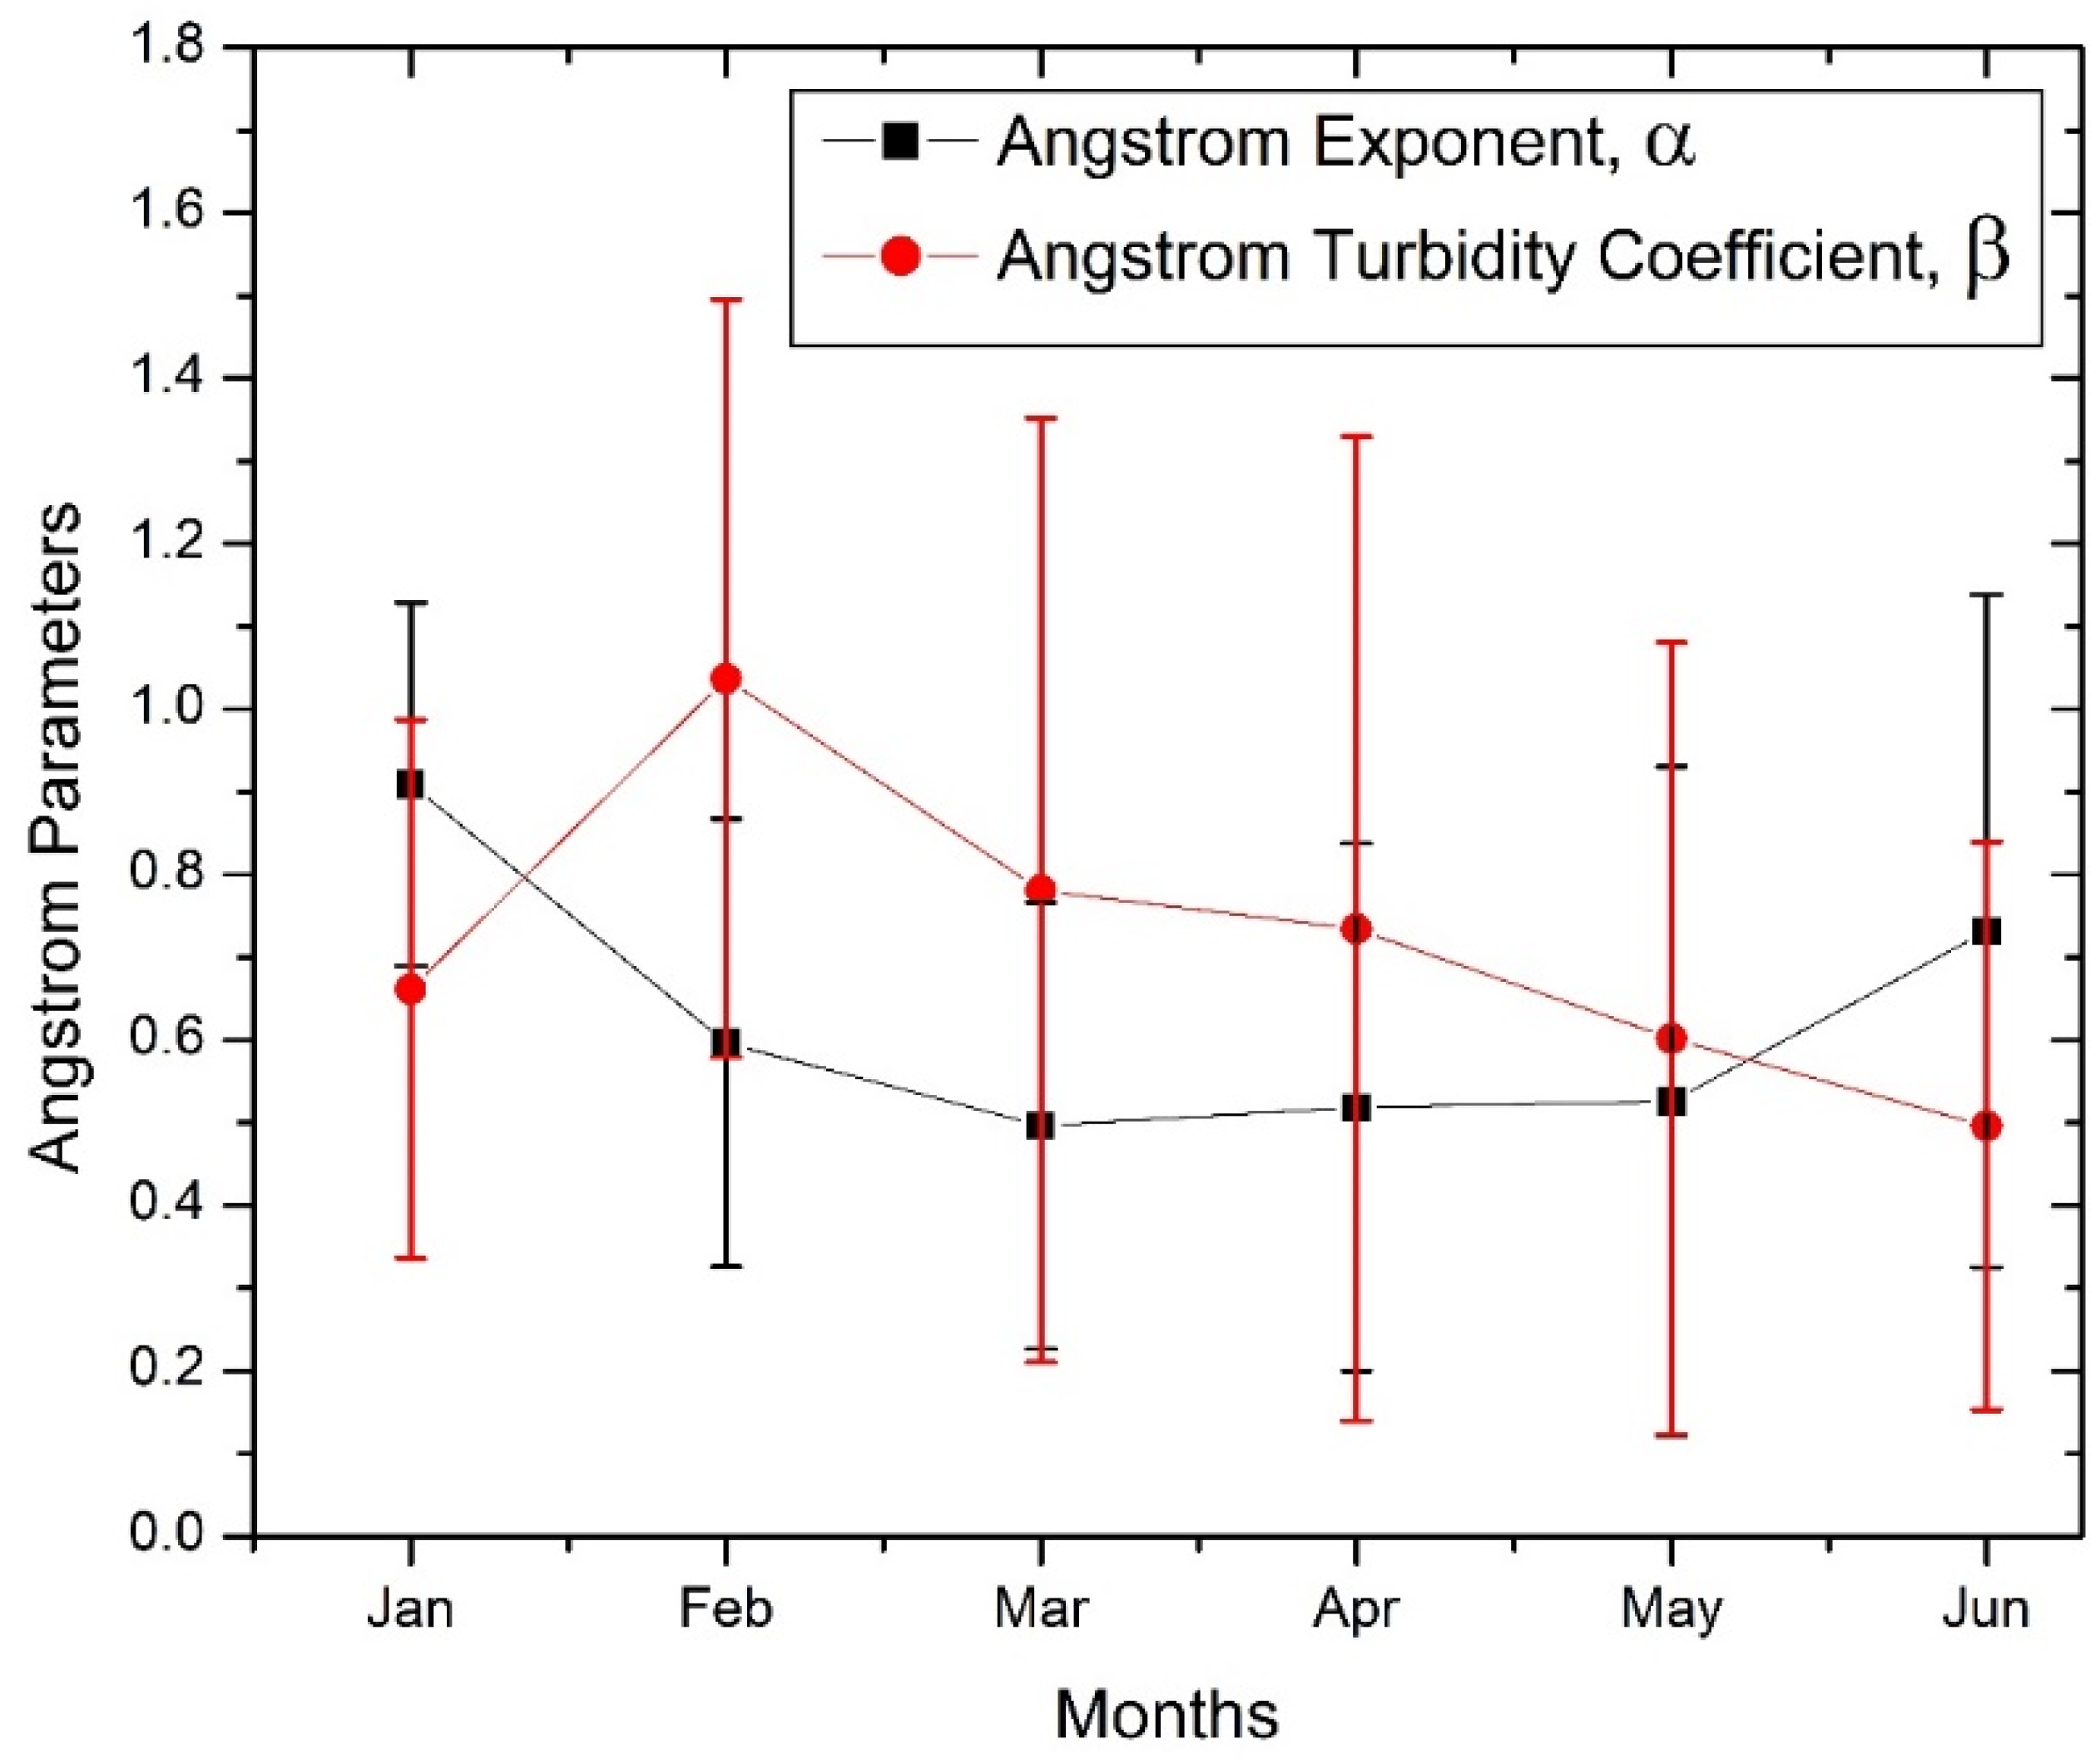
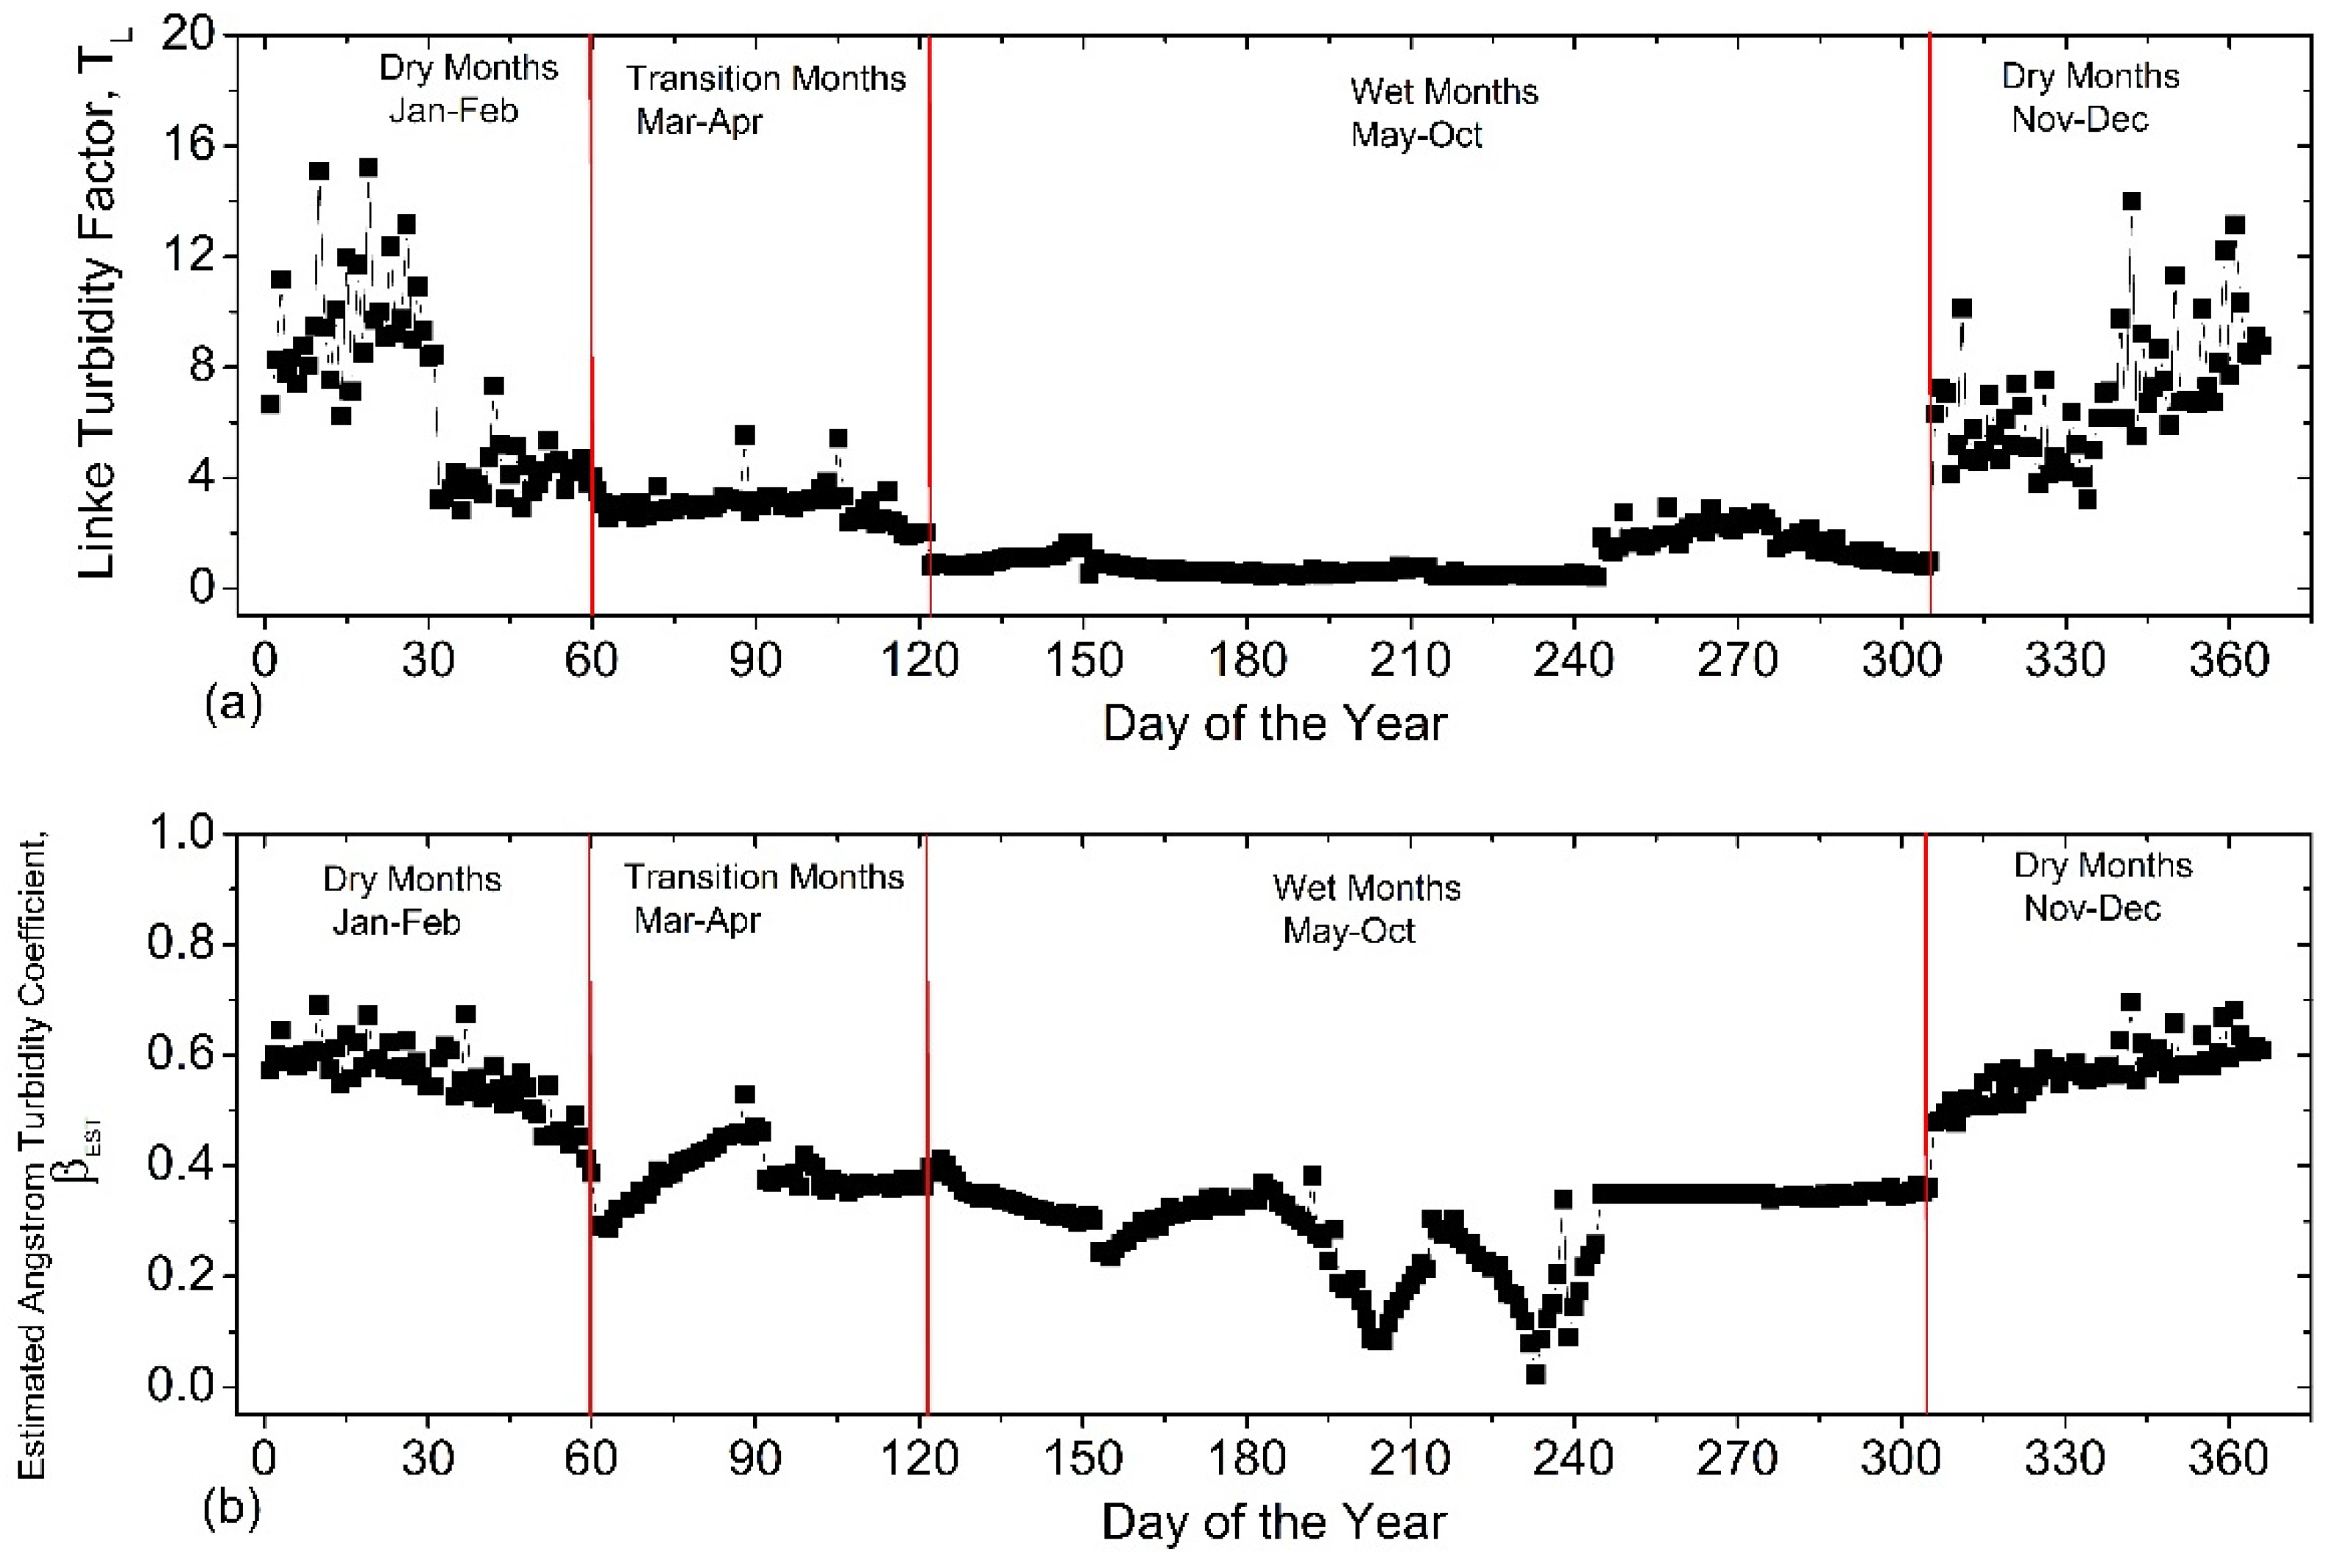
3.2.1. Daily Temporal and Monthly Variations in the Ångström Exponent and Turbidity Coefficients Estimated from the Measured AOD

The time series plots of the mean daily values of the Ångström and exponent (α) turbidity coefficients (β) derived from the AOD Measurements for the period of January–June 2016 are shown in Figure 5. As shown in the figure, the daily values of the Ångström exponent ranged from 0.20 to 1.31 in the dry months and varied from 0.002 to 1.68 in the wet months. The significant variation in the values of the Ångström exponent between the dry and wet months indicates the dominance of different sizes of aerosol particles, from very fine-mode dust to large coarse-mode particles at the study site. In addition, the changes in the aerosol size distributions in the dry and wet months can be attributed to the changes in the optical characteristics of the aerosol particles. On April 17th, 2016 (DOY 108), the lowest value of 0.002 was obtained, while the highest value of 1.68 was obtained on 23 May 2016 (DOY 144). The lowest value obtained on DOY 108 suggests the prevalence of coarse mode (large) particles while the highest value obtained on DOY 144 indicates the prevalence of fine-mode (small) particles, at the study site. The figure shows that the daily values of the Ångström coefficient ranged between 0.28 and 2.43 and varied from 0.03 and 2.57 for the dry months and wet months, respectively. The lowest value of the turbidity coefficient (0.03) was recorded on 23 May 2016 (DOY 144), indicating a less turbid atmosphere on that day. This condition can be attributed to the presence of air masses of maritime origin, which are warm and humid transported by the Southern winds from the Gulf of Guinea [8,77]. The warm and humid air masses are associated with increased rainfall activity, which, in turn, facilitates the removal of suspended dust aerosol particles in the atmosphere through wet deposition and cloud scavenging processes. On the other hand, the highest values of the turbidity coefficient of 2.43 and 2.57 were observed on 26 February 2016 (DOY 57) and 17 April 2016 (DOY 108, a dry transition day), respectively. The peak turbidity on DOY 57 can be attributed to dry harmattan conditions prevalent on that day. In contrast, the increased turbidity on DOY 108 can be associated with heavy rainfall on DOY 107, which enhanced hygroscopic aerosol growth and increased the size of aerosol particles. This, in turn, led to higher absorption rates of atmospheric aerosols, contributing to the elevated turbidity levels [77].
Figure 6 presents the variation in the monthly mean of the Ångström exponent (α) and turbidity coefficients (β) along with their respective standard deviations derived from the AOD measurements for January to June 2016. In January, the highest value of approximately 0.91 ± 0.22 was obtained for the Ångström exponent, while the lowest value of approximately 0.50 ± 0.27 was obtained in March, implying the contribution from particles of different sizes [8,103]. The high value of the Ångström exponent obtained in January can be attributed to the transport of harmattan dust particles, which consist mainly of fine-mode aerosol particles, to the study site at this time of the year. The lower value recorded in March can be attributed to the prevalence of coarse-mode aerosol particles at the study site due to an increase in the sizes of remnant aerosol particles in the atmosphere by rainfall. This also shows the strong influence of Southern winds from the Gulf of Guinea. In addition, the change in the sizes of aerosol particles from fine mode particles in January to coarse-mode particles in March can be attributed to the high relative humidity. This is in agreement with the result obtained by) [104] at Ile-Ife, Nigeria, who established that fine harmattan dust particles are mainly transported to Ile-Ife since Ile-Ife is approximately 2000 km away from the Faya Largeau area (17.92° N; 19.11° E), the source of the Harmattan dust. Faya-Largeau is an oasis town located in the vast expanse of the Sahara Desert in northern Chad. On an annual basis, the precipitation levels reach an average of 11.7 mm, the average relative humidity for this area is approximately 23.0%. The annual sunshine duration of Faya-Largeau is 3800 h, one of the world’s highest (Mainguet, 1968; WMO, 2015; NOAA, 2015) [105,106,107].
In Figure 6, a strong seasonal variation was observed in the time series plots of the monthly means of the turbidity coefficient. The maximum value of the turbidity coefficient was recorded in February in the dry season, while low values were recorded in May and June during the wet season. In February, which is a dry month, the highest value of 1.04 ± 0.46 was recorded for the coefficient. The high value of the turbidity coefficient observed in February can be attributed to the high aerosol loading caused by the prevalence of harmattan dust particles and particulates that remain airborne for a very long time in the absence of rain. As the dry season transitions to the wet season, the turbidity coefficient starts to decrease in March and April. The lowest values were observed in May and June, which correspond to the wet months. The decrease in the turbidity coefficient during the transition and wet months indicates a reduction in atmospheric turbidity due to cloud scavenging and rain washout processes. These processes effectively remove dust particles from the atmosphere, resulting in clearer skies and lower turbidity values. The observations are consistent with previous studies conducted by [108] in Ile-Ife, Nigeria, and [109] in Rajkot, India. The results are also similar to the findings of [49] in Ilorin, Nigeria, where high mean values of the turbidity coefficient were recorded during severe harmattan dust periods.

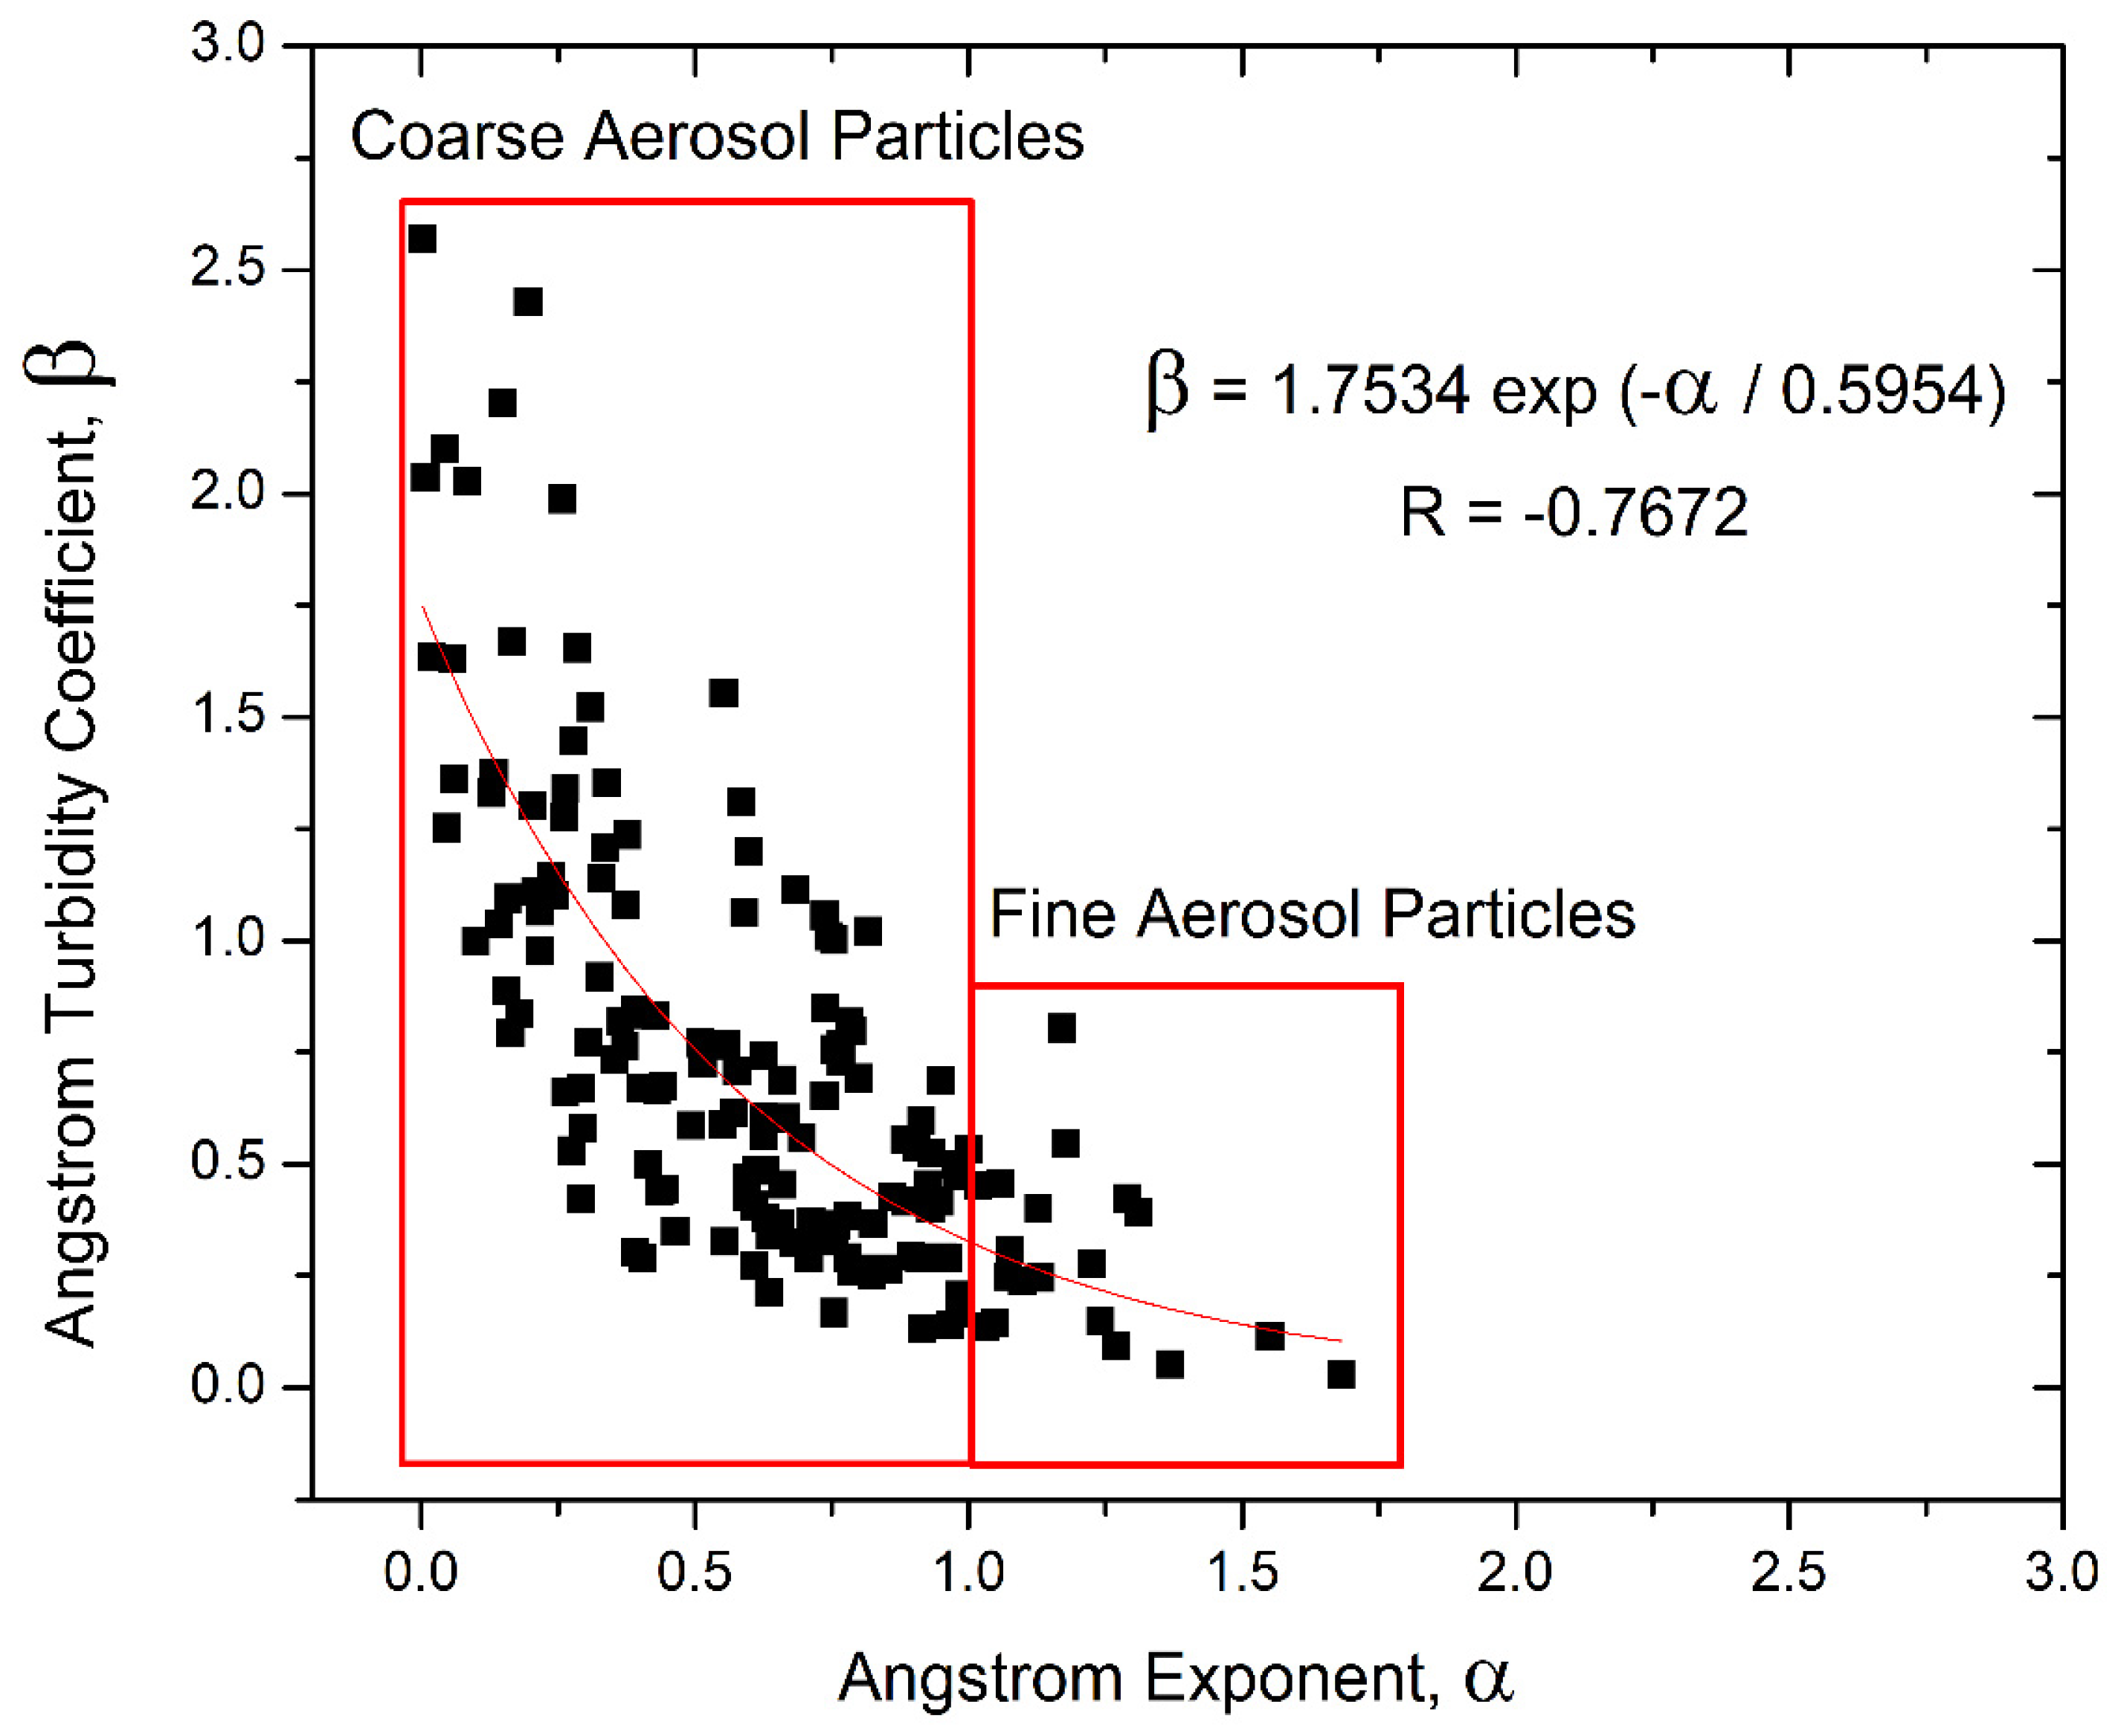
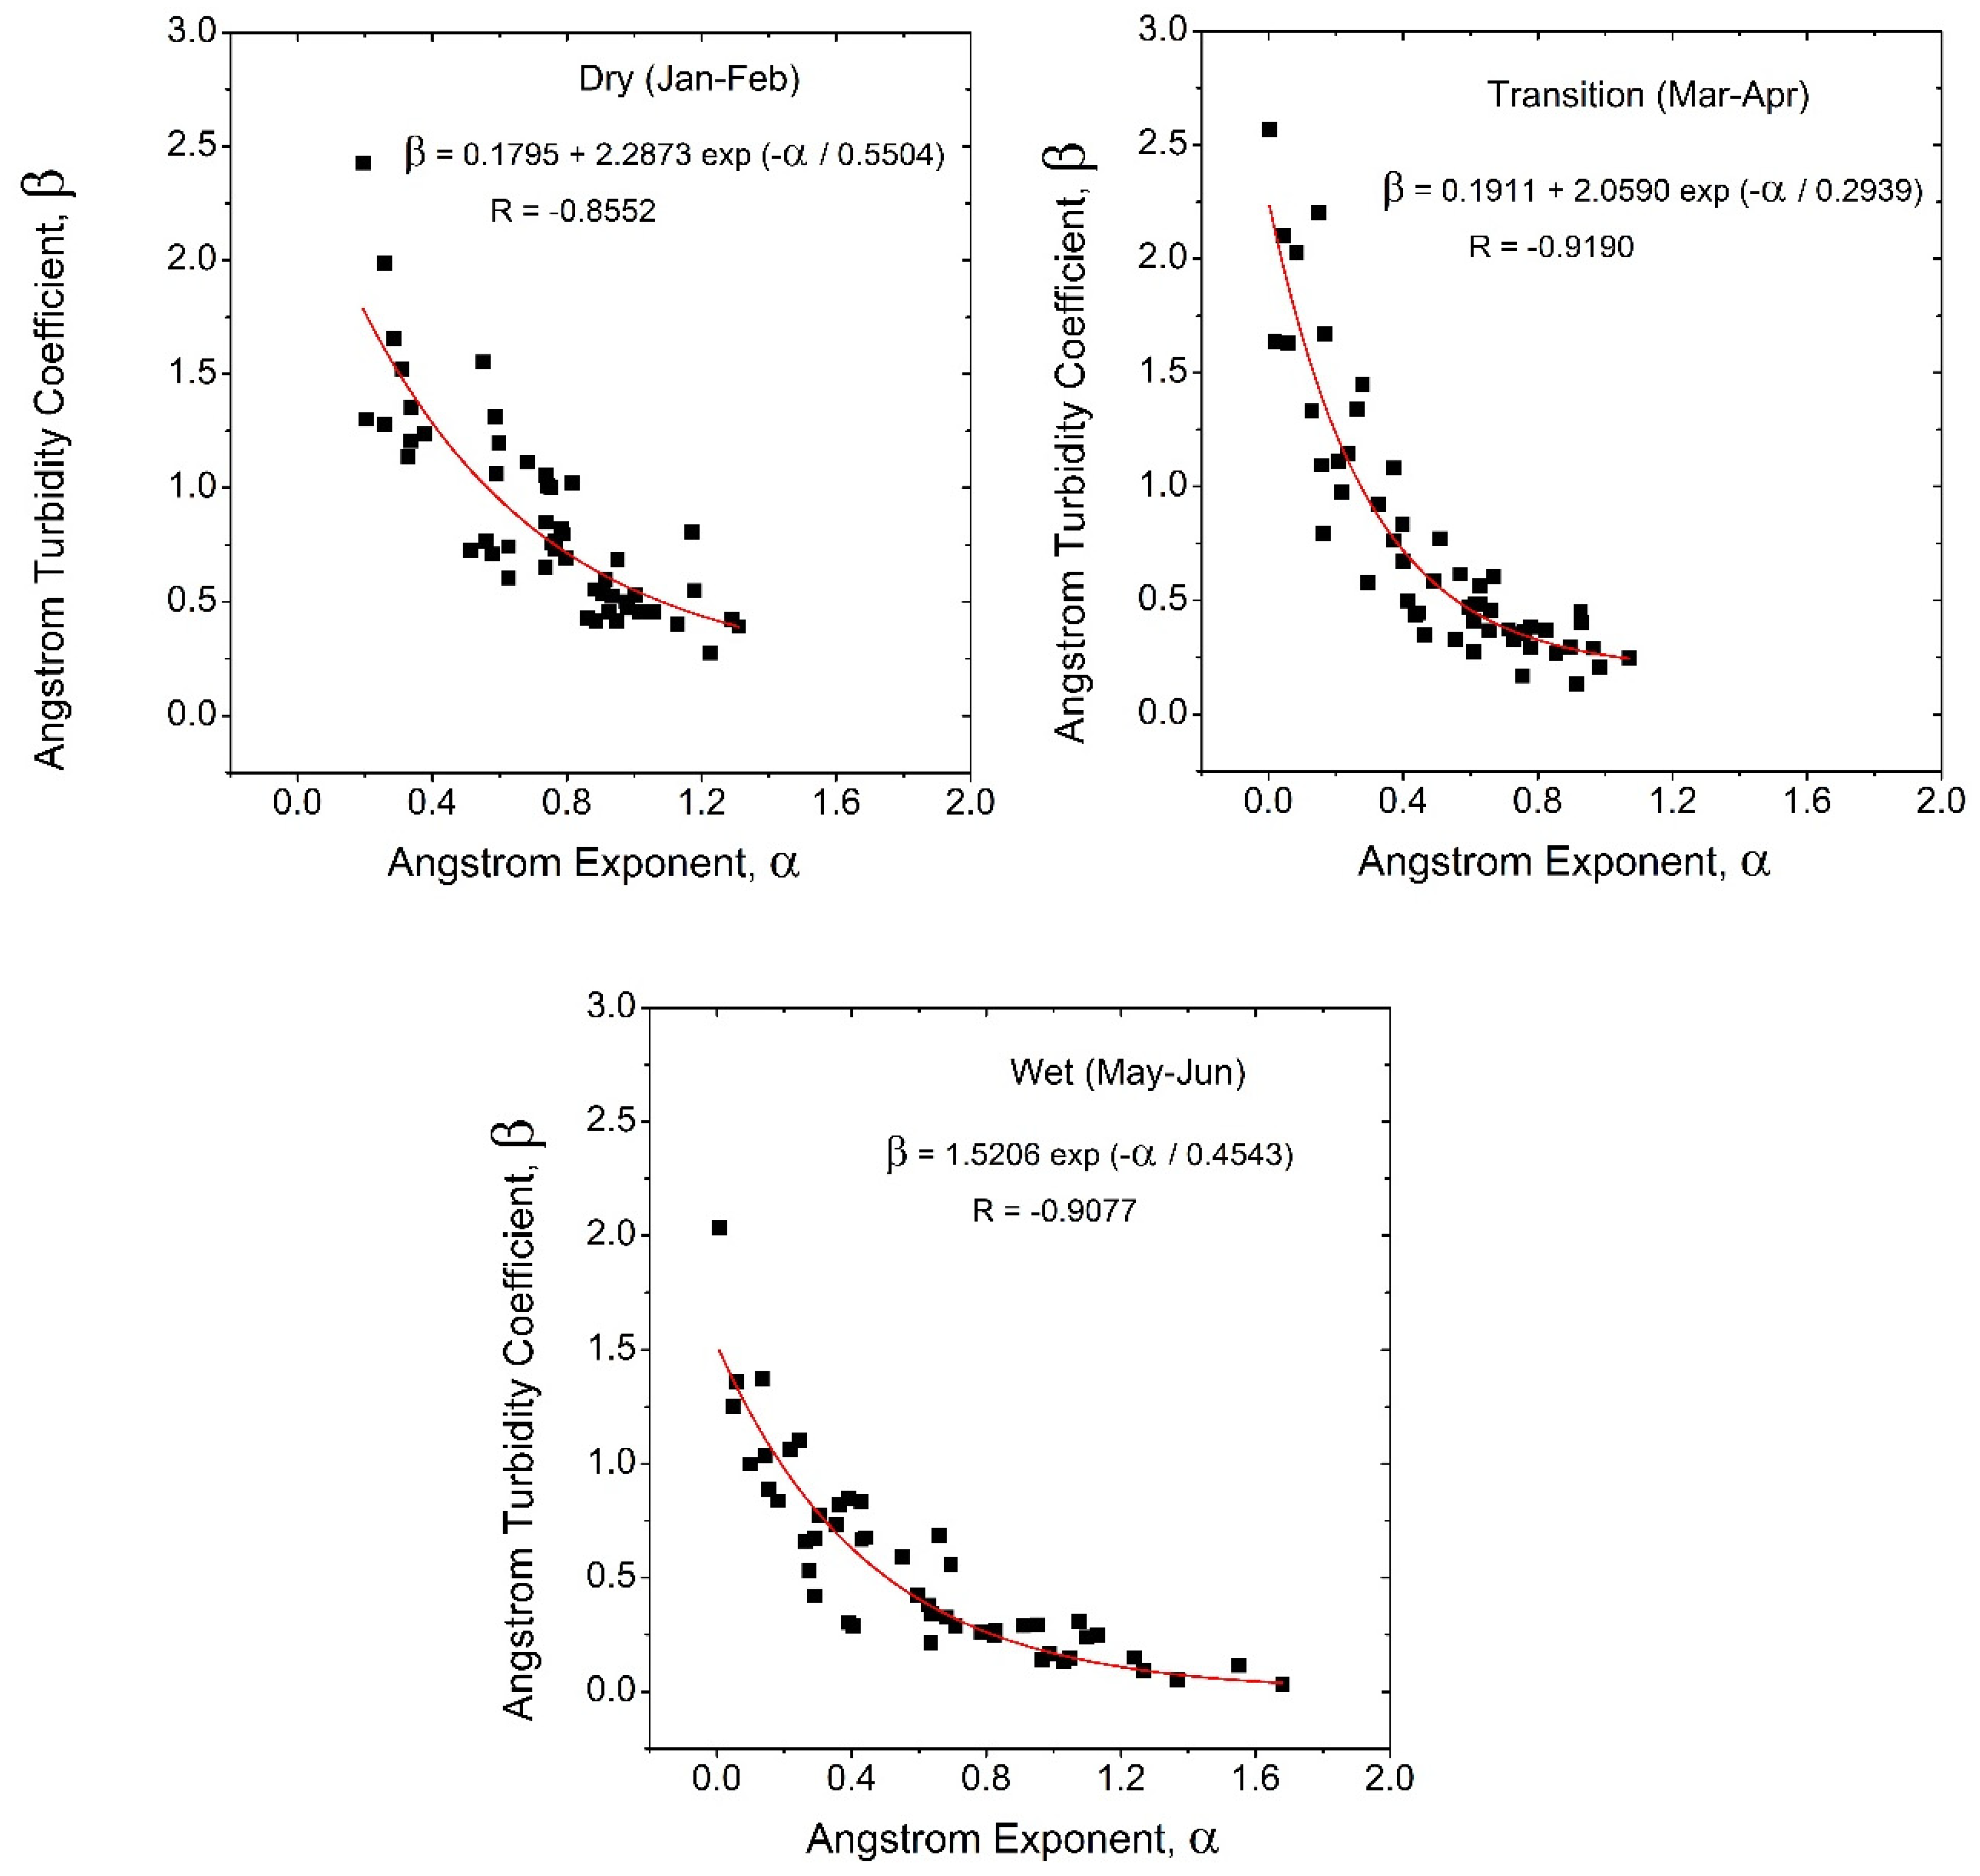
3.2.2. Correlation between the Ångström Exponent and Turbidity Coefficients Estimated from the Measured AOD

Figure 7 shows the relationship between the Ångström exponent (α) and turbidity coefficients (β) for the period of January–June 2016. This relationship helps to explain the mixing status of aerosol particles in the free troposphere and the boundary layer at the study site. The regression plot shows that as the α increases, β decreases, indicating an inverse relationship between the two parameters. The overall equation representing this relationship is given as: β = 1.7534 exp α 0.5954 . The negative correlation coefficient of −0.77 indicates a strong anti-correlation relationship between the values of α and β. Specifically, when α is low and β is high, it indicates an increase in haziness and turbidity at the observation site. This pattern suggests the presence of coarse-mode (large) aerosol particles. Conversely, when α is relatively high and β is low, it is associated with low turbidity, indicating the presence of fine-mode (small) aerosol particles. The relationship established between the Ångström parameters in this study can be used to some extent to characterize the size distribution of the aerosol particles in the atmosphere at Ile-Ife, Nigeria, during the observation period from January to June 2016. Small values of α < 1 indicate an optical dominance of coarse-mode aerosols, such as dust particles originating from regions with prevalent dust sources, such as the Saharan desert. In contrast, high values of α > 1 signify the dominance of fine-mode aerosol particles, such as smoke from biomass burning and industrial areas [39,77,90,110]. The inverse relationship obtained between the atmospheric turbidity parameters estimated at the study site is consistent with the findings by [108] at Ile-Ife, Nigeria; [109,111]; and [49] at Ilorin, Nigeria. Refs. [71,112] have also noted similar effects in Spain.
To further elucidate and explain the association between the coarse-mode aerosol particles and high turbidity and vice versa at the study site, the regression plots between the Ångström exponent (α) and turbidity coefficients (β) were obtained for the different seasons (dry; Jan–Feb; transition; Mar–Apr; and wet; May–Jun), as presented in Figure 8. These regression plots show that as α increases, β decreases, indicating an inverse relationship between these two parameters. As stated earlier, this implies that smaller aerosol particle sizes are linked to higher atmospheric turbidity, and conversely, larger particle sizes are associated with lower turbidity. The mathematical equations shown in this figure provide quantitative insights into how α and β are interconnected during different periods of the year. Furthermore, the negative correlation coefficients of −0.86, −0.92, and −0.91 for the dry, transition, and wet periods, respectively, indicate strong inverse correlations between the values of α and β.

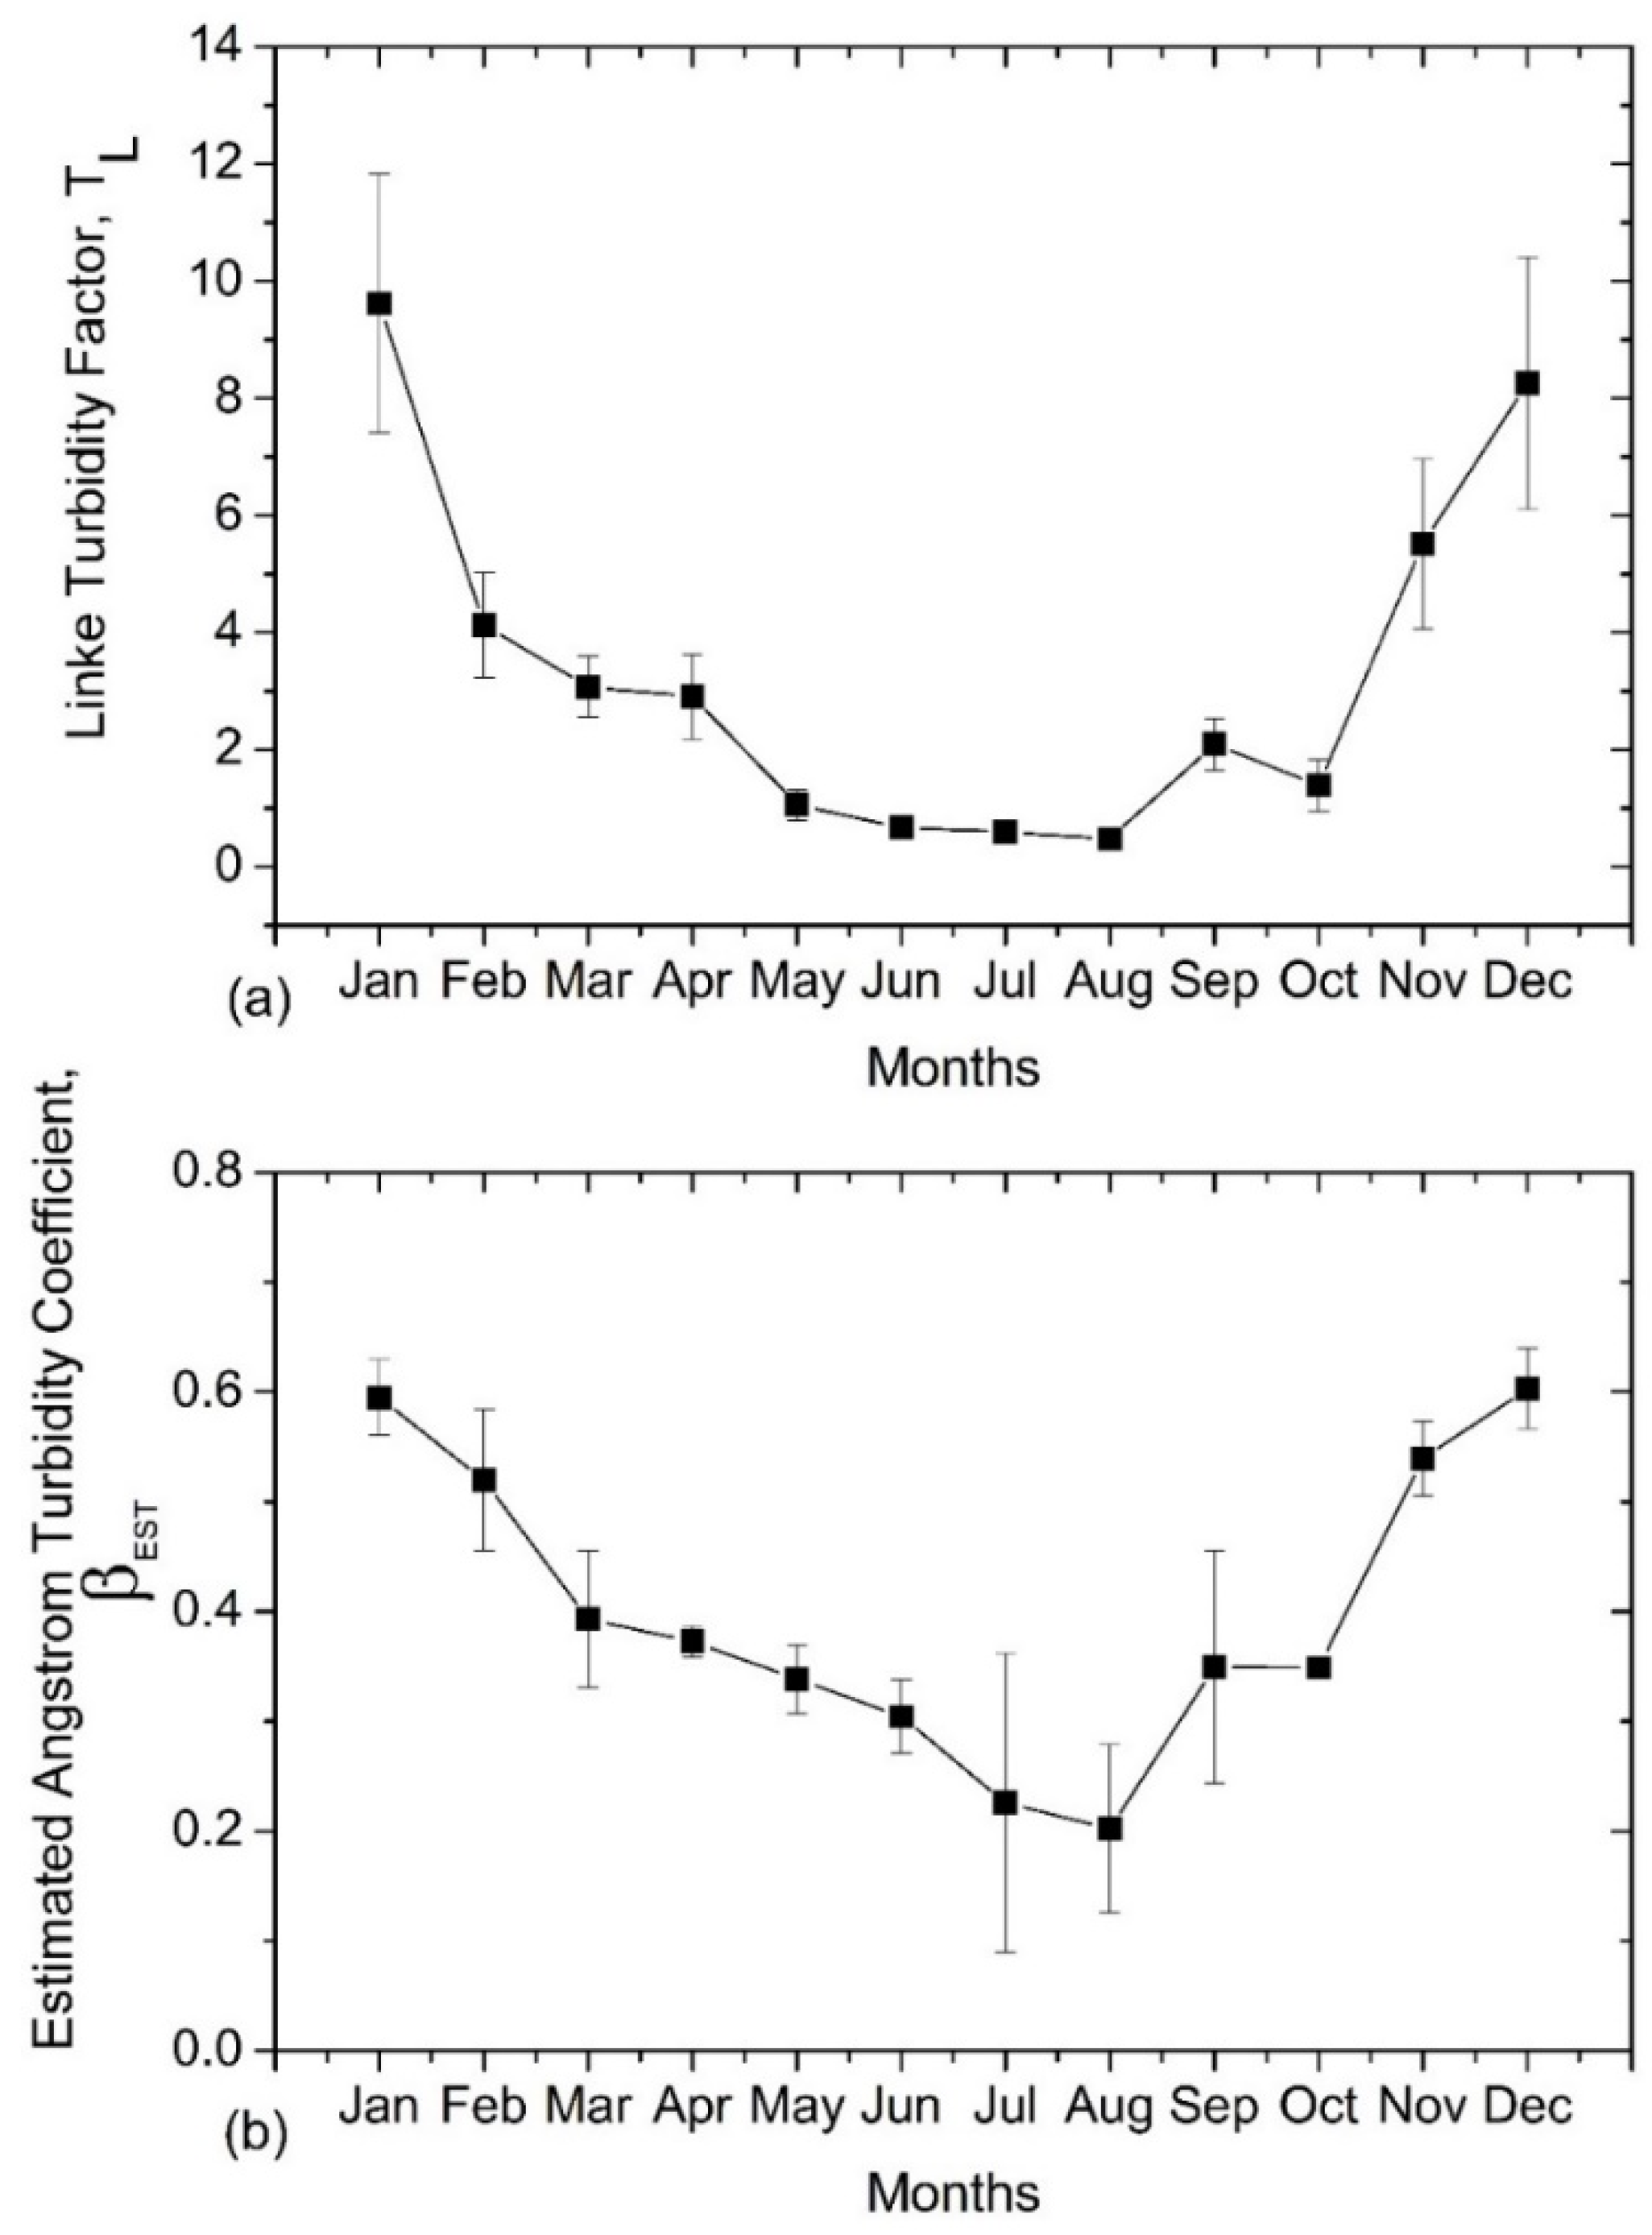
3.2.3. Daily Temporal and Monthly Variations in Atmospheric Turbidity Coefficients

The time series plots of the mean daily values of the Linke turbidity factor and calculated the Ångström turbidity coefficient for January–December 2016 which indicate the fluctuations in atmospheric turbidity, are shown in Figure 9. The figure shows that the pattern in the turbidity coefficients is similar and bimodal, with the mean daily values of TL ranging between 0.41 and 15.21 while the values of βEST range between 0.023 and 0.70. The variations in these coefficients are more pronounced in the dry months (November–February) when compared to the transition months (March and April) and the wet months (May–October). The daily values of TL ranged between 2.82 and 15.21 in the dry months, while the values in the transition, and wet months vary between 1.87–5.54 and 0.41–2.92, respectively. For βEST, the values ranged from 0.39 to 0.70, 0.29 to 0.53 and 0.023 to 0.41 for the dry, transition and wet months, respectively. The common evolution shape with maxima in the dry months and minima in the wet months observed is primarily due to the daily minimum solar zenith angle and astronomical factors such as the day-length variation throughout the year [113]. The large fluctuations observed in the dry months can be attributed to the unstable meteorological conditions during the transition from cold to warm weather and vice versa [113]. The increment in the turbidity coefficients between October and February was due to the shift in the season and an increase in the aerosol loading of the atmosphere caused by the encroachment of the north-easterly (NE) trade winds, evidence of the transition into the Harmattan season at the site [76,77]. The high values of the turbidity coefficients recorded during the dry months indicate that the atmosphere on those days was highly turbid and hazy. Moreover, owing to the fact that the study site is located on a Teaching and Research Farm, the various farming activities and preparation for planting during the dry season may have contributed to the supplementary load of fine particles in the atmosphere. The low values and fluctuations observed in the wet months are due to the preponderant effect of the water vapor along with the removal and washout of dust aerosol particles suspended in the atmosphere by rainfall, which consequently led to lower turbidity in the atmosphere [88,114]. On some specific days, such as DOY 88 and 105 in the transition months, high values of the turbidity coefficient of 5.54 and 0.53 were recorded for TL and βEST, respectively, on DOY 88, while a value of 5.42 was recorded for TL on DOY 105. The high values of the turbidity coefficient observed on these days are due to the increase in the sizes of the remnant aerosol particles in the atmosphere due to rainfall activities, consequently leading to increased absorption rates of atmospheric aerosols [5,113,114].
Figure 10 presents the monthly variation in the Linke turbidity factor and estimated Ångström turbidity coefficient values together with their standard deviation for January–December 2016, distinguishing distinct dry and wet seasons. This figure clearly indicates seasonal variability. During the dry season (November–February), both TL and βEST monthly average values are greater than 4.00 and 0.50, respectively. The highest turbidity values are recorded in January and December, with monthly average values of 9.62 and 0.60 for TL and βEST, respectively. The dry season is characterized by the presence of a north-easterly surface wind. These winds load the atmosphere with high harmattan dust of Saharan origin, fugitive dust from unpaved roads, plant debris, biomass burning aerosol (bush burning activities), and fine-mode aerosol particles (Soneye, 2018). On the other hand, the wet season (March–October) is characterized by TL and βEST monthly average values that are less than 4.00 and 0.50, respectively. The lowest monthly average values of 0.48 and 0.20 for TL and βEST, respectively, are observed in August. During this season, TL and βEST decrease due to the washing-out effect of dust by frequent rainfall. The standard deviations of the TL and βEST vary between 0.04 and 2.21 and 0.006 and 0.14, respectively, with the minimum values recorded in August and maximum in January and December, indicating higher variability in atmospheric turbidity. The low values of standard deviation for TL and βEST ranging between 0.04 and 0.73 and 0.006 and 0.062, respectively were recorded in the wet months, which implies that a slight variation in atmospheric turbidity was observed during these months. On the contrary, the increase in the standard deviation during the dry season shows more significant fluctuations of TL and βEST and more attenuation of solar radiation in a clear-sky atmosphere, which can be attributed to the predominant effect of the circulation of natural and anthropogenic aerosols. In addition, the increase in the standard deviation in the dry season can be attributed to the irregularity of the different parameters affecting atmospheric turbidity [20,113]. The seasonal variations in the turbidity coefficients observed at the tropical location Ile-Ife differ from seasonal trends in temperate e.g., [1,59] and subtropical Mediterranean and semi-arid climates [113] which show a maximum in summer. In these locations, there are notably elevated humidity levels (reaching a peak in July) due to the higher temperatures in the summer. At Mediterranean sites increased sea surface temperature leads to more evaporation and can further impact atmospheric turbidity. In addition, as shown in Figure 10, the annual variations in the Linke turbidity factor exhibit greater variations compared to the Ångström turbidity coefficient. This difference arises from the Linke turbidity factor’s sensitivity to factors like direct solar radiation, extraterrestrial solar radiation, and solar elevation angles. On the other hand, the Ångström turbidity coefficient depends on optical air masses and optical depths, with only a slight dependence on both the solar zenith angle and the precipitable water content [4,11,22,45].
The statistical parameters for the Linke turbidity factor (TL), the estimated Ångström turbidity coefficient (βEST), Schüepp (SCH), and Unsworth–Monteith (KAUM) for January–December 2016 at Ile-Ife are presented in Table S2 in the Supplementary Materials. The data presented in the table shows that a strong correlation exists between the various atmospheric coefficients, which implies that they are unanimous in depicting low amounts of aerosol particles in the atmosphere during the wet season and high aerosol loading of the atmosphere during the harmattan dry season. The monthly average values of TL, βEST, SCH, and KAUM vary between 0.48 and 9.62, 0.20 and 0.60, 0.22 and 0.65, and 0.11 and 0.62, respectively (see Table S2). Meanwhile, the corresponding median values range from 0.47 and 9.21, 0.21 and 0.59, 0.23 and 0.63, and 0.11 and 0.62, which are all found to be significant. As previously discussed, large values of TL, βEST, SCH, and KAUM associated with dust storms occur occasionally in the dry season. This phenomenon is primarily attributed to the local atmospheric instability, soil moisture, and the presence of relatively strong winds that transport significant amounts of dust and sand over long horizontal distances [23,115,116,117,118,119]. The duration dust particles remain airborne varies depending on their size and atmospheric conditions and reach up to 7.4 days [119,120].

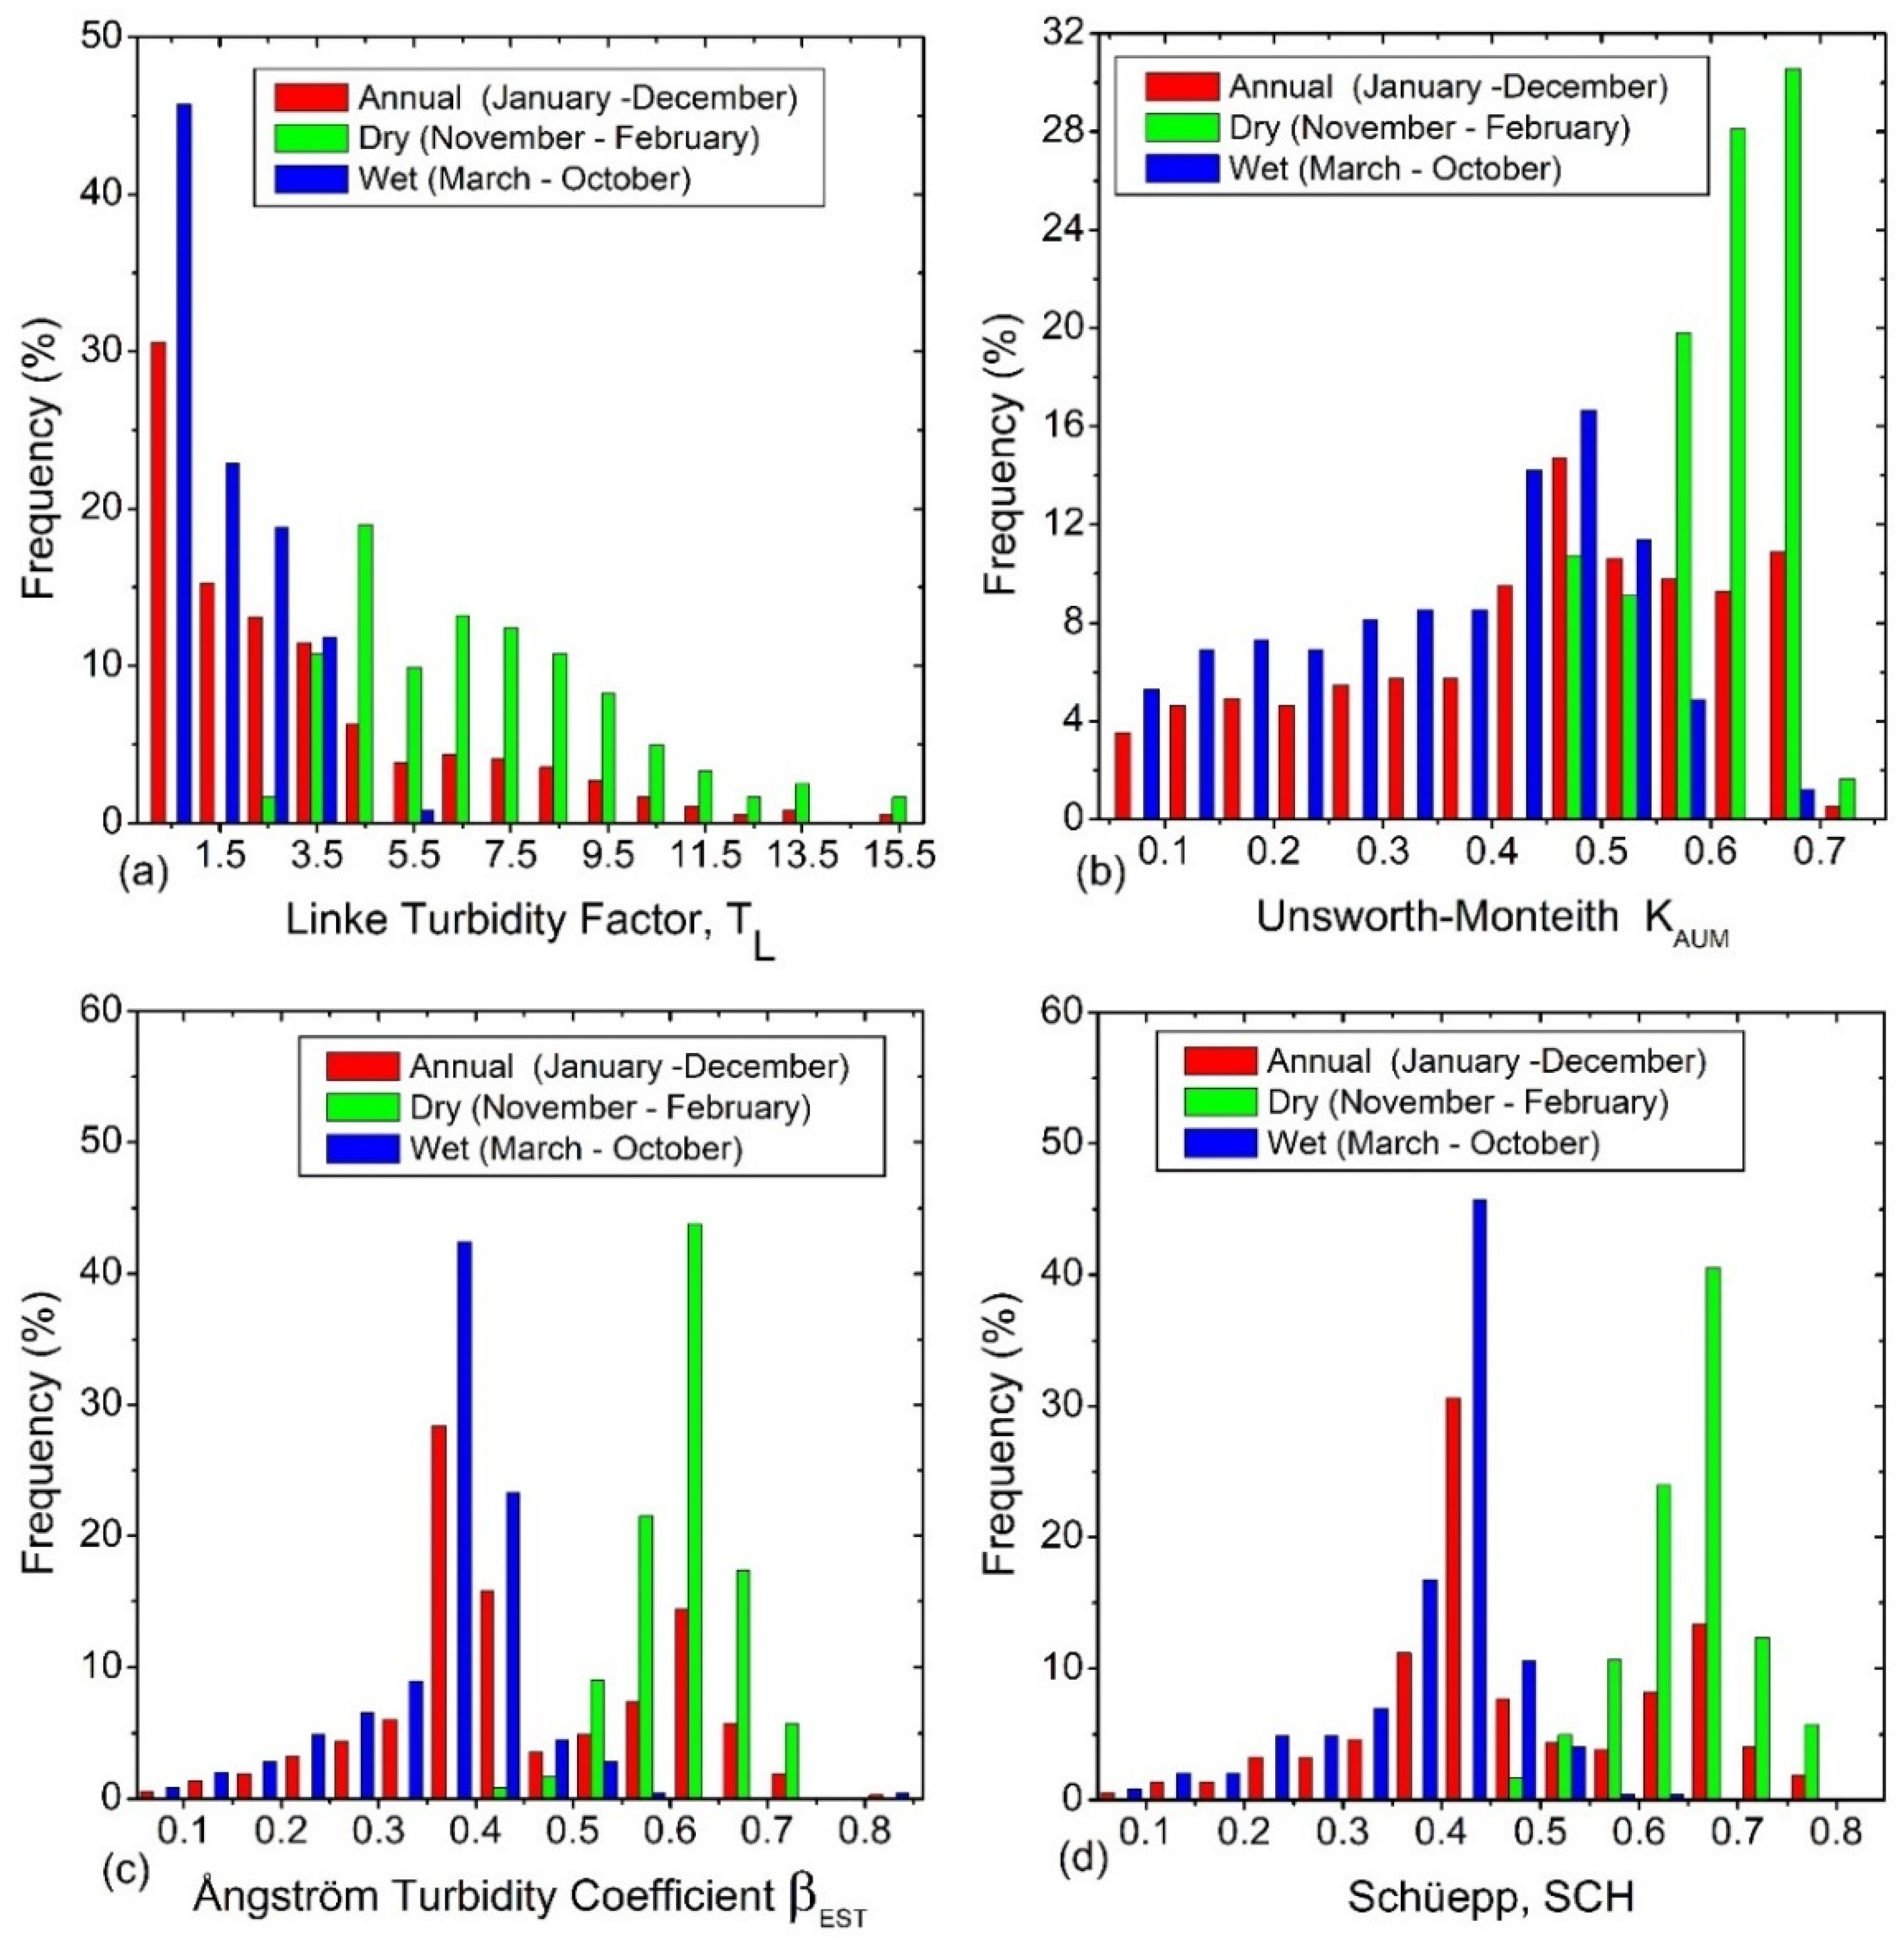
3.2.4. Frequency Distribution of Atmospheric Turbidity

The frequency distributions of the annual, dry, and wet months for the Linke turbidity and estimated Ångström turbidity coefficients, SCH, and KAUM for January–December 2016 are presented in Figure 11. These frequencies of occurrence enable the analysis of the distribution of the atmospheric turbidity parameters at the study site over the entire period and the finding of the weightings of high and low values relative to the climatological mean. The bin intervals for βEST, SCH, and KAUM are 0.05, while they are 1.0 for TL. The analysis of the frequency distribution shows that these parameters follow a log-normal probability distribution, hence supporting the results from previous researchers [11,113,121]. The distributions for TL and KAUM were observed to be positively and negatively skewed, respectively, while those of βEST and SCH were asymmetrical distributions and both positively and negatively skewed. The results indicate that TL, βEST, SCH and KAUM have high values of approximately 0.5, 0.325, 0.375, and 0.425 for the annual and wet periods, respectively. In contrast, during the dry season, high values of 4.5, 0.575, 0.625 and 0.625 were recorded for TL, βEST, SCH and KAUM, respectively. The maximum values recorded in the dry months are attributed to the transport of harmattan dust particles by the north-eastern winds, as supported by the distribution of the wind direction and wind speed presented in Figure 12. On the other hand, the lower values observed in the wet months can be attributed to the considerable decrease and washout of dust content by rainfall. Generally, the atmosphere over the study site has a higher aerosol loading in the dry season than the wet season [23,108]. The details of the frequency distribution of the atmospheric turbidity coefficient values broken down into different categories are discussed in the Supplementary Material (Table S3). These results highlight that the atmospheric turbidity levels are generally higher during the dry season at the study site compared to the wet season.

3.3. Atmospheric Turbidity, Meteorological Parameters and Air Mass

The short-term variation in atmospheric turbidity is influenced by local meteorological factors (e.g., temperature, relative humidity, water vapor pressure, wind speed, and direction), as well as local emissions from domestic and industrial activities. Also, air masses moving over an area and aerosol transport play a significant role in the short-term temporal variation in atmospheric turbidity [16]. On the other hand, the long-term variations in atmospheric turbidity are influenced by the climate of such an area [35,113,122]. The prevailing winds and air masses are crucial factors that can transport moisture and different types of aerosol particles from distant sources, which further impact the temporal variation in atmospheric turbidity [35,122,123]. Numerous researchers [8,20,35,45,71,93,113,122,124,125,126,127,128] have investigated the effects of air mass and weather patterns on atmospheric turbidity at various locations.

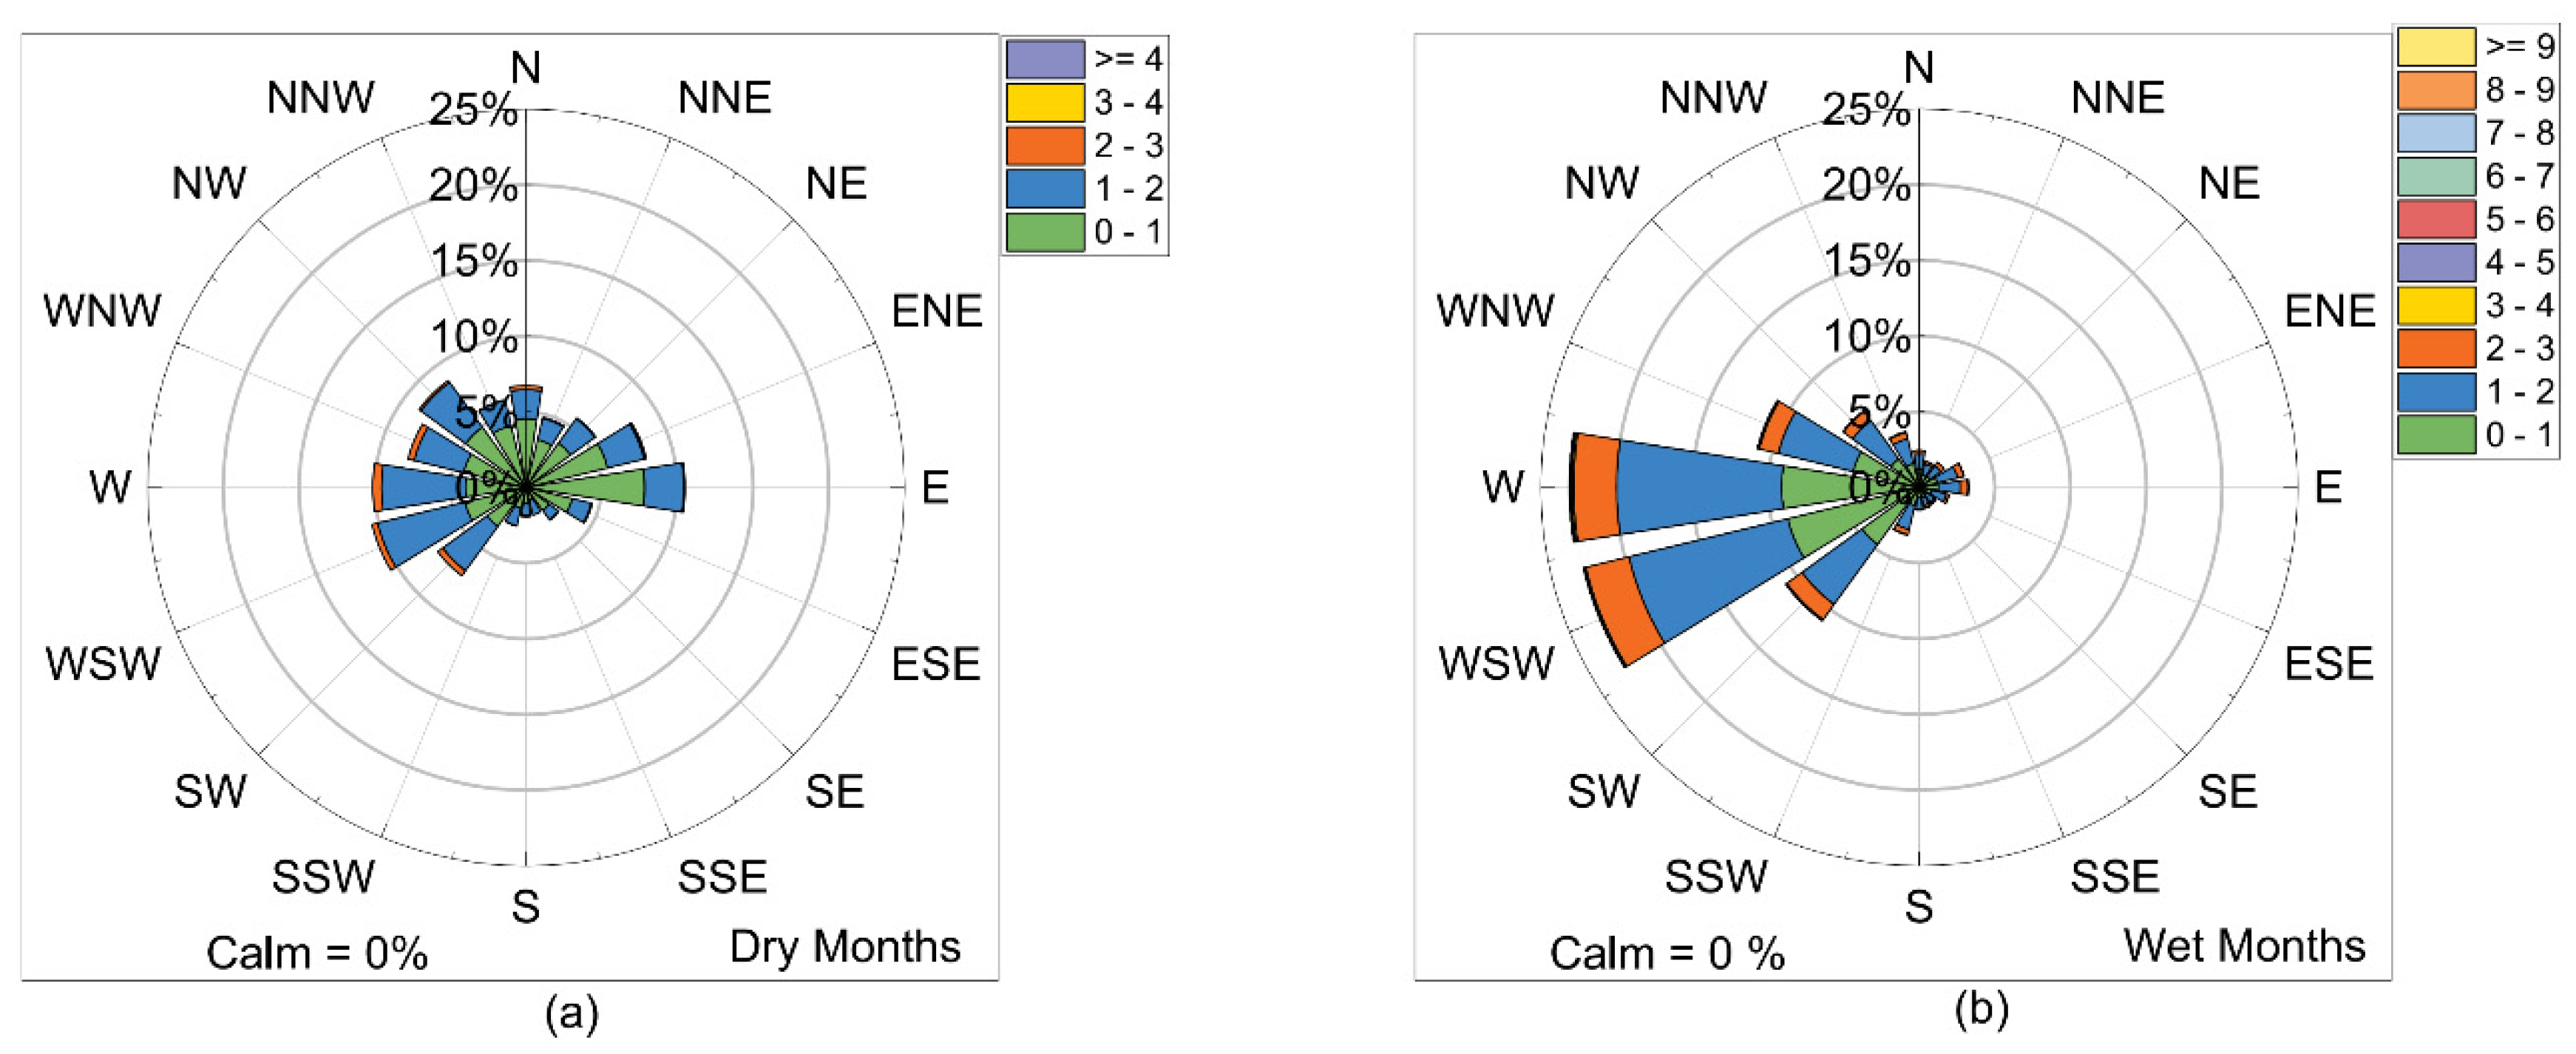
3.3.1. Relationship between the Atmospheric Turbidity Coefficients and Wind Speed and Wind Direction

The distributions of the wind speed and directions for the dry and wet seasons are presented in Figure 12. The north-western sector represents 30.2% and 32.6% of the observed wind directions in the dry and wet periods, respectively. The north-eastern sector represents 39.7% and 14.4% of the observed wind directions in the dry and wet periods, respectively. The southern sector represents 30.1% and 52.9% of the observed wind directions in the dry and wet periods, respectively. The prominent wind direction during the dry season at Ile-Ife is in the north-eastern direction, while the wind speed ranges between 0.2 and 3.2 m/s, and the atmospheric turbidity values in this direction are higher compared to other directions. The north-eastern winds originate from the Sahara and carry dry continental air masses, which in the dry season are warm, dusty, hazy, and turbid due to the abundance of natural and anthropogenic particles. This leads to low and poor visibility, which hinders transportation [23,115,129,130,131,132,133]. In contrast, during the wet season, the prominent wind direction is southern, accounting for approximately 52.9% of the observations with wind speed values up to 9.0 m/s. This implies that most of the atmospheric particles influencing atmospheric turbidity during this period originate from generally increased atmospheric water vapor associated with the southern winds, which bring in wet air masses of maritime origin travelling over the Gulf of Guinea, which are humid and cool [133]. Atmospheric turbidity can be further enhanced by sea-salt spray present in maritime air masses and various industrial emission sources that are embedded in the overall southern flow. The change in the dominant wind direction between the dry and wet seasons coincides with the annual migration of the inter-tropical convergence zone (ITCZ), which plays a crucial role in shaping West Africa’s climate. The variations in the wind speed between these two seasons can be explained by the changes in the pressure gradient as a result of the temperature differences arising from the uneven solar heating of the Earth’s surface [134,135]. During the wet season, the higher wind speeds may be attributed to the strong pressure gradient between the continental thermal low and the high-pressure system over the ocean.

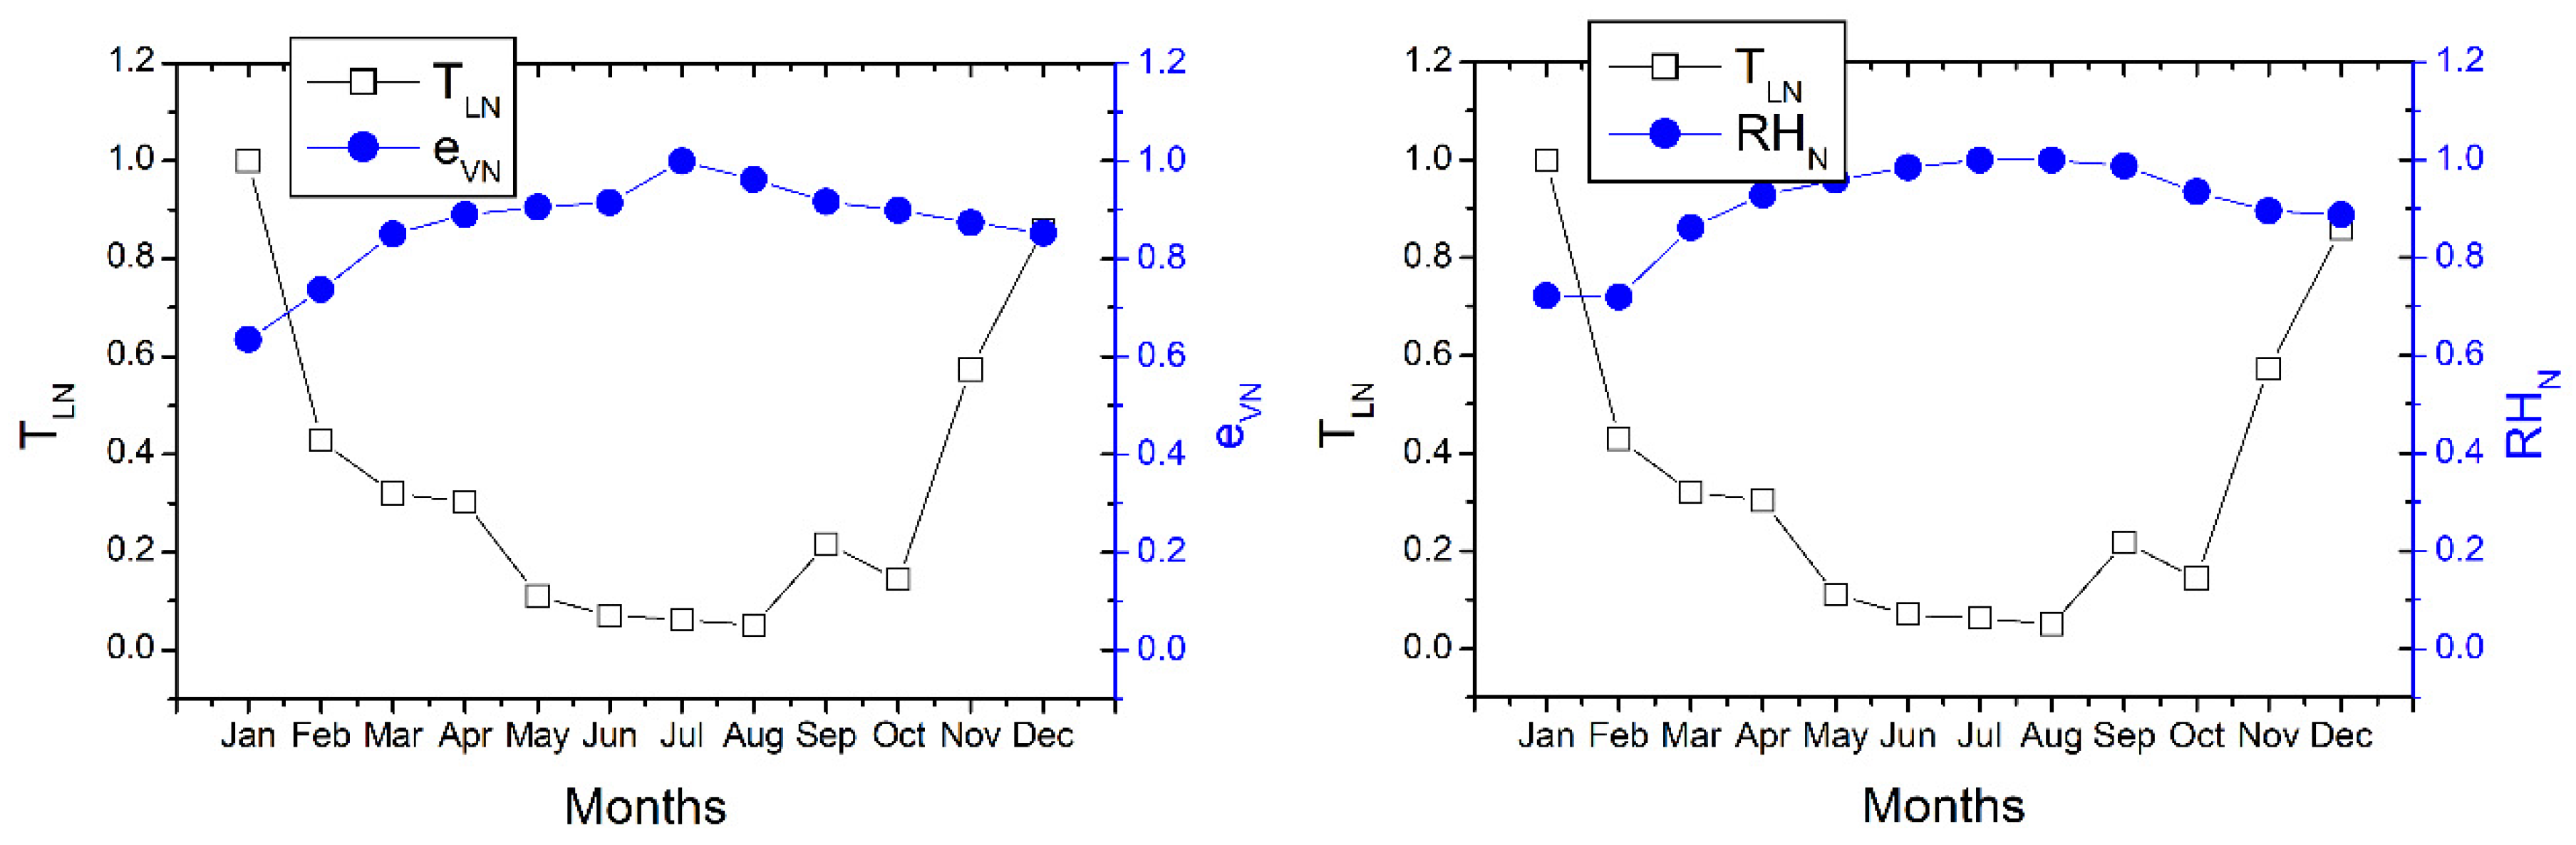
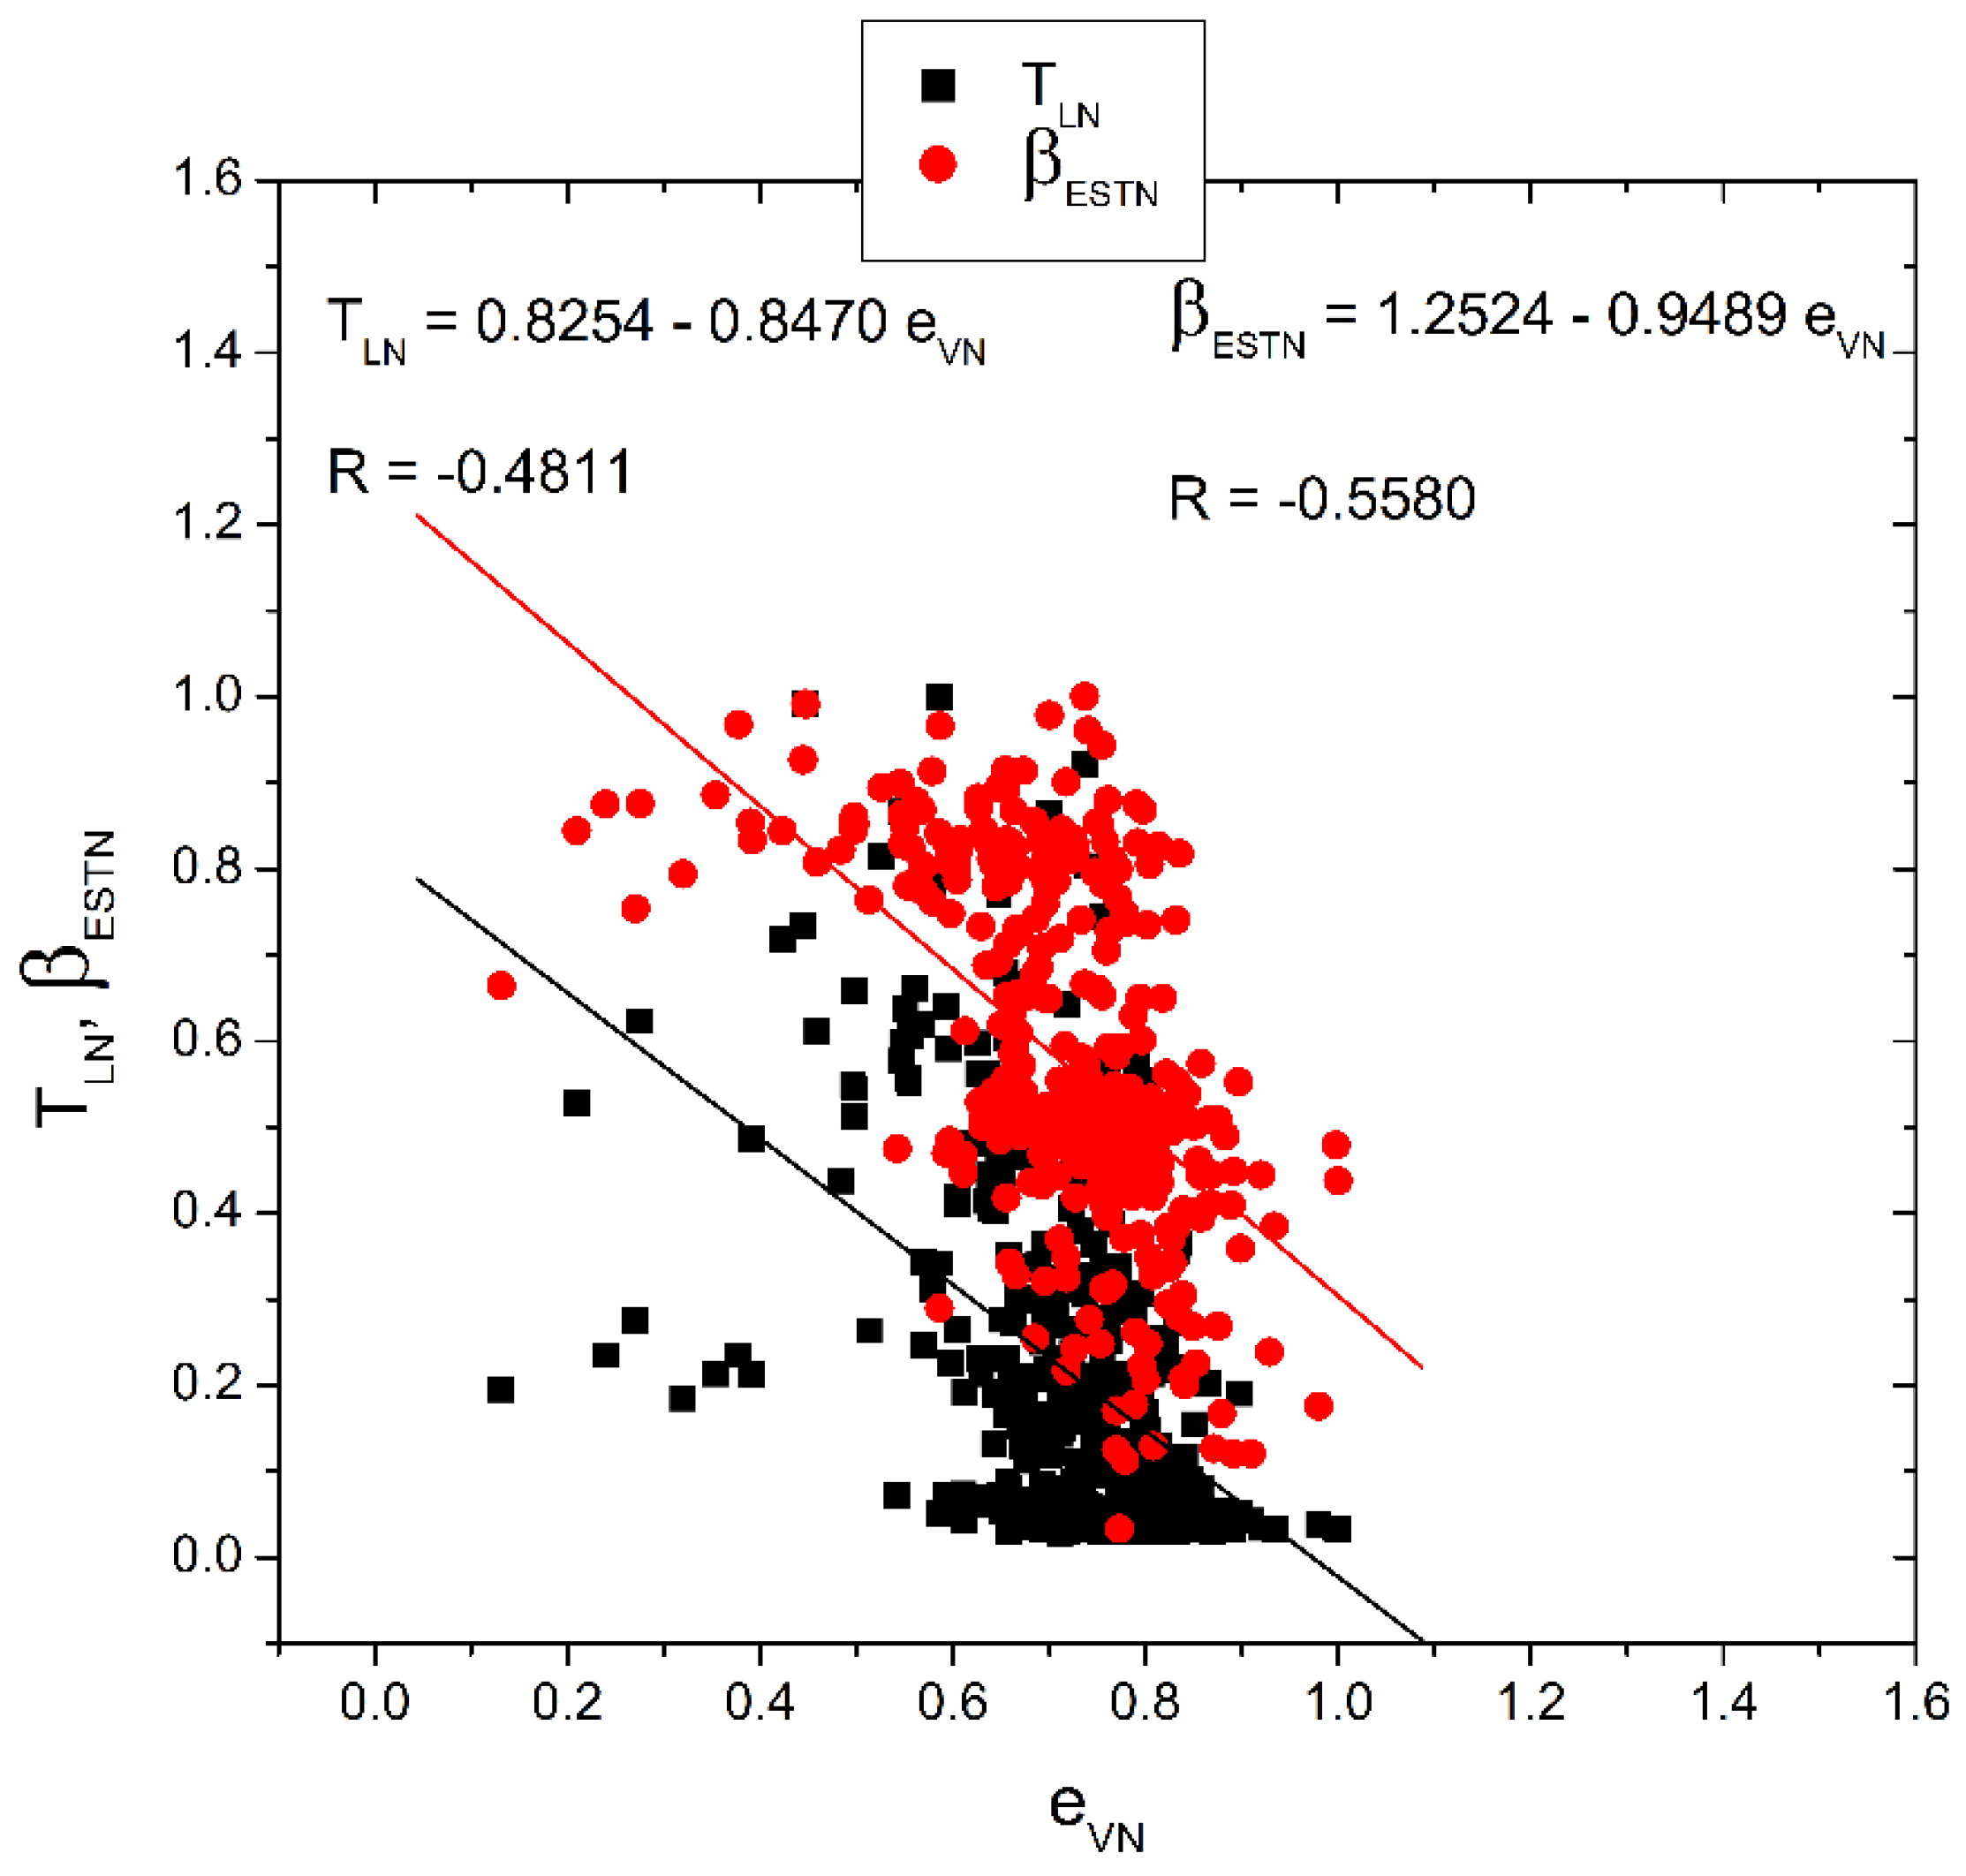
3.3.2. Atmospheric Turbidity, Relative Humidity, and Water Vapor Pressure

To study the monthly changes in atmospheric turbidity coefficients in relation to meteorological factors, we focused on the fluctuations of the Linke turbidity factor. This choice was made due to the observed similarities in the monthly variations in the Linke turbidity factor and the calculated Ångström turbidity coefficient. Figure 13 shows the monthly variations in the relationship between the normalized Linke turbidity factor (TLN), and meteorological parameters (water vapor pressure, eVN and relative humidity, RHN) for January–December 2016. The values of these meteorological parameters are listed in Table S4 in the Supplementary Materials. It is observed that the atmospheric turbidity coefficient shows an opposite seasonal trend with RHN and eVN. Consequently, during the wet months, low atmospheric turbidity is associated with high RH and eV, as these have an indirect impact on the extinction cross-section of hygroscopic aerosols, along with the frequent presence of presence of early morning thermal inversions. These inversions tend to dissipate mainly in the late morning, facilitating the dispersion of aerosols [136,137,138]. Conversely, during the dry months, high turbidity corresponds to low relative humidity and water vapor pressure. The increase in turbidity coefficients from wet to dry months is generally attributed to the rise in air temperature and the decrease in water vapor pressure and relative humidity. These changes in weather parameters lead to variations in the content of aerosol particles and water vapor in the atmosphere, thus impacting the values of atmospheric turbidity coefficients. The increased atmospheric turbidity in the dry season can be attributed to several factors. One significant factor is the greater concentration and prolonged residence time of both primary and secondary particles in the atmosphere, which results from the absence of wet deposition processes and the intensified advective processes, which help uplifting aerosols from dry surfaces [119]. Additionally, as surface temperature rises significantly, the upward convection currents of hot air laden with aerosols contribute to the increased turbidity of the atmosphere [8,138]. Furthermore, the low values of turbidity coefficients and the increase in relative humidity and water vapor pressure during the wet months can be attributed to the humid air masses of maritime origin carried over the Gulf of Guinea by the southern winds. On the other hand, the high turbidity coupled with the decrease in water vapor and relative humidity during the dry months, can be attributed to the hot and dry air masses of continental origin travelling over the Sahara and reaching the study site through north-easterly winds. These months were dominated by an increase in geopotential height and surface atmospheric pressure, which favor atmospheric stability.
Figure 14 shows the correlation between the normalized TLN, βESTN, and eVN for January–December, 2016 based on daily data. We normalize all quantities for comparison as each quantity encompasses wide dynamic ranges. A data cluster is visible at high eVN (eVN = 0.8 ± 0.2), which equals a range of eV of approximately 25–35 hPa, typical for prevalent humid tropical conditions. Here TLN, βESTN may change significantly, but do not depend that much on water vapor pressure. According to Figure 10 and Figure 13 the wet season has the lowest monthly averages for the Linke turbidity factor and the Ångström turbidity coefficient, so most data points are found on the lower end of TLN, βESTN. The regression plot shows that as the values of eVN increase, the values of TLN and βESTN decrease in general, indicating an inverse relationship among these variables. The negative correlation coefficients indicate an anti-correlation between TLN and eV, as well as βESTN and eVN. The disparities in these correlation coefficients and the scatter plots can be attributed to the nature of these parameters. TLN characterizes the total turbidity and quantifies the optical thickness of the atmosphere due to aerosol and water vapor particles relative to a dry and clean atmosphere. In contrast, βESTN represents the turbidity due to aerosol particles [139]. Also, the differences may arise from the distinct parameters used to estimate each of these atmospheric coefficients. This analysis quantitatively demonstrates that atmospheric turbidity due to haze and aerosols is inversely related to the moisture content. Dry conditions tend to result in higher levels of haze, whereas moist air obstructs haze transmission. These interactions between moisture and suspended particles affect the atmosphere’s transparency to solar radiation.
Considering TLN and eVN, some outliers are evident, with lower eVN values falling both below and above the regression line for a given TLN. There are some obvious data points deviating from the main data cluster at low eVN. These outliers mainly occurred during the dry season months of January–February when moisture levels were lowest. These deviations from the overall TLN–eVN relationship can be attributed to particularly dry harmattan conditions with extremely low moisture content. These dry conditions may have been influenced by local weather variations or regional climate factors. In the case of βESTN and eVN, there are a few high leverage points with higher βESTN values (~0.66–0.89) that lie below the regression line. These outliers also coincide with the dry season and may result from high turbidity levels despite low moisture content. Other local factors, such as biomass burning and the prevalence of dust, could have led to spikes in turbidity and haziness levels, thus deviating from the expected inverse moisture-turbidity relationship. High values of TLN and βESTN, at high eVN may point towards industrial emissions embedded in southerly flows from the Gulf of Guinea which are superimposed of the enhance atmospheric water vapor in these air masses. However, while these outlier points lie off the regression line, they do not significantly alter the overall inverse correlation between turbidity and moisture observed in the analysis. These outliers can be attributed to normal climate variability and local factors, rather than undermining the overall correlation established in the analysis.

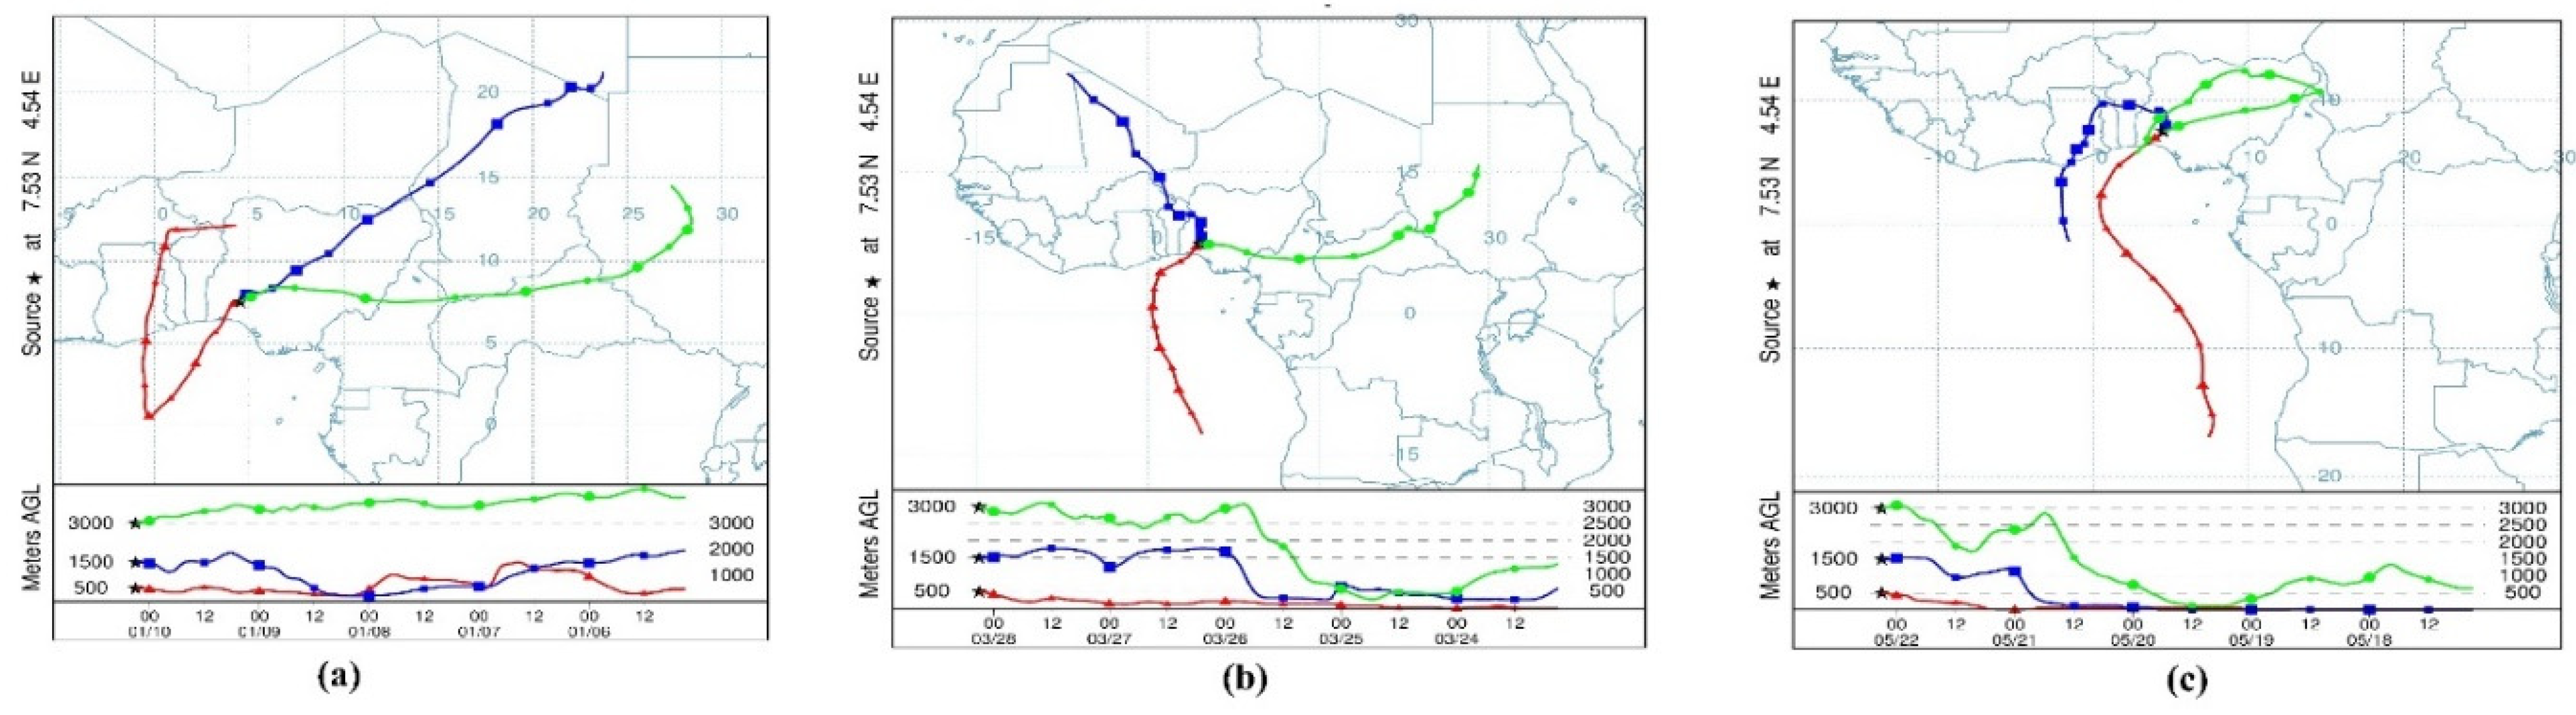
3.4. Atmospheric Turbidity and Air Mass Backward Trajectories

The 5-day backward trajectories computed using the HYSPLIT model for three particular days, 10 January 2016 (DOY 10), 28 March 2016 (DOY 88), and 22 May 2016 (DOY 143), at 04:00 local time, for the study site are presented in Figure 15. During the harmattan period (DOY 10), high turbidity is observed, with turbidity coefficient values of 15.08 for TL, 0.69 for βEST, 0.66 for KAUM, and 0.74 for SCH. However, during the transition and wet days, DOY 88 and DOY 143, there is a reduction in the atmospheric turbidity, with low turbidity coefficient values of 5.54 and 1.16 for TL, 0.53 and 0.32 for βEST, 0.42 and 0.43 for KAUM, and 0.57 and 0.34 for SCH. The trajectories reveal that the aerosol properties at the study site are significantly modified by the advection of aerosol particles from the bordering landmasses under favorable wind conditions. On DOY 10, the dust transported to the study site originated mainly from the desert regions of West, East, and North-central Sahel, covering areas from Bilma (18 N, 13′ E) in the north-east Niger to the Faya Largeau (17 N, 19′ E) in the Chad Basin, consisting of desert dust. The backward trajectories and daily average values of the Ångström exponent also indicate the presence of air masses from biomass burning and mixed aerosols, which are common in these locations during the harmattan (dry) season [93]. Similar results were obtained by [23] at Ile-Ife (7.48° N, 4.57° E), Nigeria, and using AERONET data, [93] also found the same pattern of air masses over West Africa. For DOY 88, the lowest trajectories indicate that the air masses ending at the study site originated from the South, specifically from the Gulf of Guinea, while those at the second and upper levels were from the Sahara. This shows a shift in the season and a decrease in the aerosol loading of the atmosphere due to the encroachment of the Southern trade winds—evidence of the transition into the wet season at the site [76]. On the other hand, for DOY 143, the particles were transported to the site mainly from the Gulf of Guinea, confirming the dominance of the Southern wind and the existing wet season [11,93]. The particles during this season include mixed sea salt aerosols from the Atlantic Ocean and other anthropogenic or continental aerosol sources such as urban pollution, biomass burning and dust aerosols at higher altitudes from the Sahara deserts of Northern Africa [93].

4. Conclusions

This study assessed atmospheric turbidity variations at a tropical location in Nigeria, utilizing the Ångström exponent, the turbidity coefficient, the Linke turbidity factor, the Unsworth–Monteith turbidity, and Schüepp turbidity coefficients. Measured aerosol optical depth (AOD), solar radiation, and meteorological data were used. Additionally, this study examined aerosol size distributions, monthly AOD variations, and the impact of air masses from different origins on seasonal turbidity characteristics. TL, βEST, KAUM, and SCH were derived from solar radiation data, while β and α were determined by fitting the Ångström power law expression to AOD data.
This study revealed distinct seasonal variability in atmospheric turbidity, with significantly higher values during the dry season (November–February) compared to the wet season (March–October). Monthly AOD ranged between 0.64 and 1.47, α between 0.50 and 0.91, β between 0.50 and 1.04, TL between 0.48 and 9.62, βEST between 0.20 and 0.60, KAUM between 0.11 and 0.62, and SCH between 0.21 and 0.64. Compared with the literature, the seasonal variations in the turbidity coefficients observed at this tropical site differ from seasonal trends in temperate, subtropical Mediterranean, and semi-arid climates, which show a maximum in summer.
The aerosol size distribution shifted from fine mode particles dominating the dry season to coarse mode particles during the transition as particles grow hygroscopically, as evidenced by higher α values in the dry season (up to 0.91). This study identified haziness and the presence of coarse-mode aerosol particles through low α, high β, and an anti-correlation (R = −0.77) between Ångström parameters.
Turbidity indices followed a log-normal probability distribution. For TL ≥ 5.5, TL has 69% frequency in the dry season and 1% in the wet season. For βEST, KAUM, and SCH > 0.3, frequencies are 100% in the dry season and 74%, 57%, and 78% in the wet season, respectively, indicating higher atmospheric turbidity during the dry season.
An inverse correlation between atmospheric turbidity and moisture content, relative humidity, and water vapor pressure was observed, indicating increased haze and reduced transparency during the dry season. Prevailing wind patterns were identified as driving seasonal turbidity variability. North-easterly winds during harmattan transported Saharan dust aerosols, increasing particle loading in the dry season. In contrast, clean maritime southern air masses predominate in the wet season.
Air mass backward trajectory analysis confirmed the transport of Saharan air masses during high turbidity harmattan periods in the dry season and cleaner maritime air masses from the Gulf of Guinea in the wet season. These seasonal shifts, driven by wind patterns and moisture levels, contribute to an annual cycle of high atmospheric turbidity laden with Saharan dust aerosols in the dry season and low turbidity during the wet season at Ile-Ife. This pattern correlates strongly with aerosol size distributions and air mass origins.

Supplementary Materials

The following supporting information can be downloaded at: https://www.mdpi.com/article/10.3390/atmos15030367/s1, Table S1: List of sensors used in this study; Table S2: Statistical parameters for the Linke turbidity factor (TL), the calculated Ångström turbidity coef-ficient (βEST), Schüepp (SCH), and Unsworth–Monteith (KAUM) for January–December, 2016 at Ile-Ife; Table S3: Frequency distribution of atmospheric turbidity coefficients values broken down into different categories for January–December 2016 at Ile-Ife; Table S4: Monthly mean values of sunshine duration Rs, air temperature TA, relative humidity RH, water vapor pressure ev, and precipitable water content w in Ile-Ife.

Author Contributions

O.O.S.: Conceptualization, methodology, software, data curation, validation, formal analysis, investigation, writing—original draft preparation, review and editing, visualization; B.R.: Formal analysis, investigation, writing—review and editing. All authors have read and agreed to the published version of the manuscript.

Funding

This research received no external funding.

Institutional Review Board Statement

Not applicable.

Informed Consent Statement

Not applicable.

Data Availability Statement

The datasets that support the findings of this study will be made available on request.

Acknowledgments

The authors acknowledge the efforts of the members of the Atmospheric Physics Research Group of the Department of Physics and Engineering Physics, Obafemi Awolowo University, Ile-Ife, Nigeria, during the field experiment. We are also thankful to the National Oceanic and Atmospheric Administration’s (NOAA) Air Recourses Laboratory (ARL) for providing the HYSPLIT transport and dispersion model.

Conflicts of Interest

The authors declare no conflict of interest.

References

  1. Iqbal, M. An Introduction to Solar Radiation; Academic Press: New York, NY, USA, 1983. [Google Scholar]
  2. Wild, M.; Gilgen, H.; Roesch, A.; Ohmura, A.; Long, C.N.; Dutton, E.G.; Forgan, B.; Kallis, A.; Russak, V.; Tsvetkov, A. From Dimming to Brightening: Decadal Changes in Solar Radiation at Earth’s Surface. Science 2005, 308, 847–850. [Google Scholar] [CrossRef]
  3. Wang, L.C.; Kisi, O.; Zounemat-Kermani, M.; Salazar, G.A.; Zhu, Z.; Gong, W. Solar Radiation Prediction Using Different Techniques: Model Evaluation and Comparison. Renew. Sustain. Energy Rev. 2016, 61, 384–397. [Google Scholar] [CrossRef]
  4. Wang, L.; Chen, Y.; Niu, Y.; Salazar, G.A.; Gong, W. Analysis of Atmospheric Turbidity in Clear Skies at Wuhan, Central China. J. Earth Sci. 2017, 28, 729–738. [Google Scholar] [CrossRef]
  5. Soneye, O.O.; Ayoola, M.A.; Ajao, I.A.; Jegede, O.O. Diurnal and seasonal variations of the incoming solar radiation flux at a tropical station, Ile-Ife, Nigeria. Heliyon 2019, 5, e01673. [Google Scholar] [CrossRef] [PubMed]
  6. El-Wakil, S.A.; El-Metwally, M.; Gueymard, C. Atmospheric turbidity of urban and desertic areas of the Nile basin in the aftermath of Mt. Pinatubo’s eruption. Theor. Appl. Climatol. 2001, 68, 89–108. [Google Scholar] [CrossRef]
  7. Kaskaoutis, D.; Kambezidis, H.; Jacovides, C.; Steven, M. Modification of solar radiation components under different atmospheric conditions in the greater Athens area, Greece. J. Atmos. Sol.-Terr. Phys. 2006, 68, 1043–1052. [Google Scholar] [CrossRef]
  8. Chaâbane, M. Analysis of the atmospheric turbidity levels at two Tunisian sites. Atmos. Res. 2008, 87, 136–146. [Google Scholar] [CrossRef]
  9. Kaskaoutis, D.; Kambezidis, H. The diffuse-to-globa land diffuse-to-direct-beam spectral irradiance ratios as turbidity indexes in an urban environment. J. Atmos. Sol.-Terr. Phys. 2009, 71, 246–256. [Google Scholar] [CrossRef]
  10. Gueymard, C. Clear-sky irradiance predictions for solar resource mapping and large-scale applications: Improved validation methodology and detailed performance analysis of 18 broadband radiative models. Sol. Energy 2012, 86, 2145–2169. [Google Scholar] [CrossRef]
  11. El-Metwally, M. Indirect determination of broadband turbidity coefficients over Egypt. Meteorol. Atmos. Phys. 2013, 119, 71–90. [Google Scholar] [CrossRef]
  12. Lin, A.W.; Zou, L.; Wang, L.; Gong, W.; Zhu, H. Estimation of Atmospheric Turbidity Coefficient over Zhengzhou during 1961–2013 using an improved hybrid model. Renew. Energy 2016, 86, 1134–1144. [Google Scholar] [CrossRef]
  13. Djelloul, D.; Abdanour, I.; Philippe, K.; Mohamed, Z.; Mustapha, M. Investigation of atmospheric turbidity at Ghadaa (Algeria) using both ground solar irradiance measurements and space data. Atmos. Clim. Sci. 2019, 9, 114–134. [Google Scholar] [CrossRef]
  14. Zaiani, M.; Irbah, A.; Djafer, D.; Listowski, C.; Delanoe, J.; Kaskaoutis, D.; Boualit, S.B.; Chouireb, F.; Mimouni, M. Study of atmospheric turbidity in a Northern Tropical region using models and measurements of global solar radiation. Remote Sens. 2021, 13, 2271. [Google Scholar] [CrossRef]
  15. Garniwa, P.M.P.; Lee, H. Intercomparison of the parameterized Linke turbidity factor in deriving global horizontal irradiance. Renew. Energy 2023, 212, 285–298. [Google Scholar] [CrossRef]
  16. Hansen, V. Determination of atmospheric turbidity parameters from spectral radiance measurements. Arch. Meteor. Geophys. Bioklim. Ser. B 1974, 22, 301–308. [Google Scholar] [CrossRef]
  17. Trabelsi, A.; Masmoudi, M. An investigation of atmospheric turbidity over Kerkennah Island in Tunisia. Atmos. Res. 2011, 101, 22–30. [Google Scholar] [CrossRef]
  18. Ångström, A. Techniques of determining the turbidity of the atmosphere. Tellus 1961, 13, 214–223. [Google Scholar] [CrossRef]
  19. Li, D.H.W.; Lam, J.C. A Study of Atmospheric Turbidity for Hong Kong. Renew. Energy 2002, 25, 1–13. [Google Scholar] [CrossRef]
  20. Chaâbane, M.; Masmoudi, M.; Medhioub, K. Determination of Linke turbidity factor from solar radiation measurement in Northern Tunisia. Renew. Energy 2004, 29, 2065–2076. [Google Scholar] [CrossRef]
  21. Wang, L.C.; Gong, W.; Xia, X.G.; Zhu, J.; Li, J.; Zhu, Z. Long-term observations of aerosol optical properties at Wuhan, an urban site in central China. Atmos. Environ. 2015, 10, 94–102. [Google Scholar] [CrossRef]
  22. Gueymard, C.A. Turbidity determination from broadband irradiance measurements: A detailed multi-coefficient approach. J. Appl. Meteorol. Climatol. 1998, 37, 414–435. [Google Scholar] [CrossRef]
  23. Adeyefa, D.; Adedokun, J.A. Pyrheliometric determination of atmospheric turbidity in the harmattan season over Ile-Ife, Nigeria. Renew. Energy 1991, 1, 555–566. [Google Scholar] [CrossRef]
  24. Batlles, F.J.; Olmo, F.J.; Tovar, J.; Alados-Arboledas, L. Comparison of cloudless sky parameterizations of solar irradiance at various Spanish midlatitude locations. Theor. Appl. Climatol. 2000, 66, 81–93. [Google Scholar] [CrossRef]
  25. López, G.; Batlles, F.J. Estimate of the Atmospheric Turbidity from Three Broad-Band Solar Radiation Algorithms: A Comparative Study. Ann. Geophys. 2004, 22, 2657–2668. [Google Scholar] [CrossRef]
  26. Jacovides, C.P.; Kaskaoutis, D.G.; Tymvios, F.S.; Asimakopoulos, D.N. Application of SPCTRAL2 parametric model in estimating spectral solar irradiances over polluted Athens atmosphere. Renew. Energy 2004, 29, 1109–1119. [Google Scholar] [CrossRef]
  27. Gueymard, C.A. Direct solar transmittance and irradiance predictions with broadband models. Part I: Detailed theoretical performance assessment. Sol. Energy 2003, 74, 379. [Google Scholar] [CrossRef]
  28. Gueymard, C.A. Interdisciplinary applications of a versatile spectral solar irradiance model: A review. Energy 2005, 30, 1551–1576. [Google Scholar] [CrossRef]
  29. Malik, A. A modified method of estimating Angström’s turbidity coefficient of solar radiation models. Renew. Energy 2000, 21, 537–552. [Google Scholar] [CrossRef]
  30. Kaskaoutis, D.; Kambezidis, H.; Adamopoulos, A.; Kassomenos, P. Comparison between experimental data and modeling estimates of aerosol optical depth over Athens, Greece. J. Atmos. Sol.-Terr. Phys. 2006, 68, 1167–1178. [Google Scholar] [CrossRef]
  31. Kosmopoulos, P.; Kazadzis, S.; El-Askary, H.; Taylor, M.; Gkikas, A.; Proestakis, E.; Kontoes, C.; El-Khayat, M. Earth-observation-based estimation and forecasting of particulate matter impact on solar energy in Egypt. Remote Sens. 2018, 10, 1870. [Google Scholar] [CrossRef]
  32. Power, H.C.; Willmott, C.J. Seasonal and interannual variability in atmospheric turbidity over South Africa. Int. J. Climatol. 2001, 21, 579–591. [Google Scholar] [CrossRef]
  33. Adamopoulos, A.D.; Kambezidis, H.D.; Kaskaoutis, D.G.; Giavis, G. A Study of Aerosol Particle Sizes in the Atmosphere of Athens, Greece, Retrieved from Solar Spectral Measurements. Atmos. Res. 2007, 86, 194–206. [Google Scholar] [CrossRef]
  34. Mavromatakis, F.; Franghiadakis, Y. Direct and indirect determination of the Linke turbidity coefficient. Sol. Energy 2007, 81, 896–903. [Google Scholar] [CrossRef]
  35. Ellouz, F.; Masmoudi, M.; Medhioub, K. Study of the atmospheric turbidity over Northern Tunisia. Renew. Energy 2013, 51, 513–517. [Google Scholar] [CrossRef]
  36. Li, K.M.; Li, Z.Q.; Wang, C.Y.; Huai, B. Shrinkage of Mt. Bogda Glaciers of Eastern Tian Shan in Central Asia during 1962–2006. J. Earth Sci. 2016, 27, 139–150. [Google Scholar] [CrossRef]
  37. Pan, Z.T.; Zhang, Y.J.; Liu, X.; Gao, Z. Current and Future Precipitation Extremes over Mississippi and Yangtze River Basins as Simulated in CMIP5 Models. J. Earth Sci. 2016, 27, 22–36. [Google Scholar] [CrossRef]
  38. Ristori, P.; Otero, L.; Fochesatto, J.; Flamant, P.H.; Wolfram, E.; Quel, E.; Piacentini, R.; Holben, B. Aerosol optical properties measured in Argentina: Wavelength dependence and variability based on sun photometer measurements. Opt. Lasers Eng. 2003, 40, 91–104. [Google Scholar] [CrossRef]
  39. Chaâbane, M.; Masmoudi, M.; Medhioub, K.; Elleuch, F. Daily and monthly averaged aerosol optical variability deduced from AERONET sun photometric measurements at Thala site (Tunisia). Meteorol. Atmos. Phys. 2006, 92, 103–114. [Google Scholar] [CrossRef]
  40. Linke, F. Transmissions-Koeffizient und Trübungsfaktor. Beitr. Phys. Atmos. 1922, 10, 91–103. [Google Scholar]
  41. Ångström, A. On the Atmospheric Transmission of Sun Radiation and on Dust in the Air. Geografis. Annal. 1929, 2, 156–166. [Google Scholar]
  42. Kasten, F. The Linke turbidity factor based on improved values of the integral Rayleigh optical thickness. Sol. Energy 1996, 56, 239–244. [Google Scholar] [CrossRef]
  43. Cucumo, M.; Kaliakatsos, D.; Marinelli, V. A calculation method for the estimation of the Linke turbidity factor. Renew. Energy 2000, 19, 249–258. [Google Scholar] [CrossRef]
  44. Cucumo, M.; Marinelli, V.; Oliveti, G. Experimental data of the Linke turbidity factor and estimates of the Angström turbidity coefficient for two Italian localities. Renew. Energy 2000, 17, 397–410. [Google Scholar] [CrossRef]
  45. Unsworth, M.H.; Monteith, J.L. Aerosol and solar radiation in Britain. Q. J. R. Meteorol. Soc. 1972, 98, 778–797. [Google Scholar] [CrossRef]
  46. Louche, A.; Maurel, M.; Simonnot, G.; Peri, G.; Iqbal, M. Determination of Ångström’s turbidity coefficient from direct total solar irradiance measurements. Sol. Energy 1987, 38, 89–96. [Google Scholar] [CrossRef]
  47. Masmoudi, M.; Belghith, I.; Chaabane, M. Elemental particle size distributions. Measured and estimated dry deposition in Sfax region (Tunisia). Atmos. Res. 2002, 63, 209–219. [Google Scholar] [CrossRef]
  48. Kaskaoutis, D.G.; Kambezidis, H.D. Comparison of the Ångström Parameters Retrieval in Different Spectral Ranges with the Use of Different Techniques. Meteorol. Atmos. Phys. 2007, 99, 233–246. [Google Scholar] [CrossRef]
  49. Ogunjobi, K.; Ajayi, V.; Balogun, I.; Omotosho, J.; He, Z. The Synoptic and Optical Characteristics of the Harmattan Dust Spells over Nigeria. Theor. Appl. Climatol. 2008, 93, 91–105. [Google Scholar] [CrossRef]
  50. Wen, C.C.; Yeh, H.H. Analysis of Atmospheric Turbidity Levels at Taichung Harbor near the Taiwan Strait. Atmos. Res. 2009, 94, 168–177. [Google Scholar] [CrossRef]
  51. Salazar, G.A. Estimation of monthly values of atmospheric turbidity using measured values of global irradiation and estimated values from CSR and Yang Hybrid Models. study case: Argentina. Atmos. Environ. 2011, 45, 2465–2472. [Google Scholar] [CrossRef]
  52. Schüepp, W. Die Bestimmung der Komponenten der atmosphärischen Trübung aus Aktinometermessungen. Arch. Meteorol. Geophys. Bioklim. 1949, 1, 257–317. [Google Scholar] [CrossRef]
  53. Dogniaux, R. Representation Analytiques des Composantes du Rayonnement Lumineux Solaire, Conditions du ciel Serein; IRM: Bruxelles, Belgium, 1974. [Google Scholar]
  54. Dogniaux, R. Computer procedure for accurate calculation of radiation data related to solar energy utilization. Sol. Energy 1977, 191–197. Available online: https://ui.adsabs.harvard.edu/abs/1977SoEn.191D (accessed on 25 February 2024).
  55. Capdrou, M. Atlas Solaire de l’Algérie, Modèles Théoriques et Expérimentaux; Office des Publications Universitaires, Algérie: Ben Aknoun, Algérie, 1987; Volume 1, pp. 1–2. [Google Scholar]
  56. Molineaux, B.; Ineichen, P.; Delaunay, J.-J. Direct luminous efficacy and atmospheric turbidity-Improving model performance. Sol. Energy 1995, 55, 125–137. [Google Scholar] [CrossRef]
  57. Remund, J.; Wald, L.; Lefèvre, M.; Ranchin, T.; Page, J. Worldwide Linke turbidity information. Int. Sol. Energy Soc. World Congr. 2023, 400, 13. [Google Scholar]
  58. Ineichen, P. Conversion function between the Linke turbidity and the atmospheric water vapor and aerosol content. Sol. Energy 2008, 82, 1095–1097. [Google Scholar] [CrossRef]
  59. Gueymard, C.A.; Garrison, J.D. Critical evaluation of precipitable water and atmospheric turbidity in Canada using measured hourly solar irradiance. Sol. Energy 1998, 62, 291–307. [Google Scholar] [CrossRef]
  60. Zhou, X.; Li, W.; Luo, Y. Numerical simulation of the aerosol radiative forcing and regional climate effect over China. Chin. J. Atmos. Sci. 1998, 22, 418–427. [Google Scholar]
  61. Molineaux, B.; Ineichen, P.; O’Neill, N. Equivalence of pyrheliometric and monochromatic aerosol optical depths at a single key wavelength. Appl. Opt. 1998, 37, 7008–7018. [Google Scholar] [CrossRef] [PubMed]
  62. Qiu, J. A method to determine atmospheric aerosol optical depth using total direct solar radiation. J. Atmos. Sci. 1998, 55, 744–757. [Google Scholar] [CrossRef]
  63. Qiu, J. Broadband extinction method to determine atmospheric aerosol optical properties. Tellus 2001, 53, 72–82. [Google Scholar] [CrossRef]
  64. Qiu, J.; Yang, L. Variation characteristics of atmospheric aerosol optical depths and visibility in north China during 1980–1994. Atmos. Environ. 2000, 34, 603–609. [Google Scholar] [CrossRef]
  65. Hussein, M.; Khatun, S.; Rasul, M.G. Determination of atmospheric turbidity in Bangladesh. Renew. Energy 2000, 20, 325–332. [Google Scholar] [CrossRef]
  66. Kambezidis, H.D.; Fotiadi, A.K.; Katsoulis, B.D. Variability of the Linke and Unsworth-Monteith turbidity parameters in Athens, Greece. Meteorol. Atmos. Phys. 2000, 75, 259–269. [Google Scholar] [CrossRef]
  67. Kambezidis, H.D.; Adamopoulos, A.D.; Zevgolis, D. Determination of Ångström and Schüepp’s parameters from ground based spectral measurements of beam irradiance in the UV and VIS spectrum in Athens, Greece. Pure Appl. Geophys. 2001, 158, 821–838. [Google Scholar] [CrossRef]
  68. Luo, Y.; Lu, D.; Zhou, X.; Li, W.; He, Q. Characteristics of the spatial distribution and yearly variation of aerosol optical depth over China in last 30 years. J. Geophys. Res. 2001, 106, 14501–14513. [Google Scholar] [CrossRef]
  69. Junge, C.E. Air Chemistry and Radioactivity; Academic Press: New York, NY, USA, 1963; Volume 1, pp. 185–188. [Google Scholar]
  70. Formenti, P.; Winkler, H.; Fourie, P.; Piketh, S.; Makgopa, B.; Helas, G.; Andrea, M.O. Aerosol optical depth over a remote semi-arid region of South Africa from spectral measurements of the daytime solar extinction and the nighttime stellar extinction. Atmos. Res. 2002, 62, 11–32. [Google Scholar] [CrossRef]
  71. Polo, J.; Zarzalejo, L.F.; Salvador, P.; Ramίrez, L. Angstrom turbidity and ozone column estimations from spectral solar irradiance in a semi-desertic environment in Spain. Sol. Energy 2009, 83, 257–263. [Google Scholar] [CrossRef]
  72. Saad, M.; Trabelsia, M.; Masmoudia, M.; Alfarob, C.S. Spatial and temporal variability of the atmospheric turbidity in Tunisia. J. Atmos. Sol.-Terr. Phys. 2016, 149, 93–99. [Google Scholar] [CrossRef]
  73. Kambezidis, H.D.; Psiloglou, B.E. Climatology of the Linke and Unsworth—Monteith Turbidity Parameters for Greece: Introduction to the Notion of a Typical Atmospheric Turbidity Year. Appl. Sci. 2020, 10, 4043. [Google Scholar] [CrossRef]
  74. Chabane, F.; Moummi, N.; Brima, A.A. New Approach to Estimate the Distribution of Solar Radiation Using Linke Turbidity Factor and Tilt Angle. Trans. Mech. Eng. 2021, 45, 523–534. [Google Scholar] [CrossRef]
  75. Okogbue, E.C.; Adedokun, J.A.; Holmgren, B. Hourly and daily clearness index and diffuse fraction at a tropical station, Ile-Ife, Nigeria. Int. J. Climatol. 2009, 29, 1035–1047. [Google Scholar] [CrossRef]
  76. Falaiye, O.A.; Babatunde, E.B.; Willoughby, A.A. Atmospheric aerosol loading at Ilorin, a tropical station. Afr. Rev. Phys. 2014, 9, 527–535. [Google Scholar]
  77. Soneye, O.O. Investigation of the Effect of Atmospheric Aerosol Loading on the Surface Radiation Balance at Ile-Ife Southwest Nigeria. Ph.D. Thesis, Obafemi Awolowo University, Ile-Ife, Nigeria, 2018. [Google Scholar]
  78. Rosenberg, J.; Burt, P.J.A. Windborne displacement of desert locusts from Africa to the Caribbean and South America. Aerobiology 1999, 15, 167–175. [Google Scholar] [CrossRef]
  79. Griffin, D.W.; Garrison, V.H.; Herman, J.R.; Shinn, E.A. African desert dust in the Caribbean atmosphere: Microbiology and public health. Aerobiology 2001, 17, 203–213. [Google Scholar] [CrossRef]
  80. Minka, N.S.; Ayo, J.O. Influence of cold–dry (harmattan) season on colonic temperature and the development of pulmonary hypertension in broiler chickens, and the modulating effect of ascorbic acid. Open Access Anim. Physiol. 2014, 6, 1–11. [Google Scholar] [CrossRef]
  81. Okeahialam, B.N. The Cold Dusty Harmattan: A Season of Anguish for Cardiologists and Patients. Environ. Health Insights 2016, 10, 143–146. [Google Scholar] [CrossRef] [PubMed]
  82. Perez, L.; Tobias, A.; Querol, X.; Künzli, N.; Pey, J.; Alastuey, A.; Viana, M.; Valero, N.; González-Cabré, M.; Sunyer, J. Coarse particles from Saharan dust and daily mortality. Epidemiology 2008, 19, 800–807. [Google Scholar] [CrossRef] [PubMed]
  83. Enete, J.C.; Obienusi, E.A.; Igu, I.N.; Ayadiulo, R. Harmattan dust: Composition, characteristics and effects on soil fertility in Enugu, Nigeria. Br. J. Appl. Sci. Technol. 2012, 2, 72–81. [Google Scholar] [CrossRef]
  84. Oladele, A.O. Harmattan haze and environmental health. Afr. J. Environ. Sci. Technol. 2007, 1, 1–3. [Google Scholar]
  85. Lafore, J.-P.; Flamant, C.; Guichard, F.; Parker, D.J.; Bouniol, D.; Fink, A.H.; Giraud, V.; Gosset, M.; Hall, N.; Holler, H.; et al. Progress in understanding of weather systems in West Africa. Atmos. Sci. Lett. 2011, 12, 7–12. [Google Scholar] [CrossRef]
  86. Soneye-Arogundade, O.O. Evaluation and calibration of downward longwave radiation models under cloudless sky at Ile-Ife, Nigeria. Atmósfera 2021, 34, 417–432. [Google Scholar] [CrossRef]
  87. Soneye-Arogundade, O.O.; Rappenglück, B. Estimation of Diffuse Solar Radiation Models for a Tropical Site in Nigeria. Pure Appl. Geophys. 2023, 180, 3385–3400. [Google Scholar] [CrossRef]
  88. Soneye, O.O. Evaluation of clearness index and cloudiness index using measured global solar radiation data: A case study for a tropical climatic region of Nigeria. Atmósfera 2021, 34, 25–39. [Google Scholar] [CrossRef]
  89. Calitoo Sun-Photometer. 2020. User Manual. Toulouse, Cedex—France 1-54. Available online: https://calitoo.fr/uploads/documents/en/usermanual_2020_en.pdf (accessed on 28 February 2024).
  90. Nakajima, T.; Higurashi, A.A. A use of two-channel radiances for an aerosol characterization from space. Geophys. Res. Lett. 1998, 25, 3815–3818. [Google Scholar] [CrossRef]
  91. Holben, B.N.; Eck, T.F.; Slutsker, I.; Tanre, D.; Buis, J.P.; Setzer, A.; Vermote, E.; Reagan, J.A.; Kaufman, Y.J.; Nakajima, T.; et al. AERONET—A Federated Instrument Network and Data Archive for Aerosol Characterization. Remote Sens. Environ. 1998, 6, 1–16. [Google Scholar] [CrossRef]
  92. Holben, B.N.; Tanre, D.; Smirnov, A.; Eck, T.F.; Slutsker, I.; Abuhassan, N.; Newcomb, W.W.; Schafer, J.S.; Chatenet, B.; Lavenu, F.; et al. An emerging ground-based aerosol climatology: Aerosol optical depth from AERONET. J. Geophys. Res. 2001, 106, 12067–12097. [Google Scholar] [CrossRef]
  93. Ogunjobi, K.O.; He, Z.; Simmer, C. Spectral Aerosol Optical Properties from AERONET Sun-Photometric Measurements over West Africa. Atmos. Res. 2008, 88, 89–107. [Google Scholar] [CrossRef]
  94. Kokhanovsky, A.A. Aerosol—Optics Light Absorption and Scattering by Particles in the Atmosphere; Springer: London, UK, 2008; Volume 146. [Google Scholar]
  95. Ångström, A. The Parameters of Atmospheric Turbidity. Tellus 1964, 16, 64–75. [Google Scholar] [CrossRef]
  96. Karayel, M.; Navvab, M.; Ne’eman, E.; Selkowitz, S. Zenith luminance and sky luminance distributions for daylighting calculations. Energy Build. 1984, 6, 283–291. [Google Scholar] [CrossRef]
  97. Jegede, O.O.; Ogolo, E.O.; Aregbesola, T.O. Estimating net radiation using routine meteorological data at a tropical location in Nigeria. Int. J. Sustain. Energy 2006, 25, 107–115. [Google Scholar] [CrossRef]
  98. Tu, Q.; Zhao, Y.; Guo, J.; Cheng, C.; Shi, L.; Yan, Y.; Hao, Z. Spatial and temporal variations of aerosol optical thickness over the China seas from Himawari-8. Remote Sens. 2021, 13, 5082. [Google Scholar] [CrossRef]
  99. Draxler, R.; Stunder, B.; Rolph, G.; Stein, A.; Taylor, A.; Zinn, S.; Loughner, C.; Crawford, A. HYSPLIT (Hybrid Single-Particle Lagrangian Integrated Trajectory). Air Resources Laboratory, National Oceanic and Atmospheric Administration. Available online: https://www.arl.noaa.gov/documents/reports/hysplit_user_guide.pdf (accessed on 17 December 2023).
  100. Stein, A.F.; Draxler, R.R.; Rolph, G.D.; Stunder, B.J.B.; Cohen, M.D.; Ngan, F. NOAA’s HYSPLIT atmospheric transport and dispersion modeling system. Bull. Am. Meteorol. Soc. 2015, 96, 2059–2077. [Google Scholar] [CrossRef]
  101. Karim, I.; Rappenglück, B. Impact of COVID-19 lockdown regulations on PM2.5 and trace gases (NO2, SO2, CH4, HCHO, C2H2O2 and O3) over Lahore, Pakistan. Atmos. Environ. 2023, 303, 119746. [Google Scholar] [CrossRef]
  102. Vergaz, R.; Cachorro, V.E.; de Frutos, A.M.; Vilaplana, J.M.; de la Morena, B. Columnar characteristics of aerosols in the maritime area of the Cádiz Gulf (Spain). Int. J. Climatol. 2005, 25, 1781–1804. [Google Scholar] [CrossRef]
  103. Masmoudi, M.; Chaâbane, M.; Medhioub, K.; Elleuch, F. Variability of aerosol optical thickness and atmospheric turbidity in Tunisia. Atmos. Res. 2003, 66, 175–188. [Google Scholar] [CrossRef]
  104. Asubiojo, O.I.; Obioh, I.B.; Oluyemi, E.A.; Oluwole, A.F.; Spyrou, N.M.; Farooqi, A.S.; Arshed, W.; Akanle, O.A. Elemental Characterisation of Airborne Particulates at two Nigerian Locations during the Harmattan Season. J. Radioanal. Nucl. Chem. 1993, 167, 283–293. [Google Scholar] [CrossRef]
  105. Mainguet, M. Le Borkou. Aspects d’un modèle éolien. Ann. Géogr. Année 1968, 77, 296–322. [Google Scholar] [CrossRef]
  106. WMO 1981. In Meteorological Organization World Weather Information Service–Faya-Largeau. Retrieved 24 June 2015; World Meteorological Organization: Geneva, Switzerland, 2015.
  107. NOAA National Oceanic and Atmospheric Administration. Faya–Largeau Climate Normals 1961–1990 Retrieved 24 June 2015; NOAA: Washington, DC, USA, 2015. [Google Scholar]
  108. Adeyewa, Z.D.; Balogun, E.E. Wavelength Dependence of Aerosol Optical Depth and the Fit of the Ångström Law. Theor. Appl. Climatol. 2003, 74, 105–122. [Google Scholar] [CrossRef]
  109. Ranjan, R.R.; Joshi, H.P.; Iyer, K.N. Spectral Variation of Total Column Aerosol Optical Depth over Rajkot: A Tropical Semi-Arid Indian Station. Aerosol Air Qual. Res. 2007, 7, 33–45. [Google Scholar] [CrossRef]
  110. Dubovik, O.; Smirnov, A.; Holben, B.N.; Eck, T.F.; Slutsker, I. Accuracy assessments of aerosol optical properties retrieved from Aerosol Robotic Network (AERONET) Sun and sky radiance measurements. J. Geophys. Res. 2000, 105, 9791–9806. [Google Scholar] [CrossRef]
  111. Satheesh, S.K.; KrishnaMoorthy, K.; Kaufman, Y.J.; Takemura, T. Aerosol Optical Depth, Physical Properties and Radiative Forcing Over the Arabian Sea. Meteorol. Atmos. Phys. 2006, 91, 45–62. [Google Scholar] [CrossRef]
  112. Cachorro, V.E.; Duran, P.; Vergaz, R.; de Frutos, A.M. Columnar physical and radiative properties of atmospheric aerosols in north central Spain. J. Geophys. Res. 2000, 105, 7161–7175. [Google Scholar] [CrossRef]
  113. Pashiardis, S.; Kalogirou, S.A.; Pelengaris, A. Statistical analysis and inter-comparison of Linke turbidity factor for two sites in Cyprus: Athalassa (inland location) and Larnaca (coastal location). SM J. Biom. Biostat. 2018, 3, 1029. [Google Scholar]
  114. Udo, S.O. Sky conditions at Ilorin as characterized by clearness index and relative sunshine. Sol. Energy 2000, 69, 45–53. [Google Scholar] [CrossRef]
  115. Balogun, E.E. The phenomenology of the atmosphere over West Africa. In Proceedings of the Ghana Scope’s Conference on Environment and Development in West African, Accra, Ghana, 1–7 September 1974; Ghana Academy of Arts and Science: Accra, Ghana, 1974; pp. 19–31. [Google Scholar]
  116. D’Almeida, G.A. A model for Saharan dust transport. J. Climatol. Appl. Meteorol. 1986, 25, 903–916. [Google Scholar] [CrossRef]
  117. Gobbi, G.P.; Barnaba, F.; Ammannato, L. The vertical distribution of aerosols, Saharan dust and cirrus clouds in Rome (Italy) in the year 2001. Atmos. Chem. Phys. 2004, 4, 351–359. [Google Scholar] [CrossRef]
  118. Koren, I.; Kaufman, Y.J.; Washington, R.; Todd, M.C.; Rudich, Y.; Martins, J.V.; Rosenfeld, D. The Bodélé depression: A single spot in the Sahara that provides most of the mineral dust to the Amazon forest. Environ. Res. Lett. 2006, 1, 014005. [Google Scholar] [CrossRef]
  119. Shalaby, A.; Rappenglueck, B.; Eltahir, E.A.B. The climatology of dust aerosol over the Arabian Peninsula. Atmos. Chem. Phys. Discuss. 2015, 15, 1523–1571. [Google Scholar] [CrossRef]
  120. Shao, Y.; Wyrwoll, K.; Chappell, A.; Huang, J.; Lin, Z.; Mctainsh, G.H.; Mikami, M.; Tanaka, T.Y.; Wang, X.; Yoon, S. Dust cycle: An emerging core theme in earth system science. Aeolian Res. 2011, 2, 181–204. [Google Scholar] [CrossRef]
  121. O’Neill, N.T.; Ignatov, A.; Holben, B.N.; Eck, T.F. The lognormal distribution as a reference for reporting aerosol optical depth statistics: Empirical tests using multi-year, multi-site AERONET sunphotometer data. Geophys. Res. Lett. 2000, 27, 3333–3336. [Google Scholar] [CrossRef]
  122. Voinea, S.; Stefan, S. Study of the Ångström turbidity over Romanian Black Sea coast. J. Atmos. Sol.-Terr. Phys. 2019, 182, 67–78. [Google Scholar] [CrossRef]
  123. Lehahn, Y.; Koren, I.; Boss, E.; Ben-Ami, Y.; Altaratz, O. Estimating the maritime component of aerosol optical depth and its dependency on surface wind speed using satellite data. Atmos. Chem. Phys. 2010, 10, 6711–6720. [Google Scholar] [CrossRef]
  124. Flowers, E.C.; McCormick, R.A.; Kurfis, K.R. Atmospheric turbidity over the United States, 1961–1966. J. Appl. Meteorol. Climatol. 1969, 8, 955–962. [Google Scholar] [CrossRef]
  125. Frantzen, A.J. The turbidity at De Bilt in the Netherlands. Arch. Met. Geoph. Biokl. 1977, 24, 307–320. [Google Scholar] [CrossRef]
  126. Smirnov, A.; Villevalde, Y.; O’Neill, N.T.; Royer, A.; Tarussov, A. Aerosol optical depth over oceans: Analysis in terms of synoptic air mass types. J. Geophys. Res. 1995, 100, 16639–16650. [Google Scholar] [CrossRef]
  127. Smirnov, A.; O’Neill, N.T.; Royer, A.; Tarussov, A.; McArthur, L.J.B. Aerosol optical depth over Canada and the link with synoptic air mass types. J. Geophys. Res. 1996, 101, 19299–19318. [Google Scholar] [CrossRef]
  128. Uhlig, E.M.; Stettler, M.; Hoyningen-Huene, W. Experimental studies of the variability of the extinction coefficient by different air masses. Atmos. Environ. 1994, 28, 811–814. [Google Scholar] [CrossRef]
  129. Kalu, A.E. The African dust plume: Its characteristics and propagation across West Africa. In Saharan Dust; Wiley: New York, NY, USA, 1979; Volume 5, pp. 95–118. [Google Scholar]
  130. Oluwafemi, C.O. Preliminary solar spectrophotometric measurements of aerosol optical density at Lagos, Nigeria. Atmos. Environ. 1979, 13, 1611–1615. [Google Scholar] [CrossRef]
  131. McTainsh, G.H. Harmattan dust deposition in northern Nigeria. Nature 1980, 286, 587–588. [Google Scholar] [CrossRef]
  132. Brinkman, A.W.; McGregor, J. Solar radiation in dense Saharan aerosol in northern Nigeria. Q. J. R. Meteorol. Soc. 1983, 109, 831–847. [Google Scholar] [CrossRef]
  133. Adedoyin, J.A. Initiation of West African squall lines. Meteorol. Atmos. Phys. 1989, 41, 99–103. [Google Scholar] [CrossRef]
  134. Johnson, O.M.; Jennifer, N.A. Temperature variability, intensity of wind speed and visibility during harmattan in Makurdi town, Nigeria. J. Res. Natl. Dev. 2017, 15, 198–206. [Google Scholar]
  135. Audu, M.O.; Terwase, A.S.; Isikwue, B.C. Investigation of wind speed characteristics and its energy potential in Makurdi, north central, Nigeria. SN Appl. Sci. 2019, 1, 178. [Google Scholar] [CrossRef]
  136. Rizk, H.F.S.; Fareg, S.A.; Ateia, A.A.; El-Bialy, A. Effect of pollutant aerosols on spectral atmospheric transmissivity in Cairo. Environ. Int. 1985, 11, 487–492. [Google Scholar] [CrossRef]
  137. Rizk, H.F.S.; Soliman, S.H.; El-Bialy, A.; Ateia, A.A. Aerosol optical thickness in Cairo atmosphere. J. Inst. Eng. 1986, 66, 45–51. [Google Scholar]
  138. Adam, M.E.; El-Nobi, E.F. Correlation between Air Temperature and Atmospheric Turbidity at a Subtropical Location. World Environ. 2017, 7, 1–9. [Google Scholar] [CrossRef]
  139. Rapti, A.S. Atmospheric transparency, atmospheric turbidity, and climatic parameters. Sol. Energy 2000, 69, 99–111. [Google Scholar] [CrossRef]
Figure 1. The outline map of Nigeria showing the location of the study area.
Atmosphere 15 00367 g001
Figure 2. Map of the measurement point at the Teaching and Research Farm (A) and the roof top of the DP&EP Building (B), Obafemi Awolowo University, Ile-Ife (Source: Esri, USGS Map data).
Atmosphere 15 00367 g002
Figure 3. Arrangements of the sensors at the OAU meteorological site in Ile-Ife, Nigeria.
Atmosphere 15 00367 g003
Figure 4. Monthly variations in aerosol optical depth (AOD) and departure from the monthly mean (DMM) of AOD at Ile-Ife in the period January–June 2016.
Atmosphere 15 00367 g004
Figure 5. Daily values of the Ångström exponent (α) and turbidity coefficients (β) derived from AOD measurements for January–June 2016 (DOY 8–182).
Atmosphere 15 00367 g005
Figure 6. Monthly means of the Ångström exponent (α) and turbidity coefficients (β) derived from AOD measurements for January–June 2016.
Atmosphere 15 00367 g006
Figure 7. Regression between the Ångström turbidity coefficient (β) and the Ångström exponent (α) at Ile-Ife for January–June 2016.
Atmosphere 15 00367 g007
Figure 8. Regression between the Ångström turbidity coefficient (β) and the Ångström exponent (α) at Ile-Ife for the dry (Jan–Feb), transition (Mar–Apr), and wet (May–Jun) seasons in 2016.
Atmosphere 15 00367 g008
Figure 9. Daily variation in the (a) Linke turbidity factor and (b) calculated Ångström turbidity coefficient values at Ile-Ife in the period January–December 2016.
Atmosphere 15 00367 g009
Figure 10. Monthly variation in the (a) Linke turbidity factor and (b) calculated Ångström turbidity coefficient values at Ile-Ife for January–December 2016.
Atmosphere 15 00367 g010
Figure 11. Frequency distributions for (a) the Linke turbidity factor and (b) Unsworth–Monteith, (c) the calculated Ångström turbidity coefficient, and (d) Schüepp at Ile-Ife in the period January–December 2016, broken down into annual values and for the dry and wet months.
Atmosphere 15 00367 g011
Figure 12. Distribution of the wind direction and wind speed for (a) the dry months (November–February 2016) and (b) the wet months (March–October 2016) at Ile-Ife.
Atmosphere 15 00367 g012
Figure 13. Monthly variations in the normalized Linke turbidity factor (TLN) and relative humidity (RHN) and water vapor pressure (eVN) at Ile-Ife in the period January-December, 2016.
Atmosphere 15 00367 g013
Figure 14. Regression between the normalized Linke turbidity factor (TLN) denoted with black color, the calculated Ångström turbidity coefficient (βESTN) denoted with red color, and water vapor pressure (eVN) at Ile-Ife in the period January-December 2016.
Atmosphere 15 00367 g014
Figure 15. Five-day backward trajectories computed with HYSPLIT for Ile-Ife: (a) 10 January 2016 (DOY 10); (b) 28 March 2016 (DOY 88); (c) 22 May 2016 (DOY 143). The red, blue, and green colors correspond to heights of 500 m, 1500 m, and 3000 m above ground level (agl), respectively.
Atmosphere 15 00367 g015
Disclaimer/Publisher’s Note: The statements, opinions and data contained in all publications are solely those of the individual author(s) and contributor(s) and not of MDPI and/or the editor(s). MDPI and/or the editor(s) disclaim responsibility for any injury to people or property resulting from any ideas, methods, instructions or products referred to in the content.

