Article

Effects of Orography on the High-Temperature Event on 22 June 2023 in North China

1
Key Laboratory of Mesoscale Severe Weather, Ministry of Education, School of Atmospheric Sciences, Nanjing University, Nanjing 210023, China
2
Key Laboratory of Radar Meteorology, China Meteorology Administration, Nanjing 210023, China
*
Author to whom correspondence should be addressed.
Atmosphere 2024, 15(3), 324; https://doi.org/10.3390/atmos15030324
Submission received: 15 January 2024 / Revised: 28 February 2024 / Accepted: 1 March 2024 / Published: 5 March 2024
(This article belongs to the Section Meteorology)

Abstract

:
An extreme high-temperature event occurred in North China on 22 June 2023, with the maximum temperature reaching 41.8 °C. The high-temperature centers preferentially occurred at the foothills of the Taihang and Yanshan Mountains, indicating an important role of the underlying orography. In the present work, we study the orographic effects of this extreme high-temperature event according to high-resolution numerical simulations using the Weather Research and Forecasting model. The results show that the presence of the mountains in North China contributed notably to the high-temperature event, which can enhance the 2 m air temperature by up to 3 °C. In the daytime, the enhancement of temperature is primarily due to the diabatic heating of sensible heat flux at the terrain surface caused by solar shortwave radiation, whereas the well-known foehn effect has little contribution. Indeed, the dynamically forced downslope flow of foehn is totally suppressed by the upslope flow of the thermally driven mountain-plain circulation. In the nighttime, the sensible heat flux at the terrain surface changes to weakly negative, given the cooling of land surface longwave radiation. As a result, the enhancement of near-surface temperature at the terrain foothill is dominated by the adiabatic warming of downslope flow. Yet, the near-surface temperature far away from the mountain is enhanced by the subsidence warming of a synoptic anomalous anti-cyclone, which is induced by the diabatic heating over the mountains in the daytime. These findings help improve the understanding of the thermal and dynamical effects of orography on the occurrence of high-temperature events.

1. Introduction

The continuous intensification of global warming has led to an increasing frequency of extreme high-temperature events around the world [1,2,3,4,5]. Such extreme events will bring significant challenges to both human society and the economy, including agricultural production, infrastructure and human health [6]. For example, the heat waves in Europe in 2003 and 2010 caused tens of thousands of casualties and tens of billions of dollars in economic losses [7,8,9,10].
The occurrence of extreme high temperature is often associated with the formation and maintenance of high-pressure systems. Neal et al. [11] found that the high-temperature event in the northwestern Pacific Ocean during 2021 resulted from a blocking high, which inhibited the low-level convective activity, leading to an increase in surface sensible heat flux. Hua et al. [12] found that the high-temperature event that occurred in China during 2022 was caused by an anomalously strong West Pacific Subtropical High (WPSH), which brought strong warm advection, subsidence warming and sensible heat flux. Using the Lagrangian method, Lee and Grotjahn [13] found that the low-level warming along the western coast of North America was mainly caused by warm advection and adiabatic subsidence warming, both of which were controlled by a high-pressure ridge. Zschenderlein et al. [14] investigated the European heat waves using the same method and found that under the influence of high-pressure systems, the adiabatic subsidence warming and diabatic heating of sensible fluxes contributed the most to the high temperature, while the horizontal warm advection can be disregarded. In addition, low soil moisture was also considered to be an important factor contributing to the high-temperature events. For example, Whan et al. [15] compared the intensity of heat waves under different soil moistures through numerical experiments and found that dry soil can result in about a 1 °C increase in temperature. Teng et al. [16] found that future temperature increases in North America will be mainly due to the decrease in local soil moisture.
As reported by the National Oceanic and Atmospheric Administration (NOAA), the average global surface (land and ocean) temperature in June 2023 was 1.5 °C above average, making June 2023 the warmest June on record (see more information at the official website https://www.noaa.gov/news/earth-just-had-its-hottest-june-on-record, accessed on 1 September 2023). North China also experienced the hottest June in the last 10 years. Persistent and widespread high temperatures occurred during 21–24 June, which reached up to 41.8 °C. The daily maximum temperature broke the historical (June) record at 21 (48) national weather stations (see the official report from the China Meteorological administration at https://www.cma.gov.cn/2011xwzx/2011xqxxw/2011xqxyw/202307/t20230704_5626327.html, accessed on 1 September 2023). Interestingly, the high-temperature centers are very close to the mountains in North China, which are mainly located to the east of the Taihang Mountains and south of the Yanshan Mountains (Figure 1). Previous studies have revealed that orography has an important impact on the temperature in its surrounding area [17,18,19,20,21]. Grotjahn [22] studied the hot days in California Central Valley and found that an anomalous downslope easterly flow usually occurs over the Sierra Nevada Mountain, i.e., to the east of the valley, which heats the valley by subsidence warming. Similarly, Loikith and Kalashnikov [23] found that during the 2021 Pacific Northwest heat wave event, there was an anomalous easterly flow over the Cascade Mountains that heated the atmosphere through adiabatic heating. The warming caused by downslope winds can be viewed as the dynamical effect of the orography. This effect can be modified by the mountain-valley breeze, namely, a mesoscale solenoid that is thermally driven by the difference between the thermal properties of the terrain and air [24]. Moreover, the orography can diabatically heat the near-surface air via sensible heating, because it warms more rapidly in response to the solar shortwave radiation than the air. Therefore, orography actually has both dynamical and thermal effects which work mutually to affect the near-surface temperature.
In this work, the extreme high-temperature event that occurred on 22 June of 2023 in North China is studied using high-resolution numerical simulations. The main purpose is to understand the impact of orography on the high-temperature centers at the foothill of the mountains in North China. In particular, is it the dynamical or thermal effect of orography that contributes most to this extreme high-temperature event? The rest of this paper is organized as follows. The datasets and design of numerical experiments are described in Section 2. Section 3 gives the case overview and analyzes the large-scale circulation of this high-temperature event, with the impacts of orography investigated in Section 4. Finally, the paper is summarized and discussed in Section 5.

2. Data and Experimental Design

In order to study the large-scale circulation of the extreme high-temperature event in North China, the hourly 0.25 × 0.25° ERA5 reanalysis is used, which is produced by the Integrated Forecast System (IFS) at the European Center for Medium-Range Weather Forecasts (ECMWF) [25]. Moreover, this dataset is used to provide the initial and boundary conditions for the regional simulations conducted by virtue of the Weather Research and Forecasting (WRF) mesoscale numerical model [26].
The WRF model is configured with a single domain of 4 km horizontal resolution, which well resolves the complex terrain in North China (Figure 2a), including the Taihang and Yanshan Mountains. In the vertical area, there are 51 levels, with the level interval varying from about 50 m near the surface to about 600 m near the model top at 50 hPa. To minimize the artificially downward reflected gravity waves at the rigid model top, a sponge layer is set in the topmost 5 km of the model domain. For the model physics, the New Thompson scheme is used [27], along with the RRTMG (rapid radiative transfer module for general circulation models) longwave and shortwave radiation schemes [28], the Yonsei University (YSU) planetary boundary layer scheme [29], the Noah land surface model [30] and the Revised Mesoscale Model version 5 (MM5) similarity scheme for surface layer [31]. These physics schemes are similar to the NCAR Convection-Permitting Suite, which has been found to be skillful and robust in the mid-latitudes [26]. Note that the MYJ and Eta similarity schemes in this suite have been replaced by the YSU and Revised MM5 schemes, respectively, because the sensible heat flux in these two schemes is a diagnostic variable, which cannot easily perform the sensitivity experiment of noHEAT, as described below.
In order to better understand the orographic effects on the high temperature, three numerical experiments are conducted, namely, CTL, noHEAT and noMOUNTAIN. The CTL is the control experiment that considers both the dynamical and thermal effects of the mountains in North China, which are basically the Taihang and Yanshan Mountains. In the noHEAT experiment, the surface sensible heat flux is manually turned off in the mountainous area of North China (which is defined as the region of terrain height over 300 m, i.e., the irregular thick black rectangle in Figure 2b that excludes the Tai Mountains in the southeast corner of North China). This is achieved by modifying the scheme of the Noah land surface model, that is, setting the variable SHEAT to zero in this region. On the basis of noHEAT, the noMOUNTAIN experiment further reduces 90% of the terrain over 300 m in the mountainous area of North China. In this regard, the thermal effect of the mountains in North China can be represented by the difference between the two experiments of CTL and noHEAT (i.e., CTL minus noHEAT) while their dynamical effect by noHEAT minus noMOUNTAIN.
All the numerical simulations start at 0000 UTC on 21 June 2023 and are integrated forward by 72 h, with a timestep of 15 s. Note that the first 12 h is taken as the model spin-up time and, thus, not considered in the analyses.

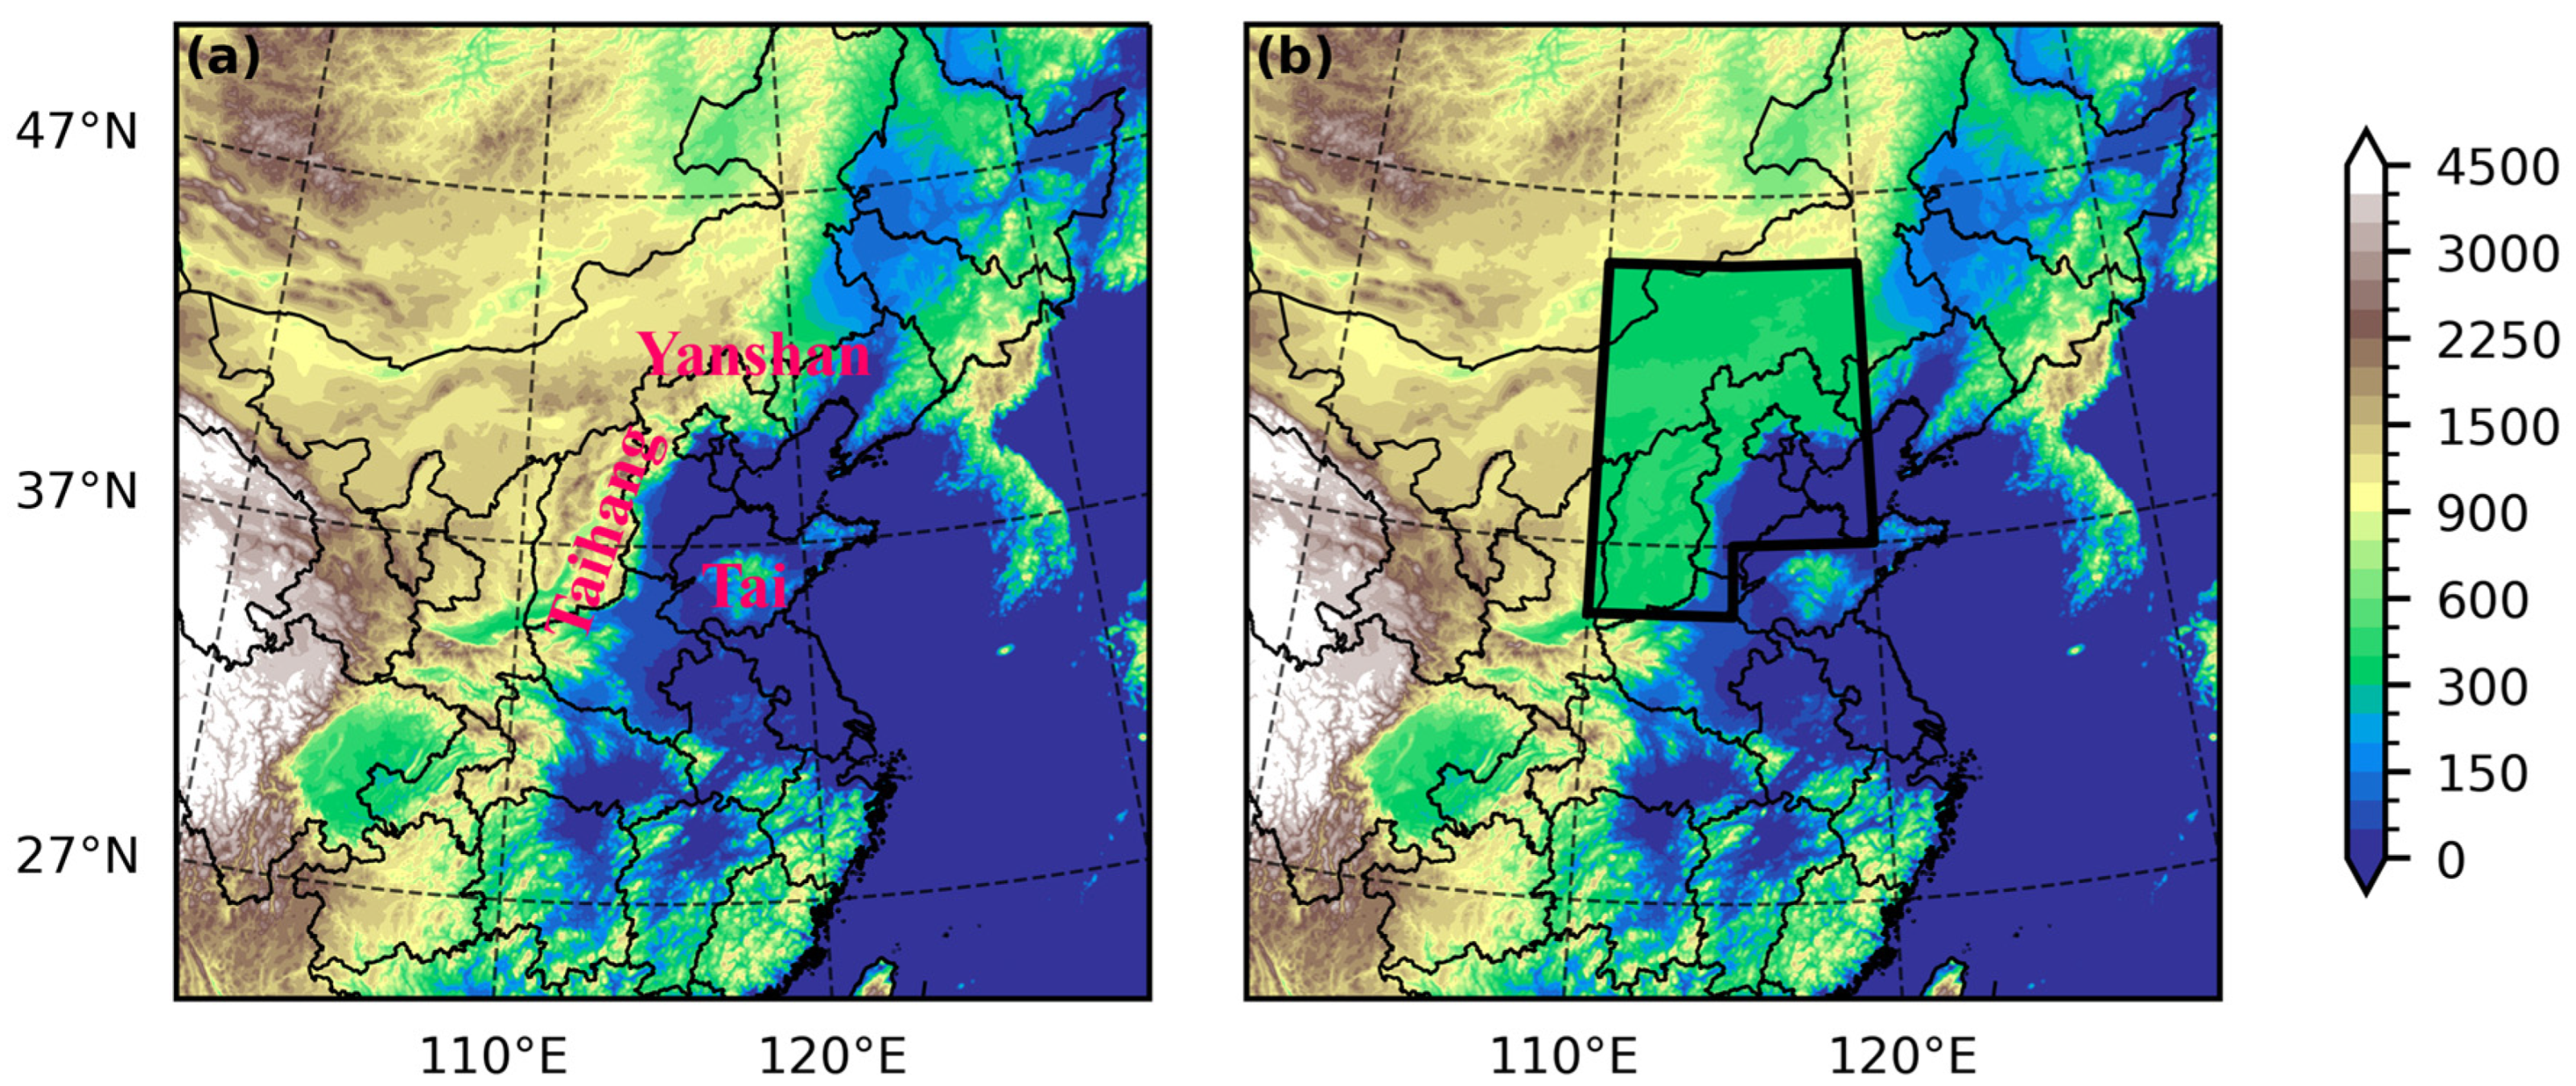
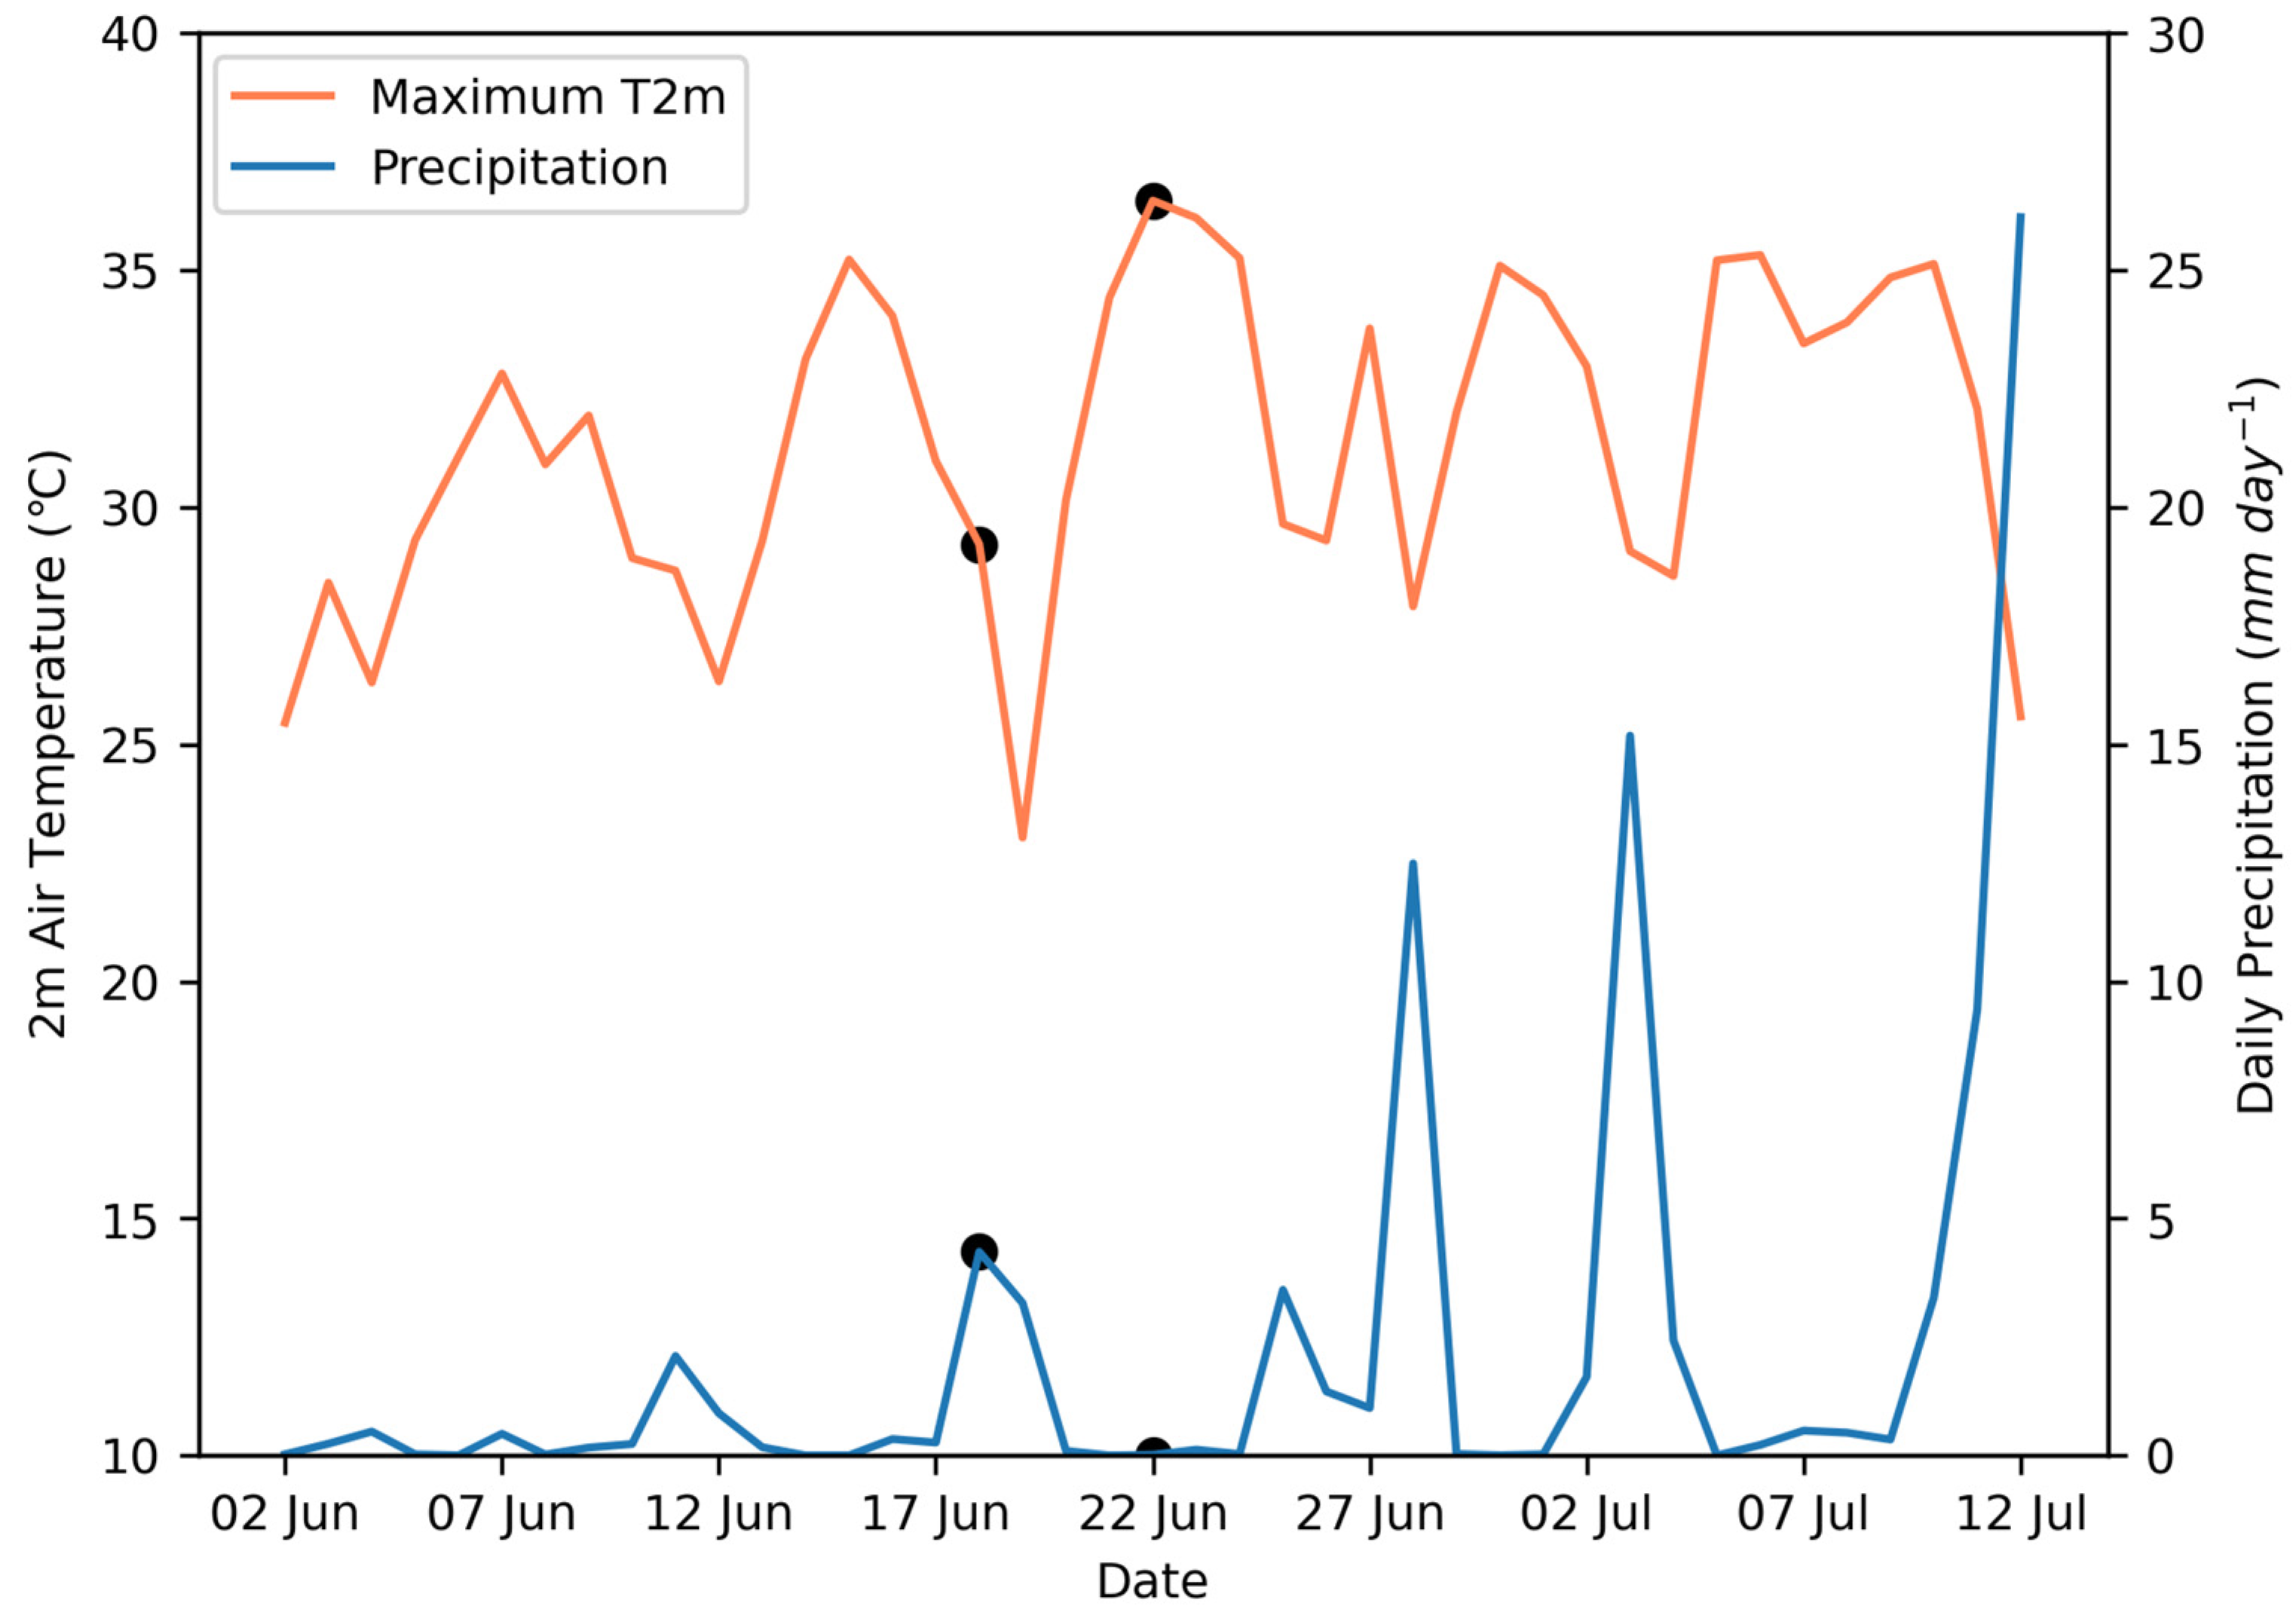
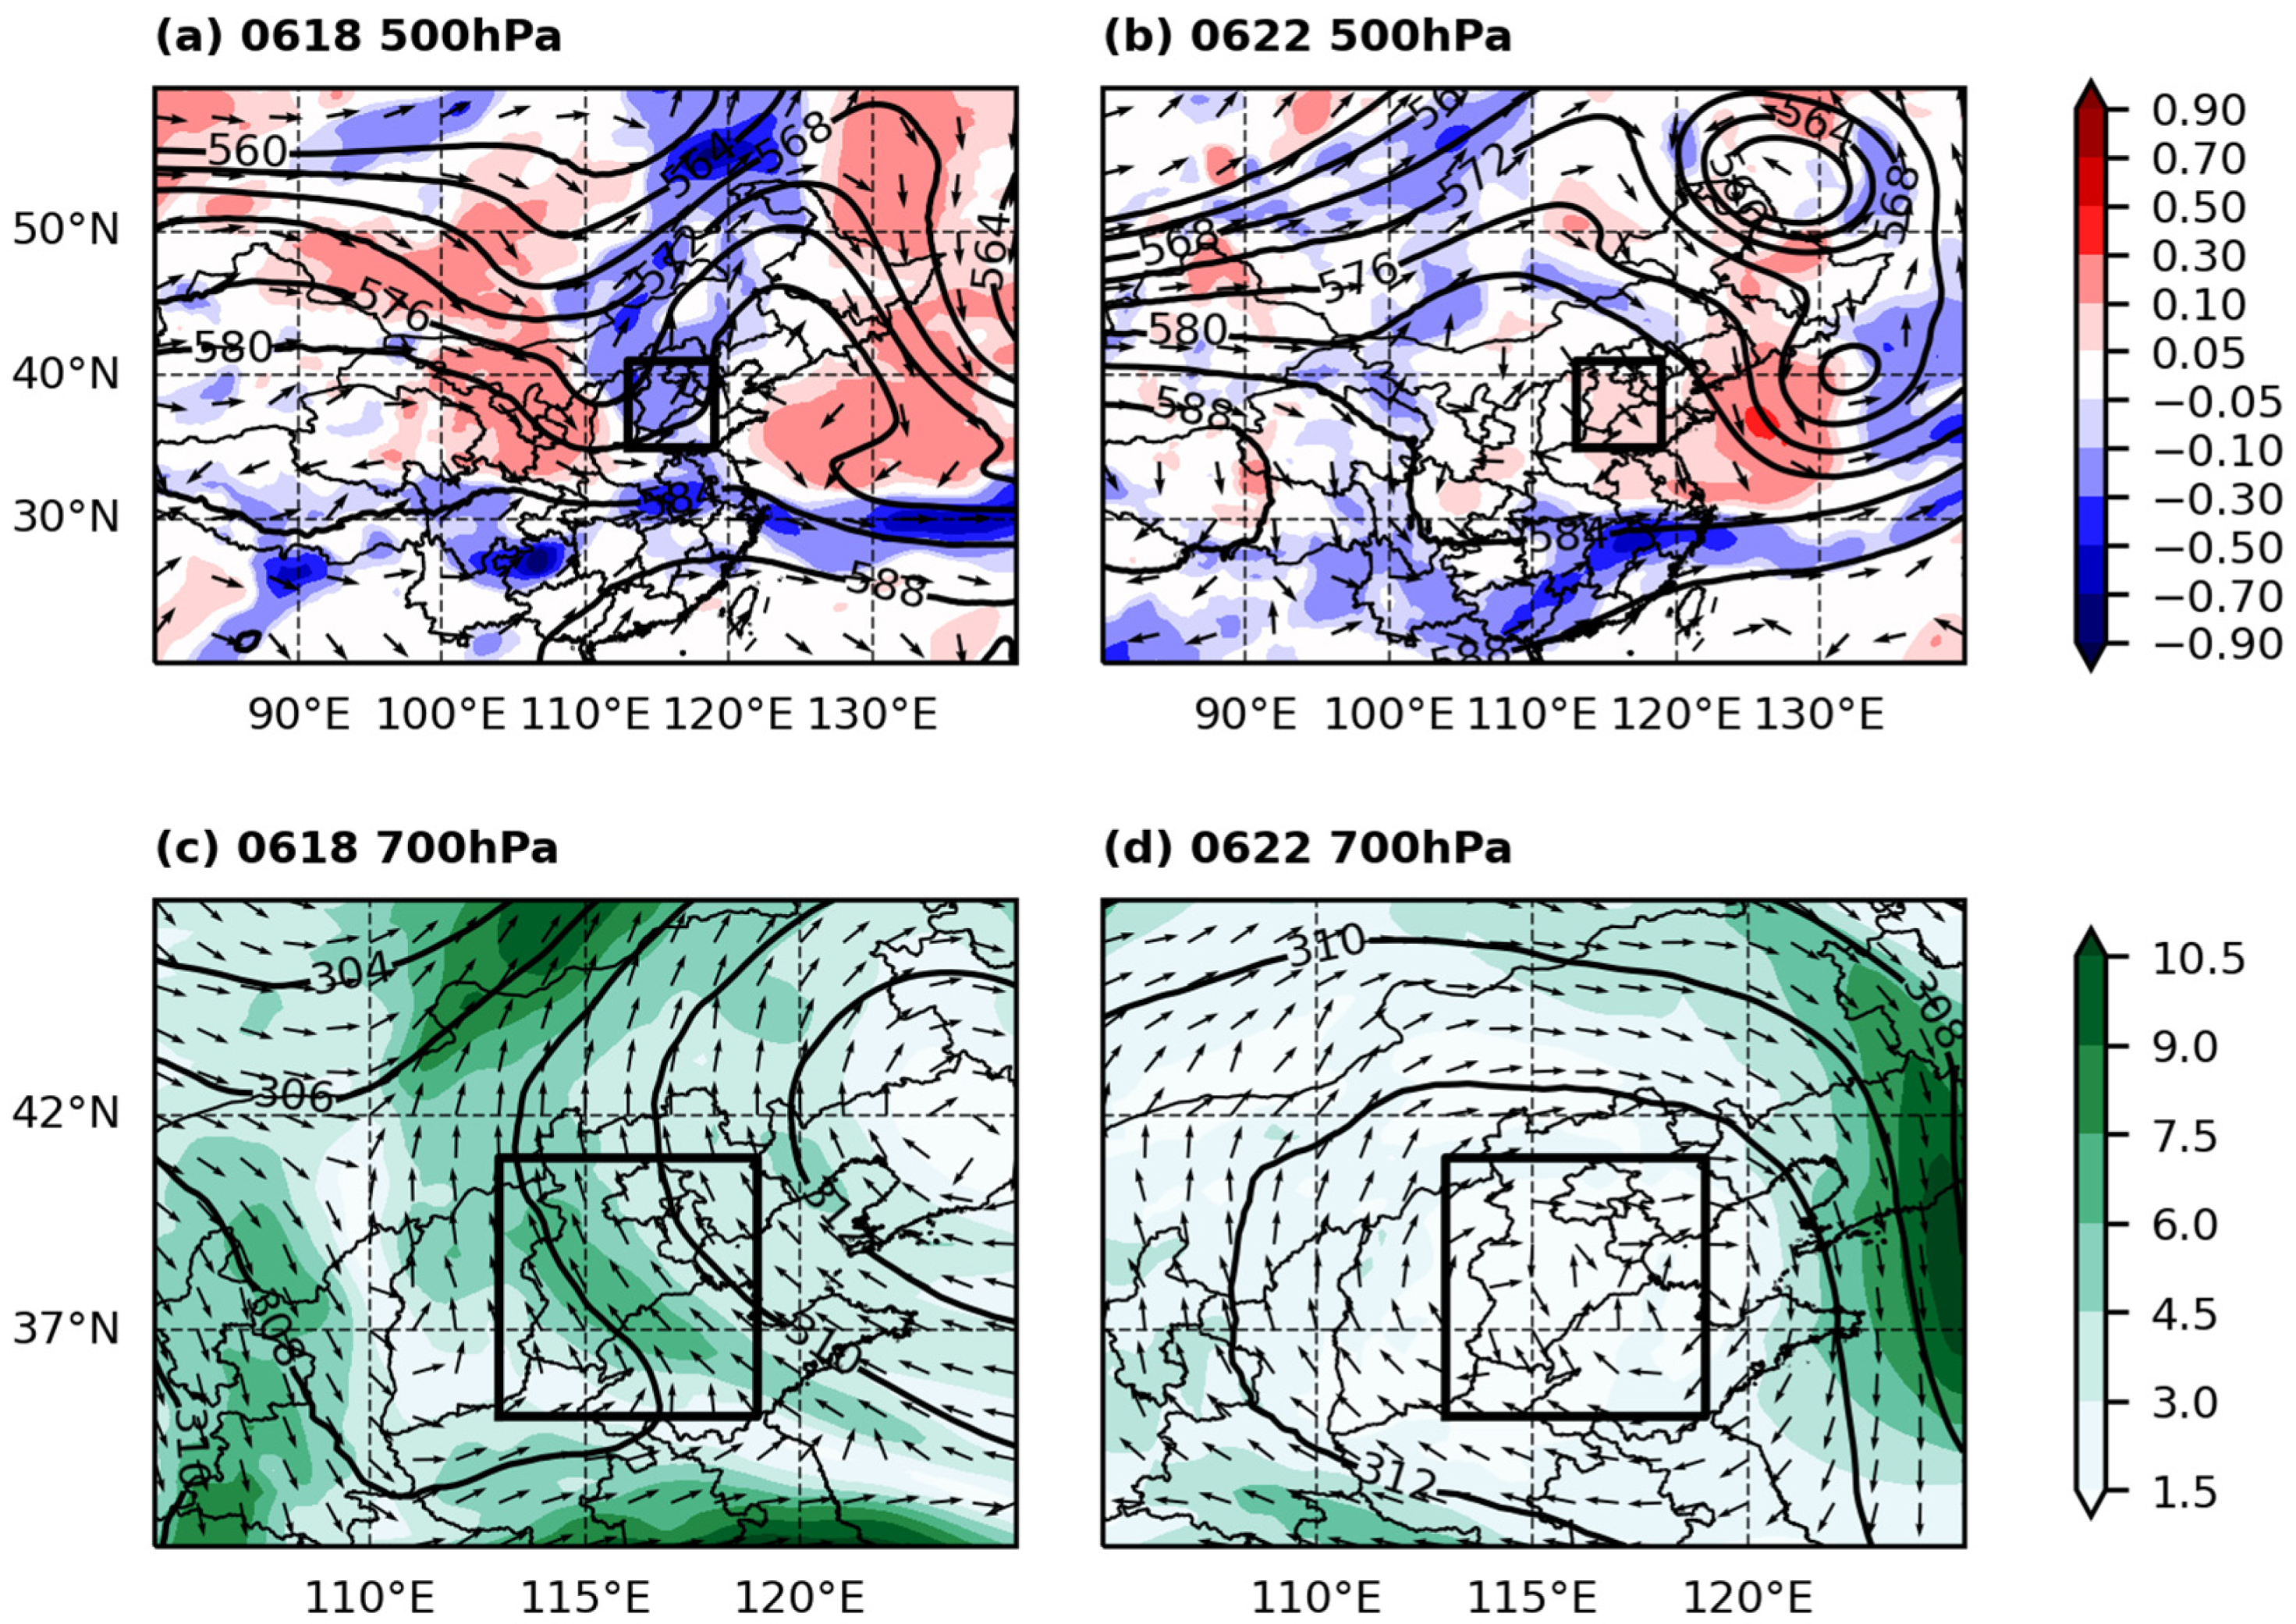
3. Case Overview and Large-Scale Circulation

North China experienced several high-temperature days in June 2023. Figure 3 shows the evolution of the daily maximum 2 m air temperature averaged in North China (see the black box in Figure 4a). Also shown is the regional mean daily precipitation. The maximum 2 m air temperature in North China fluctuates at a period of about 5–10 days, i.e., synoptic scale, with the hottest day occurring on 22 June. The daily precipitation also fluctuates with time, which tends to be out of phase with that of 2 m air temperature. It, thus, suggests the influence of synoptic weather systems like mid-latitude troughs and ridges on the temperature and precipitation.
Figure 4a,b separately show the large-scale circulations at 500 hPa on 18 June and 22 June 2023. It is clear that North China was under the control of deep troughs and ridges in the mid-latitudes, respectively, on these two days. In the lower troposphere of 700 hPa, the southeasterly flow transported plentiful moisture from the ocean inland to North China on 18 June (Figure 4c), which, in conjunction with the ascent motion ahead of the mid-tropospheric trough (Figure 4a), favored the occurrence of precipitation on that day (Figure 3). On the contrary, there was an anti-cyclonic circulation at 700 hPa in North China on 22 June 2023, which was not conductive to the transport of water vapor from the ocean (Figure 4d). The lower troposphere was, thus, much drier than on 18 June 2023. Moreover, the pre-ridge subsidence (Figure 4b) acted to suppress the vertical lifting of air parcels and, hence, convective activity, leading to no precipitation in North China on that day (Figure 3).
The transition of the large-scale circulation clearly set up a favorable environment condition for the occurrence of the extreme high temperature on 22 June 2023. However, it cannot explain why the high-temperature center preferentially occurred at the foothills of the Taihang and Yanshan Mountains in North China, which will be studied according to the high-resolution WRF simulations in the next section.

4. Results

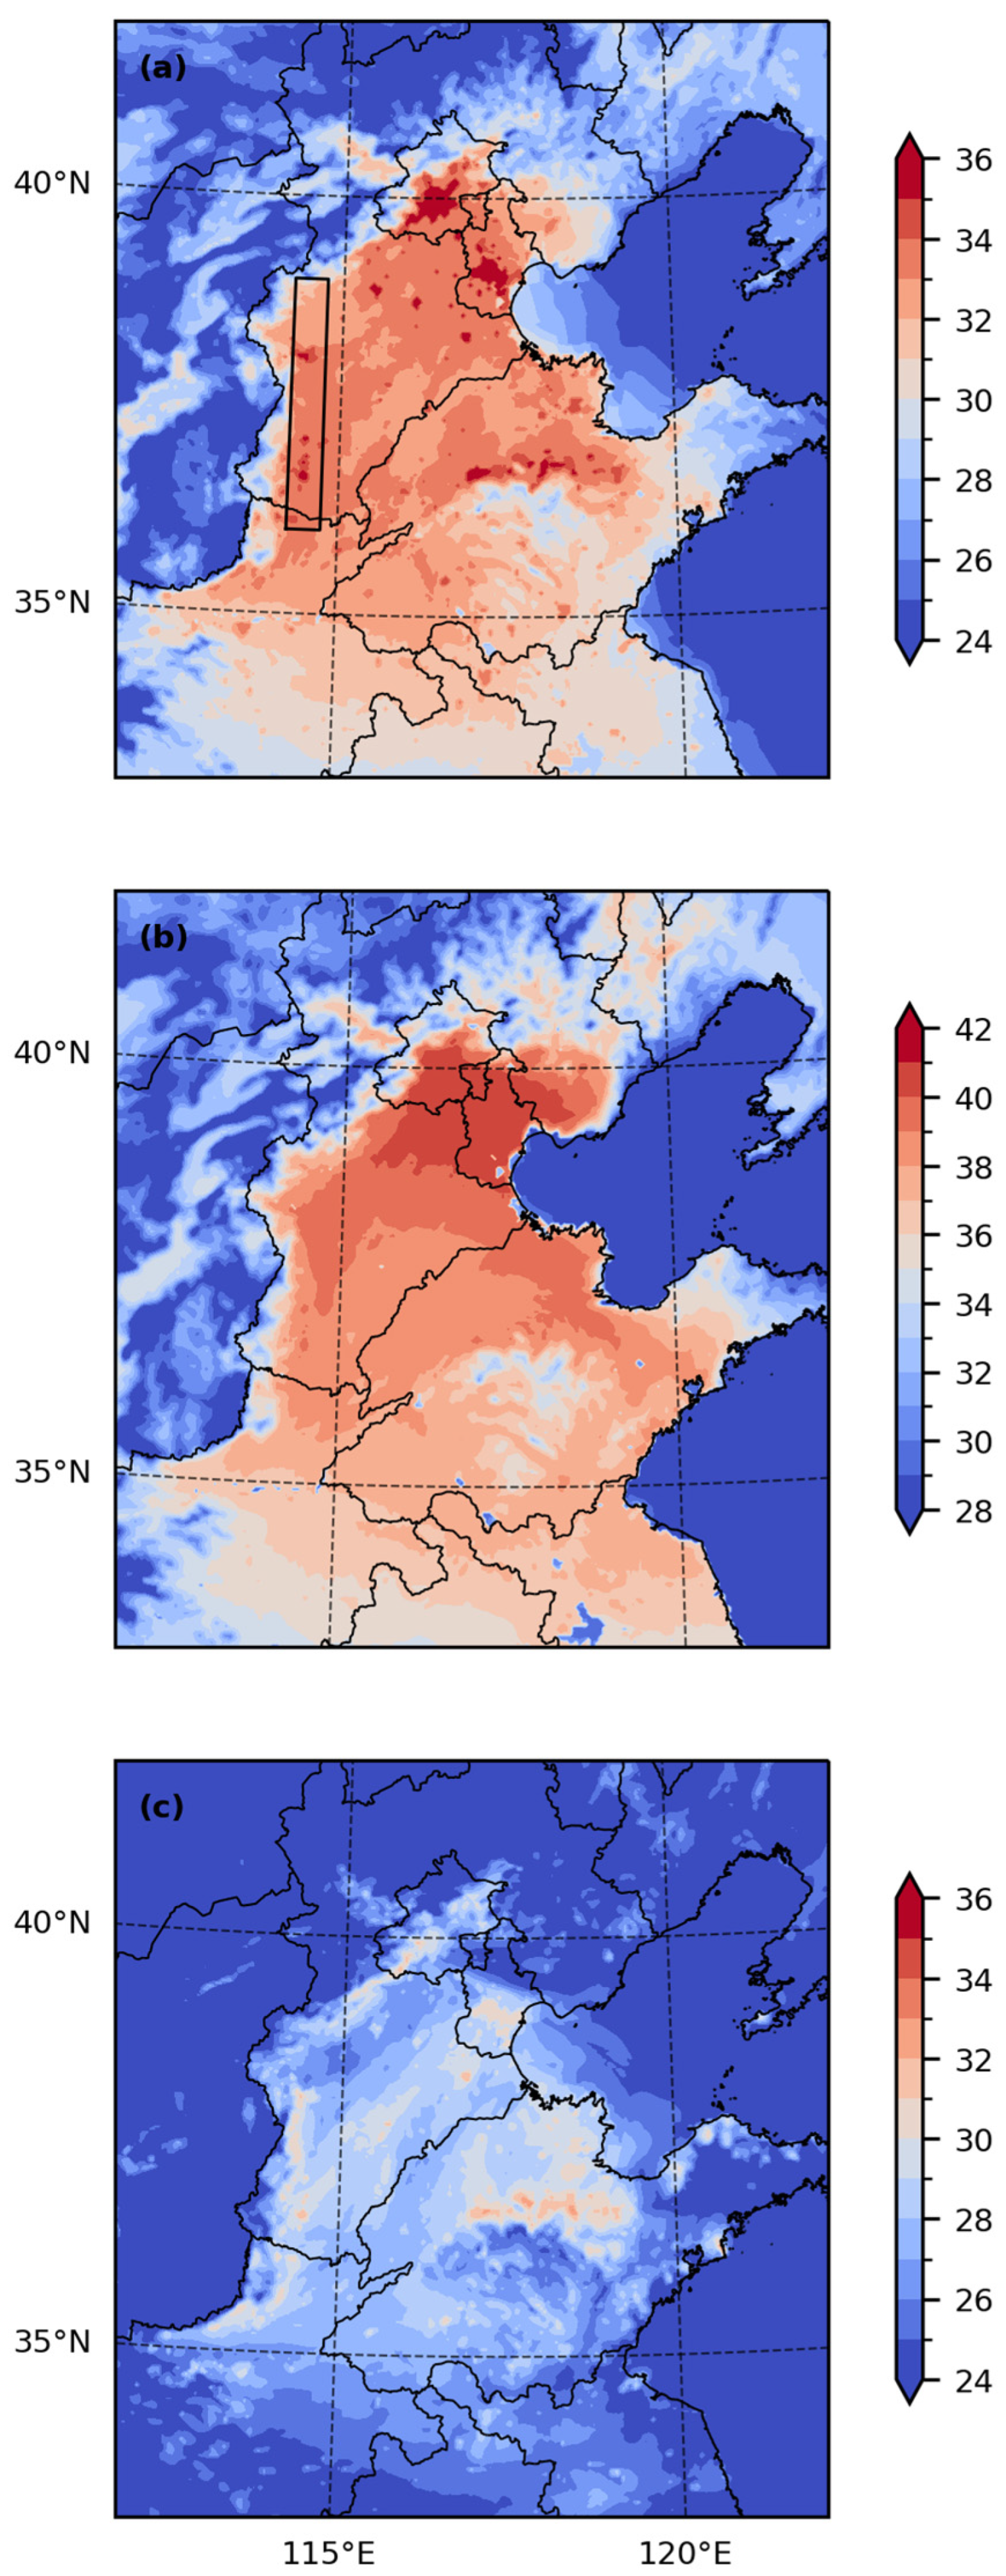
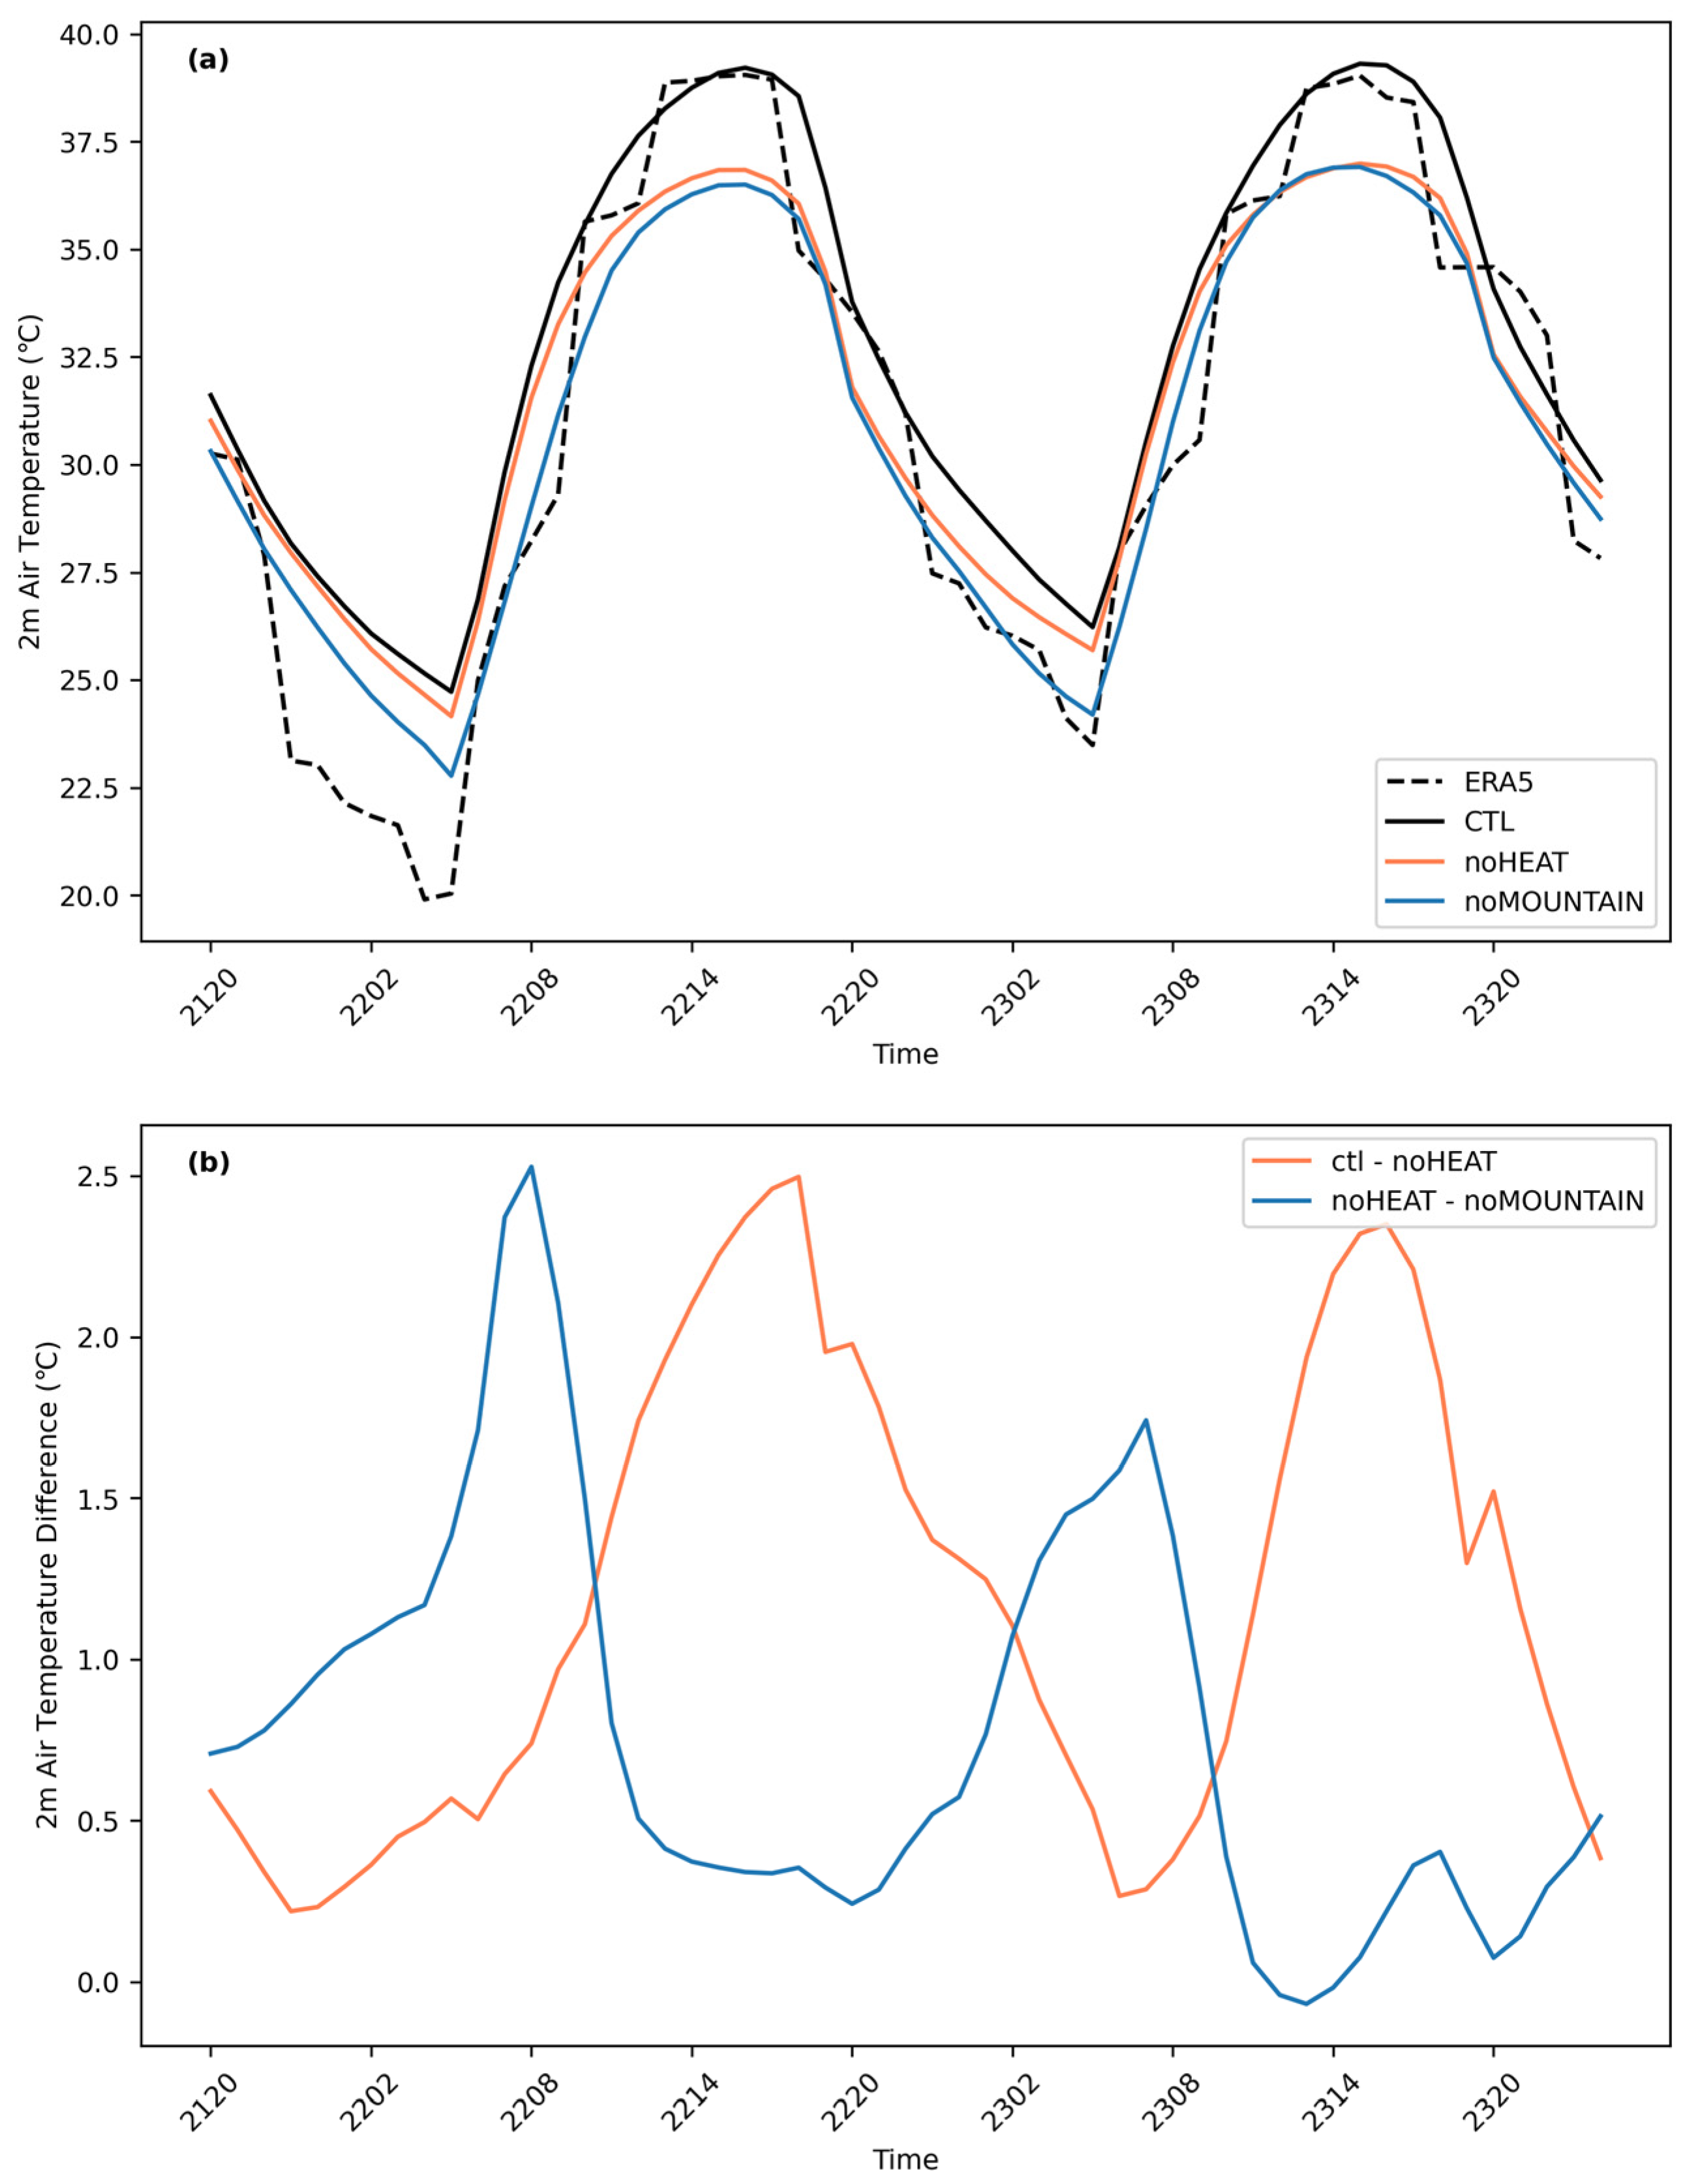
4.1. Simulated 2 m Air Temperature in North China

Figure 5a gives the geographical distribution of the daily mean 2 m air temperature on 22 June 2023 in North China obtained from the CTL experiment. Under the control of the synoptic-scale ridge (Figure 4b), the daily mean 2 m air temperature is greater than 33 °C, much hotter than in the surrounding area. The temperature is non-homogeneously distributed within North China, which is relatively high at the foothills of the Taihang and Yanshan Mountains, especially the latter that exceeds 35 °C. A high-temperature center can be found to the north of the Tai Mountain as well. In the daytime at 1300–1500 Beijing Time (BJT), the 2 m air temperature reaches 41 °C in Beijing and Tianjing (Figure 5b). Even in the early morning of 0500–0700 BJT, the 2 m air temperature can exceed 30 °C ahead of the Taihang and Yanshan Mountains as well as to the north of the Tai Mountain (Figure 5c). Overall, the spatial patterns of the 2 m air temperature simulated by the high-resolution WRF model agree fairly well with those obtained from ERA5 (Figure 1).
The WRF model can also reproduce the diurnal variation in the 2 m air temperature in North China. Taking the high-temperature center to the east of the Taihang Mountains (see the black box in Figure 5a) as an example (Figure 6a), the amplitude of diurnal variation in the CTL experiment is smaller than that in ERA5, mainly owing to the overestimation of temperature from evening to early morning. As shown in Figure 5c, there is a band of high temperature exceeding 30 °C ahead of the Taihang Mountains, which is, however, absent in ERA5 (Figure 1c). Nevertheless, the daytime peak around 1400 BJT is captured very well, which is about 39 °C on both 22 and 23 June 2023. Similar results are found for the high-temperature center at the foothills of the Yanshan Mountains (not shown).
The mean absolute error of 2 m air temperature is examined and shown in Table 1. In the daytime (1300–1900 BJT), when extreme high temperature occurs, the bias between CTL and ERA5 is generally less than 1 K. Thus, the extreme high-temperature event that occurred on 22 June 2023 in North China is considered to be well simulated by the WRF model. Meanwhile, the biases in noHEAT and noMOUNTAIN exceed 1.5 K due to ignoring the dynamical and thermal effects of orography. However, the bias in CTL during the nighttime (0100–0700 BJT) is larger than that during the daytime. This is likely due to the fact that the coarse resolution of ERA5 cannot well resolve the orography and, thus, the Foehn effect, which is evident at nighttime.

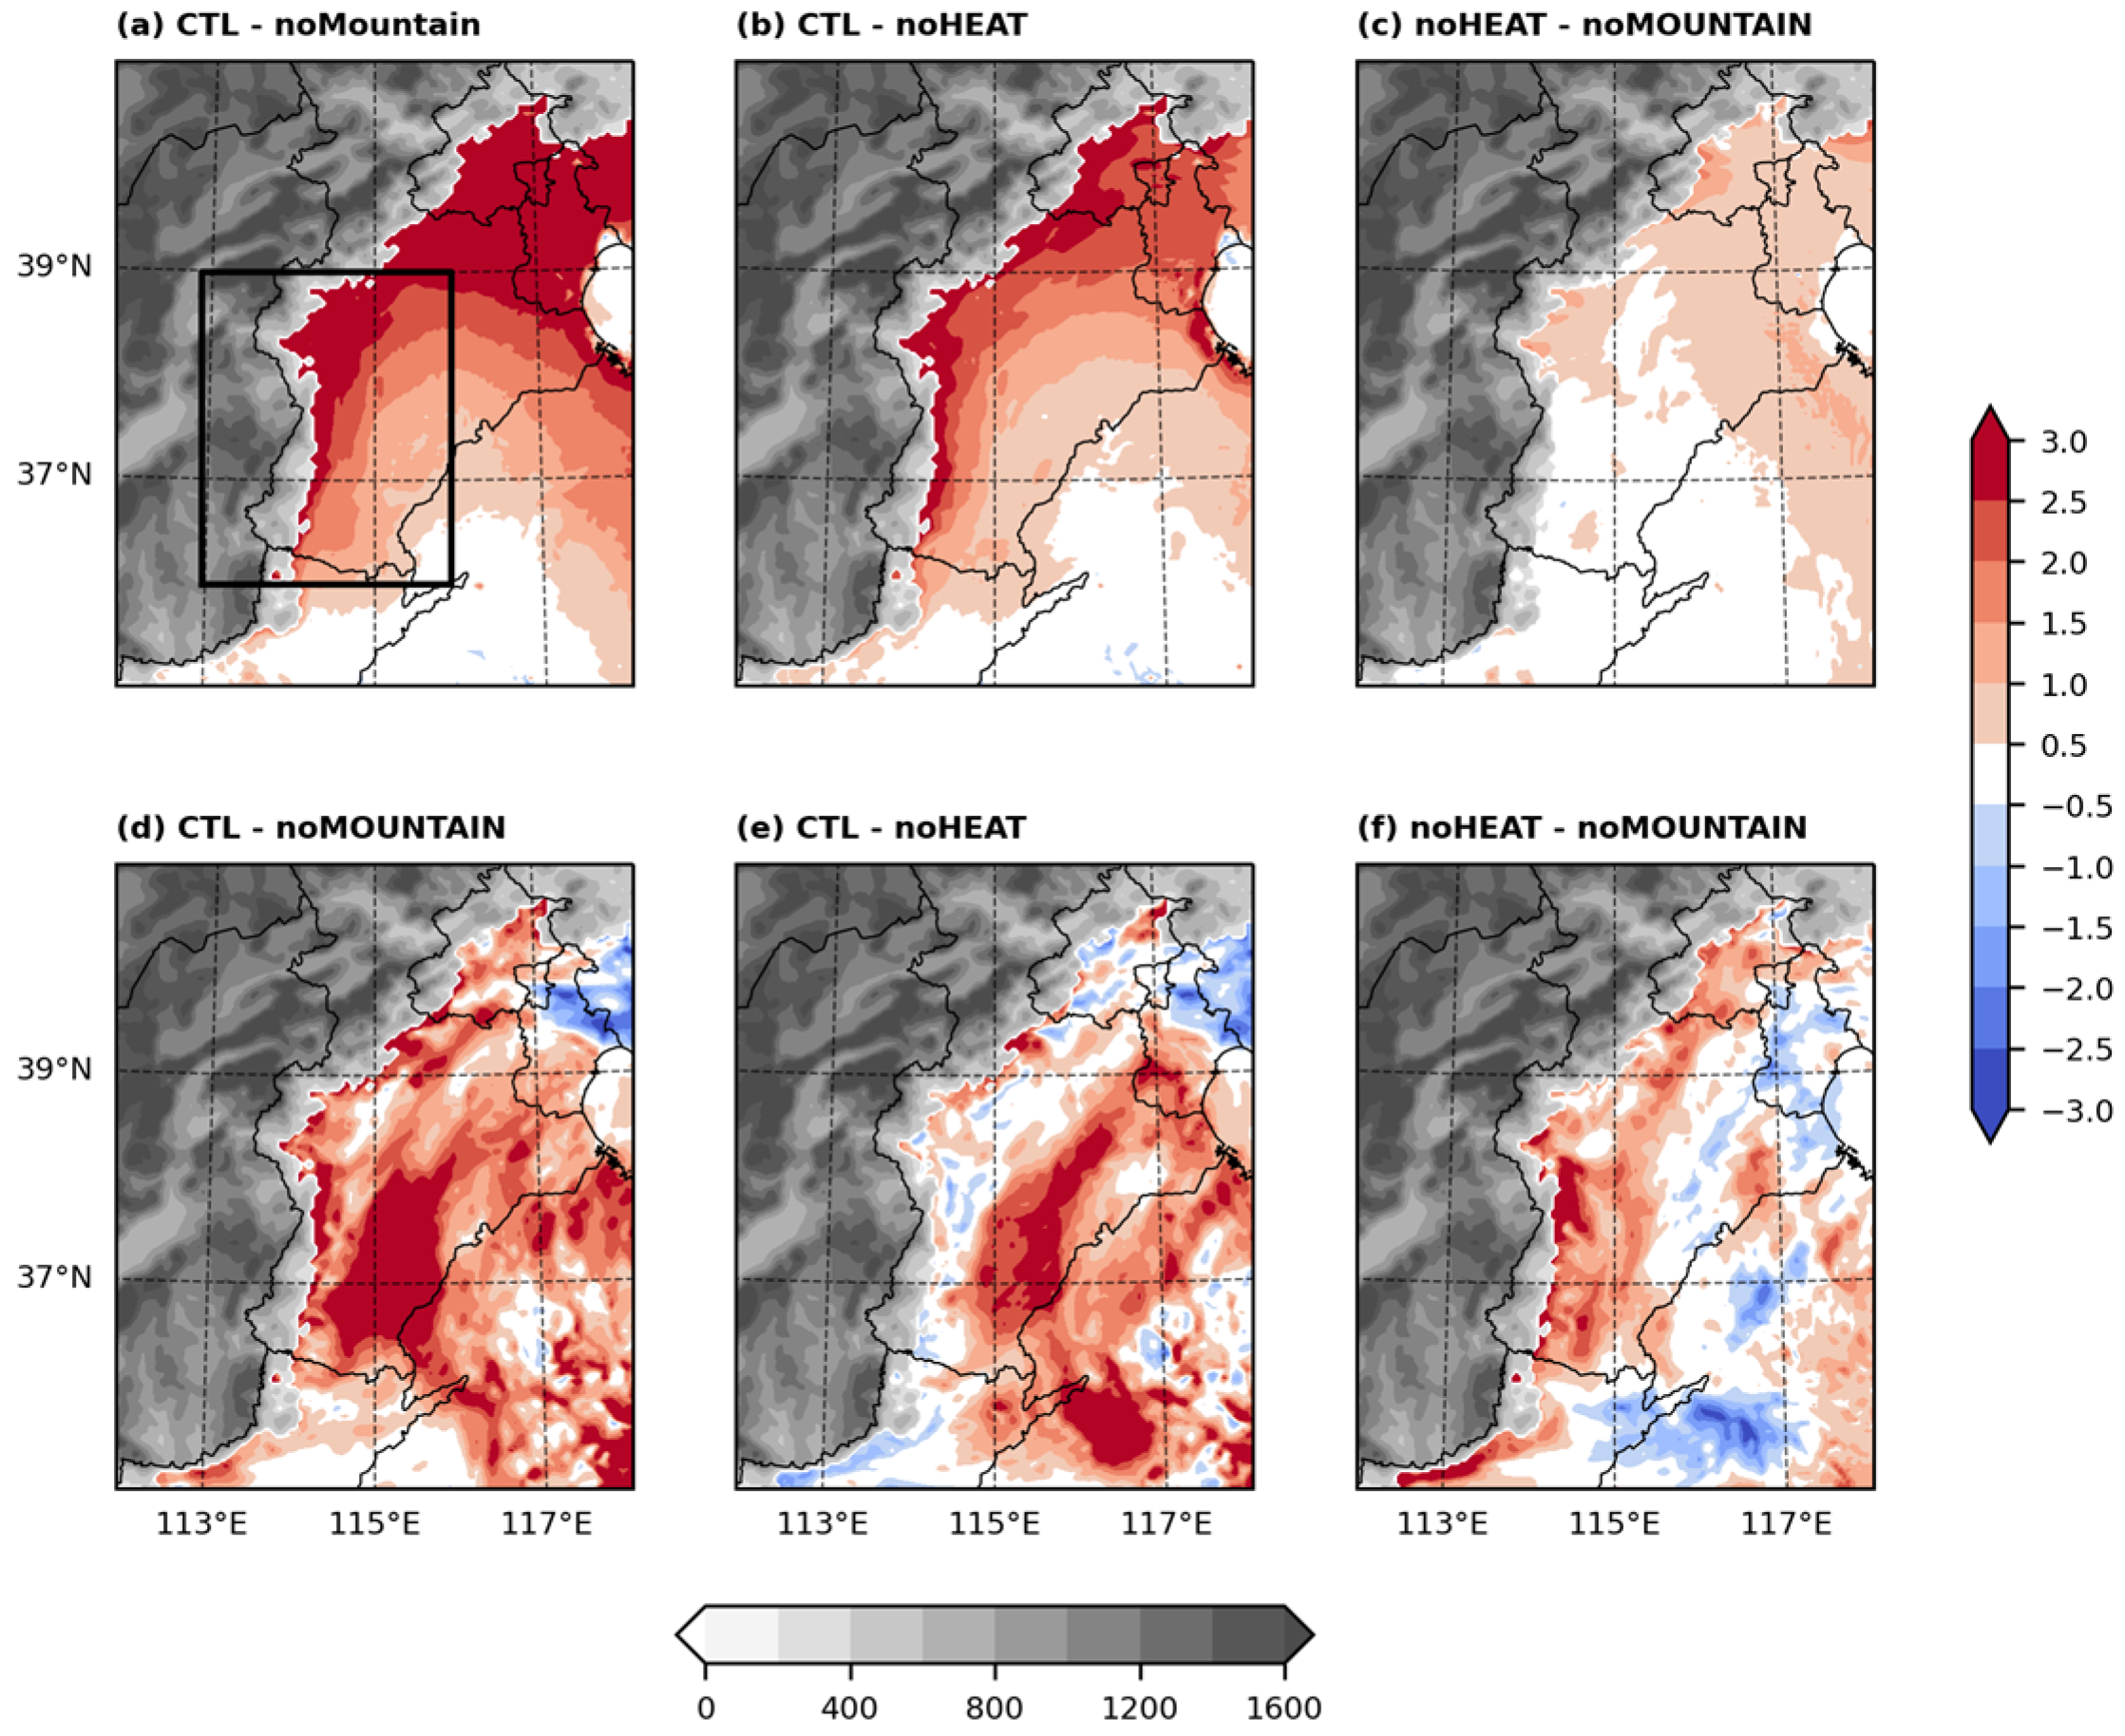
4.2. Influences of Orography on the 2 m Air Temperature
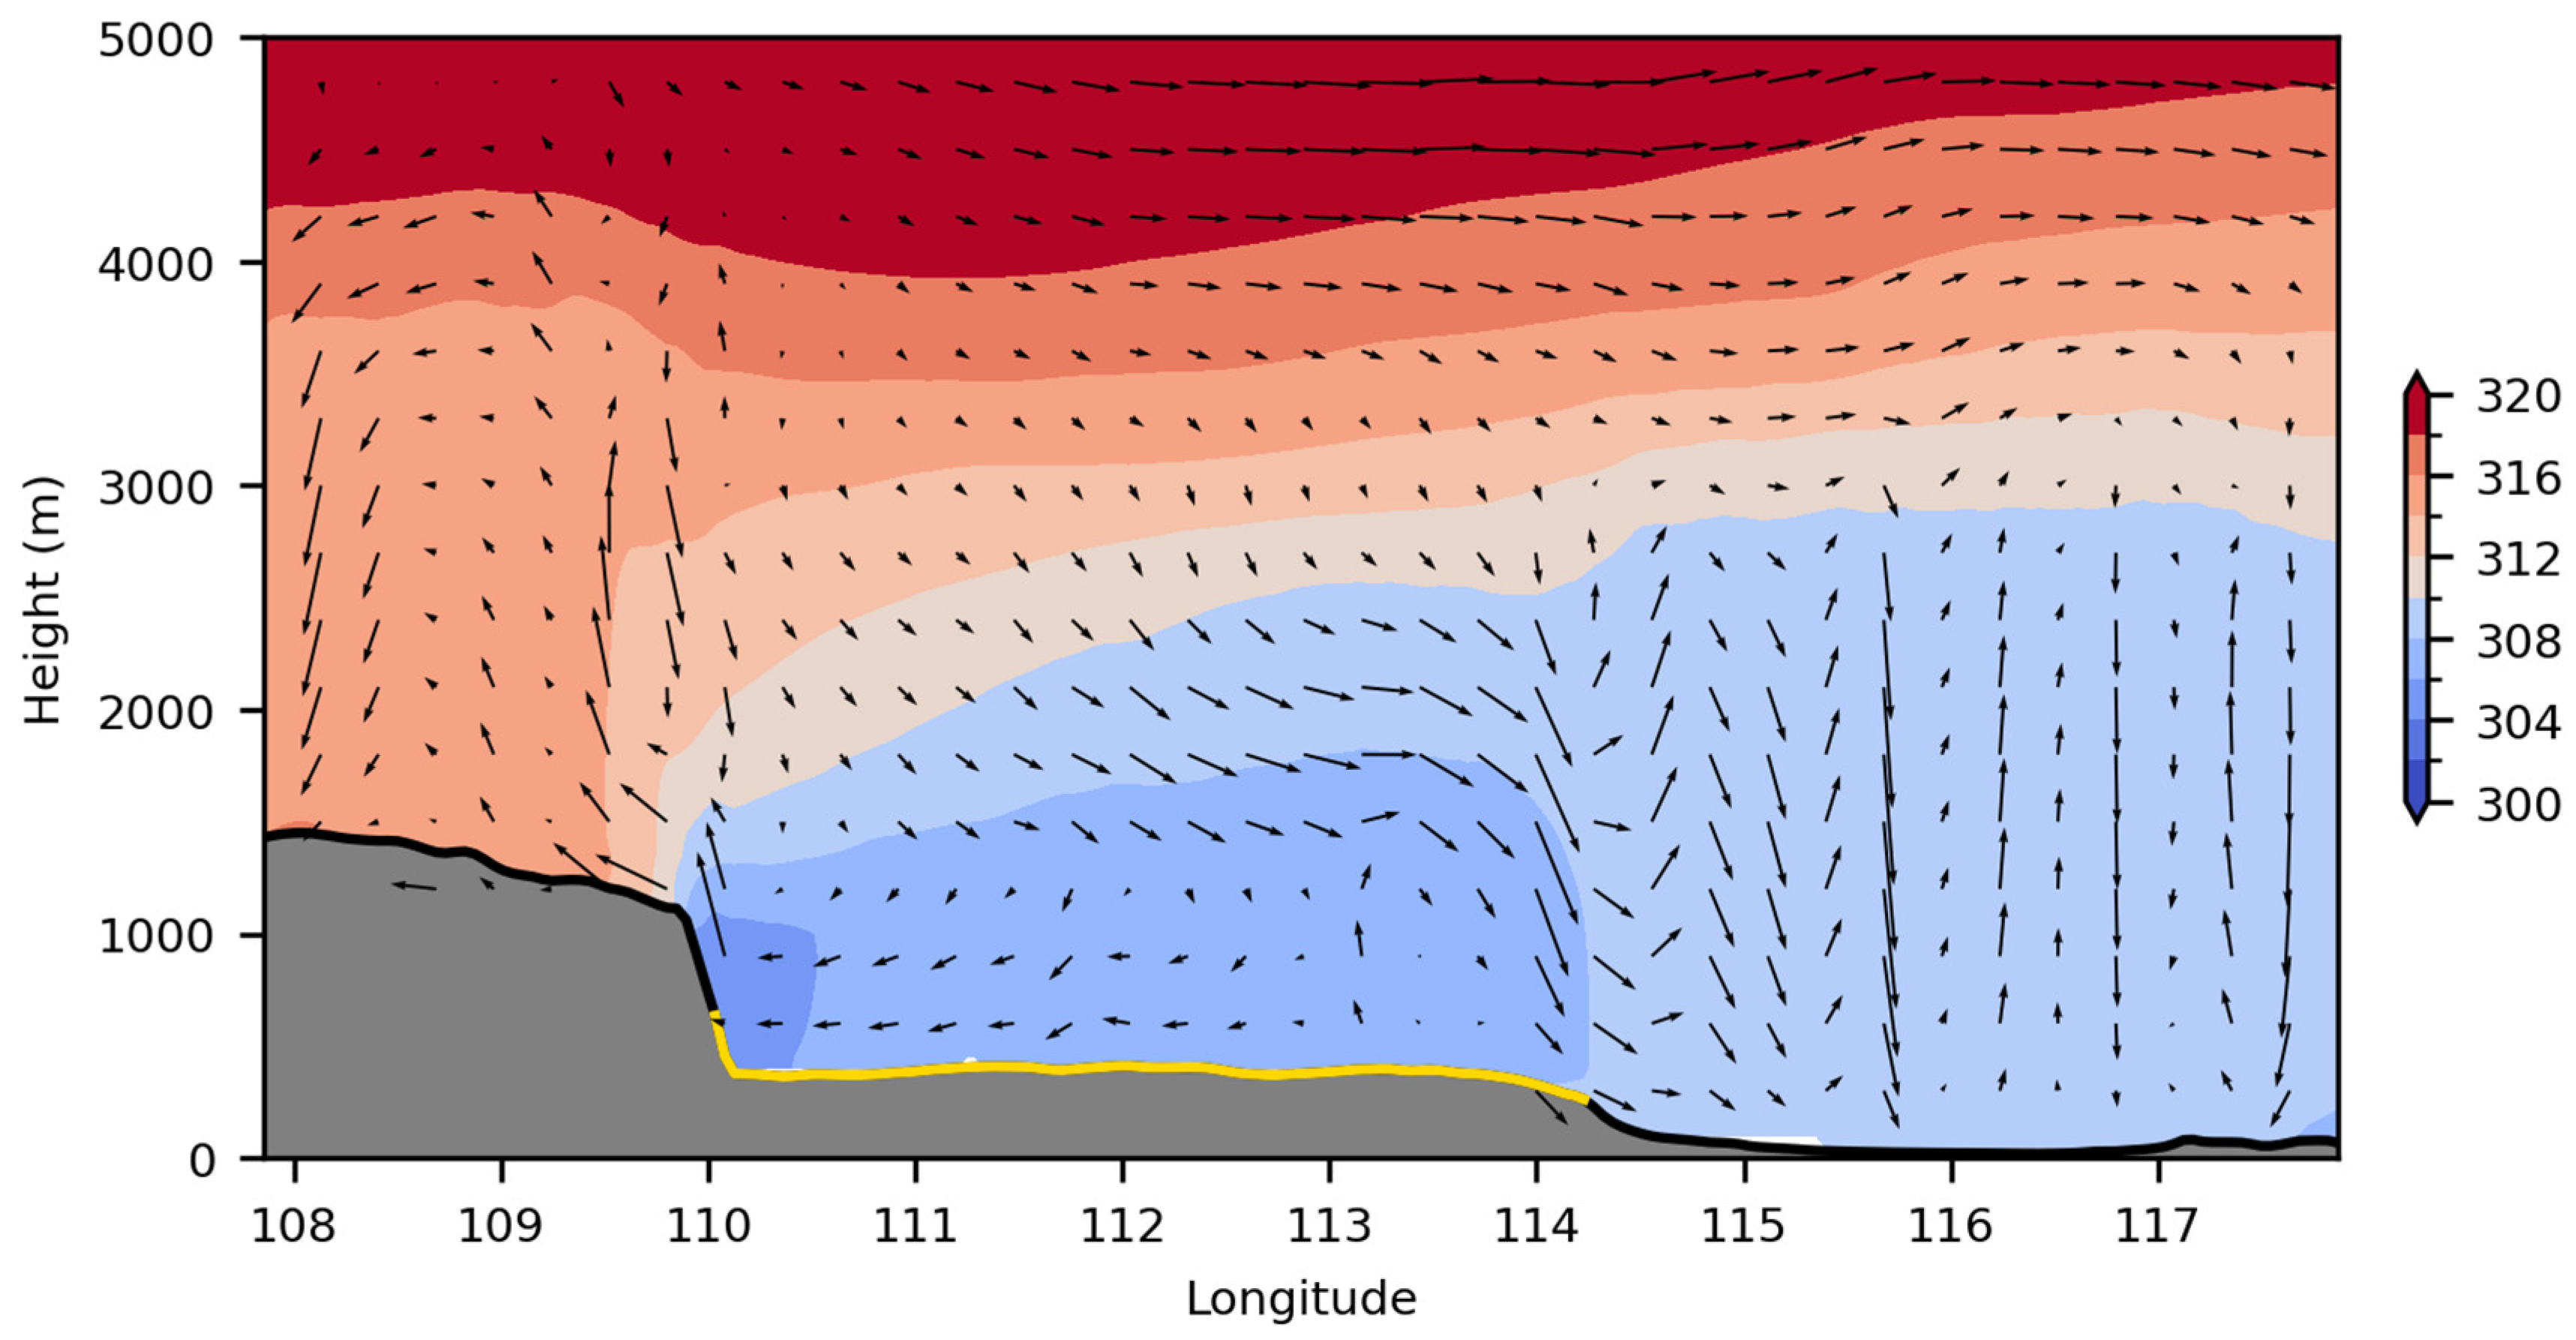
As mentioned in Section 2, two additional sensitivity experiments, i.e., noHEAT and noMOUNTAIN, are conducted to explore the orographic effects in North China on the occurrence of the extreme high-temperature event. The diurnal variations in the 2 m air temperature in these two experiments are also shown in Figure 6a. Compared to that in CTL, the 2 m air temperature is lower in both sensitivity experiments, suggesting that the orography can help enhance the near-surface temperature. Very interestingly, the temperature difference between CTL and noHEAT (which represents the thermal effect of orography) tends to maximize in the daytime, whereas that between noHEAT and noMOUNTAIN (i.e., the orographic dynamical effect) is most pronounced at night. That is, the orographic thermal and dynamical impacts on the near-surface air temperature are out of phase with each other. This is more obviously shown in Figure 6b. The 2 m air temperature difference between CTL and noHEAT peaks in the late afternoon, which can reach 2.5 °C. At this time, however, there is a very weak temperature difference between noHEAT and noMOUNTAIN, which mainly peaks at night and in the early morning, with a magnitude of 2.5 °C and 1.7 °C on 22 and 23 June, respectively. In contrast, the 2 m air temperature difference between CTL and noHEAT is typically less than 0.5 °C at night. Therefore, it can be concluded that the orographic thermal and dynamical effects play a dominant role in the daytime and nighttime, respectively. This can be confirmed by the spatial distribution of the 2 m air temperature difference in North China shown below.
Figure 7a gives the distribution of the 2 m air temperature difference between CTL and noMOUNTAIN averaged in the period of 1300–1500 BJT on 22 June 2023. Figure 7b,c are similar to Figure 7a but for the 2 m air temperature differences between CTL and noHEAT, and between noHEAT and noMOUNTAIN, respectively. Notable 2 m air temperature differences of over 2.5 °C can be found at the foothills of the Taihang and Yanshan Mountains, which are gradually decreased far away from the terrain (Figure 7a). Most of these temperature differences are caused by the orographic thermal effects (Figure 7b), exhibiting a very similar pattern to that in Figure 7a. By contrast, the orographic dynamical effect has a much weaker contribution than its thermal counterpart, which is, in general, smaller than 1 °C (Figure 7c).
Figure 7d–f are similar to Figure 7a–c but for the 2 m air temperature differences in the early morning of 0500–0700 BJT on 23 June 2023. Unlike that in the daytime, the 2 m air temperature difference between CTL and noMOUNTAIN is most evident over central and southeastern North China (Figure 7d), rather than at the foothills of the Taihang and Yanshan Mountains. The temperature differences are even negative to the immediate south of the Yanshan Mountains, which is primarily attributed to the orographic thermal effects, as shown by the temperature differences between CTL and noHEAT in Figure 7e. Negative temperature differences are also found in some regions to the immediate east of the Taihang Mountains. Conversely, there are significant positive temperature differences between noHEAT and noMOUNTAIN (i.e., orographic dynamical effect) at the foothills of the Taihang Mountains (Figure 7f), which compensate for the cooling induced by the orographic thermal effect (Figure 7e). As a result, the near-surface temperature at the foothills of the Taihang Mountains is still enhanced in the early morning (Figure 7d).

4.3. Mechanisms

In this section, the mechanisms of the orographic effects on the enhancement of the temperature to the east of the Taihang Mountains in the afternoon of 22 June and early morning of 23 June 2023 will be studied, respectively.

4.3.1. Afternoon of 22 June 2023

Figure 8a shows the mean wind field and potential temperature in the west–east cross-section averaged between 36 and 39° N, that is, normal to the south–north-orientated Taihang Mountains, in the period of 1300–1500 BJT on 22 June 2023, obtained from the CTL experiment. In response to the heating of the solar shortwave radiation, there is obvious mountain-plain circulation. The near-surface air flow is drawn upslope and ascends upward at the mountain top, along with a maximum vertical velocity over 5 cm s−1. Then, the flow turns to move eastward at about 4.0 km and finally sinks at the foothill of the Taihang Mountains. Relatively weak subsidence (less than −3 cm s−1) is also found to the east of 115° E.
Figure 8b is similar to Figure 8a but for the noHEAT experiment, which turns off the surface sensible heat flux over the Taihang Mountains. In this case, the aforementioned mountain-plain circulation is totally absent. There are instead significant downslope winds on the eastern slope of the Taihang Mountains, accompanied with a hydraulic jump stronger than 3 cm s−1 at the foothill (between about 114.5° E and 115.2° E) [32]. A comparison between Figure 8a and b suggests that, in the daytime, the dynamical effect of orography is greatly suppressed by its thermal effect. Although the adiabatic warming of downslope winds is favorable for the enhancement of surface temperature via the well-known fohn effect, the 2 m air temperature at the foothills of the Taihang Mountains is actually decreased when compared to that in CTL (Figure 7b). This is because, without surface sensible heating, the potential temperature becomes much cooler in the lower troposphere above the top and eastern slope of the Taihang Mountains (Figure 8a,b). The downslope winds simply bring air with low potential temperature to the foothill. This adiabatic process is not as effective as the diabatic sensible heating in increasing the surface temperature.
The wind field and potential temperature in the noMOUNTAIN experiment (Figure 8c), in which both the thermal and dynamical effects of the mountains in North China are removed, are quite similar to that in the noHEAT experiment. The thermally driven mountain-plain circulation is not present either, and the lower troposphere over the Taihang Mountains is much cooler than in CTL. Although the terrain height has been lowered considerably, downslope winds can also be found. However, the near-surface flow over the Taihang Mountains is westward from about 113° E, which is distinctively different from that in noHEAT (Figure 8b). As more clearly shown in Figure 9, the flow pattern in Figure 8c is just part of the mountain-plain circulation caused by the terrain west of 110° E, which is retained in the sensitivity experiments (Figure 2b). A comparison between the wind fields in noHEAT and noMOUNTAIN reveals that the presence of the Taihang Mountains locally intensifies the sinking of downslope flow at its foothill, which helps increase the near-surface temperature adiabatically. Nonetheless, it should be noted that this dynamical effect of orography is weaker than its thermal effect in the daytime.

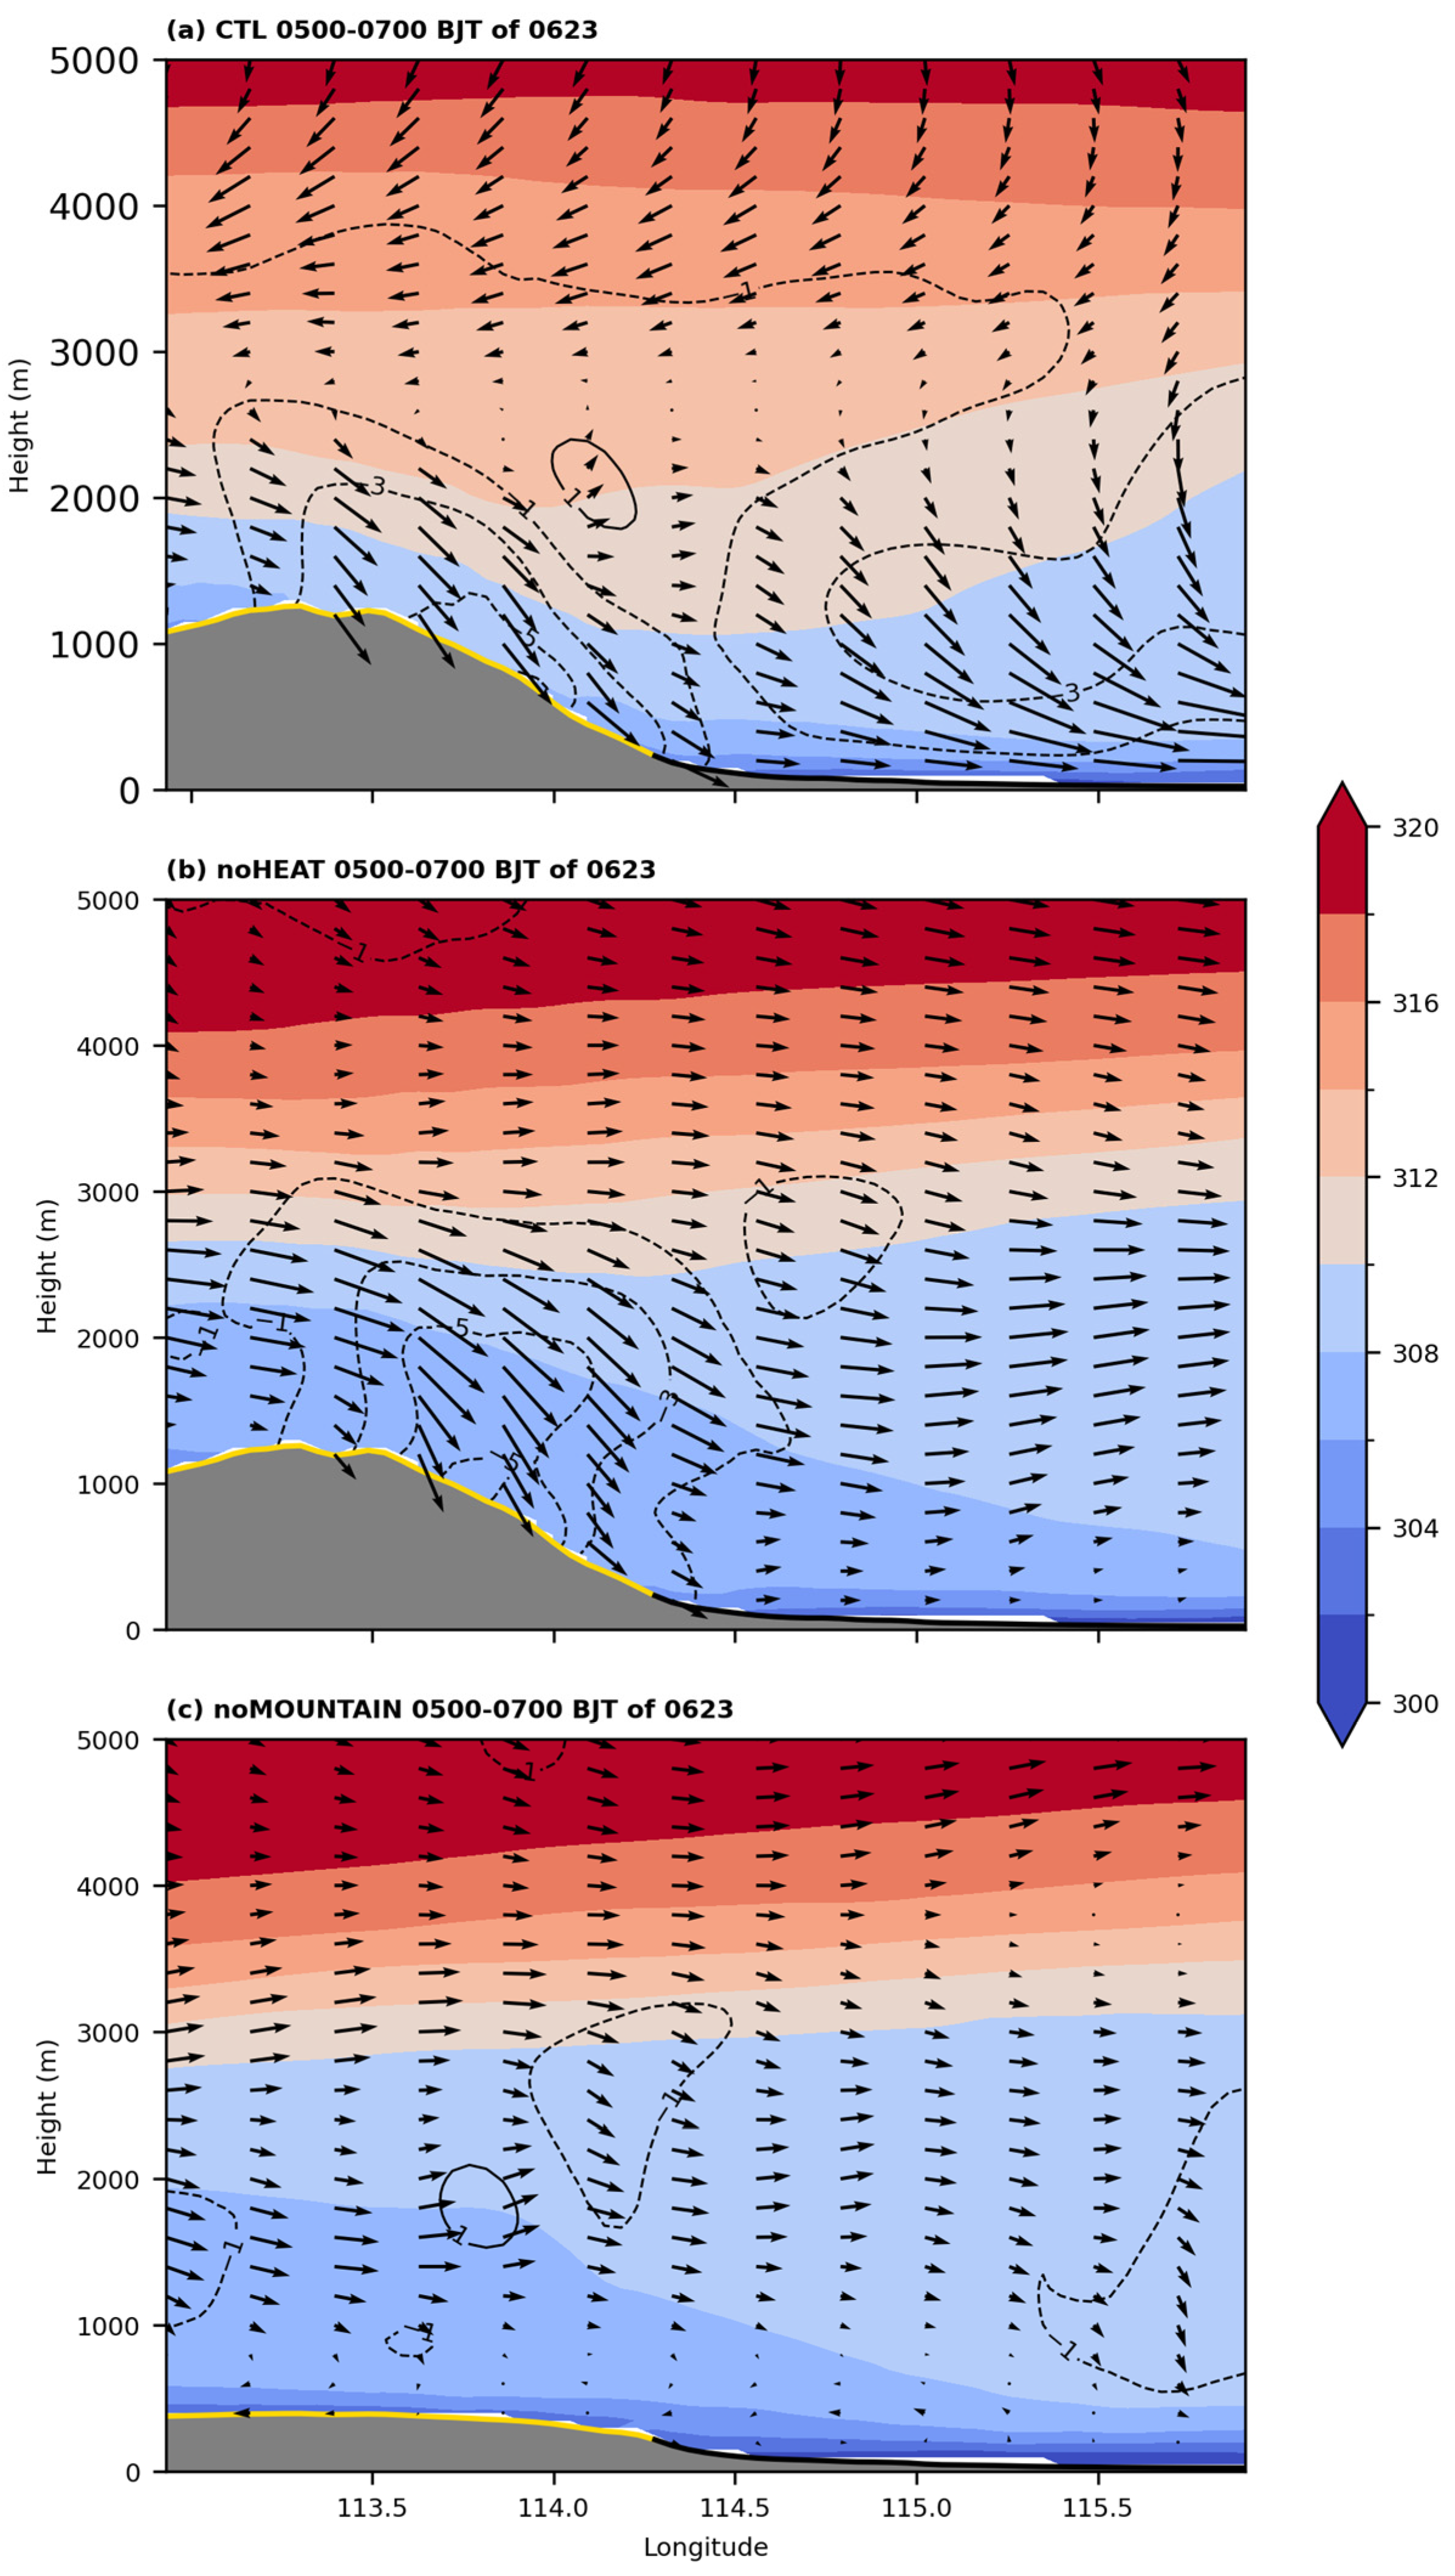
4.3.2. Early Morning of 23 June 2023

Figure 10a–c are similar to Figure 8a–c except in the early morning of 0500–0700 BJT on 23 June 2023. In the noMOUNTAIN experiment (Figure 10c), there is small descending flow over the eastern slope of the lowered Taihang mountains. This is owing to the enhanced static stability of the boundary layer (as revealed by the large vertical gradient of potential temperature) caused by the land-surface radiative cooling at night. In contrast, the daytime boundary layer is well mixed (Figure 8c). In the presence of the Taihang Mountains in noHEAT (Figure 10b), the westerly flow glides down along its eastern slope, with maximum subsidence in excess of 5 cm s−1. The near-surface temperature at the foothill is, thus, adiabatically warmed by this orographic dynamical effect (Figure 7f).
In the CLT experiment (Figure 10a), the upslope flow along the eastern slope of the Taihang Mountains found in the daytime (Figure 8a) is totally absent. Instead, there is a notable downslope wind as in noHEAT, with similar intensity in vertical velocity (Figure 10b). This suggests that the occurrence of the downslope wind is more relevant to the dynamical effect of the orography rather than its thermal effect. Moreover, the surface sensible heat flux over the mountains is much weaker at night than in the daytime (Figure 11). Thus, accounting for this thermal effect has a very weak influence on the 2 m air temperature at the foothills in the early morning (Figure 7e). However, considerable subsidence can also be found to the east of 115° E, that is, in the downstream region of the Taihang Mountains (Figure 10a), while the downslope wind is only confined to the west of 114.5° E in noHEAT (Figure 10b). Furthermore, the potential temperature below 3 km altitude is warmer in CTL than in noHEAT. Thus, this extensive subsidence helps warm the near-surface temperature to the far east of the Taihang Mountains (Figure 7e).
Note also that the horizontal winds are toward the west, i.e., easterlies, above 3 km in CTL, while westerly winds are found at the same altitudes in noHEAT (and also in noMOUNTAIN). To better reveal the horizonal and vertical winds in the mid-lower troposphere, the streamline and vertical velocity averaged between 4 and 5 km during 0500–0700 BJT on 23 June 2023 is presented in Figure 12a,b for the CTL and noHEAT experiments, respectively, with their differences given in Figure 12c. In North China, the mid-lower troposphere is dominated by an anti-cyclone, given the presence of the synoptic ridge at 500 hPa (Figure 4b). The anti-cyclone in CTL is stronger than in noHEAT and extends more southeastward. As a consequence, there is an anti-cyclonic circulation difference in North China, the center of which is just located to the east of the Taihang Mountains (Figure 12c). As shown in Figure 13, this anti-cyclonic circulation difference emerges in the daytime of 22 June 2023, because the surface sensible heating over the mountains warms the air column above (Figure 8a), which tends to strengthen the mid-lower tropospheric ridge according to the synoptic geopotential tendency equation [33]. Given the accumulative surface diabatic heating in the daytime, the aforementioned anti-cyclonic circulation difference persists to the night and early morning, accompanied by northeasterly wind differences and subsidence on its southeastern and southern flanks, i.e., to the farther east of the Taihang Mountains (Figure 12c). The descending motion occurs as the equatorward movement of airmass at the synoptic scale is primarily along the sloped isentropes (i.e., isentropic descent) that tilt with height toward the pole.

5. Discussion

This study revealed three mechanisms (i.e., thermally induced mountain-plain circulation, dynamically induced foehn effect and thermally induced anomalous anticyclone in the mid-troposphere) of how orography affected the extreme high-temperature event in North China. Previous studies mainly highlighted the importance of the foehn effect in causing high temperature [19,20,21,22,34], while the thermal effects of orography are relatively less studied. Herein, we found that the foehn effect is greatly suppressed by the thermally induced mountain-plain circulation in the daytime. Instead, it is the thermal effects of orography that play a dominant role in this high-temperature event.
These findings help deepen the understanding of the impacts of mesoscale orography on the occurrence of high temperature. Yet, this work still has some limitations. Firstly, the impacts of orography on high-temperature events occur mainly at the lower boundary of the atmosphere, which is, however, highly dependent on parameterization (i.e., land surface model schemes, surface layer schemes and planetary boundary layer schemes). While the dynamical effect can be resolved by model dynamics, the thermal effect (i.e., sensible heat flux) can only be estimated by parameterizations. The biases caused by parameterization cannot be avoided during simulation. In climate models, these biases could lead to large uncertainties in evaluating high-temperature disasters near orography. Secondly, this work is only a case study, and more studies are needed, especially for those high-temperature events under different synoptic controls occurring in different locations (but sill near the mountains). For example, this work focused on the high temperature at the foothill of the Taihang Mountains, while more salient high temperature occurred at the foothill of the Yanshan Mountains, where the capital city of Beijing is located. Previous studies have revealed that metropolitan cities are more vulnerable to heat waves than rural areas due to urban heat islands [35,36,37,38]. In this regard, Beijing is affected simultaneously by the complex terrain and urban circulation. The interaction between orography and urban factors in promoting the high temperature will be studied in the future.

6. Conclusions

North China has experienced its hottest June in the most recent 10 years. The highest temperature was recorded on 22 June, reaching a maximum of 41.8 °C. It is interesting that the extreme high-temperature centers tended to occur at the foothills of the Taihang and Yanshan Mountains. In this work, the thermal and dynamical effects of orography on the high-temperature event on 22 June 2023 in North China are investigated according to three high-resolution numerical simulations, i.e., CTL, noHEAT and noMOUNTAIN, carried out using the WRF model. In the noHEAT experiment, the surface sensible heating flux over the mountains in North China is turned off, while the noMOUNTAIN experiment additionally lowers the height of the mountains. The key findings are listed as follows:
(1)
The presence of the mountains can help enhance the temperature by up to 3 °C and, thus, promote the occurrence of the high-temperature event.
(2)
During the daytime, the temperature enhancement at the foothill is primarily attributed to the adiabatic warming of mountain-plain circulation, which is induced by orographic thermal effects. The dynamically induced downslope is, however, suppressed during this time.
(3)
By contrast, the orographic dynamical effect (i.e., foehn effect) is found to play a more important role in enhancing the near-surface temperature at the foothill in the night and early morning, while the thermal effect (i.e., sensible heat flux) becomes less effective.
(4)
The orographic thermal effect is found to noticeably enhance the near-surface temperature to the far east of the Taihang Mountains in the night. It is due to the adiabatic warming of subsidence on the eastern and southeastern flank of the synoptic-scale anomalous anti-cyclonic circulation in the mid-lower troposphere, which is induced by orographic sensible heat flux during daytime and persists well into the night.
This work provides useful insights into the forecast of high temperature that occurred on the lee slope of mountains under the control of the synoptic ridge. It also has implications for climate modeling. Extreme high-temperature events often occur under the synergistic effects of multi-scale systems [39]. While large-scale changes in mean temperature are well understood, changes in local and regional temperature are much harder to simulate and attribute [17,18,40]. Gao et al. [41] found that high-resolution models can improve the temperature simulation by better resolving orography. In this study, we found that orography can enhance the surrounding temperature by up to 3 °C, which emphasizes the importance of local-scale processes that are not well resolved by climate models. Furthermore, we found that the thermal effects of orography play a dominant role in this high-temperature event, rather than the foehn effect. Therefore, improving the representation of sensible heat flux in climate models may be critical for the accurate prediction of climatic extremes of high temperature in mountainous regions, given the more frequent occurrence of heat waves under the background of global warming. Moreover, it will also potentially benefit policymakers toward a better adaption of extreme high-temperature events, which highly threaten both industrial and agricultural water use and can cause electricity supply problems and power shortage.

Author Contributions

Conceptualization, H.W., X.X. and Y.W.; methodology, H.W. and X.X.; writing—original draft preparation, H.W.; writing—review and editing, X.X. and Y.W. All authors have read and agreed to the published version of the manuscript.

Funding

This work was supported by the National Natural Science Foundation of China (Grant No. 42122036), the Second Tibetan Plateau Scientific Expedition and Research Program (STEP) (Grant No. 2019QZKK0105).

Institutional Review Board Statement

Not applicable.

Informed Consent Statement

Not applicable.

Data Availability Statement

The data presented in this study are openly available in FigShare at https://doi.org/10.6084/m9.figshare.24709254.v2 (accessed on 17 November 2023).

Acknowledgments

The authors would like to thank the anonymous reviewers for helpful comments and suggestions.

Conflicts of Interest

The authors declare no conflicts of interest.

References

  1. Wang, P.; Hui, P.; Xue, D.; Tang, J. Future Projection of Heat Waves over China under Global Warming within the CORDEX-EA-II Project. Clim. Dyn. 2019, 53, 957–973. [Google Scholar] [CrossRef]
  2. Wang, J.; Yan, Z. Rapid Rises in the Magnitude and Risk of Extreme Regional Heat Wave Events in China. Weather Clim. Extrem. 2021, 34, 100379. [Google Scholar] [CrossRef]
  3. Intergovernmental Panel on Climate Change (IPCC). Climate Change 2021—The Physical Science Basis: Working Group I Contribution to the Sixth Assessment Report of the Intergovernmental Panel on Climate Change; Cambridge University Press: Cambridge, UK, 2023; pp. 1513–1766. [Google Scholar] [CrossRef]
  4. Wang, P.; Yang, Y.; Tang, J.; Leung, L.R.; Liao, H. Intensified Humid Heat Events Under Global Warming. Geophys. Res. Lett. 2021, 48, e2020GL091462. [Google Scholar] [CrossRef]
  5. Acaroğlu, H.; Güllü, M. Climate Change Caused by Renewable and Non-Renewable Energy Consumption and Economic Growth: A Time Series ARDL Analysis for Turkey. Renew. Energy 2022, 193, 434–447. [Google Scholar] [CrossRef]
  6. Horton, R.M.; Mankin, J.S.; Lesk, C.; Coffel, E.; Raymond, C. A Review of Recent Advances in Research on Extreme Heat Events. Curr. Clim. Change Rep. 2016, 2, 242–259. [Google Scholar] [CrossRef]
  7. Black, E.; Blackburn, M.; Harrison, G.; Hoskins, B.; Methven, J. Factors Contributing to the Summer 2003 European Heatwave. Weather 2004, 59, 217–223. [Google Scholar] [CrossRef]
  8. García-Herrera, R.; Díaz, J.; Trigo, R.M.; Luterbacher, J.; Fischer, E.M. A Review of the European Summer Heat Wave of 2003. Crit. Rev. Environ. Sci. Technol. 2010, 40, 267–306. [Google Scholar] [CrossRef]
  9. Coumou, D.; Rahmstorf, S. A Decade of Weather Extremes. Nat. Clim. Change 2012, 2, 491–496. [Google Scholar] [CrossRef]
  10. Miralles, D.G.; Teuling, A.J.; van Heerwaarden, C.C.; Vilà-Guerau de Arellano, J. Mega-Heatwave Temperatures Due to Combined Soil Desiccation and Atmospheric Heat Accumulation. Nat. Geosci. 2014, 7, 345–349. [Google Scholar] [CrossRef]
  11. Neal, E.; Huang, C.S.Y.; Nakamura, N. The 2021 Pacific Northwest Heat Wave and Associated Blocking: Meteorology and the Role of an Upstream Cyclone as a Diabatic Source of Wave Activity. Geophys. Res. Lett. 2022, 49, e2021GL097699. [Google Scholar] [CrossRef]
  12. Hua, W.; Dai, A.; Qin, M.; Hu, Y.; Cui, Y. How Unexpected Was the 2022 Summertime Heat Extremes in the Middle Reaches of the Yangtze River? Geophys. Res. Lett. 2023, 50, e2023GL104269. [Google Scholar] [CrossRef]
  13. Lee, Y.-Y.; Grotjahn, R. California Central Valley Summer Heat Waves Form Two Ways. J. Clim. 2016, 29, 1201–1217. [Google Scholar] [CrossRef]
  14. Zschenderlein, P.; Fink, A.H.; Pfahl, S.; Wernli, H. Processes Determining Heat Waves across Different European Climates. Q. J. R. Meteorol. Soc. 2019, 145, 2973–2989. [Google Scholar] [CrossRef]
  15. Whan, K.; Zscheischler, J.; Orth, R.; Shongwe, M.; Rahimi, M.; Asare, E.O.; Seneviratne, S.I. Impact of Soil Moisture on Extreme Maximum Temperatures in Europe. Weather Clim. Extrem. 2015, 9, 57–67. [Google Scholar] [CrossRef]
  16. Teng, H.; Branstator, G.; Meehl, G.A.; Washington, W.M. Projected Intensification of Subseasonal Temperature Variability and Heat Waves in the Great Plains. Geophys. Res. Lett. 2016, 43, 2165–2173. [Google Scholar] [CrossRef]
  17. Loikith, P.C.; Broccoli, A.J. Characteristics of Observed Atmospheric Circulation Patterns Associated with Temperature Extremes over North America. J. Clim. 2012, 25, 7266–7281. [Google Scholar] [CrossRef]
  18. Loikith, P.C.; Broccoli, A.J. Comparison between Observed and Model-Simulated Atmospheric Circulation Patterns Associated with Extreme Temperature Days over North America Using CMIP5 Historical Simulations. J. Clim. 2015, 28, 2063–2079. [Google Scholar] [CrossRef]
  19. Takane, Y.; Ohashi, Y.; Kusaka, H.; Shigeta, Y.; Kikegawa, Y. Effects of Synoptic-Scale Wind under the Typical Summer Pressure Pattern on the Mesoscale High-Temperature Events in the Osaka and Kyoto Urban Areas by the WRF Model. J. Appl. Meteorol. Climatol. 2013, 52, 1764–1778. [Google Scholar] [CrossRef]
  20. Yoon, D.; Cha, D.-H.; Lee, G.; Park, C.; Lee, M.-I.; Min, K.-H. Impacts of Synoptic and Local Factors on Heat Wave Events Over Southeastern Region of Korea in 2015. J. Geophys. Res. Atmos. 2018, 123, 12081–12096. [Google Scholar] [CrossRef]
  21. Wang, F.; Wang, Y. Potential Role of Local Contributions to Record-Breaking High-Temperature Event in Xiamen, China. Weather Clim. Extrem. 2021, 33, 100338. [Google Scholar] [CrossRef]
  22. Grotjahn, R. Identifying Extreme Hottest Days from Large Scale Upper Air Data: A Pilot Scheme to Find California Central Valley Summertime Maximum Surface Temperatures. Clim. Dyn. 2011, 37, 587–604. [Google Scholar] [CrossRef]
  23. Loikith, P.C.; Kalashnikov, D.A. Meteorological Analysis of the Pacific Northwest June 2021 Heatwave. Mon. Weather Rev. 2023, 151, 1303–1319. [Google Scholar] [CrossRef]
  24. Markowski, P.; Richardson, Y. Thermally Forced Winds in Mountainous Terrain. In Mesoscale Meteorology in Midlatitudes; John Wiley and Sons: Hoboken, NJ, USA, 2010; pp. 317–325. [Google Scholar] [CrossRef]
  25. Hersbach, H.; Bell, B.; Berrisford, P.; Hirahara, S.; Horányi, A.; Muñoz-Sabater, J.; Nicolas, J.; Peubey, C.; Radu, R.; Schepers, D.; et al. The ERA5 Global Reanalysis. Q.J.R. Meteorol. Soc. 2020, 146, 1999–2049. [Google Scholar] [CrossRef]
  26. Skamarock, C.; Klemp, B.; Dudhia, J.; Gill, O.; Liu, Z.; Berner, J.; Wang, W.; Powers, G.; Duda, G.; Barker, D.; et al. A Description of the Advanced Research WRF Model Version 4.3; No. NCAR/TN-556+STR; NSF: Alexandria, VI, USA, 2021. [Google Scholar] [CrossRef]
  27. Thompson, G.; Field, P.R.; Rasmussen, R.M.; Hall, W.D. Explicit Forecasts of Winter Precipitation Using an Improved Bulk Microphysics Scheme. Part II: Implementation of a New Snow Parameterization. Mon. Weather Rev. 2008, 136, 5095–5115. [Google Scholar] [CrossRef]
  28. Iacono, M.J.; Delamere, J.S.; Mlawer, E.J.; Shephard, M.W.; Clough, S.A.; Collins, W.D. Radiative Forcing by Long-Lived Greenhouse Gases: Calculations with the AER Radiative Transfer Models. J. Geophys. Res. Atmos. 2008, 113, D13. [Google Scholar] [CrossRef]
  29. Hong, S.-Y.; Noh, Y.; Dudhia, J. A New Vertical Diffusion Package with an Explicit Treatment of Entrainment Processes. Mon. Weather. Rev. 2006, 134, 2318–2341. [Google Scholar] [CrossRef]
  30. Tewari, M.; Chen, F.; Wang, W.; Dudhia, J.; Lemone, M.A.; Mitchell, K.; Ek, M.; Gayno, G.; Wegiel, J.; Cuenca, R.H. Implementation and verification of the unified NOAH land surface model in the WRF model. In Proceedings of the 20th Conference on Weather Analysis and Forecasting/16th Conference on Numerical Weather Prediction, Seattle, WA, USA, 14 January 2004; pp. 11–15. Available online: http://n2t.net/ark:/85065/d7fb523p (accessed on 1 September 2023).
  31. Jiménez, P.A.; Dudhia, J.; González-Rouco, J.F.; Navarro, J.; Montávez, J.P.; García-Bustamante, E. A Revised Scheme for the WRF Surface Layer Formulation. Mon. Weather Rev. 2012, 140, 898–918. [Google Scholar] [CrossRef]
  32. Smith, R.B. On Severe Downslope Winds. J. Atmos. Sci. 1985, 42, 2597–2603. [Google Scholar] [CrossRef]
  33. Holton, J.R.; Hakim, G.J. Chapter 6—Quasi-Geostrophic Analysis. In An Introduction to Dynamic Meteorology, 5th ed.; Holton, J.R., Hakim, G.J., Eds.; Academic Press: New York, NY, USA, 2013; pp. 171–211. [Google Scholar] [CrossRef]
  34. Elvidge, A.D.; Renfrew, I.A. The Causes of Foehn Warming in the Lee of Mountains. Bull. Am. Meteorol. Soc. 2016, 97, 455–466. [Google Scholar] [CrossRef]
  35. Tuholske, C.; Caylor, K.; Funk, C.; Verdin, A.; Sweeney, S.; Grace, K.; Peterson, P.; Evans, T. Global Urban Population Exposure to Extreme Heat. Proc. Natl. Acad. Sci. USA 2021, 118, e2024792118. [Google Scholar] [CrossRef]
  36. Ward, K.; Lauf, S.; Kleinschmit, B.; Endlicher, W. Heat Waves and Urban Heat Islands in Europe: A Review of Relevant Drivers. Sci. Total Environ. 2016, 569–570, 527–539. [Google Scholar] [CrossRef]
  37. Wouters, H.; De Ridder, K.; Poelmans, L.; Willems, P.; Brouwers, J.; Hosseinzadehtalaei, P.; Tabari, H.; Vanden Broucke, S.; van Lipzig, N.P.M.; Demuzere, M. Heat Stress Increase under Climate Change Twice as Large in Cities as in Rural Areas: A Study for a Densely Populated Midlatitude Maritime Region. Geophys. Res. Lett. 2017, 44, 8997–9007. [Google Scholar] [CrossRef]
  38. Wu, K.; Yang, X. Urbanization and Heterogeneous Surface Warming in Eastern China. Chin. Sci. Bull. 2013, 58, 1363–1373. [Google Scholar] [CrossRef]
  39. Grotjahn, R.; Black, R.; Leung, R.; Wehner, M.F.; Barlow, M.; Bosilovich, M.; Gershunov, A.; Gutowski, W.J.; Gyakum, J.R.; Katz, R.W.; et al. North American Extreme Temperature Events and Related Large Scale Meteorological Patterns: A Review of Statistical Methods, Dynamics, Modeling, and Trends. Clim. Dyn. 2016, 46, 1151–1184. [Google Scholar] [CrossRef]
  40. Van Oldenborgh, G.J.; Wehner, M.F.; Vautard, R.; Otto, F.E.L.; Seneviratne, S.I.; Stott, P.A.; Hegerl, G.C.; Philip, S.Y.; Kew, S.F. Attributing and Projecting Heatwaves Is Hard: We Can Do Better. Earth’s Future 2022, 10, e2021EF002271. [Google Scholar] [CrossRef]
  41. Gao, Y.; Fu, J.S.; Drake, J.B.; Liu, Y.; Lamarque, J.-F. Projected Changes of Extreme Weather Events in the Eastern United States Based on a High Resolution Climate Modeling System. Environ. Res. Lett. 2012, 7, 044025. [Google Scholar] [CrossRef]
Figure 1. Geographical distributions of daily (a) mean, (b) maximum, and (c) minimum 2 m air temperature (unit: °C) in North China on 22 June 2023 (in Beijing time) obtained from the ERA5 reanalysis.
Atmosphere 15 00324 g001
Figure 2. WRF model domain and terrain (shading; unit: m) in the experiments of (a) CTL and noHEAT, and (b) noMOUNTAIN. The black box in (b) indicates the region where the surface sensible heat flux is turned off in the noHEAT experiment, and where the terrain is lowered in the noMOUNTAIN experiment.
Atmosphere 15 00324 g002
Figure 3. Daily evolution of the maximum 2 m temperature (red line; unit: °C) and precipitation (blue line; unit: mm day−1) averaged in North China (see the black box in Figure 4).
Atmosphere 15 00324 g003
Figure 4. Horizontal wind field (arrow), geopotential height (contours; unit: dgpm) and vertical velocity (shading; unit: Pa s−1) at 500 hPa on (a) 18 June and (b) 22 June 2023 obtained from the ERA5 reanalysis. The vertical velocity shown is 9 × 9 running average. (c,d) are the same as (a,b) but for the water vapor flux (arrow and shading; unit: s g kg−1) and geopotential height (contours; unit: dgpm) at 700 hPa. The black boxes represent the region of North China (i.e., 113–119° E and 35–41° N).
Atmosphere 15 00324 g004
Figure 5. Geographical distributions of daily (a) mean, (b) maximum, and (c) minimum 2 m air temperature (unit: °C) in North China on 22 June 2023 (in Beijing time) obtained from the CTL experiment. The black box in (a) represents the region where the regional average temperature and precipitation shown in Figure 6 is calculated.
Atmosphere 15 00324 g005
Figure 6. (a) Diurnal variations in regional average (see the black box in Figure 5a) 2 m air temperature obtained from the ERA5 reanalysis (black dashed line), and the CTL (black solid line), noHEAT (red line) and noMOUNTAIN (blue line) WRF simulations. (b) is similar to (a) but for the differences between CTL and noHEAT (red line) and between noHEAT and noMOUNTAIN (blue line).
Atmosphere 15 00324 g006
Figure 7. Geographical distributions of the 2 m air temperature differences (color shading; unit: °C) between (a) CTL and noMOUNTAIN, (b) CTL and noHEAT, and (c) noHEAT and noMOUNTAIN in the afternoon (1300–1500 BJT) of 22 June 2023. (df) are the same as (ac) but in the early morning (0500–0700 BJT) of 23 June 2023. Gray shading is for the terrain height (unit: m) higher than 300 m, i.e., the region where the surface sensible heat flux and terrain elevation are modified in the two experiments of noHEAT and noMOUNTAIN. The black box in (a) is the region of the vertical cross sections shown in Figure 8.
Atmosphere 15 00324 g007
Figure 8. Wind fields (vector; vertical wind is amplified by 100 times for clarity), vertical velocity (contours; unit: cm s−1) and potential temperature (shading; unit: K) in the west–east cross-section (see the box in Figure 7a) in the afternoon (1300–1500 BJT) of 22 June 2023 in (a) CTL, (b) noHEAT, and (c) noMOUNTAIN. Gray shading is for orography. The yellow outline of the orography indicates the modified area in the two experiments of noHEAT and noMOUNTAIN. A 5 × 5 moving average filter is applied to these fields.
Atmosphere 15 00324 g008
Figure 9. Wind fields (vector; vertical wind is amplified by 100 times for clarity), vertical velocity (contours; unit: cm s−1) and potential temperature (shading; unit: K) in the west–east cross-section (see the box in Figure 7a) in the afternoon (1300–1500 BJT) of 22 June 2023 in noMOUNTAIN. Gray shading is for orography. The yellow outline of the orography indicates the modified area in the two experiments of noHEAT and noMOUNTAIN. A 5 × 5 moving average filter is applied to these fields.
Atmosphere 15 00324 g009
Figure 10. Wind fields (vector; vertical wind is amplified by 100 times for clarity), vertical velocity (contours; unit: cm s−1) and potential temperature (shading; unit: K) in the west–east cross-section (see the box in Figure 7a) in the early morning (0500–0700 BJT) of 23 June 2023 in (a) CTL, (b) noHEAT, and (c) noMOUNTAIN. Gray shading is for orography. The yellow outline of the orography indicates the modified area in the two experiments of noHEAT and noMOUNTAIN. A 5 × 5 moving average filter is applied to these fields.
Atmosphere 15 00324 g010
Figure 11. Diurnal variation in surface sensible heat flux (unit: J m−2) averaged over the mountains in North China (see the box in Figure 12c) in the CTL experiments.
Atmosphere 15 00324 g011
Figure 12. Geographical distributions of the streamline and vertical velocity (shading; unit: cm s−1) averaged in the layer of 4–5 km in (a) CTL, (b) noHEAT, and (c) noMOUNTAIN. A Gaussian filter with a standard deviation of 100 km has been applied to these fields. The larger (smaller) box in (c) denotes the region of vertical vorticity (northerly wind) of the mid-lower tropospheric anti-cyclone shown in Figure 13.
Atmosphere 15 00324 g012
Figure 13. Diurnal variations in areal-mean relative vorticity (shading; unit: 10−5 s−1) and northerly wind component (contours; unit: m s−1) for the anomalous anti-cyclone in the mid-lower troposphere (see the larger and smaller boxes in Figure 12c, respectively).
Atmosphere 15 00324 g013
Table 1. Mean absolute error (MAE) between ERA5 reanalysis and model outputs (in the box of Figure 5a).
Period (BJT)CTLnoHEATnoMOUNTAIN
Day (1300–1900)0.991.721.82
Night (0100–0700)2.882.311.44
Disclaimer/Publisher’s Note: The statements, opinions and data contained in all publications are solely those of the individual author(s) and contributor(s) and not of MDPI and/or the editor(s). MDPI and/or the editor(s) disclaim responsibility for any injury to people or property resulting from any ideas, methods, instructions or products referred to in the content.

