1. Introduction
Lightning activity, both global and regional, is an important and independent indicator of convective activity and climatic processes in the Earth system. The influence of climate change on global lightning activity has been suggested quite a long time ago [
1,
2,
3], but in the last decade this topic has attracted more and more attention [
4,
5,
6]. Lightning appears to be a sensitive thermometer of regional and global temperatures, and that in a warmer world lightning will be more common on average. The lightning correlations discussed here may also indicate a future increase in the frequency of extreme rain events [
4,
7]. In particular, enhanced summer warming in mid-latitudes has led to powerful Arctic convective systems with intense lightning activity beginning to be observed much more often. At the same time, there is observational evidence of an increase in thunderstorm events at high latitudes. Reports reveal a significant increase in the number of lightning events in the Arctic region over the past decade [
8,
9,
10]. In 2022, the largest Russian hydrometeorological observatory, the Ice Base Cape Baranova Primary CryoNet Station (79°16′ N, 101°45′ E) on Severnaya Zemlya, recorded the longest thunderstorm (55 min) in the entire history of observations in the high-latitude Arctic [
11].
Although such phenomena attract more and more attention, nowadays, there are still relatively few studies devoted to this problem. Ground-based lightning detection networks such as WWLLN [
12] have expanded in coverage and sensitivity over the years, but the network structure can pose challenges for long-term trend analysis [
13]. Nevertheless, the correlation of thunderstorm activity above 65° N and global temperature anomaly has been analyzed. According to the WWLLN, lightning data are increasing in the Arctic [
8,
9], likely a direct impact of climate change and the rising temperatures in the Arctic.
Future warming in the Arctic is expected to be above the global average, while accurately predicting future changes in lightning requires both consistent high-quality observations from ground-based networks and satellite observations, and modeling from advanced global weather forecast models such as, for example, the WRF-ARW [
14]. Regional versions specifically for the Arctic (Polar WRF) [
15] are currently being developed.
2. Data and Methods
This work is primarily devoted to a detailed analysis of the statistics of lightning strokes around the North Pole and considering possible reasons for this phenomenon. The analysis of the lightning activity in the Arctic region as a whole focuses on identifying the role of global warming and determining the features of its influence. Our consideration of the several cases of abnormal lightning activity in 2019–2023 north of 80° is based on the use of a wide range of experimental and numerical tools to study the characteristics and features of the convective systems development.
2.1. Global Lightning Data
In our analysis, the World Wide Lightning Location Network (WWLLN) data of lightning flashes are used [
12]. The WWLLN consists of very low-frequency ground-based sensors. There are more than 70 sensors all over the world that locate lightning strokes by measuring the time of group arrival (TOGA) at five or more WWLLN stations. The data consist of coordinates (lon, lat), time, energy of the lightning flash and the number of WWLLN stations that detected the flash. Since 2015, the increase in the number of stations no longer affects the total number of recorded lightning flashes, so we use only these data for our analysis. For northern regions, we take into consideration only the strokes detected by six or more WWLLN stations. According to [
9], we limited from below a number of stations that detected the stroke to exclude false positive detections.
2.2. Weather Research and Forecasting Model
We use a numerical Weather Research and Forecasting model [
16] (namely WRF-ARW Core, V4.3.2) to simulate the atmospheric state for the observed thunderstorm events. The WRF model is an open source atmospheric dynamics model. The main support and development of new versions of the model are carried out by the National Center for Atmospheric Research (NCAR, Boulder, CO, USA). Blocks of parameterization of physical quantities are being developed by various scientific groups around the world.
The simulations were performed on two nested domains centered on the North Pole with polar stereographic projection. The grid resolution of the outer domain was 27 km (the size of the domain was 10, 800 × 10,800 km), the grid resolution of the inner domain was 9 km (the size of the domain was 5400 × 5400 km). For the vertical dimension, the model had 44 levels up to the level of 10 hPa. The time step of integration was 135 s for the outer domain and 45 s for the inner domain. The set of physics schemes for the WRF we chose is recommended for use in Polar regions. Options we used are shown in
Table 1.
The initial conditions and boundary conditions were obtained from the NCEP GFS 0.25 Degree Global Forecast Grids Historical Archive [
17]. The simulation was performed for 3 or 4 days to reconstruct the weather situation, i.e., the development and advection of the convective system during the whole lifetime of the thunderstorm. The first 6 modeling hours were not taken into account because of model spin-up.
In this study, we use the following modeled parameters. T2 (temperature at 2 m) lets us analyze the effects of Earth heating. Maximum radar reflectivity shows maximum dbZ in the atmospheric column. The areas of enhanced radar reflectivity correspond to areas of significant convective activity.
2.3. ERA5 Reanalysis
To assess a long-term temperature trend, we use ERA5 reanalysis [
18] from 1980 to 2021. The global dataset consists of a large number of atmospheric parameters with a spatial resolution of 30 km and temporal resolution of 1 h. It combines the results of historical observations using modern modeling data assimilation systems.
For our analysis, we take the temperature at 2 m as an indicator of climate warming. We calculated the moving average value with 12-month window to eliminate the seasonal variation in temperature.
3. Results
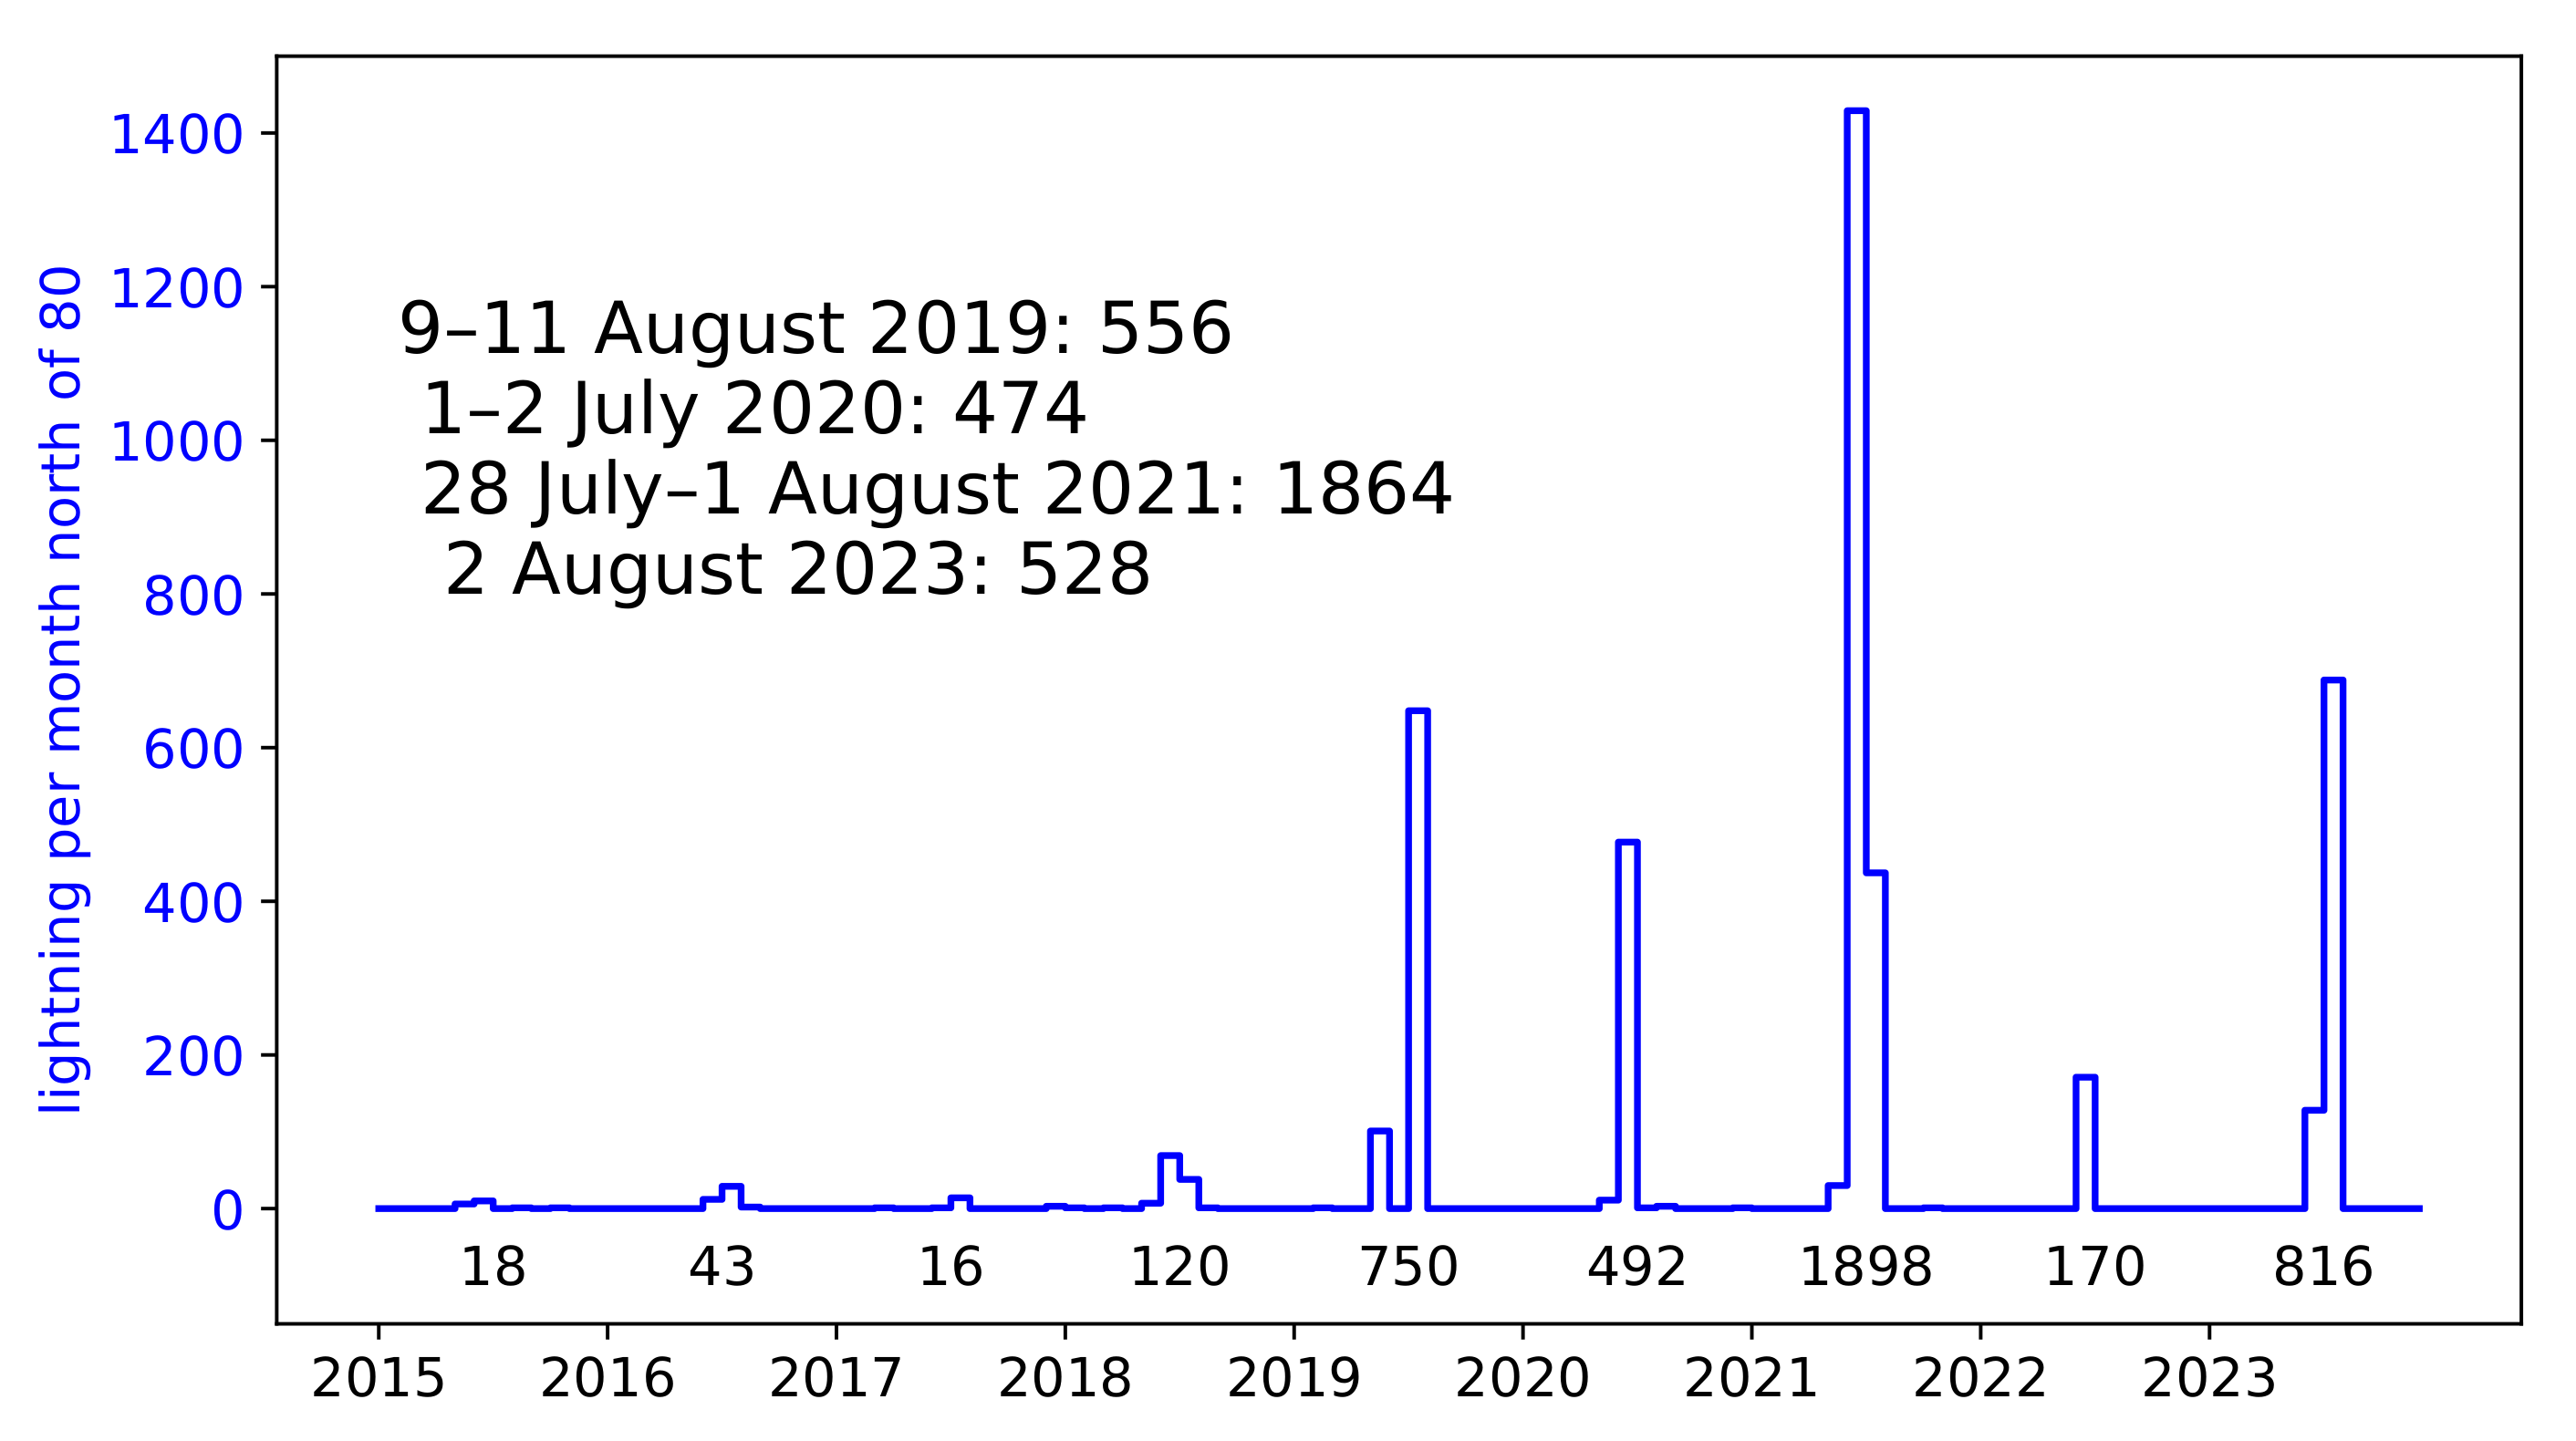
We aim to investigate the underlying factors contributing to the observed increase in lightning activity within polar latitudes. To achieve this, we conducted an analysis of lightning occurrences in the vicinity of the North Pole, specifically focusing on latitudes north of 80°, starting from 2015. The choice of this latitude boundary was made due to the limited presence of significant land surfaces beyond it. In
Figure 1, we present the monthly count of lightning events from 2015 to 2023, and the annual count of WWLLN-detected lightning events in the considered area (north of 80°) presented as numerical values at the bottom of the plot. The amount of lightning of the four most powerful thunderstorms is specified.
Figure 1 shows the monthly number of lightning strikes detected from 1 January 2015 to 30 November 2023 by 6 or more WWLLN stations and north of 80° N. Using the fraction of lightning above 80° N, as in [
9], gave the same results. During the period under consideration, the efficiency of WWLLN detecting hasn’t changed.
Focusing on the years since 2019, it was discovered that almost every year was dominated by one powerful thunderstorm per year that affects the annual statistics. Dates of those thunderstorms were 10 August 2019, 1 July 2020, 28 July 2021, and 2 August 2023.
Table 2 shows dates and time of the beginning and the end of extreme lightning activity in polar latitudes (north of 80° N). We consider a certain hour to be an hour of the thunderstorm when (a) more than 10 lightning strikes were detected in chosen area during that hour and (b) during the previous or/and the next hour, there were also more than 10 lightning strikes detected. The time limits of thunderstorms are quite wide due to the displacement of the area of convective activity in space and the fact that the area under consideration is quite large.
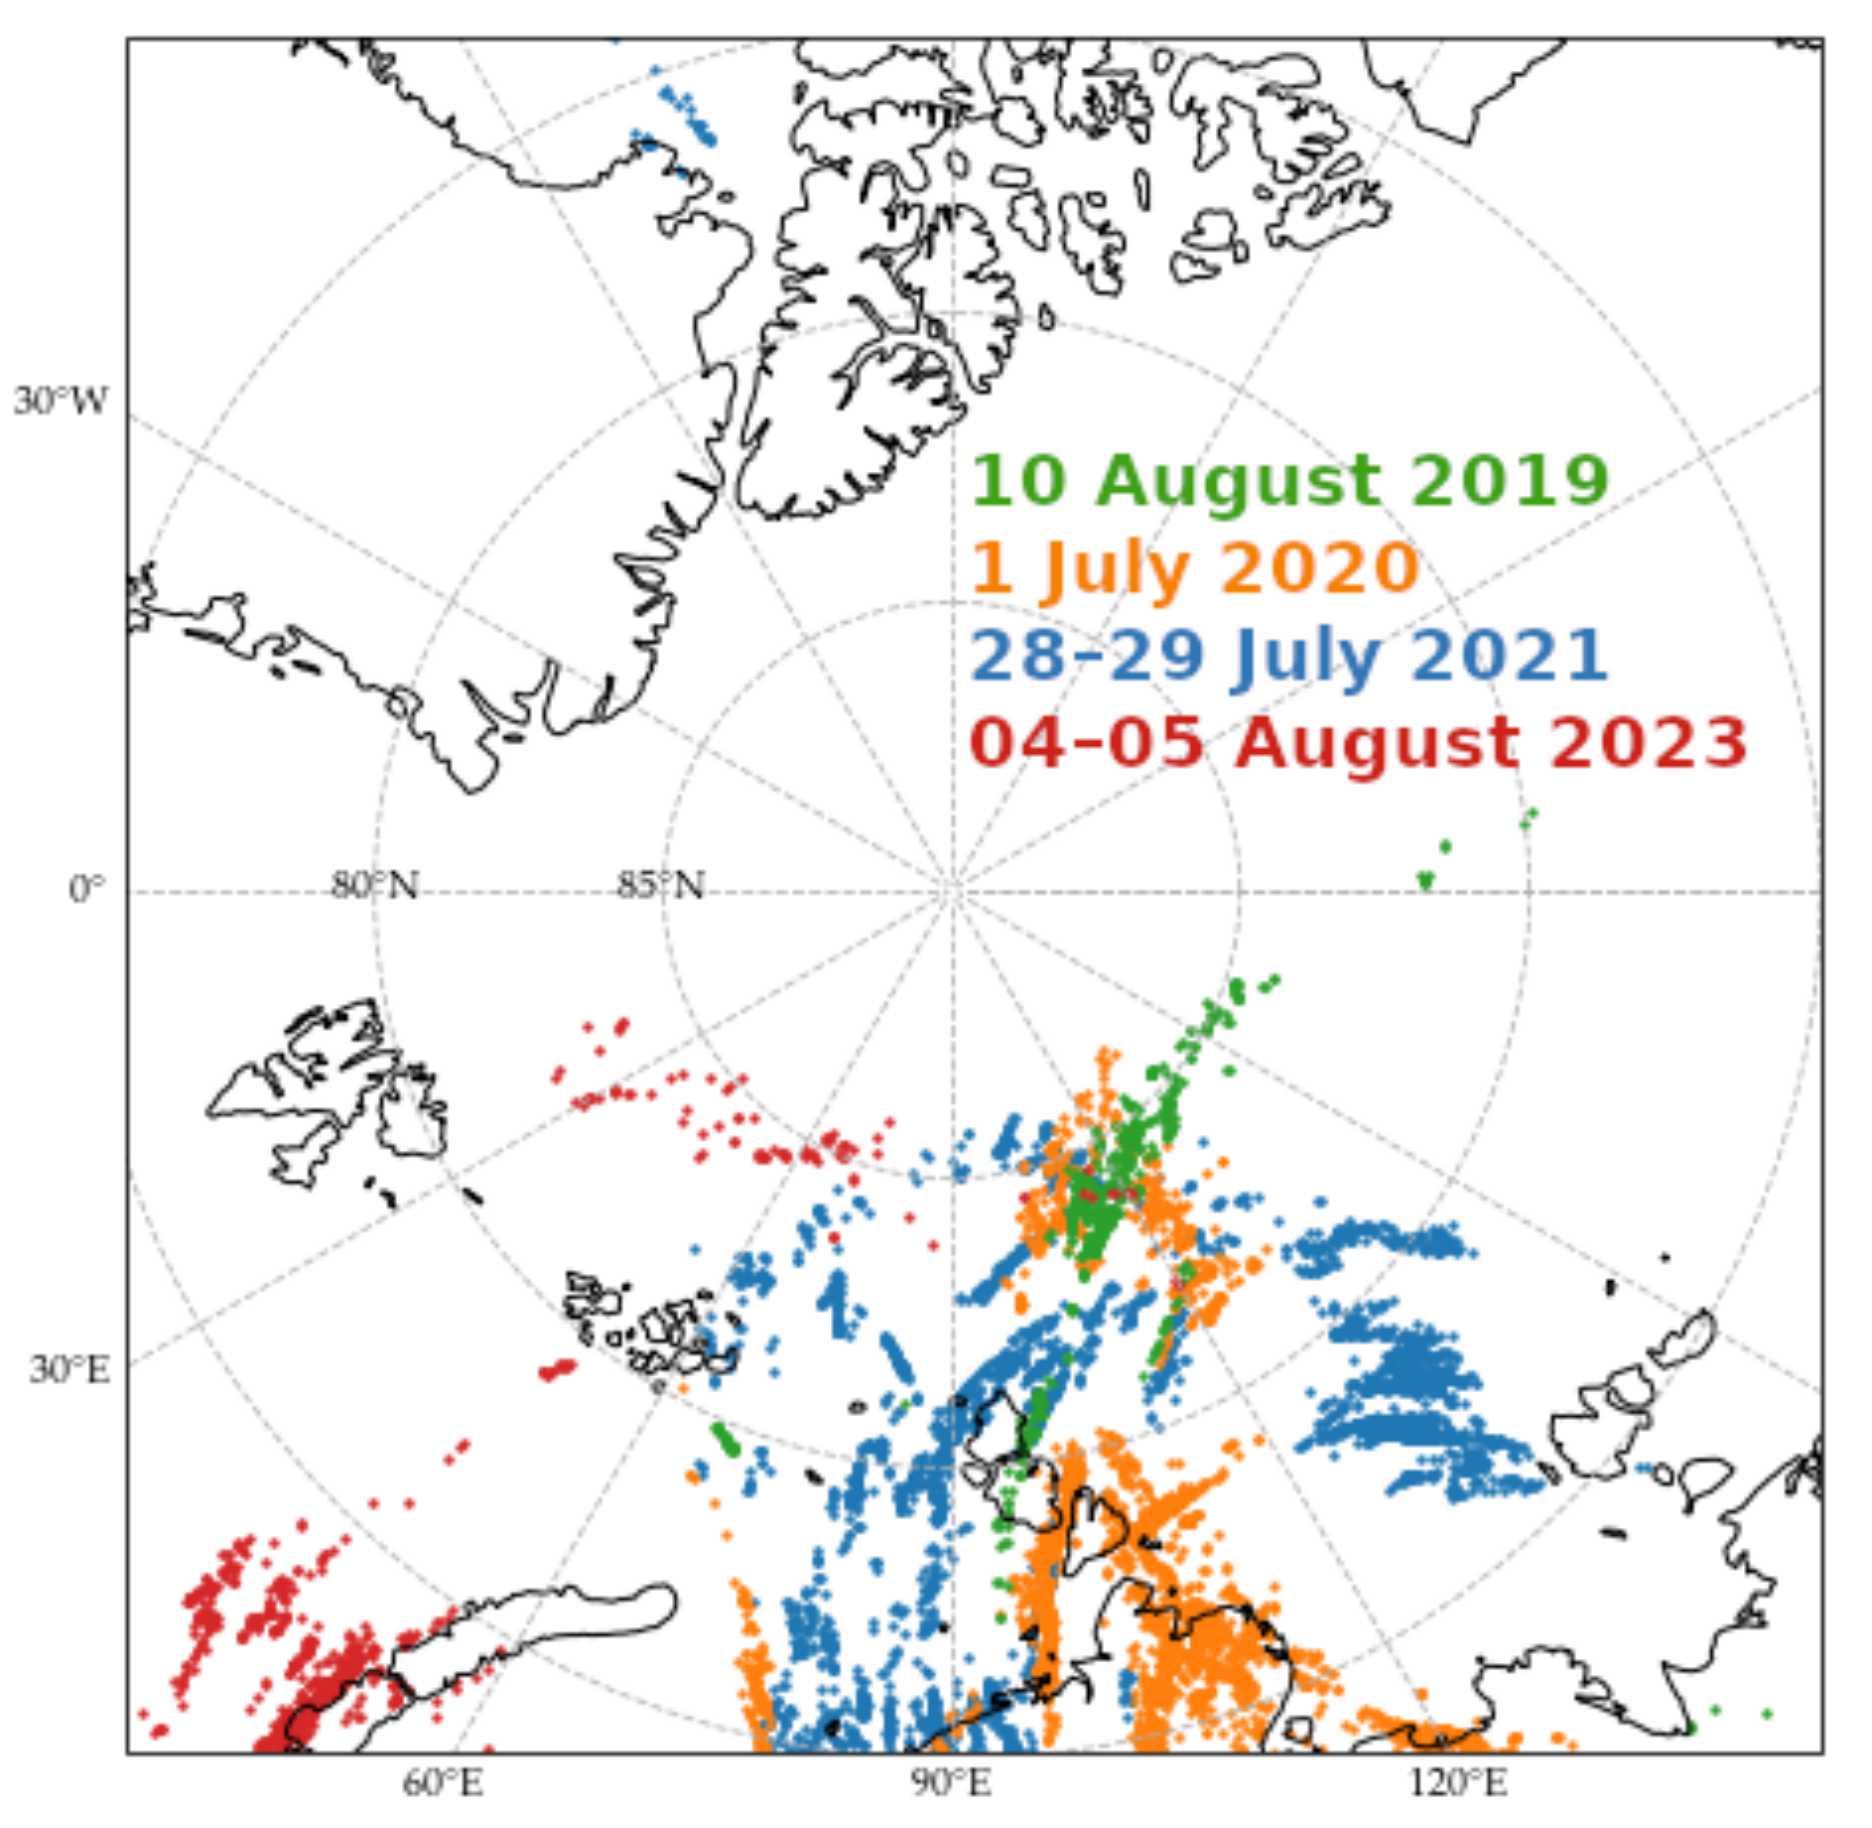
Figure 2 shows location of strikes north of 75° N during mentioned thunderstorms in 2019, 2020, 2021, and 2023.
To better understand the meteorology behind these storms, we simulated the atmospheric state during these thunderstorms with the WRF model (see
Section 2.2). Using the numerical simulation of the state of the atmosphere gives us the finer scale parameters than the synoptic analysis and ERA5 data. WRF encompasses a multitude of parameters essential for estimating convective processes and the evolution of thunderstorm phenomena.
Periods of simulation were the following: 9 August 2019 00:00 UTC to 12 August 2019 00:00 UTC, 26 June 2020 00:00 UTC to 2 July 2020 00:00 UTC, 28 July 2021 00:00 UTC to 31 July 2021 00:00 UTC, and 4 August 2023 00:00 UTC to 7 August 2023 00:00 UTC. These periods included the periods of intensive lightning activity around the North Pole that are shown in
Table 2.
In
Figure 3,
Figure 4,
Figure 5 and
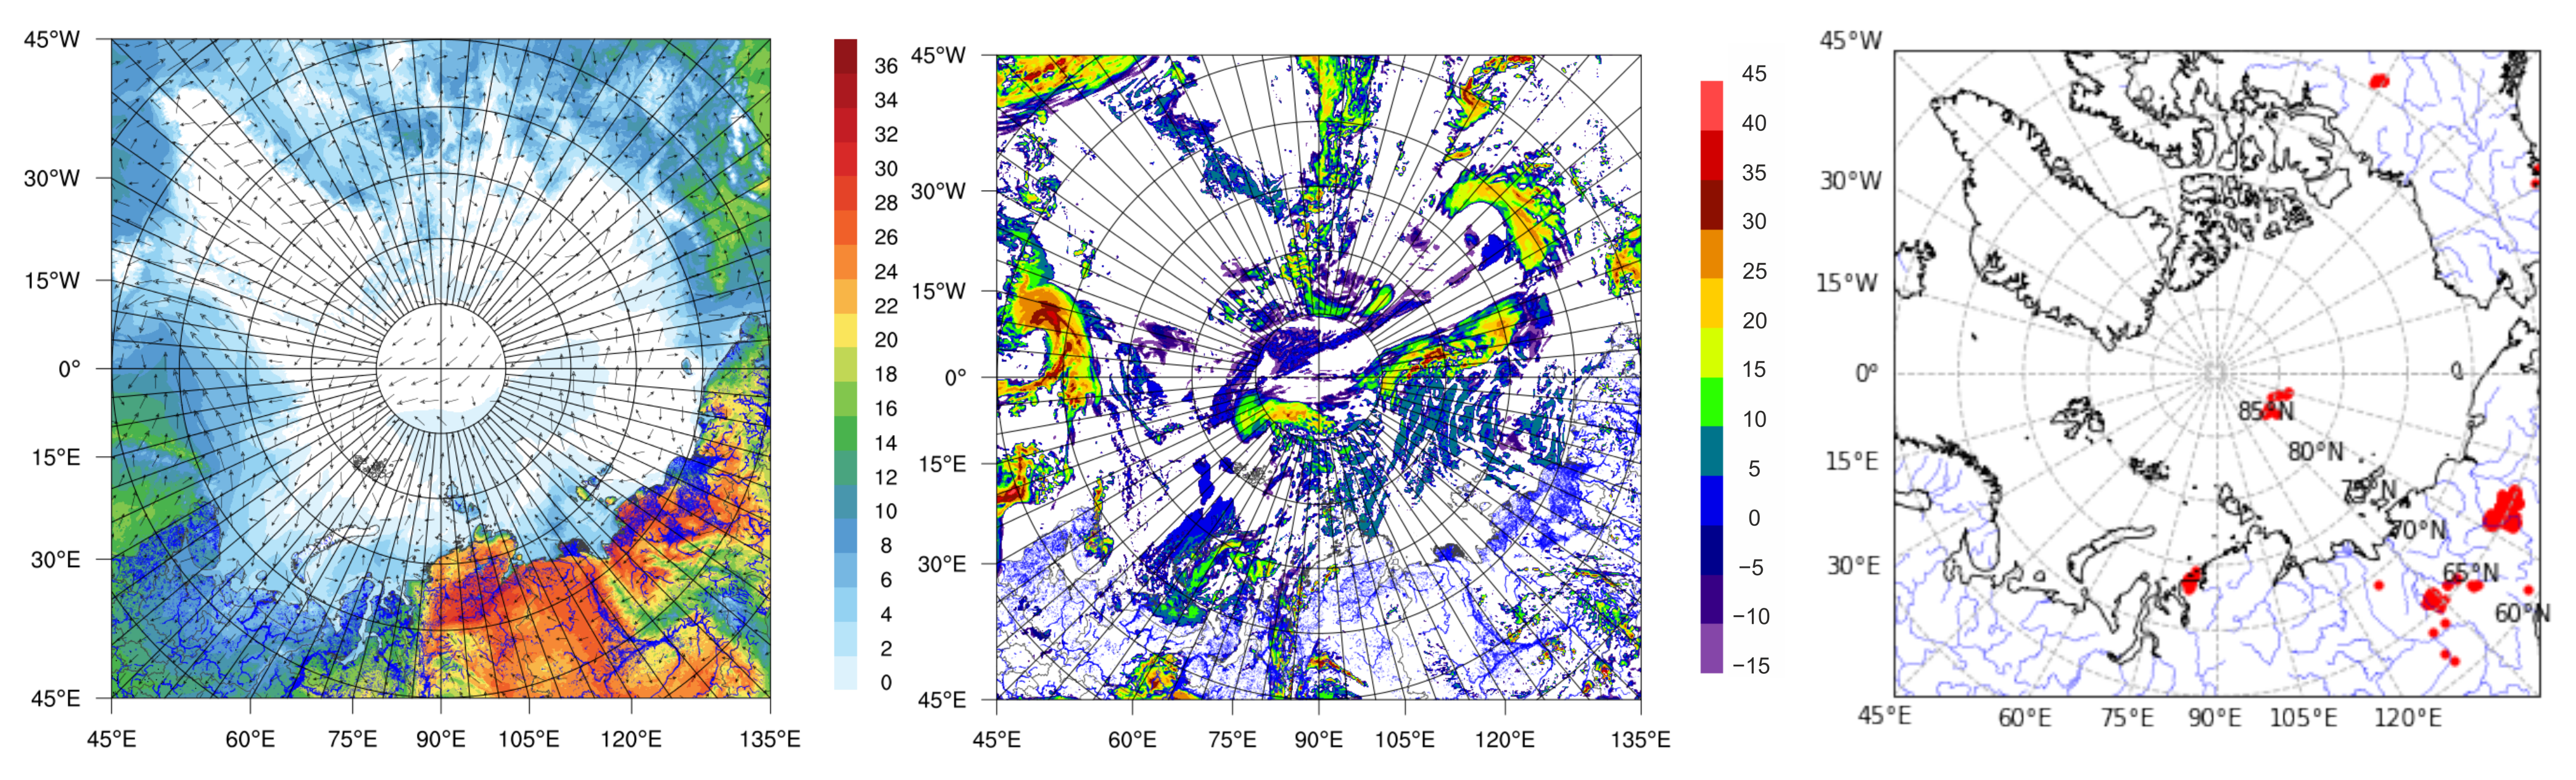
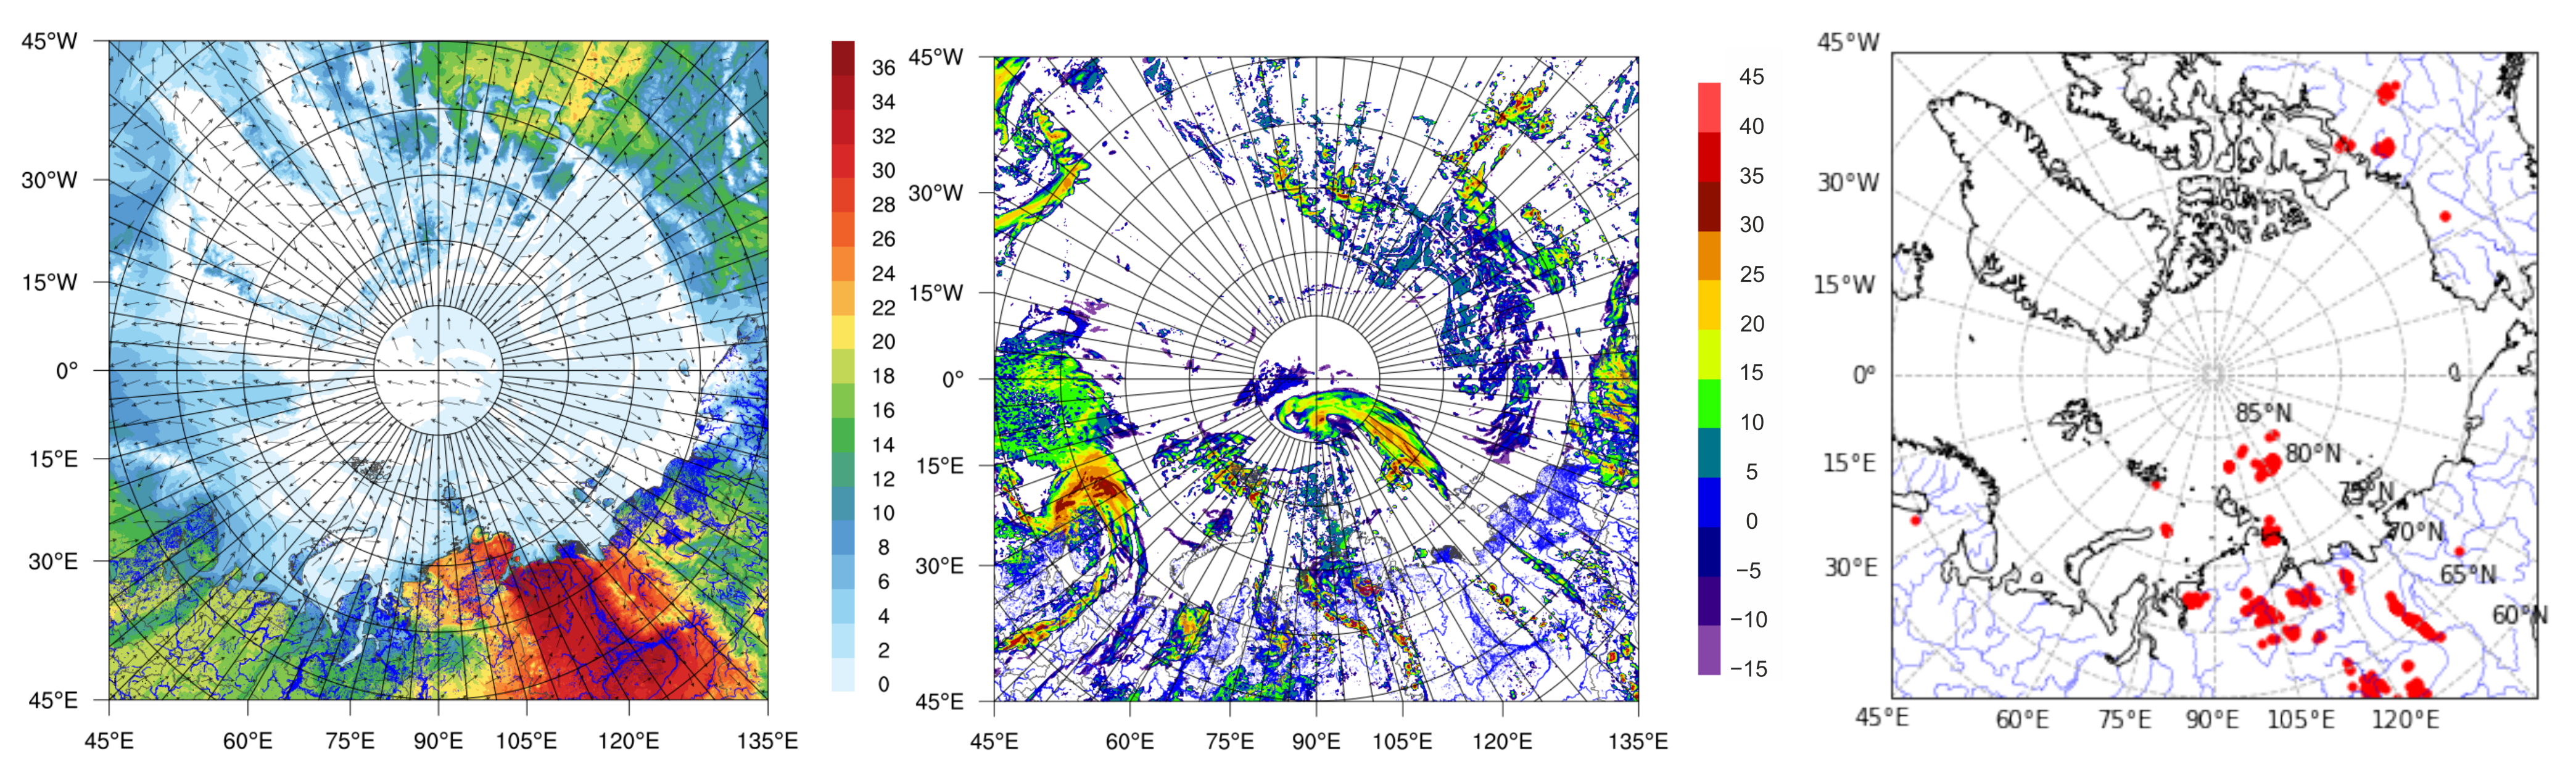
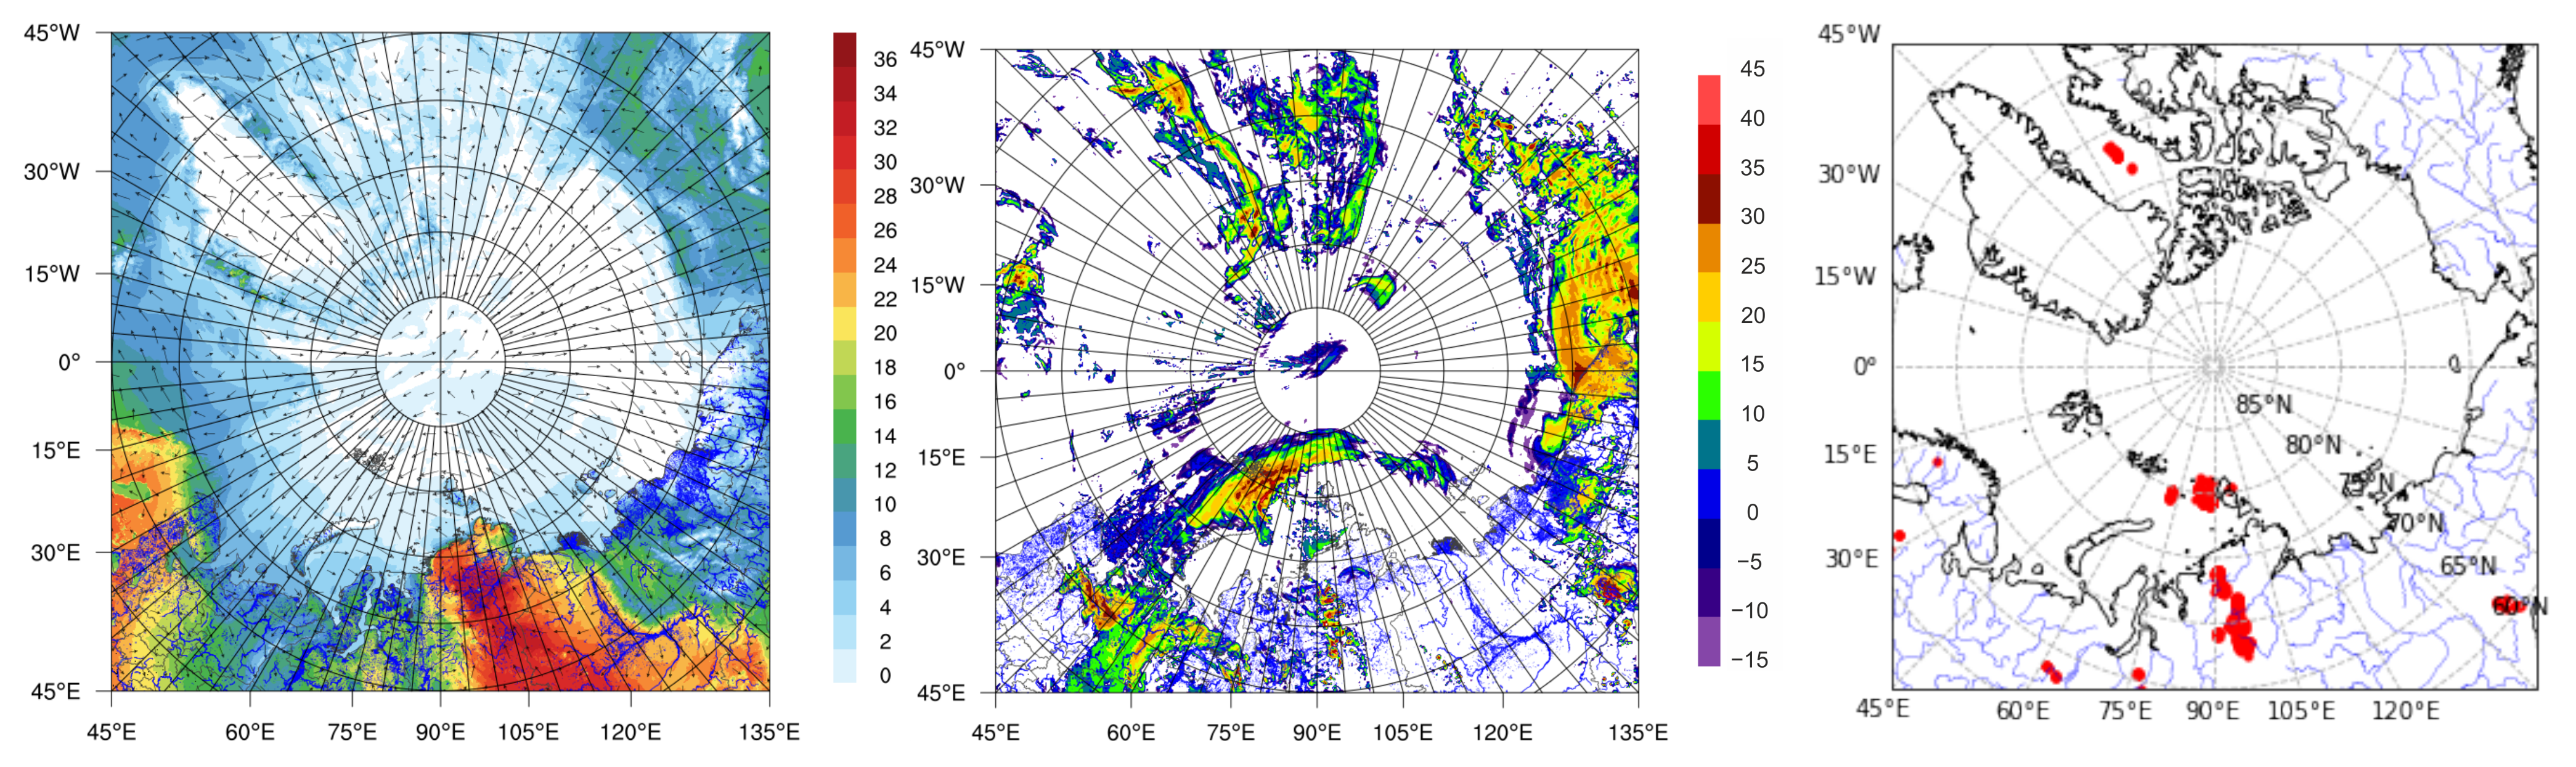
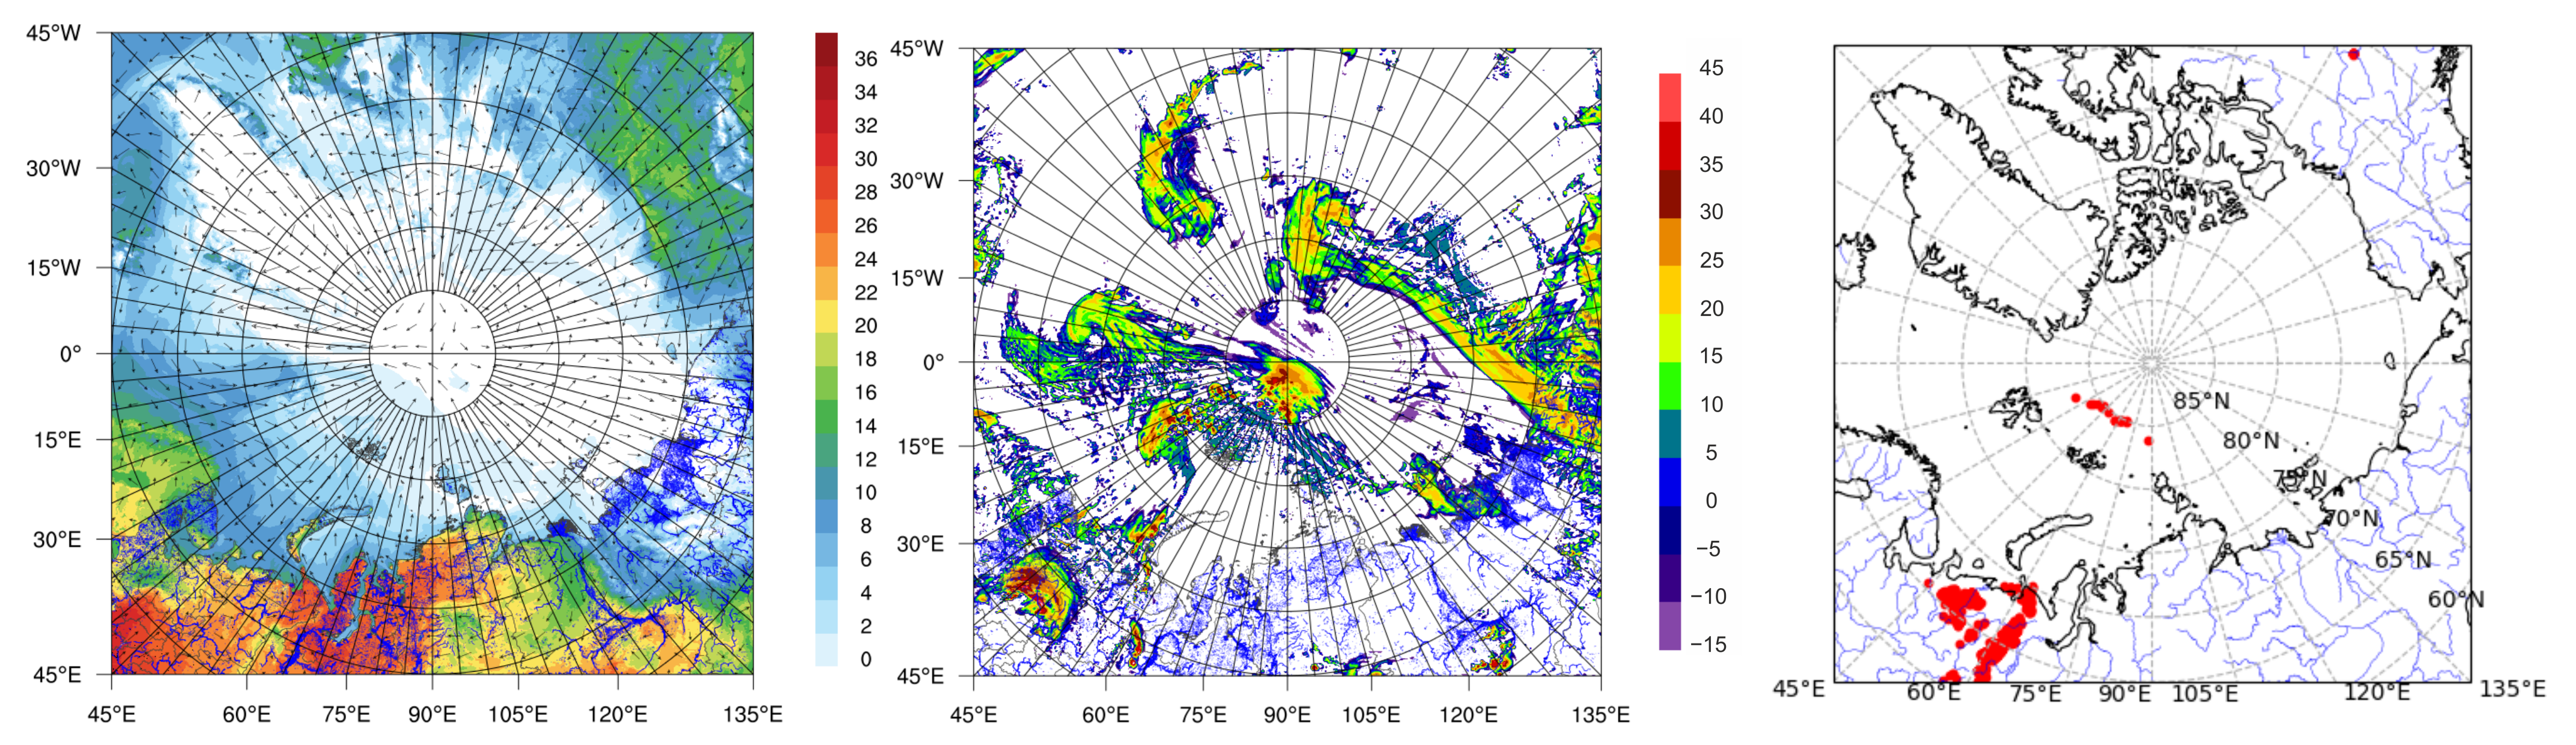
Figure 6, we show the results of simulations for the storms on 11 August 2019, 1 July 2020, 28 July 2021, and 6 August 2023. The left and the central panels show the model output for temperature at 2 m and wind direction and maximum radar reflectivity (mdBZ) in the air column. The right panel shows the lightning data from the WWLLN dataset for 3 h. The applicable figures that demonstrate the development of the convective system in 2019, 2020, 2021, and 2023 are included in the
Supplementary Materials. Moreover, figures with the 500 hPa level height are also available in the
Supplementary Materials.
First of all, the figures reveal the local temperature maximum on the coast of the Arctic Ocean. The sea surface stays cold with temperatures lower than 10 °C. It leads to high-temperature contrast between the sea surface and the land surface. An evolution of the areas of high radar reflectivity happens as follows (see figures in
Supplementary Materials). The development of the convective system starts over hot land. There is a usual storm front which we could see in middle latitudes. It is usually a mesoscale atmospheric vortex that then moves in space. In cases of abnormal thunderstorm activity around the North Pole, it moves to the upper latitudes.
Regions exhibiting elevated radar reflectivity in the Arctic Ocean align with the spatial distribution of lightning occurrences (right column). It is worth mentioning that not all of the depicted lightning strikes are connected with certain strong thunderstorms that are under consideration.
All storms are associated with a strong warming of the North Siberian Lowland and other northern parts of Eurasia (up to 35 °C) in the summer months. This is very unusual for such northern territories; however, it has appeared in four of the five summer seasons since 2019. On the other hand, the Arctic Ocean surface still remains very cold. Hence, the electrification processes in clouds over the ocean surface could not be effective at these low temperatures. This extreme warming over the land, with cool temperatures over the Arctic Ocean, produces an enhanced north–south temperature gradient that increases the baroclinic instability over the Arctic Ocean north of Siberia. This enhanced temperature gradient produces an enhanced polar jet stream over the Arctic that results in the genesis of storms that produce significant amounts of lightning due to the instability that develops in these storms. Hence, the extremely warm temperatures over northern Siberia drive the formation of storms over the Arctic, and hence impact the polar lightning north of 80 degrees. If such summer warmings continue to appear and expand in the coming years, we predict even more thunderstorms detected in the polar regions, and close to the North Pole.
4. Discussion and Conclusions
Our analysis of the lightning activity in recent years in the Arctic revealed the occurrence of a few intense thunderstorms each year that often result in lightning occurrence close to the North Pole.
Our numerical simulation of the weather around the North Pole during the days of extreme lightning activity showed the same pattern. The results of the simulations were the following. As a result of strong heating of the land surface in the Siberia region, strong convective systems develop due to the enhanced baroclinic instability that develops between the hot land areas and the cold Arctic ocean.
The polar lows that develop along the polar jet stream enhanced by this summer north–south temperature gradient have significant values of CAPE (not shown), producing significant precipitation, and associated lightning. In addition, the model dynamics of maximum radar reflectivity in the air column (mdBZ) show the regions of high mdBZ moving towards the North Pole during the storm’s lifetime. As the lightning location data show, the areas of lightning activity coincide with the areas with high mdBZ.
The storms and lightning do not form where we have the maximum temperature anomalies, but actually north of Siberia over the Arctic Ocean. Based on baroclinic theory, the storms form where we have the maximum north–south temperature gradient, which occurs over the Arctic Ocean, but are driven by the hot summer temperatures over Siberia. Our hypothesis posits that lightning patterns in the Arctic ocean align with global trends driven by the exceptional warming of certain regions in Eurasia. This regional warming is accompanied by an overall enhancement of baroclinic instability and an upsurge in the occurrence of unique and intense thunderstorms over the polar Arctic.
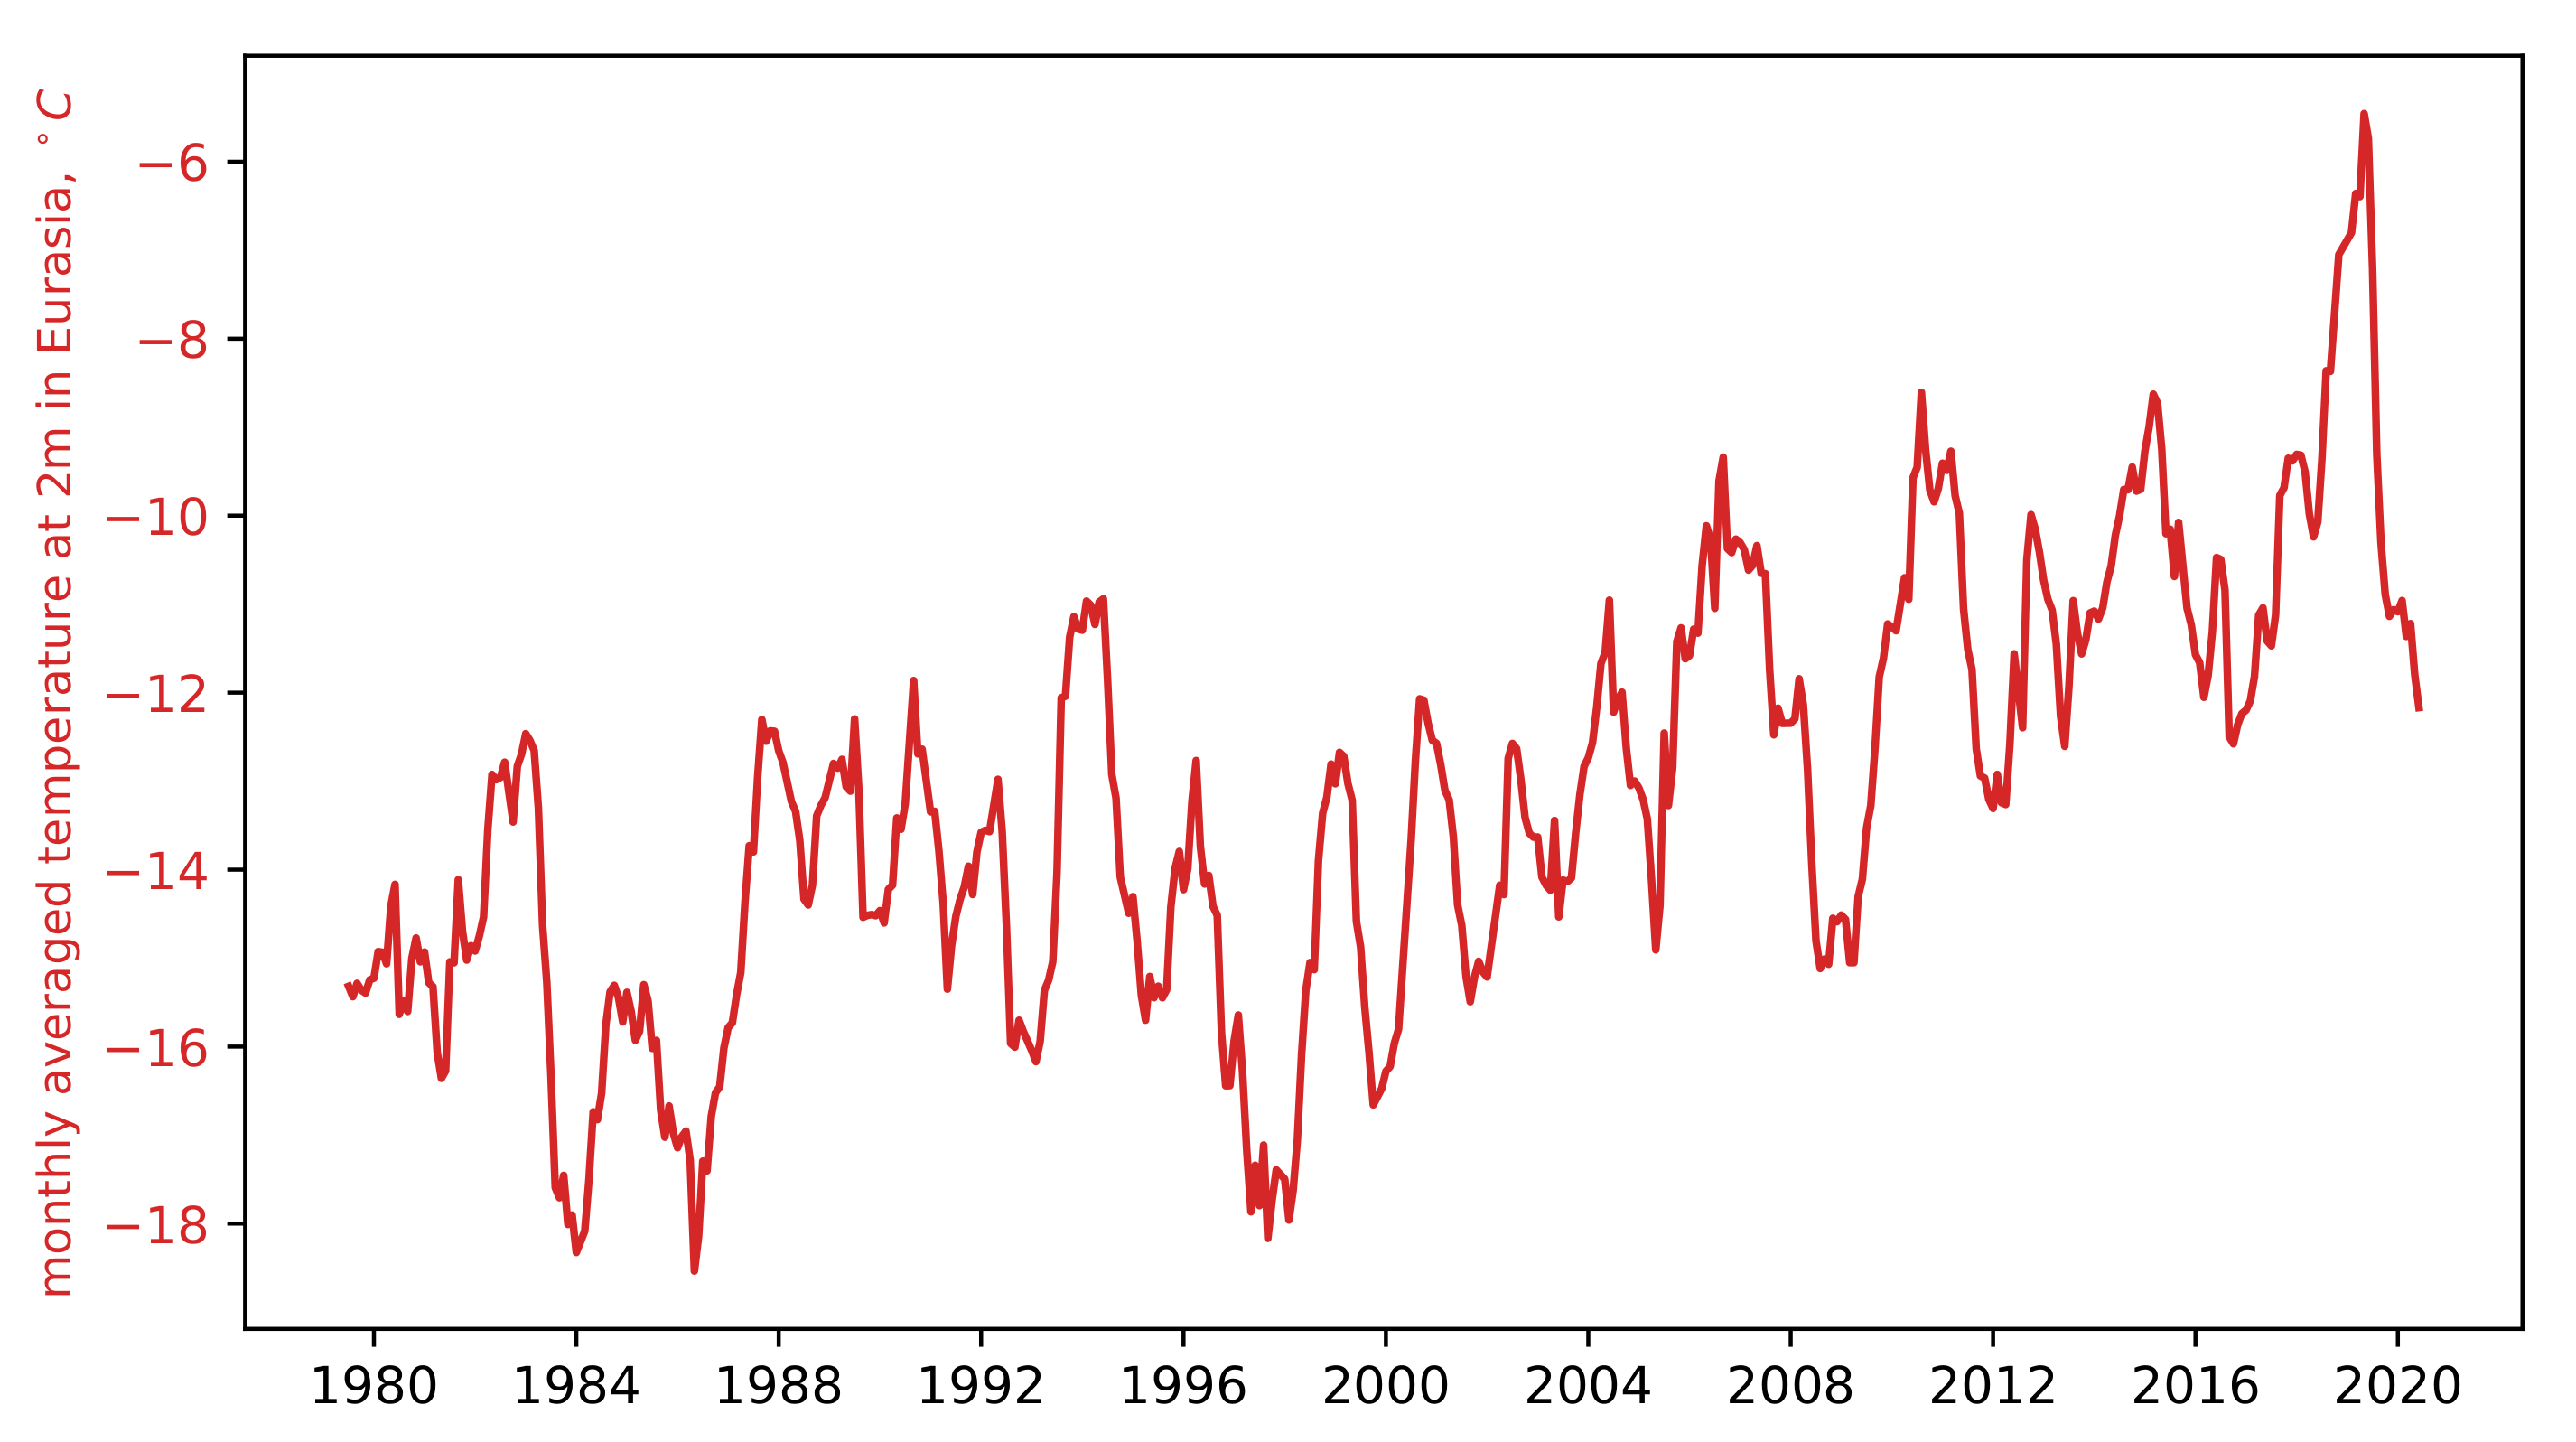
To strengthen this claim, we investigated an average temperature at 2 m during the previous 42 years using ERA5 data (see
Section 2.3).
Figure 7 shows the significant strong positive trend of temperature in area 55° N–75° N, 30° E–135° E. This area contains regions of Eurasia where the significant warming was simulated. As the numerical modeling represents thunderstorms that were observed, we assume that such temperatures of the land surface are also credible. According to the results, strong convective systems occurred over the continent and then moved towards the North Pole. We assume that powerful thunderstorms with similar characteristics may appear in the future because of this strong land-heating during the summer.
In conclusion, we have shown that the majority of lightning in the polar regions (north of 80 °N) is due to only a few intense thunderstorm days every summer. However, these thunderstorms appear to be a new feature in the region, with very few thunderstorms in previous years. We have shown that the concentration of this high-latitude lightning near the North Pole is primarily produced in storms that form over the Arctic Ocean north of Siberia. The reason for this fixed location over the past few years is due to the extreme summer heat observed in northern Eurasia, with temperatures reaching 35 °C in the summer months in Siberia. These extreme temperatures dramatically increase the north–south temperature gradient between land and ocean, and hence the baroclinic instability over the Arctic Ocean, which drives the formation of storms in the summer. These storms are highly unstable due to the warm continental air mixing with the cold polar air, with the resulting lightning in these storms. As the the average summer temperatures in northern Eurasia have been increasing, we can expect even more thunderstorms and lightning to occur north of 80° N, and soon, lightning near the North Pole may be a common summer occurrence.
Author Contributions
Conceptualization, N.I., A.P. and M.S.; methodology, C.P., N.I. and A.P.; data curation, N.I., F.S. and A.P.; visualisation, A.P.; writing—original draft preparation, A.P. and M.S.; writing—review and editing, C.P. and M.S.; supervision, C.P., A.T. and A.K.; funding acquisition, A.K. All authors have read and agreed to the published version of the manuscript.
Funding
This research is supported by the NNSTU Development Program “Priority–2030” within the Consortium “Assimilation of Arctic Territories and Development of the Northern Sea Route”. This research is also supported by the state assignment of the A.V. Gaponov-Grekhov Institute of Applied Physics of the Russian Academy of Sciences (Project No. FFUF-2022-0008).
Institutional Review Board Statement
Not applicable.
Informed Consent Statement
Not applicable.
Data Availability Statement
Acknowledgments
The authors wish to thank the World Wide Lightning Location Network (
http://wwlln.net), a collaboration among over 50 universities and institutions, for providing the lightning location data used in this paper.
Conflicts of Interest
Author Andrey Terentev was employed by the company Rapid Telecom Systems Labs LLC. The remaining authors declare that the research was conducted in the absence of any commercial or financial relationships that could be construed as a potential conflict of interest.
References
- Price, C.; Rind, D. Possible implications of global climate change on global lightning distributions and frequencies. J. Geophys. Res. Atmos. 1994, 99, 10823–10831. [Google Scholar] [CrossRef]
- Reeve, N.; Toumi, R. Lightning activity as an indicator of climate change. Q. J. R. Meteorol. Soc. 1999, 125, 893–903. [Google Scholar] [CrossRef]
- Williams, E.R. Lightning and climate: A review. Atmos. Res. 2005, 76, 272–287. [Google Scholar] [CrossRef]
- Price, C. Lightning Applications in Weather and Climate Research. Surv. Geophys. 2013, 34, 755–767. [Google Scholar] [CrossRef]
- Finney, D.L.; Doherty, R.M.; Wild, O.; Stevenson, D.S.; MacKenzie, I.A.; Blyth, A.M. A projected decrease in lightning under climate change. Nat. Clim. Chang. 2018, 8, 210–213. [Google Scholar] [CrossRef]
- Chen, Y.; Romps, D.M.; Seeley, J.T.; Veraverbeke, S.; Riley, W.J.; Mekonnen, Z.A.; Randerson, J.T. Future increases in Arctic lightning and fire risk for permafrost carbon. Nat. Clim. Chang. 2021, 11, 404–410. [Google Scholar] [CrossRef]
- Williams, E.R. The Schumann Resonance: A Global Tropical Thermomete. Science 1992, 256, 1184–1187. [Google Scholar] [CrossRef] [PubMed]
- Saha, J.; Price, C.; Plotnik, T.; Guha, A. Are thunderstorms linked to the rapid Sea ice loss in the Arctic? Atmos. Res. 2023, 294, 106988. [Google Scholar] [CrossRef]
- Holzworth, R.H.; Brundell, J.B.; McCarthy, M.P.; Jacobson, A.R.; Rodger, C.J.; Anderson, T.S. Lightning in the Arctic. Geophys. Res. Lett. 2021, 48, e2020GL091366. [Google Scholar] [CrossRef]
- Global Lightning Detection Network GLD360—Reliable Storm and Lightning Information. Available online: https://www.vaisala.com/en/products/systems/lightning/gld360 (accessed on 4 September 2023).
- AARI Scientists Recorded the Longest Thunderstorm in the High-Latitude Arctic (in Russian). Available online: https://www.aari.ru/press-center/news/vae/uchenye-aanii-zafiksirovali-samuyu-prodolzhitelnuyu-grozu-v-vysokoshirotnoy-arktike (accessed on 24 September 2023).
- The World Wide Lightning Location Network. Available online: https://wwlln.net/ (accessed on 4 September 2023).
- Tarabukina, L.; Kozlov, V. Seasonal Variability of Lightning Activity in Yakutia in 2009–2019. Atmosphere 2020, 11, 918. [Google Scholar] [CrossRef]
- Weather Research & Forecasting Model (WRF). Available online: https://www.mmm.ucar.edu/models/wrf (accessed on 15 February 2023).
- Rubinstein, K.; Zarochentsev, G.; Ignatov, R.Y.; Volodin, E.; Iakovlev, N.; Gritsun, A.; Emelina, S. Regionalization of the INM RAS global climate model data by the Polar WRF model in the Arctic. IOP Conf. Ser. Earth Environ. Sci. 2020, 606, 012051. [Google Scholar] [CrossRef]
- Skamarock, W.C.; Klemp, J.B.; Dudhia, J.; Gill, D.O.; Liu, Z.; Berner, J.; Wang, W.; Powers, J.G.; Duda, M.G.; Barker, D.; et al. A Description of the Advanced Research WRF Model Version 4.3 (No. NCAR/TN-556+STR); National Center for Atmospheric Research: Boulder, CO, USA, 2021; p. 148. [Google Scholar]
- National Centers for Environmental Prediction, NationalWeather Service, NOAA, U.S. Department of Commerce. NCEP GFS 0.25 Degree Global Forecast Grids Historical Archive; National Centers for Environmental Prediction, National Weather Service, NOAA, U.S. Department of Commerce: Silver Spring, MD, USA, 2015. [Google Scholar]
- Hersbach, H.; Bell, B.; Berrisford, P.; Hirahara, S.; Horányi, A.; Muñoz-Sabater, J.; Nicolas, J.; Peubey, C.; Radu, R.; Schepers, D.; et al. The ERA5 global reanalysis. Q. J. R. Meteorol. Soc. 2020, 146, 1999–2049. [Google Scholar] [CrossRef]
| Disclaimer/Publisher’s Note: The statements, opinions and data contained in all publications are solely those of the individual author(s) and contributor(s) and not of MDPI and/or the editor(s). MDPI and/or the editor(s) disclaim responsibility for any injury to people or property resulting from any ideas, methods, instructions or products referred to in the content. |
© 2024 by the authors. Licensee MDPI, Basel, Switzerland. This article is an open access article distributed under the terms and conditions of the Creative Commons Attribution (CC BY) license (https://creativecommons.org/licenses/by/4.0/).

 ,
, 


