Abstract
Climate change is expected to significantly affect countries in Southern Europe and the Mediterranean Basin, causing higher-than-average temperature increases, considerable reductions in rainfall and water runoff, and extreme events such as heatwaves. These pose severe threats to local energy systems, requiring a reliable and quantitative risk analysis. A methodological approach is thus proposed which covers both energy supply and demand, utilizing the latest climate projections under different greenhouse gas emissions scenarios and an appropriate scale for each energy form. For energy supply technologies, risks are assessed through statistical regression models and/or mathematical equations correlating climatic parameters with energy productivity. To analyze climate risks for energy demand, bottom–up models were developed, integrating both behavioral and policy aspects which are often considered in a very limited way. The results show that climate change will mainly affect electricity generation from hydroelectric and thermal power plants, with variations depending on the plants’ locations and uncertainties associated with precipitation and runoff changes. The climate risks for solar and wind energy were found to be low. Energy consumption will also be affected, but the range of risks depends on the ambition and the effectiveness of measures for upgrading the thermal performance of buildings and the intensity of climate change.
1. Introduction
The energy sector has a strong connection to climate change. First, the operation of fossil fuel power plants results in the generation of greenhouse gas (GHG) emissions, while on the other hand, the sector itself is affected by climate change due to changes in energy consumption patterns and production potential. Climate and weather changes affect energy supply through changes in the efficiency of power plants and the productivity of renewable energy sources (RESs) that depend directly on climate conditions. For example, the energy availability of a wind farm depends directly on wind variability, the power generated by a photovoltaic station is proportional to sunshine, and hydroelectric energy is affected by precipitation and surface runoff [1]. At the same time, an increase in air temperature may reduce the efficiency of thermal power stations and complicate the operation of their cooling systems [2]. Climate change also affects the operation of energy transmission/distribution systems and has a strong influence on final energy demand, especially in the buildings’ sector.
Greece, a southern European country located in the Mediterranean Basin, is particularly vulnerable to climate change. According to the latest Sixth Assessment Report of the Intergovernmental Panel on Climate Change (IPCC), Southern Europe and the Mediterranean are hotspots for climate change impacts, suffering from higher-than-average temperature increases, considerable reductions in rainfall and water runoff, and extreme events such as flash floods and heatwaves, all posing severe threats to local energy systems and connected sectors [3]. Therefore, updated, reliable, and quantitative knowledge on these risks is highly needed for shaping efficient climate change management adaptation strategies. Our paper aims to contribute to this end, focusing on changes in the productivity of various power generation technologies critical to ensuring energy supply as well as changes in energy consumption patterns in Greek households.
In terms of energy supply, the number of studies that have investigated, to date, the quantitative impacts of climate change on the productivity of electricity generation technologies in Greece is relatively limited. Thermal power plants and hydroelectric stations are the two power generation technologies which will be most affected by climate change. Greek thermal power plants are expected to experience a reduction of 8% to 17% in their efficiency, mainly due to the increased air temperature and a combination of higher cooling demands and reduced water resources [4]. Regarding hydroelectricity generation, three different studies [4,5,6] predict lower productivity in future climates by up to 24% over the time period up to 2050, a rate that may increase up to 33% by 2100. The losses are greater for the RCP8.5 scenario because of higher temperatures and lower rainfall in future climates, while run-of-river hydropower seems to be more vulnerable to these changes. Various studies [4,7,8,9] show that changes in photovoltaic stations’ productivity are expected to be low (up to ±3% by 2050). Most studies also report small fluctuations in the productivity of wind farms in mainland Greece and an increase in productivity (by 5% or more) for off-shore wind systems in the Aegean region in future climates [1,4,10,11,12]. Only one study out of a total of six examined predicted greater fluctuations in changes in the productivity of wind systems due to climate change, at least in some parts of the country, which may reach ±15% by 2040 [13]. However, as most of these studies aimed at assessing future impacts across all of Europe, their spatial resolution was not always sufficiently high, while many of them also focused on the evolution of climatic indices as a proxy for energy indicators rather than on the latter themselves. Also, some of these studies were rather old and thus did not make use of the latest climate change projections. Thus, our paper aims to address these knowledge gaps and explore each energy supply technology in the context of its required spatial and temporal context while also using three Representative Concentration Pathway (RCP) scenarios (RCP2.6, RCP4.5, and RCP8.5) to provide a thorough and complete picture of potential climate change impacts.
At the other end of the chain, energy demand is directly related to changes in weather and climatic conditions. In general, the higher average temperatures expected in future climates are likely to result in a reduction in energy consumption for heating and an increase in energy consumption for cooling. However, it is not clear whether the total energy consumption of a system will eventually increase or decrease. Especially for electricity, the increased demand in the summer months for air conditioning may be partially or fully offset by a decrease in the winter demand for heating. However, the consumption of other energy resources may be more sensitive to winter weather conditions, as in many countries, households use natural gas or oil products for space heating, while electricity is used only in auxiliary heating systems. So far, most studies have focused on climate change’s impacts on energy demand in the residential sector, with other parts of the economy (e.g., health, food trade, tourism, agriculture) being much less addressed despite their expected sensitivity and vulnerability [14,15,16,17]. In the building sector, several studies have been carried out, and various approaches have been applied to investigate climate change’s impacts on energy demand in Greece. For example, Eskeland and Mideska [18] found that the effect of increased electricity consumption for cooling will outweigh decreased electricity consumption for heating, resulting in net increases in electricity consumption of 10% by the end of the century under the A1B climate scenario. Castaño-Rosa et al. [19] found that households in Greece will see an increase in their electricity consumption in summer by up to 11% in Athens, 17% in Thessaloniki, and 4% in Tripoli by 2050. Tsoka et al. [20] investigated the impact of climate change and urban heat islands on the heating and cooling energy needs of an urban building unit in Thessaloniki, northern Greece, and estimated that the annual heating energy demand for the future up to 2050 is projected to decrease by 19–21% (10.6 kWh/m2), whereas the cooling energy demand is expected to increase by 60–100% (9.7–15.6 kWh/m2). Droutsa et al. [21] found that if existing non-residential buildings in Greece are not renovated, the average heating energy use is expected to decrease by 22–26% by 2050 and by 23–52% by 2090, while on the other hand, the average cooling energy use is expected to increase by 24–30% by 2050 and by 28–66% in 2090. Despite this wealth of studies, most of these research efforts focus on electricity (mainly due to the lack of detailed data on the daily or monthly consumption of fossil fuels) and on the short-term effects on its demand due to changing weather conditions (e.g., heating and cooling degree days). However, such an approach is likely to underestimate or overestimate the long-term effects of climate change on energy demand, as it does not consider potential changes in the thermal characteristics of a building stock or the number and type of appliances used in buildings. Thus, some authors have attempted to integrate these structural changes into computational processes for estimating the effects of climate change on energy demand, for example, through statistical Error Correction Models (see De Cian and Wing [22]). However, these proposed models are characterized by some critical limitations. Namely, they do not sufficiently disaggregate groups of energy consumers and appropriately reflect their relevant energy behavior; they do not integrate enough the technological improvements in devices that occur over time and thus overestimate energy consumption; and they ignore or integrate in a very limited way the uncertainties in the effectiveness of the implemented climate change policies and their consequent effects on the magnitude of energy consumption and the composition of the energy mix. Our paper aims to address these methodological gaps by developing impact assessment models which duly integrate behavioral and policy aspects and thus can provide a more reliable estimate of potential climate change impacts.
In the following sections, the paper presents the proposed assessment methodology, followed by the relevant results obtained, a subsequent discussion, and the conclusions drawn.
2. Materials and Methods
2.1. Potential Impact Pathways and Main Directions for Impact Assessment
An overview of the possible climate change impacts on the Greek energy system is provided in Table 1, based on relevant research [15,23]. For each type of energy technology, the main climatic parameters that may affect energy production are identified, as well as the relevant impact pathways.

Table 1.
Overview of climate change impacts on the energy sector—most important climate drivers and impacts for Greece.
As already mentioned, our paper focuses on energy supply and demand in the building sector, not transmission and distribution grids or energy demand outside households.
For a quantitative assessment of the effects of climate change on the potential of RES technologies and on the efficiency of thermal power plants, two alternative approaches can be implemented:
- The first approach is based on statistical regression models, which are developed by utilizing historical data and relating the electricity produced by technologies to one or more climatic parameters (e.g., temperature, rainfall, etc.). These models are then applied to historical and future climate data, and thus the change in electricity production is attributed solely to climate change. In the context of the present study, such models were mainly used to estimate climate change impacts on hydroelectricity production.
- The second approach uses mathematical equations, provided by manufacturers or the international literature, correlating one or more climatic parameters with the productivity (or efficiency) of the power technologies in question (e.g., wind speed with energy production by wind farms), and here it has been used to estimate climate change impacts on both RES technologies and fossil fuel power plants.
Climate change’s impacts on the energy demand of residential buildings in Greece are calculated through a bottom–up engineering model that allows for a detailed simulation of the evolution of the characteristics of the building stock in the country and the corresponding energy consumption per energy use.
The quantitative assessment is carried out in representative regions of either the four climate zones in Greece or geographic locations with a high installed capacity of power stations (Figure 1).
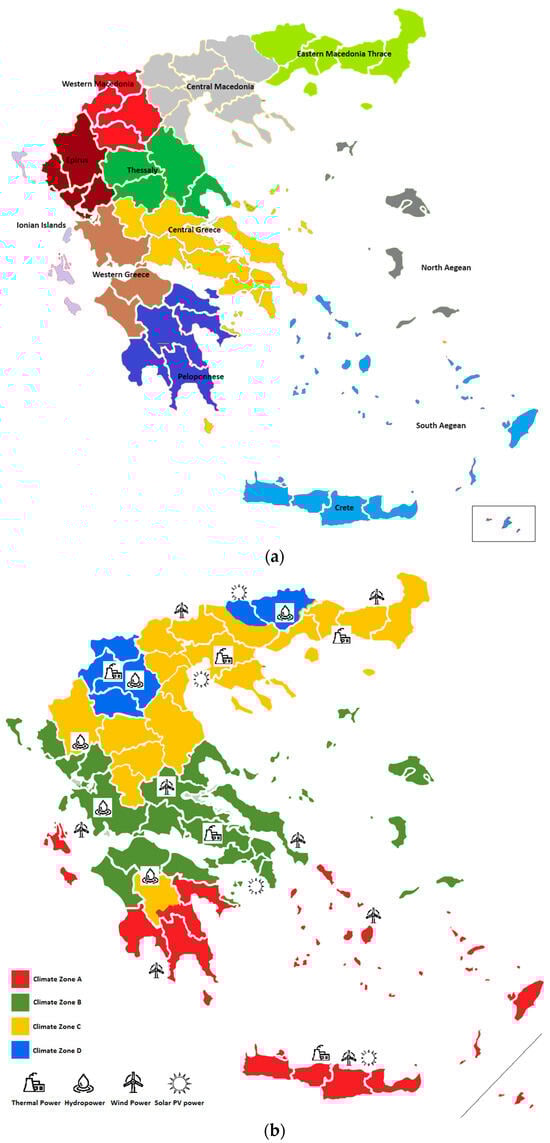
Figure 1.
Map of the study area (Greece) showing (a) regions and (b) the climate zones and representative locations of power stations examined in this study.
The analysis is undertaken in the time period up until 2050, utilizing historical (1971–2000) and future (2021–2050) climate data to assess impacts on energy supply and demand.
The climate data (air temperature, solar radiation, precipitation, runoff, and wind speed) were derived from the results of four climate simulations within the EUROCORDEX project database [24], and they are characterized by the highest available spatial (0.11° × 0.11°) and temporal (daily time-step) resolution. Regarding the period 2021–2050, the climate data cover the two extreme Representative Concentration Pathways scenarios (RCP2.6 and RCP8.5) as well as the intermediate scenario RCP4.5 to fully cover the range of possible changes in the country’s climate and adopt a multi-scenario and multi-model approach to mitigate uncertainties. The four climate simulations from the EUROCORDEX program [24] used are as follows:
- m1: CCLM4-8-17/CLMcom.ICHEC-EC-EARTH;
- m2: HIRHAM5/DMI.ICHEC-EC-EARTH;
- m3: RACMO22E/KNMI.CNRM-CERFACS-CNRM-CM5;
- m4: REMO2009/MPI-CSC.MPI-M-MPI-ESM-LR.
The primary rationale behind selecting these simulations is their possession of all the required climate parameters for applying the models discussed in the following paragraphs. Furthermore, they originate from the fundamental Global Circulation and Regional Models incorporated within the EUROCRODEX program.
2.2. Methodology for Impact Assessment in the Power Generation Sector
The analysis of climate change’s effects on wind systems was conducted for eight areas with a high installed capacity of wind farms, namely the Southern Peloponnese, Eastern Macedonia—Thrace, Evia, Central Greece, Western Greece, South Aegean, Central Macedonia, and Crete. The impact of climate change on wind power generation was assessed using the methodology described by Tobin et al. [1]. The power generation of the wind farms was calculated using typical power curves for a commercial 3 MW wind turbine with a hub height of 90 m (Figure 2) and wind speed and air temperature data from climate projections for historical (1971–2000) and future (2021–2050) climates. The wind speed of climate projections from 10 m to the hub height was estimated using the Karman–Prandtl equation [25]:
where Wz1 is the wind speed in m/s at the hub height, z1, and Wz2 is the wind speed in m/s at 10 m (z0).
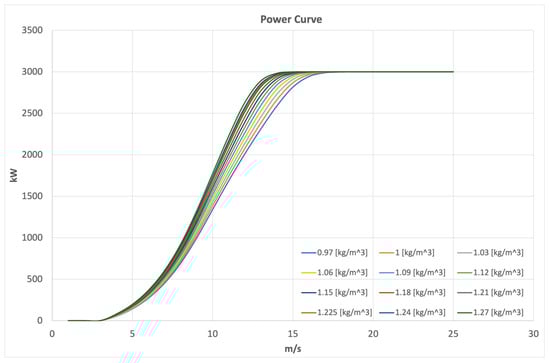
Figure 2.
Power curve of a typical commercial wind turbine (Vestas V90) with a nominal capacity of 3 MW for various values of air density in kg/m3.
The analysis of climate change’s effects on photovoltaic systems (PVs) was conducted for four representative areas (one for each climate zone) with many installed PV stations, namely Crete for Climate Zone A, Attica for Climate Zone B, Central Macedonia for Climate Zone C, and Mountainous Macedonia for Climate Zone D. The main climatic parameters affecting the output of a PV cell are the solar radiation intensity, air temperature, and wind speed, which affect PV cells’ temperature [26,27]. The power generation of a PV is calculated by the following equation [4]:
where the parameters are as follows:
RSDS is the surface downwelling solar radiation [W/m2], RSDSSTC is the surface downwelling solar radiation under standard test conditions [1000 W/m2], and PR is the PV efficiency.
The PV efficiency is linearly dependent on the temperature difference between the PV cells, Tcell, and the standard test conditions’ reference temperature of 25 °C (TSTC), according to the following equation [28]:
where:
The γ coefficient is equal to −0.005/°C [4].
The temperature of the PV cell is calculated through the following equation [29]:
where:
TAS is the air temperature [°C], VWS is the wind speed [m/s], RSDS is the surface downwelling solar radiation [W/m2], c1 = 4.3 °C, c2 = 0.943, c3 = 0.028 °Cm2W−1, and c4 = −1.528 °C sm−1 [29].
The climate data from the four climate simulations of the EUROCORDEX program for historical (1971–2000) and future (2021–2050) climates (air temperature, solar radiation, and wind speed) were utilized to estimate the impact of climate change on PV systems’ efficiency.
Concerning hydropower, within the framework of our present work, the effects of climate change were assessed in five regions (Western Greece, Epirus, West and Central Macedonia, Eastern Macedonia and Thrace, and Peloponnese), where the existing hydropower plants are located, using two different methodological approaches. In the first approach, a theoretical model estimating the hydroelectric potential, GHP [W], in an area, considering surface runoff, water density, and dam height, was used [4]:
where:
Q is the runoff [m3/s], ρ is the density of freshwater [kg/m3], h is the elevation difference [m], and g is the gravitational acceleration [m/s2]. For the runoff, the results of the four climate simulations were used, while a typical dam height of 150 m for dams in Greece was used [30].
In the second approach, a statistical regression model correlating historical values of hydroelectric production per installed MW with prevailing meteorological conditions was developed by using annual historical values of the annual precipitation and annual mean air temperature from the climate simulations and the annual power generation per installed capacity of hydropower stations in Greece for the period 1980–2010. The power generation data were obtained from the Public Power Corporation, which is the owner and operator of hydropower stations in Greece. Here, the approach incorporates the temperature change in the production of hydroelectric power plants per installed MW (Phydro) and the development of a statistical regression model estimating hydroelectric power generation as a function of the annual precipitation and temperature:
where:
P is the annual precipitation in mm, and T is the annual air temperature in °C. The R2 coefficient of the model is not particularly high (0.49), as one might anticipate, given the inherent challenge of accurately capturing hydrological balances within a river basin through statistical models. Nevertheless, the model demonstrates a commendable level of accuracy in approximating the production of hydroelectric power in Greece over a 30-year period, which is necessary when comparing historical and future climate data.
Regarding thermal power stations, an increase in air temperature reduces the air density and, consequently, the mass flow in the gas turbine of combined cycle units, resulting in an efficiency decrease. Additionally, increased temperatures hamper the operation of the cooling towers of thermal power plants, ultimately reducing their efficiency. Within the scope of this study, the power generation output of thermal power stations was estimated using the equations of Koch and Vögele [2] modified by van Vliet [31], simulating the usable power plant capacity, Pthermo [MW], based on the cooling demand, q [m3/s]. The initial step involves determining the cooling demand, q [m3/s], of a power plant based on the installed capacity (KW), its efficiency (ƞtotal, ƞelec), and parameters related to the cooling system (share, α, of waste heat not discharged by cooling water, share, β, of waste heat released into the air, correction factor, ω, accounting for the effects of changes in the air temperature and humidity, and densification factor, EZ, accounting for the replacement of water in cooling towers to avoid high salinity levels) in combination with water temperature limitations (Tlmax, ΔTlmax) and the daily water temperature (Tw) [2,31]:
Then, the maximum usable capacity, Pthermo, is calculated based on the cooling demand, q, cooling water streamflow, Q, and water temperature, Tw, in combination with parameters describing the maximum fraction of streamflow to be withdrawn for cooling (γ), water temperature limitations (Tlmax, ΔTlmax), and parameters related to the cooling system (α, β, ω, EZ) [2,32]:
The temperature of the cooling water, Tw, sourced from surface stream water, is directly influenced by the ambient air temperature. According to the international literature [32], a correlation exists wherein the water temperature increases by 0.6 °C to 1.0 °C for every 1 °C rise in the average air temperature. In our analysis, an increase of 0.8 °C in the stream water temperature per 1 °C increase in air temperature was used. The increase in air temperature was obtained from the four EUROCORDEX climate simulations, while the daily cooling water flow was assumed to be unaffected by climate change. For the rest of the parameters (fossil-fuel thermal power plants’ installed capacity and efficiency, cooling system parameters, and water limitations), typical values from Greek fossil fuel thermal power plants and values from the literature [31] were used. Based on the change in the average temperature of the cooling water, the change in the usable power capacity of the thermal units was calculated from the above equations while keeping all those parameters constant. Calculations were carried out in five regions where fossil fuel thermal power plants are currently located, namely Western Macedonia, Central Macedonia, Thrace, Central Greece, and Crete.
2.3. Methodology for Impact Assessment the Energy Demand Sector
The effects of climate change on the final energy demand of the residential sector in Greece were examined through a bottom–up engineering model that allows for a detailed simulation of the evolution of the building stock in the country, its thermal characteristics, the equipment used to cover specific energy uses that are affected by meteorological/climatic conditions, and the energy behavior of users. Such an approach offers greater transparency in the applied computational process and allows for the investigation of the vulnerability of the energy system to climate change in different policy scenarios. The analysis is carried out on a yearly basis throughout the period 2011–2050.
The model developed and used in the context of this analysis consists of the following:
- A module analyzing the building stock, which estimates the evolution of the number of dwellings in the country from 2011 to 2050 and their distribution by energy class. The analysis of the building stock was carried out yearly, considering population growth forecasts as well as assumptions related to the evolution of the average size of households and the degree of renewal of the building stock (demolition of old buildings and construction of new buildings).
- A theoretical energy demand module, through which the total energy requirements of the sector are estimated, further disaggregated into four main energy uses, namely space heating, air conditioning, hot water production, and other electrical uses (lighting, devices, etc.). This analysis is based on the evolution of the number of dwellings per energy class and statistical data on the energy performance of dwellings per energy class, published periodically by the Greek Ministry of Energy and Environment.
- A final energy demand module, through which the final energy consumption of the sector of households is calculated annually, based on the theoretical energy requirements calculated previously, the technologies and energy sources used, and various behavioral parameters such as the number of hours during the year that the various types of appliances are used, etc. The behavioral parameters presented by the JRC-IDEES [33] database for disaggregating energy consumption in the Greek residential sector were, in most cases, the starting point of our analysis. For the historical years of the examined period for which energy balances had been published (i.e., 2011–2019) by Eurostat, the results of the model were compared with the data of the energy balances, and appropriate adjustments were made, including the incorporation of appropriate correction factors, to capture specific patterns in energy behaviors. Based on these final arrangements, a forecast of energy consumption for the time period up to 2050 was carried out.
The key drivers of the evolution of the final energy demand in the analysis carried out were the population, the average size of households, the composition of the building stock in relation to the energy classes of the dwellings, the technologies used, and possible rebound effects, particularly in regard to space heating and air conditioning.
For the assessment of climate change impacts on the final energy demand of the Greek residential sector, we used the outcomes of the same climate scenarios and models used for assessing the impacts of climate change on energy supply technologies. In all scenarios and simulations, the key climate parameter included in the analysis is the mean daily temperature. Based on this parameter, the heating degree days (HDDs) and cooling degree days (CDDs) are calculated daily for historical and future climates and for all the considered scenarios. Specifically, the HDDs and CDDs were calculated on the basis of the Eurostat approach (https://ec.europa.eu/eurostat/cache/metadata/en/nrg_chdd_esms.htm, accessed on 1 April 2023), as follows:
- The HDDs are calculated only for days with a mean temperature, Tm, less than or equal to 15 °C. In this case, the HDD of day i is calculated as the difference between the reference temperature for heating (taken as equal to 18 °C) and the mean temperature of day i. If the mean temperature of a day is greater than 15 °C, the HDD of this day is taken as 0.
- The CDDs are calculated only for days with a mean temperature, Tm, greater than or equal to 24 °C. In this case, the CDD of day i is calculated as the difference between the mean temperature of day i and the reference temperature for cooling (taken as equal to 21 °C). If the mean temperature of a day is lower than 24 °C, the CDD of this day is taken as 0.
The monthly and annual heating and cooling degree days are calculated as the sum of the corresponding daily values.
The impacts of climate change on the final energy demand of the Greek residential sector were estimated based on the following considerations and assumptions:
- Climate change does not affect the final energy demand for water heating and electrical appliances/lighting.
- The change in the final energy demand for space heating is proportional to the percentage change in heating degree days between future and historical climates.
- The change in the final energy demand for cooling is proportional to the percentage change in cooling degree days between future and historical climates.
- The increase in temperature in the summer period due to climate change does not trigger further increased use of air-conditioning systems beyond that already incorporated in the model developed because of improvements in the standard of living.
As already mentioned previously, one of the key factors influencing theoretical and final energy demand in the residential sector and the possible impacts of climate change is the energy performance of the building stock. In the context of CLIMPACT, the bottom–up energy model developed was used to produce detailed energy balances for four different scenarios regarding the energy performance of the Greek building stock and the associated equipment up to 2050. Specifically, the scenarios developed are described as follows:
- A reference scenario, which expands the current practices and trends regarding the evolution of the building stock and the equipment utilized up to 2050.
- A shallow renovation scenario, which adopts the energy renovation of 60,000 homes on an annual basis by 2050, ensuring improvements in their performance by three energy classes.
- A deep renovation scenario, according to which all dwellings with an EPC between G and C will be upgraded to B+ gradually by 2050.
- A full electricity scenario, where all dwellings with an EPC between G and C will be gradually upgraded to B+ by 2050, and at the same time, heat pumps will be used to cover 100% of the space heating and cooling needs in the sector.
All these scenarios share common assumptions regarding efficiency improvements in the technologies used.
3. Results
3.1. Climate Change Impacts on Power Generation
3.1.1. Impacts on Wind Farms’ Productivity
The results for the period 2021–2050 and for the three examined RCP scenarios are presented in Figure 3, and they are similar to the findings of other studies for Greece (e.g., [4]). In all three RCP scenarios, the annual capacity factor is expected to change between −4.0% and +4.0% compared to the reference period 1971–2000, with the exception of the climate simulation m1 (models CCLM4-8-17/CLMcom-ICHEC-EC-EARTH), which estimate an 8–10% increase in some areas of the mainland country (Central Greece, Central and Eastern Macedonia—Thrace) for scenario RCP2.6.
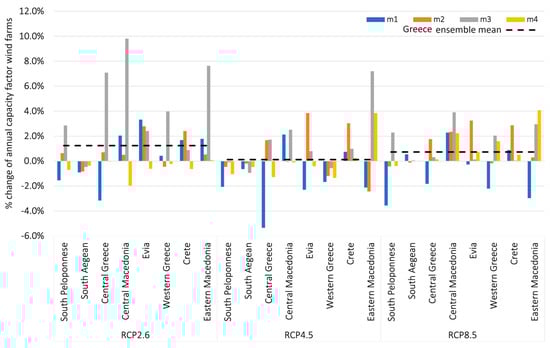
Figure 3.
Average change in the annual capacity factor of the wind farms in 2021–2050 compared to the reference period, 1971–2000, based on the results of 4 climate simulations in 8 representative regions of Greece under the examined RCP scenarios. The horizontal lines show the ensemble value of the change for all the areas of interest in the country. Climate model simulations: m1: CCLM4-8-17/CLMcom.ICHEC-EC-EARTH, m2: HIRHAM5/DMI.ICHEC-EC-EARTH, m3: RACMO22E/KNMI.CNRM-CERFACS-CNRM-CM5, and m4: REMO2009/MPI-CSC.MPI-M-MPI-ESM-LR.
Under the intermediate scenario RCP4.5 in Western Greece, the Southern Peloponnese, and Southern Aegean, a reduction in wind power generation up to 2% is expected, while in Crete, a 2% increase under all four climate simulations is expected. In the rest of the regions, the results are mixed, with the largest changes (varying from −2% to 6%) projected in Eastern Macedonia—Thrace.
In scenario RCP8.5, in most areas, the climate simulations predict increases in the power generation of wind farms, except for the simulations with the climate models HIRHAM5/DMI.ICHEC-EC-EARTH (m2), according to which reductions are expected in the Southern Peloponnese, Central and Western Greece, and Eastern Macedonia—Thrace.
The differences in the power generation of wind farms are mainly connected to the fluctuations in the changes in wind speed that are observed between the results of the climatic simulations in each geographical area. On the contrary, the effect of an increase in temperature is lower, and it is generally more uniform between the climate simulations in each region. Considering the average of the climatic simulations per region, the changes in the productivity of the wind systems in future climates are small and range between −1 and 2%.
3.1.2. Impacts on Photovoltaics’ Productivity
The results of the four climatic simulations show that the estimated change in the output of the PV stations does not exceed, in any case, ±2.5%, showing a difference between the climatic simulations but geographical uniformity (Figure 4).
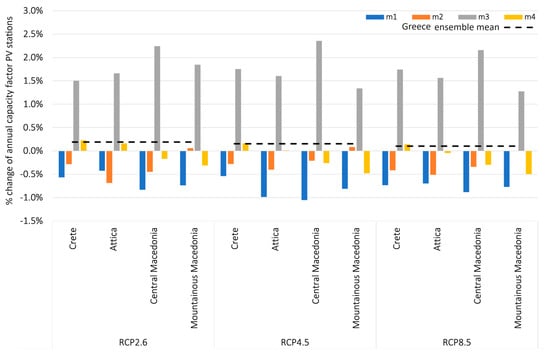
Figure 4.
Average change in the annual capacity factor of the PV stations in 2021–2050 compared to the reference period, 1971–2000, based on the results of 4 climate simulations in 4 representative regions of Greece under the examined RCP scenarios. The horizontal lines show the average value of the change for all the areas of interest in the country under each RCP scenario. Climate model simulations: m1: CCLM4-8-17/CLMcom.ICHEC-EC-EARTH, m2: HIRHAM5/DMI.ICHEC-EC-EARTH, m3: RACMO22E/KNMI.CNRM-CERFACS-CNRM-CM5, and m4: REMO2009/MPI-CSC.MPI-M-MPI-ESM-LR.
More specifically, according to the results for the climatic simulations with the models CCLM4-8-17/CLMcom.ICHEC-EC-EARTH (m1), in all three RCP scenarios, an increase in the power generated is expected in all regions, ranging between 1.5% and 2.5%. On the contrary, according to the HIRHAM5/DMI.ICHEC-EC-EARTH (m2) models, a reduction in the PV power generation of between 0.5 and 1.0% is expected, while the other two simulations (m3 and m4) project both an increase and a reduction depending on the region and the examined climate scenario. However, the projected changes do not exceed ±0.5% in any case.
The solar radiation intensity directly impacts the amount of energy absorbed and converted into electricity. Conversely, higher temperatures can lead to diminished efficiency, while increased wind speed promotes convective heat transfer, aiding in dissipating excess heat and maintaining the optimal operating conditions for PV modules. The results suggest that the projected changes in PV power generation are modest, attributed primarily to the small variations in solar radiation (less than ±5%) and then to the compensatory effects of air temperature and wind speed.
3.1.3. Impacts on Hydropower Potential
Based on the results of the first impact assessment approach (i.e., theoretical models for estimating hydroelectric potential in an area which take into account surface runoff, water density, and dam height), the estimated reduction in hydroelectric potential in Greece is significant, with a large variation within the models under each scenario (Figure 5), while in some cases, there is even a difference in the sign of the changes between the models for the same area. The wide range of results and the difference in the sign of the change demonstrate the uncertainty that exists in estimates of precipitation and runoff changes in climate models. More specifically, changes between future and historical climates range between the following:
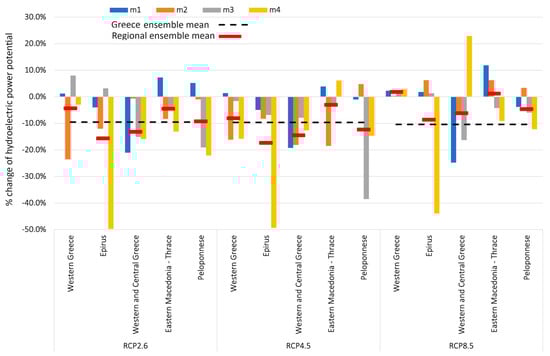
Figure 5.
Change in the potential of hydroelectric power during the period 2021–2050 in 5 regions compared to the reference period, 1971–2000, according to the surface runoff of four climate simulations under the 3 examined RCP scenarios. The horizontal red lines show the regional average based on the ensemble of the results of the four climate simulations. The horizontal black dashed lines show the weighted average value of the reduction in the potential in the country for each climate scenario. Climate model simulations: m1: CCLM4-8-17/CLMcom.ICHEC-EC-EARTH, m2: HIRHAM5/DMI.ICHEC-EC-EARTH, m3: RACMO22E/KNMI.CNRM-CERFACS-CNRM-CM5, and m4: REMO2009/MPI-CSC.MPI-M-MPI-ESM-LR.
- −44.0% and +22.9% in the case of the RCP8.5 scenario;
- −49.0% and +11.9% in the case of the RCP4.5 scenario;
- −49.7 and +8.0% in the case of the RCP2.6 scenario.
The above fluctuations are smoothed when the average of the four climate simulations in each region is calculated. According to these ensemble results, reductions of 2–4% are expected in Western Greece, reductions of 15–16% in Epirus and West and Central Macedonia, and reductions of 5–10% in the Peloponnese and Eastern Macedonia and Thrace.
According to the second impact assessment approach (i.e., statistical regression models which correlate historical values of hydroelectric production per installed MW with the prevailing meteorological conditions), the power generated by hydroelectric stations in Greece is expected to decrease by up to 40–45% during 2021–2050 compared to the reference period, 1971–2000, while increases are observed in a few cases (Figure 6). The largest reductions in hydroelectric power generation according to the results of the average of the four climate simulations (ensemble) are expected in the Peloponnese (~20%), Epirus, and Western and Central Macedonia (10–15%), while smaller ones (5–10%) are expected in Western Greece and Eastern Macedonia and Thrace. The estimated reduction with the second methodological approach is greater than those estimated based only on changes in runoff in the Peloponnese and Western Greece, while in the other areas, it is similar or slightly increased, especially in the RCP8.5 scenario.
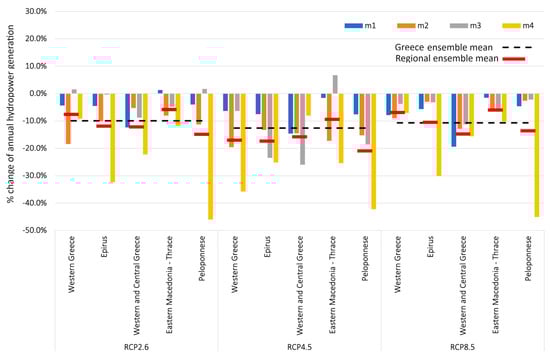
Figure 6.
Percentage change in hydropower generation during 2021–2050 compared to the reference period, 1971–2000, in Greece based on statistical regression models and the results of four climate simulations in five geographical regions under the three RCP scenarios. The horizontal red lines show the changes in hydropower generation based on the ensemble of the results of the four climate simulations. The horizontal black dashed lines show the weighted average value reduction in hydroelectric production in the country for each climate scenario. Climate model simulations: m1: CCLM4-8-17/CLMcom.ICHEC-EC-EARTH, m2: HIRHAM5/DMI.ICHEC-EC-EARTH, m3: RACMO22E/KNMI.CNRM-CERFACS-CNRM-CM5, and m4: REMO2009/MPI-CSC.MPI-M-MPI-ESM-LR.
3.1.4. Impacts on Thermal Power Plants
Regarding conventional thermal power plants, a decrease in efficiency is expected due to the increase in air temperature and cooling water temperature in the future climate of the period 2021–2050 under the three climate scenarios examined for all climate simulations performed and for all regions (Figure 7). The reductions are higher (7–11%) under the worst-case scenario, RCP8.5, and lower under the RCP2.6 scenario (4–9%), while they do not exhibit significant geographical variation.
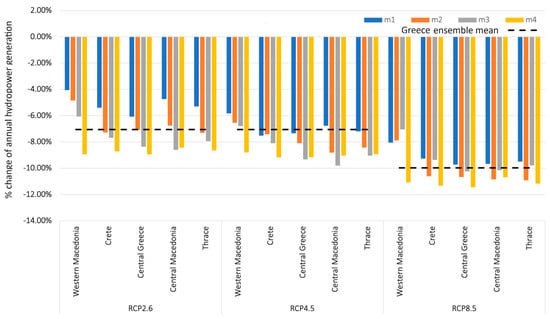
Figure 7.
Percentage change in the average annual efficiency of thermal power plants in 2021–2050 compared to the historical climate of 1971–2000 based on the results of four climate simulations in five geographical areas under the three examined RCP scenarios. Climate model simulations: m1: CCLM4-8-17/CLMcom.ICHEC-EC-EARTH, m2: HIRHAM5/DMI.ICHEC-EC-EARTH, m3: RACMO22E/KNMI.CNRM-CERFACS-CNRM-CM5, and m4: REMO2009/MPI-CSC.MPI-M-MPI-ESM-LR.
3.2. Climate Change Impacts on Energy Demand
Figure 8 presents the calculated energy consumption per energy carrier in the Greek residential sector forecasted by 2030 and 2050, respectively, under the current climate, based on the scenarios defined for the energy performance of buildings as well as the electrification of the sector (Section 2.3). Figure 9 presents an overview of the evolution of energy consumption in the Greek residential sector in the period 2017–2050, as well as the effect of the main mitigation actions under consideration for the decarbonization of the sector. Obviously, the latter is feasible to the extent that the electricity used for the remaining energy needs of the sector will be generated by RES technologies.
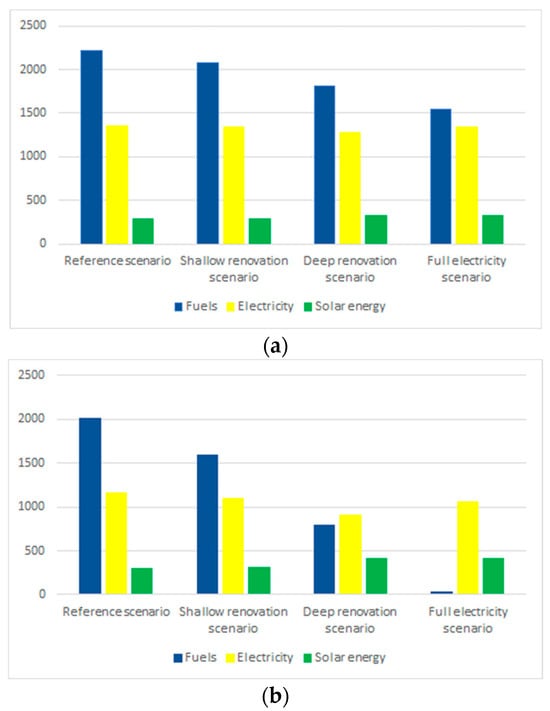
Figure 8.
Estimated energy consumption by energy carrier in the Greek residential sector in 2030 (a) and 2050 (b) based on the examined scenarios (in ktoe).
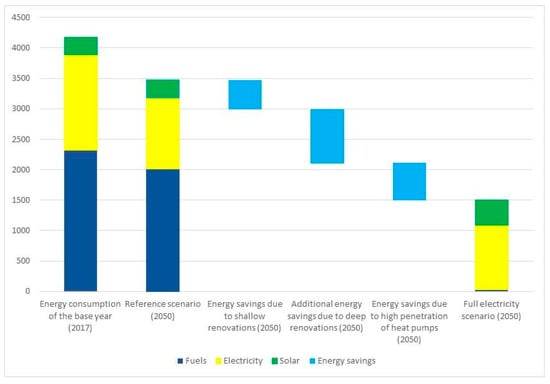
Figure 9.
Evolution of energy consumption in the Greek residential sector during the period 2017–2050 based on the examined scenarios (in ktoe).
As already mentioned, climate change, mainly through increasing temperatures, is expected to affect energy demand (theoretical and final) in the sector. In the context of the present analysis, it is considered that climate change will affect only the energy demand for cooling and heating. In Figure 10 and Figure 11, the average annual number of days with increased demand for heating and cooling, respectively, for the reference period, 1971–2000, as well as for two future periods, 2021–2050 and 2071–2100, under three future scenarios (RCP2.6, RCP4.5, and RCP8.5), is shown. Based on these figures, it appears that the future climate will be characterized by the following:
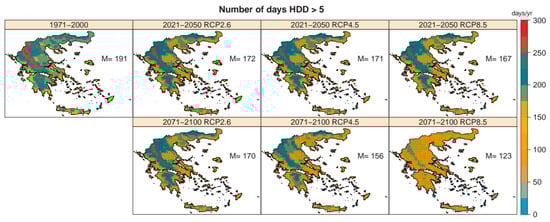
Figure 10.
The average annual number of days with increased demand for heating (heating degree days (HDDs) > 5) for all simulations. In each panel, M denotes the spatial average over all the grid points covering the area under study, with the units being the same as in the color bar. Black dots indicate a robust change (future period and scenario minus the reference one) on the grid point scale.
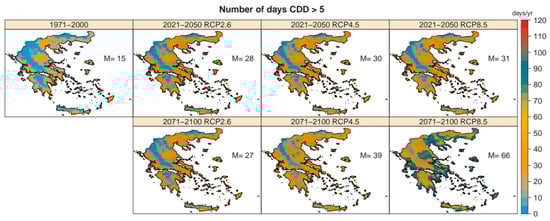
Figure 11.
Similar to Figure 10, but for the average annual number of days with increased demand for cooling (cooling degree days (CDDs) > 5).
- A reduced demand for heating (averaged over all land grid points) by about 10–12% for the period 2021–2050 under all RCPs, while for the period 2071–2100, the reductions range from about 10% under RCP2.6 to 35% for the RCP8.5 scenario;
- Significantly higher increases in the number of days with increased demand for cooling are simulated by the climate models for both future periods and under all scenarios. For the near-future period, 2021–2020, the number of days almost doubles in all three scenarios (relative increase: 80–100%), with the future projections indicating about a month with increased cooling demand. For the distant future period, the increase ranges from about 80% under RCP2.6 to 160% for RCP4.5, while the maximum increase, around 340%, is projected under the extreme scenario, RCP8.5.
It should be noted that for both energy indicators, the highest changes are simulated in coastal areas as well as in areas with a relatively low altitude, while the difference between the future simulations and the reference one was found to be robust over all the areas under consideration.
To estimate the effects of climate change on energy consumption, it was assumed that the percentage change in the heating degree days due to climate change causes a corresponding change in the energy demand for heating, and similarly, the percentage change in the cooling degree days causes a corresponding change in the energy demand for cooling. The results of the four scenarios developed regarding future energy consumption (2050) in the Greek residential sector are presented in Figure 12 and Figure 13.
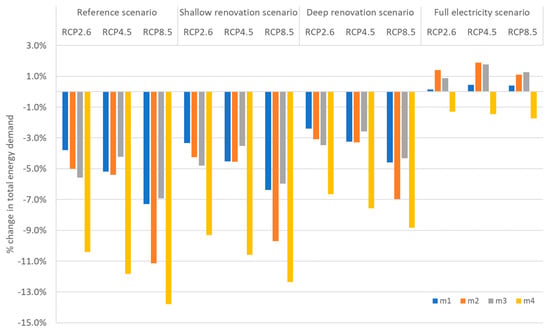
Figure 12.
Percentage change in total energy demand of the Greek residential sector in 2050 due to climate change for all measure scenarios, climate scenarios, and climate model simulations considered. Climate model simulations: m1: CCLM4-8-17/CLMcom.ICHEC-EC-EARTH, m2: HIRHAM5/DMI.ICHEC-EC-EARTH, m3: RACMO22E/KNMI.CNRM-CERFACS-CNRM-CM5, and m4: REMO2009/MPI-CSC.MPI-M-MPI-ESM-LR.
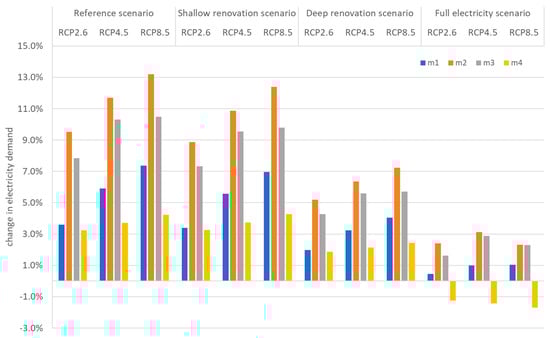
Figure 13.
Percentage change in electricity demand of the Greek residential sector in 2050 due to climate change for all measure scenarios, climate scenarios, and climate model simulations considered. Climate model simulations: m1: CCLM4-8-17/CLMcom.ICHEC-EC-EARTH, m2: HIRHAM5/DMI.ICHEC-EC-EARTH, m3: RACMO22E/KNMI.CNRM-CERFACS-CNRM-CM5, and m4: REMO2009/MPI-CSC.MPI-M-MPI-ESM-LR.
In the reference scenario (2050), climate change is estimated to cause a reduction in the overall energy consumption by 4–10% in the RCP2.6 scenario, 4–12% in the RCP4.5 scenario, and 7–14% in the RCP8.5 scenario, but also an increase in electricity consumption by 3–10% in the RCP2.6 scenario, 4–12% in the RCP4.5 scenario, and 4–13% in the RCP8.5 scenario. The increase in electricity consumption is expected to range from 38 to 153 ktoe (442–1780 GWh) per year in 2050, depending on the climate scenario and the climate model used.
In the shallow renovation scenario (2050), climate change is expected to result in a reduction in the total energy consumption by 3–9% in the RCP2.6 scenario, 4–11% in the RCP4.5 scenario, and 6–12% in the RCP8.5 scenario. However, electricity consumption is expected to increase by 3-9% in the RCP2.6 scenario, 4–11% in the RCP4.5 scenario, and 4–12% in the RCP8.5 scenario.
In the deep renovation scenario (2050), climate change is expected to lead to a reduction in the total energy consumption by 2–7% in the RCP2.6 scenario, 3–8% in the RCP4.5 scenario, and 4–9% in the RCP8.5scenario. Again, the electricity consumption is expected to increase by 2–5% in the RCP2.6 scenario, 2–6% in the RCP4.5 scenario, and 2–7% in the RCP8.6 scenario. However, in absolute terms, the increase in electricity consumption is in the range of 19–57 ktoe/year, reduced by more than 50% compared to the reference and shallow renovation scenarios presented above. The reduction in fuel consumption is in the range of 100–181 ktoe/year, significantly lower than in the reference and shallow renovation scenarios.
Finally, in the full electricity scenario, climate change is not expected to significantly affect either the total energy consumption or the electricity consumption. Given that in this scenario all thermal energy end-uses are covered by electricity, the increased cooling requirements are outweighed by the reduction in the demand for space heating without any significant impact on the power generation system, at least on an annual basis. In absolute terms, the effect of climate change on the total electricity consumption in 2050 is expected to range from −18 to 33 ktoe/year (384 GWh at a maximum), depending on the climate scenario and the climate model used. However, the expected profile of electricity demand within this year can be significantly differentiated by increasing the summer peaks and decreasing the demand during the winter period.
Finally, Figure 14 presents in absolute terms the change in electricity demand expected in 2050 for all energy and climate scenarios analyzed in the context of this work.
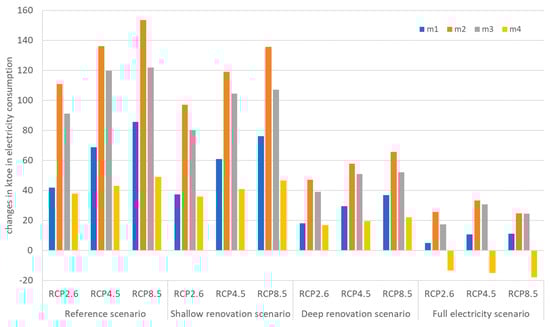
Figure 14.
Changes in electricity consumption due to climate change in the Greek residential sector in 2050 for all measure scenarios, climate scenarios, and climate model simulations considered (in ktoe). Climate model simulations: m1: CCLM4-8-17/CLMcom.ICHEC-EC-EARTH, m2: HIRHAM5/DMI.ICHEC-EC-EARTH, m3: RACMO22E/KNMI.CNRM-CERFACS-CNRM-CM5, and m4: REMO2009/MPI-CSC.MPI-M-MPI-ESM-LR.
4. Discussion and Conclusions
In Greece, with respect to energy supply, and especially regarding electricity generation, climate change is expected to mainly affect electricity generation from hydroelectric and thermal power plants. Specifically, our results show that under the climate change scenarios examined in this study, the impact of climate change on hydropower plants will be negative for the period up to 2050, a finding which agrees with those in other recent research for Southern Europe [34].
The range of impacts on hydropotential and electricity generation depends on the geographical location of the power plants and shows significant uncertainty due to the corresponding uncertainty in climate models’ estimates regarding precipitation and runoff changes, which also show significant geographical variations. On average, the expected reduction amounts to 15–20% compared to the historical climate. The implications for the security of electricity supply can be quite important, as hydroelectric units mainly cover peak loads in the Greek power system, while pumped hydropower systems are already utilized for energy storage to facilitate the installation of additional photovoltaic and wind units.
The impact of climate change on the efficiency of thermal power plants is also negative, though smaller than that of hydroelectric power plants. The estimated impacts show smaller geographical variations and less uncertainty compared to those for hydroelectric power plants, as the effects are related to temperature increases. The changes appear to be more pronounced for the RCP4.5 and RCP8.5 scenarios, in which climate change is more intense, and smaller for the milder RCP2.6 scenario. According to the average of the climate simulations (the ensemble of the models), the expected reductions range from 6% to 11%. As the role of fossil fuel power plants in the Greek power system is gradually reduced due to decarbonization policies, the economic magnitude of the estimated impacts is expected to be rather limited in the future.
The impacts on solar and wind energy potential are significantly smaller compared to those of hydroelectric and thermal power plants. Specifically, the expected changes in the wind energy potential in future climates range from −1% to 2% (average of the climate simulations) but present significant geographical variation, and there are differences between the climate models considered. On the contrary, the impact of climate change on the efficiency of PV stations is expected to be small (either positive or negative, depending on the climate simulation), with very small differences between the four climatic zones of Greece. As photovoltaics and wind installations are among the key technologies adopted by the Greek Government [35] for achieving the net zero target in 2050, it is encouraging that climate change was found to not be expected to substantially affect the productivity of these technologies.
With respect to energy demand, climate change is expected to affect energy consumption in the residential sector, but the expected range of effects depends on both the implementation and the characteristics (deep vs. shallow renovation) of measures for upgrading the thermal performance of the building stock and the intensity of climate change. In general, the scenarios examined show that the total energy demand in the sector is expected to be reduced, while the electricity demand will increase. In 2050, the reduction in the total energy demand may reach 14% compared to the demand that occurred under the historical climate, while the increase in electricity demand may reach 13%. These findings agree with those of relevant research [36,37]. We also found that there are significant differences in the total energy and electricity demand expected between the climate scenarios considered.
These changes (percentage increase or decrease in fuel and electricity demand) appear to be more pronounced for the RCP4.5 and RCP8.5 scenarios, in which climate change is more intense, and smaller for the RCP2.6 scenario, which puts emphasis on climate change mitigation. In addition, the higher the ambition for deep energy renovations in the building stock, the lower the expected changes. In particular, the electrification of the energy demand in the residential sector, when combined with the energy renovation of the existing building stock (deep retrofit), results in almost zero changes expected in fuel and electricity consumption. However, fluctuations in the monthly or daily profile of electricity demand could be significant. It seems that in mid-latitude countries like Greece, where space heating is the main energy use in residential buildings, potential energy savings attributable to a warmer climate will be minimized under ambitious scenarios of building renovations. However, it should be noted that the main driver for renovating the existing building stock in these countries is the need for decarbonizing the residential sector, while a warmer climate could contribute to reducing energy demand and the associated GHG emissions by only up to 14%.
The methodological approach presented here offers a straightforward methodology, utilizing simple models and readily available data to estimate the impacts of climate change on both the demand and supply sides of the energy sector in Greece. With appropriate adjustments, this framework could be readily applied to other European countries, providing valuable insights for policymakers and researchers involved in adaptation policies and long-term energy planning.
Future research is needed to include in the residential building analysis household income and building stock distributions across regions and how these parameters affect choices and behavior, as well as the effectiveness of climate policies [38]. For example, differences in building characteristics across regions could potentially influence the efficacy of energy-saving measures, and this should be considered in future analyses for a more comprehensive understanding of energy consumption patterns and climate change impacts.
In addition, this analysis should be extended to other final demand sectors (e.g., non-residential buildings, industry, transport, etc.) and the impacts on energy transmission and distribution networks.
It should also be noted that while the utilized spatial resolution of climate data, namely 0.11° × 0.11°, is the highest available from the EUROCORDEX program, it may not fully capture localized meteorological phenomena. For example, complex meteorological patterns around mountainous regions or coastal areas, which significantly affect wind energy production and precipitation patterns, may not be accurately represented at this resolution. Similarly, the urban heat island effect, prevalent in densely populated urban areas, can lead to higher temperatures compared to surrounding rural areas, impacting both energy demand and heat-related stress on power generation infrastructure. Features such as microclimates, sea breeze effects, and convective thunderstorms may also be inadequately resolved, potentially affecting our understanding of climate impacts on power generation. Additionally, the daily temporal resolution may not capture the dynamic nature of wind distribution, which is crucial for assessing wind energy potential. Future research using higher temporal and spatial resolution datasets would help address these concerns, and therefore the development of climate models providing such resolution is of the utmost importance for reliable impact assessment studies on energy resources [39].
Regarding hydropower stations, our study uses simple models that provide useful results, particularly in offering a broad overview of potential impacts. However, a more detailed modeling approach incorporating advanced hydrological models and several climatic and hydrogeological parameters at the installation level, e.g., [40,41], would likely offer a more comprehensive understanding of the specific impacts of climate change on hydropower generation.
Finally, as also highlighted by other research [34,42], projections of renewable energy generation are inevitably affected by the uncertainty caused by climate models, which may create significant differences in the sign and magnitude of predicted climate change impacts on renewable energy resources at a local level. Although we have utilized data from different climate simulations to handle this uncertainty and assess its implications, our findings are inevitably limited by the selection of these specific simulations.
Author Contributions
Conceptualization, E.G. and S.M.; data curation, N.G., C.G., and K.V.V.; formal analysis, N.G.; funding acquisition, S.M.; investigation, N.G.; methodology, S.M., E.G., and Y.S.; project administration, S.M.; software, Y.S.; supervision, S.M.; validation, E.G.; visualization, Y.S.; writing—original draft, S.M. and N.G.; writing—review and editing, E.G. and S.M. All authors have read and agreed to the published version of the manuscript.
Funding
This research was funded by the research program CLIMPACT (2018SE01300001) (‘National network for climate change’) carried out by the Institute for Environmental Research and Sustainable Development (IERSD) of the National Observatory of Athens (NOA), Greece.
Institutional Review Board Statement
Not applicable.
Informed Consent Statement
Not applicable.
Data Availability Statement
Data are contained within the article. Specifically, this study used publicly available climate data from the EURO-CORDEX program (https://doi.org/10.1007/s10113-013-0499-2) (accessed on 1 April 2023), which are available for free download at the Federated ESGF-CoG Nodes (https://esgf.llnl.gov/nodes.html) (accessed on 1 April 2023). The data for modelling the building sector derive from the article of Mantzos et al., 2018 (https://doi.org/10.2905/JRC-10110-10001) (accessed on 1 April 2023).
Conflicts of Interest
Nikos Gakis is an employee of the company FACE3TS S.A. The paper reflects the views of the scientists and not the company.
References
- Tobin, Ι.; Jerez, S.; Vautard, R.; Thais, F.; van Meijgaard, E.; Prein, A.; Déqué, M.; Kotlarski, S.; Maule, C.F.; Nikulin, G.; et al. Climate change impacts on the power generation potential of a European mid-century wind farms scenario. Environ. Res. Lett. 2016, 11, 034013. [Google Scholar] [CrossRef]
- Koch, H.; Vögele, S. Dynamic modelling of water demand, water availability and adaptation strategies for power plants to global change. Ecol. Econ. 2009, 68, 2031–2039. [Google Scholar] [CrossRef]
- Ali, E.; Cramer, W.; Carnicer, J.; Georgopoulou, E.; Hilmi, N.J.M.; Le Cozannet, G.; Lionello, P. Cross-Chapter Paper 4: Mediterranean Region. In Climate Change 2022: Impacts, Adaptation and Vulnerability. Contribution of Working Group II to the Sixth Assessment Report of the Intergovernmental Panel on Climate Change; Pörtner, H.-O., Roberts, D.C., Tignor, M., Poloczanska, E.S., Mintenbeck, K., Alegría, A., Craig, M., Langsdorf, S., Löschke, S., Möller, V., et al., Eds.; Cambridge University Press: Cambridge, UK; New York, NY, USA, 2022; pp. 2233–2272. [Google Scholar] [CrossRef]
- Tobin, I.; Greuell, W.; Jerez, S.; Ludwig, F.; Vautard, R.; van Vliet, M.T.H.; Bréon, F.-M. Vulnerabilities and resilience of European power generation to 1.5 °C, 2 °C and 3 °C warming. Environ. Res. Lett. 2018, 13, 044024. [Google Scholar] [CrossRef]
- Baltas, E.A.; Karaliolidou, M.C. Land use and climate change impacts on the reliability of hydroelectric energy production. Strateg. Plan. Energy Environ. 2010, 29, 56–73. [Google Scholar] [CrossRef]
- Skoulikaris, C. Run-of-river small hydroelectric plants as hydro-resilience assets against climate change. Sustainability 2021, 13, 14001. [Google Scholar] [CrossRef]
- Kaldellis, J.K.; Kapsali, M.; Kavadias, K.A. Temperature and wind speed impact on the efficiency of PV installations. Experience obtained from outdoor measurements in Greece. Renew. Energy 2014, 66, 612–624. [Google Scholar] [CrossRef]
- Müller, J.; Folini, D.; Wild, M.; Pfenninger, S. CMIP-5 models project photovoltaics are a no-regrets investment in Europe irrespective of climate change. Energy 2019, 171, 135–148. [Google Scholar] [CrossRef]
- Panagea, I.S.; Tsanis, I.K.; Koutroulis, A.G.; Grillakis, M.G. Climate change impact on photovoltaic energy output: The case of Greece. Adv. Meteorol. 2014, 2014, 264506. [Google Scholar] [CrossRef]
- Koletsis, I.; Kotroni, V.; Lagouvardos, K.; Soukissian, T. Assessment of offshore wind speed and power potential over the Mediterranean and the Black Seas under future climate changes. Renew. Sustain. Energy Rev. 2016, 60, 234–245. [Google Scholar] [CrossRef]
- Moemken, J.; Reyers, M.; Feldmann, H.; Pinto, J.G. Future changes of wind speed and wind energy potentials in EURO-CORDEX ensemble simulations. J. Geophys. Res. Atmos. 2018, 123, 6373–6389. [Google Scholar] [CrossRef]
- Carvalho, D.; Rocha, A.; Gomez-Gesteira, M.; Silva Santos, C. Potential impacts of climate change on European wind energy resource under the CMIP5 future climate projections. Renew. Energy 2017, 101, 29–40. [Google Scholar] [CrossRef]
- Katopodis, T.; Vlachogiannis, D.; Politi, N.; Gounaris, N.; Karozis, S.; Sfetsos, A. Assessment of climate change impacts on wind resource characteristics and wind energy potential in Greece. J. Renew. Sustain. Energy 2019, 11, 066502. [Google Scholar] [CrossRef]
- Auffhammer, M.; Mansur, E.T. Measuring climatic impacts on energy consumption: A review of the empirical literature. Energy Econ. 2014, 46, 522–530. [Google Scholar] [CrossRef]
- Schaeffer, R.; Szklo, A.S.; de Lucena, A.F.P.; Borba, B.S.M.C.; Nogueira, L.P.P.; Fleming, F.P.; Troccoli, A.; Harrison, M.; Boulahya, S.M. Energy sector vulnerability to climate change: A review. Energy 2012, 38, 1–12. [Google Scholar] [CrossRef]
- Howell, M.; Rogner, H.H. Water-energy nexus: Assessing integrated systems. Nat. Clim. Chang. 2014, 4, 246–247. [Google Scholar] [CrossRef]
- Wilbanks, T.; Fernandez, S.; Backus, G.; Garcia, P.; Jonietz, K.; Kirshen, P.; Savonis, M.; Solecki, B.; Toole, L. Climate Change and Infrastructure, Urban Systems, and Vulnerabilities; Technical Report to the U.S. Department of Energy in Support of the National Climate Assessment, Oak Ridge National Laboratory; U.S. Department of Energy, Office of Science: Oak Ridge, TN, USA, 2012; p. 119. Available online: http://www.esd.ornl.gov/eess/Infrastructure.pdf (accessed on 1 April 2023).
- Eskeland, G.S.; Mideska, T.K. Electricity demand in a changing climate. Mitig. Adapt. Strateg. Glob. Chang. 2010, 15, 877–897. [Google Scholar] [CrossRef]
- Castaño-Rosa, R.; Barrella, R.; Sánchez-Guevara, C.; Barbosa, R.; Kyprianou, I.; Paschalidou, E.; Thomaidis, N.S.; Dokupilova, D.; Gouveia, J.P.; Kádár, J.; et al. Cooling degree models and future energy demand in the residential Sector. A Seven-Country Case Study. Sustainability 2021, 13, 2987. [Google Scholar] [CrossRef]
- Tsoka, S.; Velikou, K.; Tolika, K.; Tsikaloudaki, A. Evaluating the combined effect of climate change and urban microclimate on buildings’ heating and cooling energy demand in a Mediterranean city. Energies 2021, 14, 5799. [Google Scholar] [CrossRef]
- Droutsa, K.G.; Kontoyiannidis, S.; Balaras, C.A.; Argyriou, A.; Dascalaki, E.G.; Varotsos, K.V.; Giannakopoulos, C. Climate change scenarios and their implications on the energy performance of hellenic non-residential buildings. Sustainability 2021, 13, 13005. [Google Scholar] [CrossRef]
- De Cian, E.; Wing, A.S. Climate Change Impacts on Energy Demand. Research Papers RP0240, Centro EuroMediterraneo sui Cambiamenti Climatici. 2014. Available online: http://www.cmcc.it/wp-content/uploads/2015/02/rp0240-cip-12-20141.pdf (accessed on 1 April 2023).
- Cronin, J.; Anandarajah, G.; Dessens, O. Climate change impacts on the energy system: A review of trends and gaps. Clim. Change 2018, 151, 79–93. [Google Scholar] [CrossRef]
- Jacob, D.; Petersen, J.; Eggert, B.; Alias, A.; Christensen, O.B.; Bouwer, L.M.; Braun, A.; Colette, A.; Déqué, M.; Georgievski, G.; et al. EURO-CORDEX (2014), new high-resolution climate change projections for European impact research. Reg. Environ. Change 2014, 14, 563–578. [Google Scholar] [CrossRef]
- Davy, R.; Gnatiuk, N.; Pettersson, L.; Bobylev, L. Climate change impacts on wind energy potential in the European domain with a focus on the Black Sea. Renew. Sustain. Energy Rev. 2018, 81, 1652–1659. [Google Scholar] [CrossRef]
- Mavromatakis, F.; Makrides, G.; Georghiou, G.; Pothrakis, A.; Franghiadakis, Y.; Drakakis, E.; Koudoumas, E. Modeling the photovoltaic potential of a site. Renew. Energy 2010, 35, 1387–1390. [Google Scholar] [CrossRef]
- Davy, R.J.; Troccoli, A. Interannual variability of solar energy generation in Australia. Sol. Energy 2012, 86, 3554–3560. [Google Scholar] [CrossRef]
- Tonui, J.K.; Tripanagnostopoulos, Y. Performance improvement of PV/T solar collectors with natural air flow operation. Sol. Energy 2008, 82, 1–12. [Google Scholar] [CrossRef]
- Chenni, R.; Makhlouf, M.; Kerbache, T.; Bouzid, A. A detailed modeling method for photovoltaic cells. Energy 2007, 32, 1724–1730. [Google Scholar] [CrossRef]
- Greek Committee of Large Dams. Available online: https://eemf.gr/en/information-about-greek-dams/# (accessed on 1 April 2023).
- van Vliet, M.T.H.; Yearsley, J.R.; Ludwig, F.; Vogele, S.; Lettenmaier, D.P.; Kabat, P. Vulnerability of US 570 and European electricity supply to climate change. Nat. Clim. Change 2012, 2, 676–681. [Google Scholar] [CrossRef]
- Morrill, J.; Bales, R.; Conklin, M. Estimating Stream Temperature from Air Temperature: Implications for Future Water Quality. J. Environ. Eng. 2005, 131, 139–146. [Google Scholar] [CrossRef]
- Mantzos, L.; Matei, N.A.; Mulholland, E.; Rózsai, M.; Tamba, M.; Wiesenthal, T. JRC-IDEES 2015. European Commission, Joint Research Centre (JRC) [Dataset]. 2018. Available online: http://data.europa.eu/89h/jrc-10110-10001 (accessed on 25 May 2022). [CrossRef]
- Bednar-Friedl, B.; Biesbroek, R.; Schmidt, D.N.; Alexander, P.; Børsheim, K.Y.; Carnicer, J.; Georgopoulou, E.; Haasnoot, M.; Le Cozannet, G.; Lionello, P.; et al. Chapter 13: Europe. In Climate Change 2022: Impacts, Adaptation and Vulnerability. Contribution of Working Group II to the Sixth Assessment Report of the Intergovernmental Panel on Climate Change; Pörtner, H.-O., Roberts, D.C., Tignor, M., Poloczanska, E.S., Mintenbeck, K., Alegría, A., Craig, M., Langsdorf, S., Löschke, S., Möller, V., et al., Eds.; Cambridge University Press: Cambridge, UK; New York, NY, USA, 2022; pp. 1817–1927. [Google Scholar] [CrossRef]
- Ministry of the Environment and Environment, National Energy and Climate Plan. 2019. Available online: https://energy.ec.europa.eu/system/files/2020-03/el_final_necp_main_en_0.pdf (accessed on 1 April 2023).
- Mancini, F.; Lo Basso, G. How Climate Change Affects the Building Energy Consumptions Due to Cooling, Heating, and Electricity Demands of Italian Residential Sector. Energies 2020, 13, 410. [Google Scholar] [CrossRef]
- Ciancio, V.; Salata, F.; Falasca, S.; Curci, G.; Golasi, I.; de Wilde, P. Energy demands of buildings in the framework of climate change: An investigation across Europe. Sustain. Cities Soc. 2020, 60, 102213. [Google Scholar] [CrossRef]
- Damigos, D.; Kaliampakou, C.; Balaskas, A.; Papada, L. Does Energy Poverty Affect Energy Efficiency Investment Decisions? First Evidence from a Stated Choice Experiment. Energies 2021, 14, 1698. [Google Scholar] [CrossRef]
- Russo, M.A.; Carvalho, D.; Martins, N.; Monteiro, A. Forecasting the inevitable: A review on the impacts of climate change on renewable energy resources. Sustain. Energy Technol. Assess. 2022, 52, 102283. [Google Scholar] [CrossRef]
- Timalsina, N.; Alfredsen, K.; Killingtveit, Å. Impact of climate change on ice regime in a river regulated for hydropower. Can. J. Civ. Eng. 2015, 42, 634–644. [Google Scholar] [CrossRef]
- Gaudard, L.; Romerio, F.; Valle, F.D.; Gorret, R.; Maran, S.; Ravazzani, G.; Stoffel, M.; Volonterio, M. Climate change impacts on hydropower in the Swiss and Italian Alps. Sci. Total Environ. 2014, 493, 1211–1221. [Google Scholar] [CrossRef]
- Yang, Y.; Javanroodi, K.; Nik, V.M. Climate Change and Renewable Energy Generation in Europe—Long-Term Impact Assessment on Solar and Wind Energy Using High-Resolution Future Climate Data and Considering Climate Uncertainties. Energies 2022, 15, 302. [Google Scholar] [CrossRef]
Disclaimer/Publisher’s Note: The statements, opinions and data contained in all publications are solely those of the individual author(s) and contributor(s) and not of MDPI and/or the editor(s). MDPI and/or the editor(s) disclaim responsibility for any injury to people or property resulting from any ideas, methods, instructions or products referred to in the content. |
© 2024 by the authors. Licensee MDPI, Basel, Switzerland. This article is an open access article distributed under the terms and conditions of the Creative Commons Attribution (CC BY) license (https://creativecommons.org/licenses/by/4.0/).