Article

Dugs-UNet: A Novel Deep Semantic Segmentation Approach to Convection Detection Based on FY-4A Geostationary Meteorological Satellite

1
Department of Artificial Intelligence, Shenzhen Polytechnic University, Shenzhen 518055, China
2
Department of Computer Science, Harbin Institute of Technology, Shenzhen 518055, China
3
National Satellite Meteorological Center, China Meteorological Administration, Beijing 100081, China
*
Author to whom correspondence should be addressed.
These authors contributed equally to this work.
Atmosphere 2024, 15(3), 243; https://doi.org/10.3390/atmos15030243
Submission received: 4 January 2024 / Revised: 14 February 2024 / Accepted: 15 February 2024 / Published: 20 February 2024
(This article belongs to the Section Atmospheric Techniques, Instruments, and Modeling)

Abstract

:
Severe convection is a disastrous mesoscale weather system. The early detection of such systems is very important for saving peoples’ lives and properties. Previous studies address the issue mainly based on thresholding methods, which are not robust and accurate enough. In this paper, we propose a novel semantic segmentation method (Dugs-UNet) to solve the problem. Our method is based on the well-known U-Net framework. As convective clouds mimic fluids, its detection faces two important challenges. First, the shape and boundary features of clouds need to be carefully exploited. Second, the positive and negative samples for convection detection are very imbalanced. To address the two challenges, our method was carefully developed. Regarding the importance of the shape and boundary features for convective target detection, we introduce a shape stream module to extract these features. Also, a data-dependent upsample operation is adopted in the decoder of U-Net to effectively utilize the features. This is one of our contributions. To address the imbalance issue for convective target detection, the a focal loss function is employed to train our method, which is another contribution. Experimental results of 2018 Fengyun-4A satellite observations in China demonstrate the effectiveness of the proposed method. Compared to conventional thresholding-based methods and deep semantic segmentation algorithms such as SegNet, PSPNet, DeepLav-v3+ and U-Net, the proposed approach performs the best.

1. Introduction

Severe convection is a disastrous mesoscale weather system, often accompanied by heavy rainstorms, violent winds, hail, lightning, etc, which cause serious threats to people’s lives and properties. Hence, the detection and early warning of severe convection becomes a hot and important research topic. However, the task is challenging because severe convection systems often take place suddenly with a small spatio scale and are of short duration. The geostationary satellites, which have very wide spatial coverage and produce highly frequent observations, offer an important means to detect and monitor such weather systems. The Fengyun 4A (FY-4A), a new-generation geostationary satellite, was successfully launched by China on 11 December 2016, and its Advanced Geosynchronous Radiation Imager (AGRI) produced and accumulated very high-quality observations for detecting convective cloud systems.
Existing convection detection algorithms are mainly thresholding-based methods. Typical methods leverage the brightness temperature threshold, including split window difference threshold [1], area threshold [2] and temperature gradient threshold [3]. The key rationale of these methods is that the brightness temperature of a severe convection cloud top is often much lower, and thus, a threshold is determined to identify the low-temperature parts. However, such methods are not accurate and robust enough because the threshold is often affected by many factors, e.g., seasons, geographical conditions, the shape of the convective clouds, etc. A fixed threshold cannot accurately characterize the complex relations, and thus, it should be adjusted accordingly so as to deliver more accurate and robust performance. However, an accurate and adaptive adjustment method is not available.
From the perspective of computer vision, convection detection can be regarded as a semantic segmentation problem. Thus, existing deep semantic segmentation models such as U-Net [4], SegNet [5], PSPNet [6] and DeepLab-v3+ [7] can also be applied. U-Net is a classic deep segmentation model, which is composed of an encoder and a decoder organized into a U-type structure. SegNet is a variant of U-Net, where a pooling indices strategy is carefully designed and developed. In PSPNet, a pyramid scene parsing network is proposed to effectively take the global context prior into consideration. As an enhanced version to DeepLab-V3, DeepLab-v3+ carefully refines the segmentation results along the object boundaries. However, convection detection has two important and distinguished characteristics, which these existing methods fail to carefully model or consider. First, the convection targets mimic fluids, where the shape and boundary information should be effectively exploited in segmentation. Second, the convection targets appear occasionally and their sizes are small, which lead to an imbalance issue of positive and negative samples.
In this paper, we propose a novel deep semantic segmentation model, DUpsample Gated Shape UNet (Dugs-UNet), for the convection detection of the FY-4A satellite. The Dugs-UNet leverages the U-Net [4]-based segmentation framework, which effectively approaches the two challenges above. To better characterize the shape and boundary features, a shape stream module is introduced into the framework. Moreover, a data-dependent and learnable upsampling operation, DUpsample, is utilized, which accounts for the better maintenance of the features in the decode part. The proposed Dugs-UNet effectively integrates the two parts. To effectively tackle the imbalance issue of positive and negative samples, a focal loss function is thus adopted to train the Dugs-UNet. Experiments on the FY-4A satellite data of 2018 in China show that the proposed Dugs-UNet delivers much better performance than conventional threshold-based methods and the state-of-the-art deep semantic segmentation methods U-Net [4], SegNet [5], PSPNet [6] and DeepLab-v3+ [7].

2. Methodology

In this section, we first introduce how we labeled the convection data and then the proposed Dugs-UNet method.

2.1. Convection Labeling

One of the key problems for convection detection is that there are no labeled data available. To solve the problem, we developed a labeling tool, which is shown in Figure 1. In the tool, we can select the FY-4A satellite image taken at any time point. The main panel shows the brightness temperature channel (10.3–11.3 µm) of the image, and a pre-fixed threshold is first leveraged to produce the convection region candidates. In the panel, we can select a small region (denoted as red lines) and tune the threshold until we think the convection labeling is good enough for the region. On the right-hand side, the radar image, visible light channel image (0.45–0.49 µm) and the colored brightness temperature image of the corresponding selected region are shown in three sub-panels to assist our labeling. By selecting the regions one by one and by performing the appropriate threshold adjustments, we can obtain the manually labeled convections for a satellite image. In this paper, 12,306 satellite images in China are labeled, which covers the middle ten days of each month in 2018.

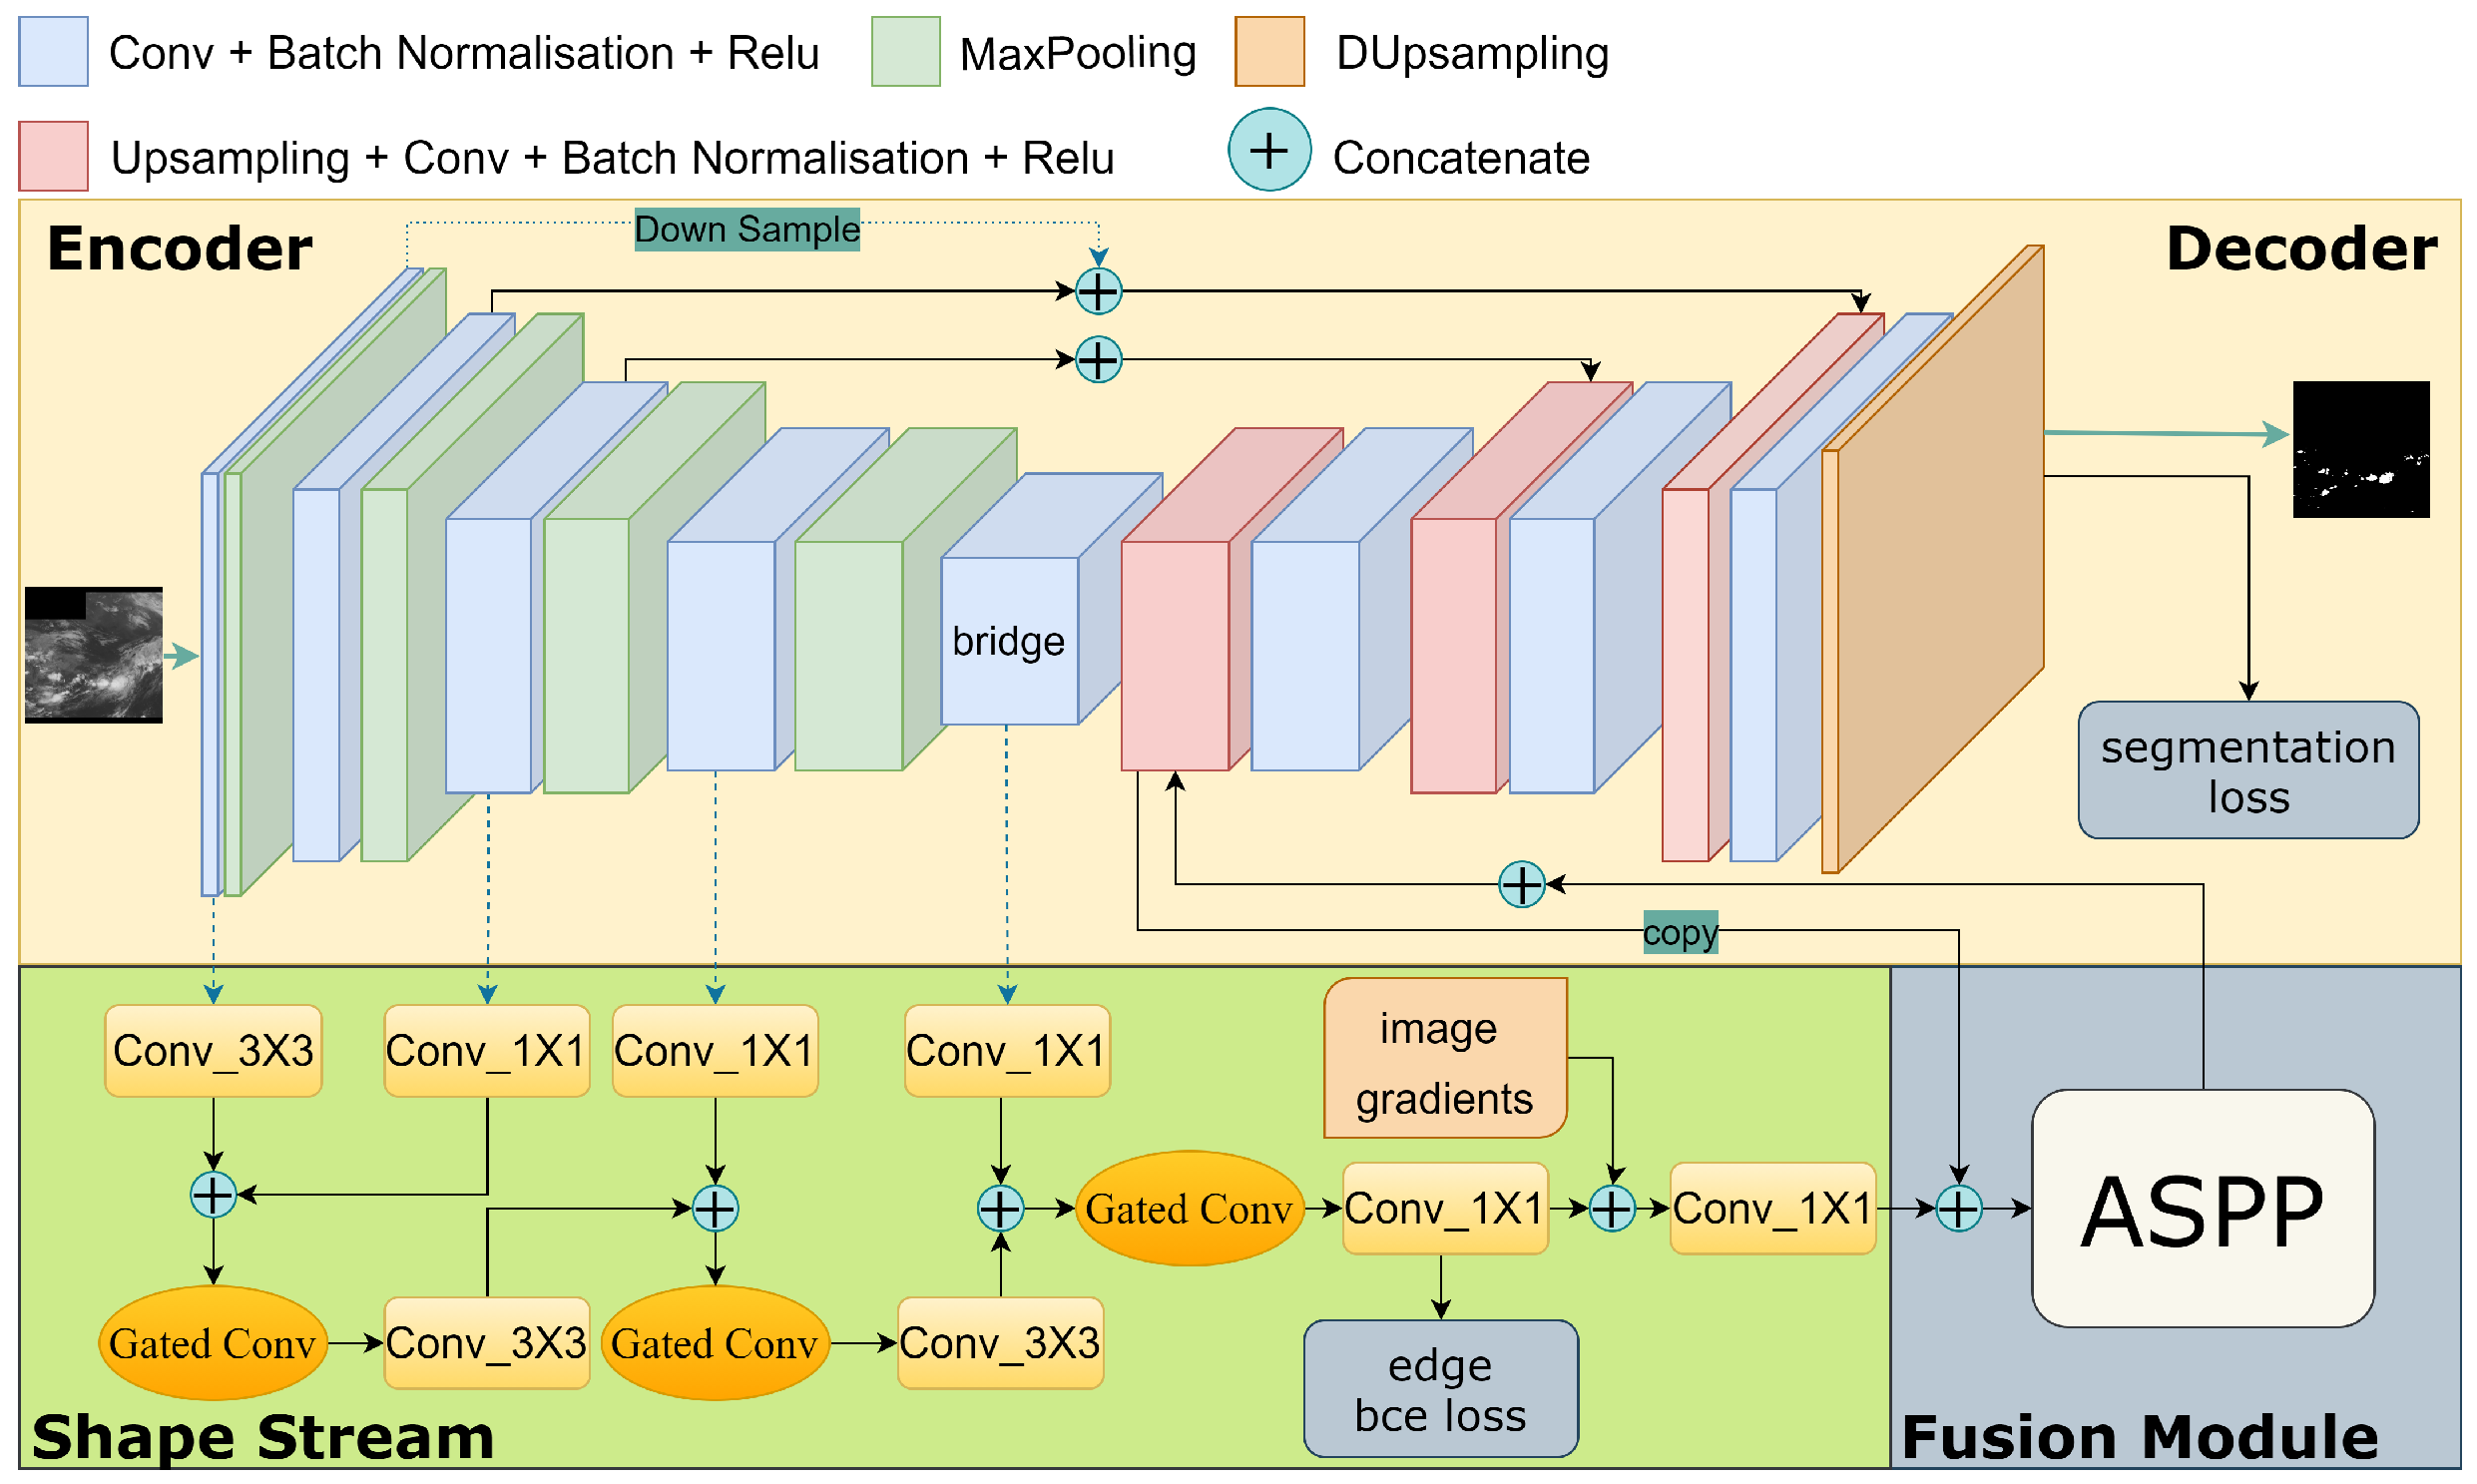
2.2. The Proposed Dugs-UNet

2.2.1. Overview

First, we give an overview of the proposed Dugs-UNet, shown as in Figure 2. As our method is also a semantic segmentation model, its main backbone is still a U-Net, which has an encoder–decoder architecture (denoted as yellow color). As mentioned in the introduction, the convection clouds mimic fluids, and thus, the shape and boundary information is of great importance for the detection. Hence, we introduce a shape stream module (denoted as green color), which works with the multi-level encoder of U-Net to extract the shape and boundary features. To exploit the features for semantic segmentation, a fusion module is leveraged (denoted as gray color). After the fusion, the features are fed into the decoder part of the U-Net. At the end of the decoder, a learnable data-dependent upsample operation, namely DUpsample (denoted as orange color), is utilized to produce more accurate segmentations.

2.2.2. U-Net Backbone

U-Net is a widely used segmentation model, which shows very promising performance. One of the biggest advantage lies in its U-shaped encoder–decoder architecture, where skip–connection operations feed the multi-level feature maps of the encoder into the multi-level counterparts of the decoder. As shown in Figure 2, in the Dugs-UNet, we have four levels for the encoder. Then, a bridge is appended. Symmetrically, the decoder is also a structure with four levels. In each level of the encoder, two convolution operations are performed with a batch normalization and rectified linear unit (ReLU) activation function. Then, a max pooling downsample operation is appended. Similarly, in each level of the decoder part, upsample operations, convolutions, batch normalization and ReLU activation are performed. To better understand the structure, we summarize the detailed parameters of the encoder and decoder in Table 1. We note that there are five stages instead of four because the first stage in the encoder and decoder denotes the input and output of the Dugs-UNet model, respectively.

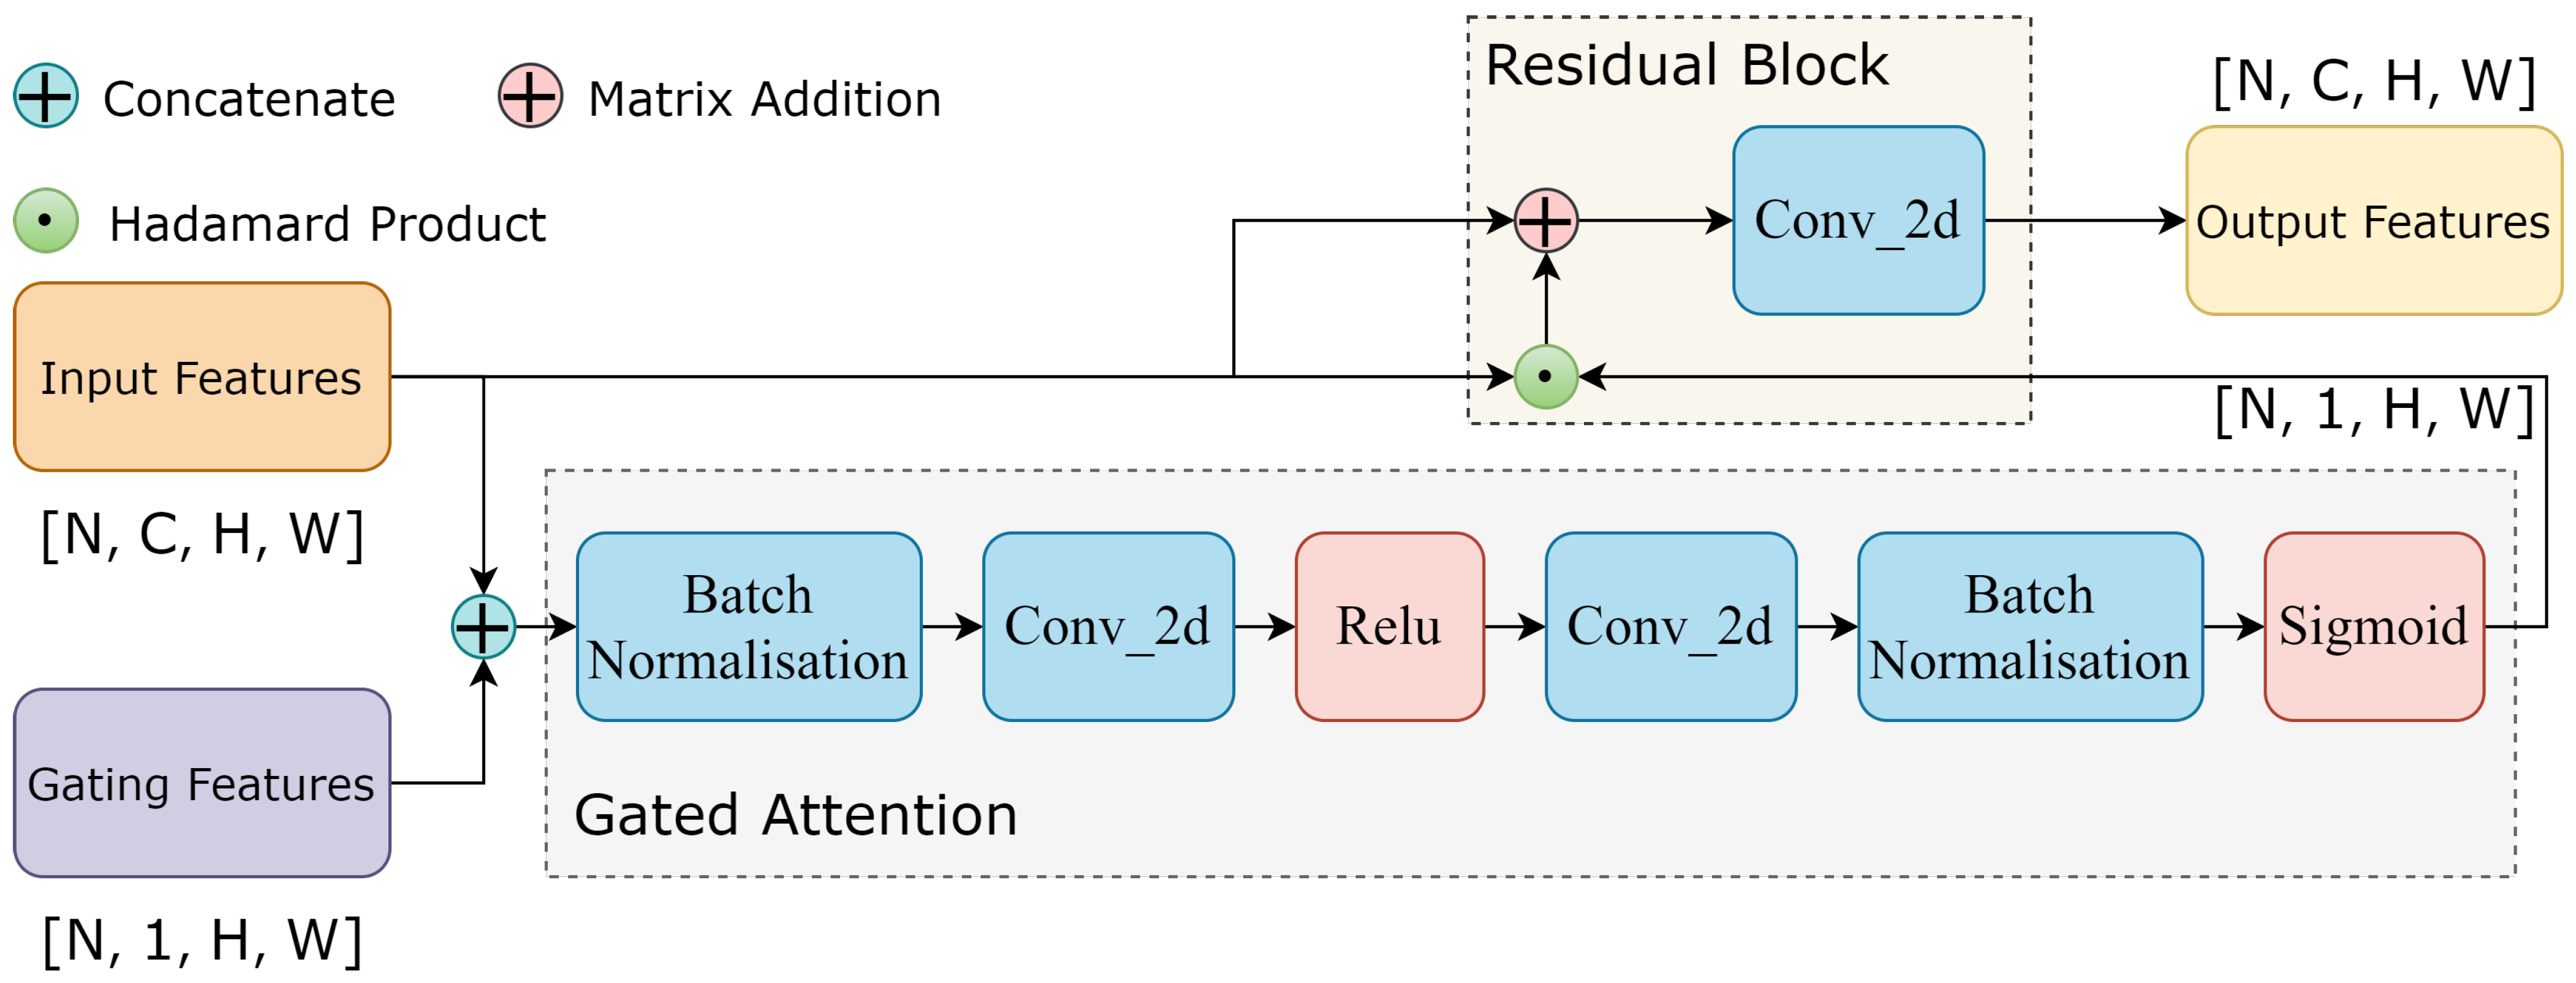
2.2.3. Shape Stream Module

As noted above, the shape and boundary features play an important role in convection detection. Hence, we need to extract such features. To this end, we introduce and leverage the shape stream module in [8] into our Dugs-UNet. As shown in Figure 2, the shape stream module mainly interacts with the encode part of the Dugs-UNet. Specifically, the shape stream first performs a 3 × 3 convolution on the first level and a 1 × 1 convolution on the third level feature maps; then, the results are concatenated. A gated convolution [8] is then performed on the concatenated feature maps. The result of gated convolution is further convolved with a 3 × 3 filter, and the feature maps are concatenated with the output of a 1 × 1 convolution on the fourth level of the feature map in the decoder. Again, a gated convolution is performed. The procedure is repeated one more time, and a 1 × 1 convolution is then performed to produce the final output of the shape stream module. Finally, we adopt an edge binary cross entropy loss to enable the output shape and boundary to be as similar to the ground truth as possible. In this way, we can regard the results of the final 1 × 1 convolution as the extracted shape and boundary features. We note that one key operation in the procedure is the gated convolution, which is indeed a conventional residual convolution combined with a pixel-wise attention mechanism. With the pixel-wise attention mechanism and ground-truth boundary loss supervision, the gated convolution will focus on extracting and delivering the shape and boundary features. The module allows our model to effectively extract shape- and boundary-related features of clouds, which is helpful for convection target detection.
To better understand why the shape stream module can nicely model the boundary and shape characteristics, we show the detailed structure of the core part of the module, i.e., the gated convolution in Figure 3. Due to the gated convolution, the shape stream module can concentrate on the boundary and shape features of the convective cloud. We can see from Figure 3 that the gated convolution is composed of two key parts, namely, the gated attention and residual block. As for the gated attention, it utilizes the input and gating features and feeds them into a two-layer two-dimensional convolution subnetwork to produce an attention map. Then, after multiplying the attention map with input features, its result is further inputted into a residual block to calculate the output of the module. Formally, the gated convolution in Figure 3 can be expressed as follows:
α = σ C 1 × 1 f e a t i n f e a t g a t e ,
where ‖ denotes concatenation of feature maps, f e a t i n R C × H × W and f e a t g a t e R 1 × H × W stand for the input features and gating features, respectively. We obtain the attention map α R 1 × H × W , through a 1 × 1 convolution operation C 1 × 1 and sigmoid activation function σ . Then, the final output of the residual block is denoted as:
f e a t ^ o u t = C 1 × 1 f e a t i n α + f e a t i n
where ⊙ represents the product of Hadamard. By using the gated convolution, the proposed shape stream module can better exploit the boundary and shape features of convective cloud for detection.

2.2.4. Fusion Module

To leverage the shape boundary features from the shape stream module for segmentation, we introduce a fusion module. Specifically, the atrous spatial pyramid pooling (ASPP) [7] is used in the module. With the shape boundary information and image gradients as input, the ASPP adopts different sampling rates for the atrous convolution to construct the multi-scale contexts. The contexts are then fed into the decoder to generate the convection segmentation results.
To better understand the structure, we show the detailed architecture of ASPP in Figure 4. As the output of the fusion module will be fed into the first layer of the decoder in Dugs-Unet (shown as in Figure 1), their sizes must be consistent. Hence, the shape features from the shape stream module will first be downsampled. Then, a 1-by-1 2-dimensional convolution will be applied. Similarly, the original features from the first layer of the decoder will also be transformed by a 2-dimensional convolution and three-scale atrous convolution (the ratios are 12, 24 and 36, respectively) operation. All the outputs will be concatenated as shown in Figure 4.

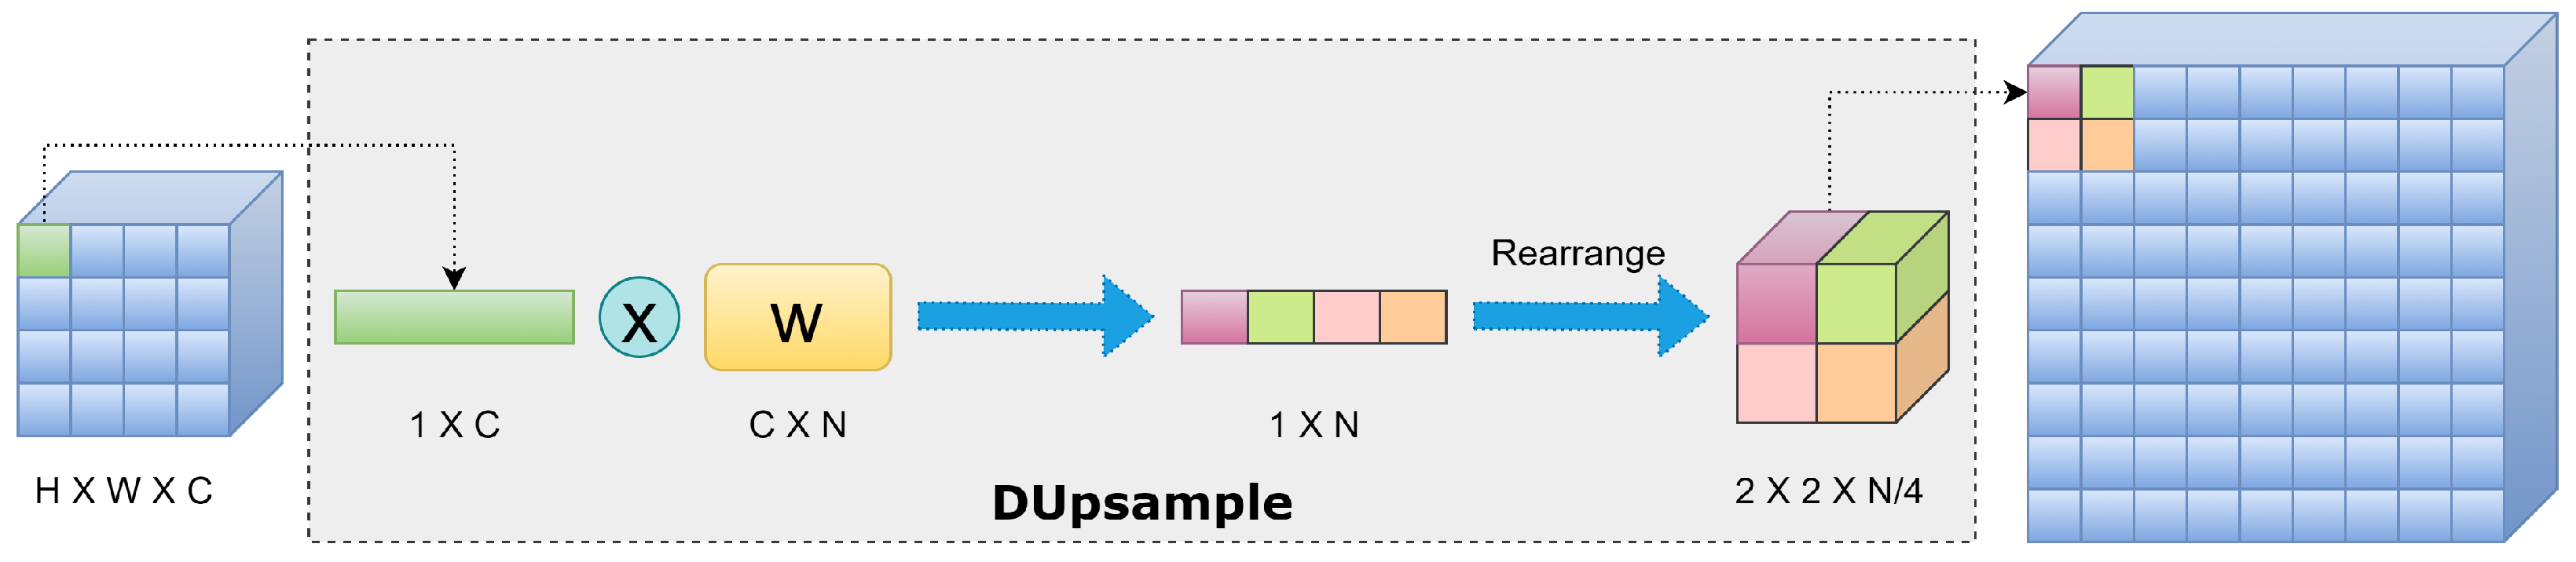
2.2.5. DUpsample Operation

By concatenating the features from the fusion module and the encoder, the decoder in our Dugs-UNet will generate the convection segmentation by a serial of convolutions and upsampling operations (as shown in the decoder part of Figure 2). Here, the upsampling accounts for recovering the resolutions of the feature maps from the fusion module and encoder. In conventional U-Net, bilinear interpolation and convolution are commonly used for the recovery. However, the result produced is often too smooth to preserve the details. To address the drawback, a DUpsample operation is proposed in [9]. The notion of DUpsample is illustrated in Figure 5. Given an H × W × C feature map, we acquire a C × N transformation matrix. By multiplying each 1 × C channel vector with the matrix, a 1 × N vector is obtained. We can rearrange it into a 2 × 2 × N / 4 tensor. Repeating the procedure for all the H × W channel vectors, a high resolution feature map of size 2 H × 2 W × N / 4 is obtained. We note the transformation matrix here is learned. Hence, the DUpsample is very flexible and completely data dependent. We append it into the last layer of the proposed Dugs-UNet to produce better convection segmentations.

2.2.6. Loss Function

In the proposed Dugs-UNet, we have two parts of supervision signals to train the model, which are, respectively, the boundary prediction and convective segmentation losses, namely L b c e and L f l . Lbce is used to calculate the binary cross entropy loss between the convective cloud boundary predicted by the shape stream module and the ground-truth boundary. The ground truth of the convection cloud boundary is obtained according to the ground-truth convective cloud as follows. First, we use one-hot encoding to denote the ground-truth convective cloud mask, where the connective cloud parts are marked with 1, and the other parts (namely background) are marked with 0. Second, we calculate the distance from the non-zero point in the mask image to the nearest background point. Finally, this distance is classified into two categories according to a threshold (which is 2), and as a result, the ground-truth boundary of the convective cloud is obtained. The loss function for calculating the binary cross entropy of the convective cloud boundary is as follows:
L b c e ( s , s ^ ) = 1 / n i n ( s ^ i log ( s i ) + ( 1 s ^ i ) log ( 1 s i ) )
Let n denote the number of locations, and let i 0 , 1 , , n be a running index where s ^ i represents the ground truth of the boundary, and s i represents the boundary predicted by the shape stream module.
Conventional segmentation methods like U-Net adopt the cross entropy as their loss functions. However, as mentioned in the introduction, the regions of conventions taking place are often much smaller than those without conventions. Hence, we need a more sophisticate loss function to address the imbalance issue of positive and negative samples. The focal loss [10] is a good choice. In the loss, not only can the imbalance issue be nicely addressed with an appropriate weighting scheme, but the optimization will also be oriented at difficult-to-classify samples, instead of at the easy-to-classifiy samples. Formally, the loss function is defined as follows:
L f l ( y , y ^ ) = α ( 1 y ) γ l o g y , y ^ = 1 1 ( 1 α ) y γ l o g ( 1 y ) , y ^ = 0
where y ^ denotes the ground-truth label of each pixel, y is the prediction probability of the pixel to be in a convention, α is a weighting parameter in ( 0 , 1 ) to balance the positive and negative samples and γ is a positive parameter to tune the optimization orientation on difficult-to-classify and easy-to-classify samples. Larger γ means more difficult-to-classify samples oriented. By carefully tuning the parameters α and γ , the imbalance issue can be effectively alleviated.
When training the model, we use the combined loss function of L b c e and L f l , with a weight ratio of 1. L b c e is used to train the shape stream module. As an upstream of this module, the parameters will also be updated when optimizing the loss through back propagation. L f l is used to train the Dugs-UNet with the segmentation labels, which will affect all the parameters in the Dugs-UNet (including the fusing module parameters, encoder and decoder parameters and shape stream module parameters) through backpropagation.

3. Experiments

3.1. Experimental Setup

3.1.1. Data Sets

In this paper, we use the AGRI images of FY-4A geostationary meteorological satellite in 2018. A region of 800 × 800 pixels is selected (16; 48; N-57; 04; N, 94; 79; E-161; 34; E), and each pixel represents an area of size 4 km × 4 km. As the convention systems preserve very different characteristics in the north and south regions, we thus can also divide the selected region into north and south parts by 31; 75; N. All the convections are labeled by our developed tool in Section 2.1. To separate the data into training, validation and test sets, we first sort all the images with respect to the observation time. Then, in each month, the first 70 % of images are put into the training set, the second 15 % of images are put into the validation set, and the remaining 15 % of images are put into the test set. By doing so, we ensure that the samples in the training, validation and test set do not have overlapping time points. Specifically, the number of images in the training, validation and test sets are 8617, 1843 and 1846, respectively.

3.1.2. Evaluation Metrics

We use three widely used evaluation metrics for convention detection, which are probability of detection (POD), false alarm ratio (FAR) and critical success index (CSI). Specifically, the three metrics are computed as follows:
P O D = T P T P + F N
F A R = F P T P + F P
C S I = T P T P + F N + F P
Here, T P and F P denote the number of positive pixels predicted as positive ones and the number of negative pixels predicted as positive ones, and F N indicates the number of positive pixels predicted as negative ones. POD measures the recall of ground-truth pixels in the prediction, and FAR denotes the false alarm rate of convections. The larger the POD and the smaller the FAR, the better the result is. However, the two metrics are biased, where POD is biased towards all positive predictions, while FAR is biased towards all negative predictions. CSI, as a trade-off and integration of POD and FAR, is an unbiased metric for convection detection. The higher the CSI, the better the performance is. We thus judge the models mainly based on the CSI metric. In addition, we have also reported the F1-score, which is computed as the following equation:
F 1 = 2 × T P 2 × T P + F N + F P
As noted above, the whole region can be divided into north part and south part. We thus evaluate the performance based on north part, south part and all the region, respectively.

3.2. Baselines and Parameter Setting

In this paper, we utilize two types of baseline methods. The first type is the conventional thresholding-based methods, where the convections are identified by thresholds 201 K, 215 K and 220 K on brightness temperature channel (10.3–11.3 µm), respectively. That is, the region with a smaller brightness temperature than the threshold is detected as a convection. The second type is the deep learning semantic segmentation methods, including SegNet [5], PSPNet [6], DeepLab-v3+ [7] and U-Net [4]. As for our Dugs-UNet model, we compare with its two variants, namely Dugs-UNet without shape stream module (Dugs-UNet w.o. S) and Dugs-UNet without DUpsample operation (Dugs-UNet w.o. D), to demonstrate the effectiveness of the corresponding components.
We tune and set the parameters of Dugs-UNet as follows. As for the parameter tuning, the parameter α of focal loss varies in [ 0 , 1 ] with a step 0.1 ; the parameter γ varies in { 0.5 , 1 , 2 , 5 } . By tuning the parameters on the validation set, the parameters of Dugs-UNet are set as follows. For the north region, we use α = 0.2 , γ = 2 , learning rate 0.00008 and batch size 16. For the south region, we adopt α = 0.5 , γ = 2 , the learning rate is 0.00012 and the batch size is 16. For the whole region, the setting is α = 0.5 , γ = 2 , the learning rate is 0.00012 and the batch size is 8. Adam optimizer is adopted to train our Dugs-UNet in all the three cases.

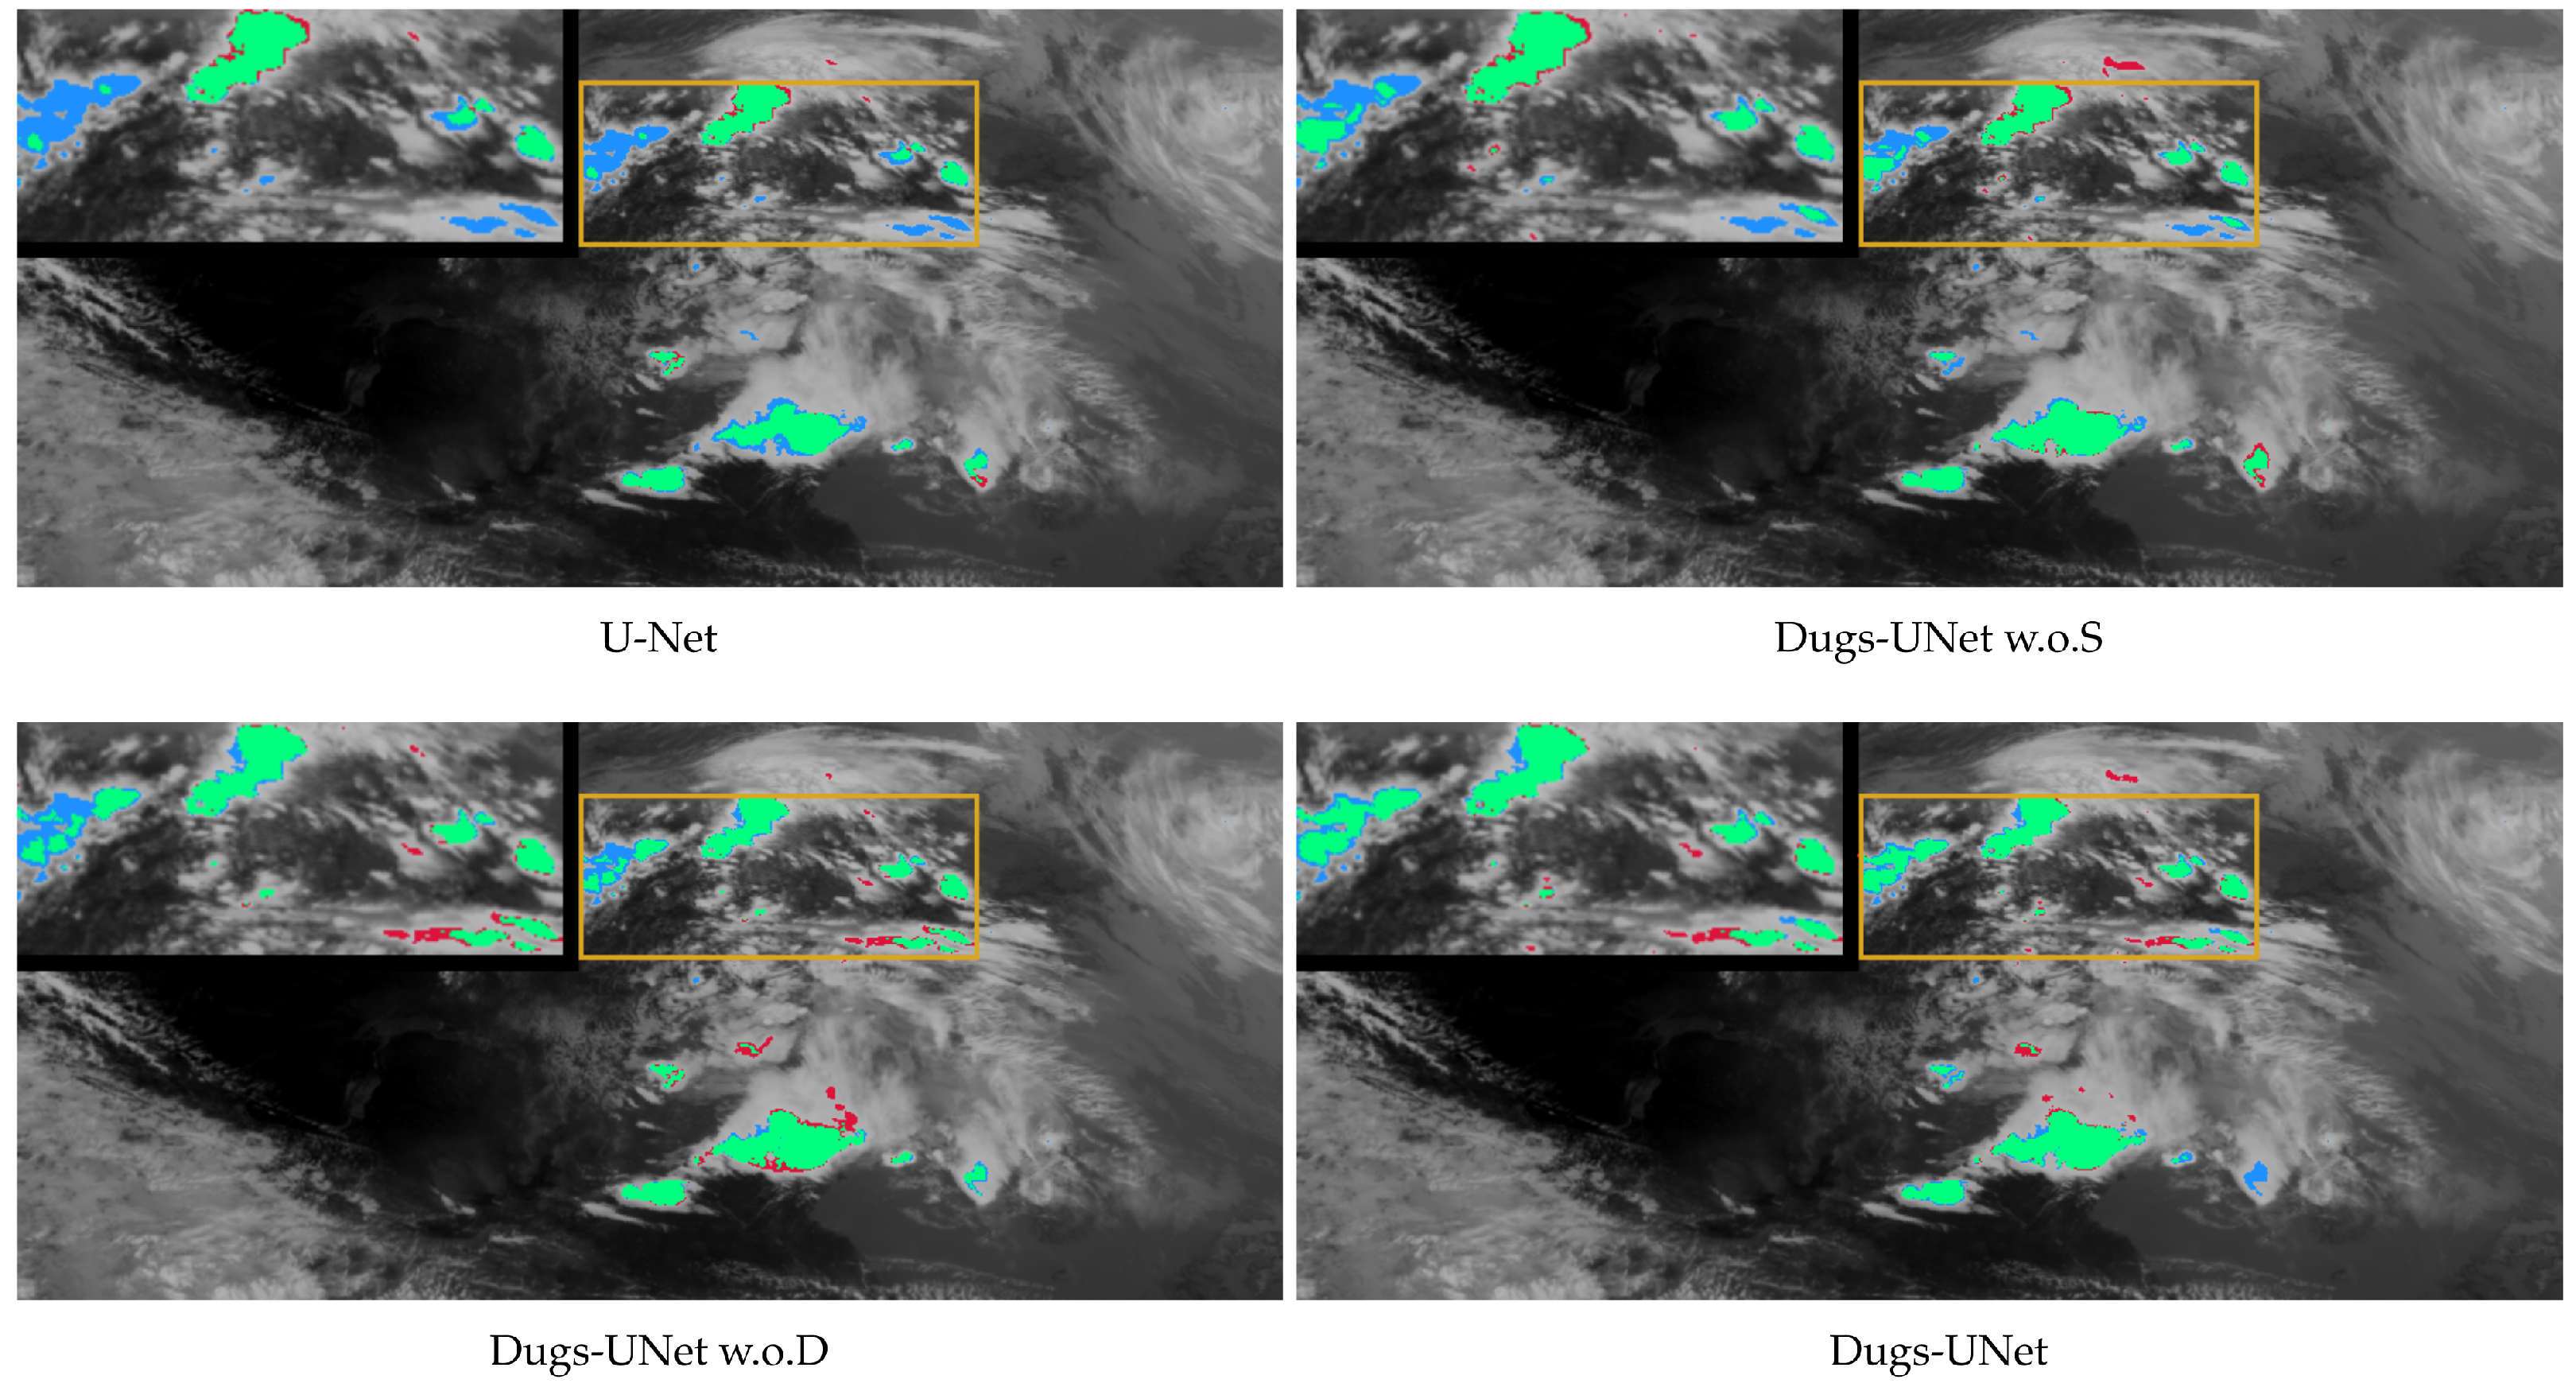
3.3. Experimental Results

Table 2 shows the results of all the methods in the three cases. We can see that the proposed Dugs-UNet consistently yields the best performance for all the regions. The deep learning-based semantic segmentation baselines perform the second best. The conventional threshold-based methods deliver the worst results. Among all the three thresholds, 215 K seems the best choice. Semantic segmentation methods outperform the threshold-based method, because these methods are all deep learning models, which have a powerful visual feature extraction and fitness ability. As a result, they are able to effectively utilize all the possible visual features and their combinations to fit the convective cloud mask, instead of to employ merely a fixed threshold for the detection. For semantic segmentation baselines, U-Net is the most promising, followed by SegNet and DeepLab-V3+, and PSPNet ranks the last. The reason is that SegNet lacks the skip-connection between the encoder and the decoder, which is used in U-Net. As a result, the low-level features are not effectively utilized. As for DeepLap-v3+ and PSPNet, they focus more on multi-level features but do not carefully take the low-level features into account either. Our Dugs-UNet performs better than these semantic segmentation methods because on the one hand, it effectively exploits the shape and boundary features, and on the other hand, it carefully addresses the imbalance issue.
The proposed Dugs-UNet outperforms U-Net, which is the most competitive baseline, by 1.3%, 7.7% and 1.4% for all the regions, the north region and the south region, respectively, which demonstrates the superiority of the proposed Dugs-UNet. We can see that the improvement on north region is more impressive because the convection systems in the north region are less obvious than those in the south part. As a result, it is more challenging to detect convections in the north region, and in this case, the advantage of the introduced shape stream module and DUpsample operation can be manifested. To better understand this point, we can compare the results of Dugs-UNet without S, Dugs-UNet without D and Dugs-UNet. We find that although Dugs-UNet performs better than Dugs-UNet without S and Dugs-UNet without D for all the three regions, the improvement is much more obvious for the north region than the other two regions. On the one hand, the results demonstrate the effectiveness of the two introduced components. On the other hand, the fact implies that the two components are more useful for hard-to-classify samples.
Next, we visually compare the results of U-Net, Dugs-UNet without S, Dugs-UNet without D and Dugs-UNet on an example from the three regions in Figure 6, Figure 7 and Figure 8. We observe from Figure 6 that missing identification phenomena are significantly reduced by introducing the DUpsample and shape stream module into U-Net, respectively. Moreover, the Dugs-UNet with both components further alleviates the issue. In Figure 7 and Figure 8, similar observations are found. All the observations validate the effectiveness of the two introduced components and the superiority of the proposed Dugs-UNet.
In our method, we introduce a shape stream module, so as to improve the detection accuracy of convective clouds from complex weather systems. Here, we would like to validate whether the the module is really helpful for characterizing the edge features of the convective clouds. To this end, we show in Figure 9 the edge prediction results of the proposed method. We can see from the figure that the predicted edges of the convective clouds by the proposed method are quite consistent with the ground-truth ones. The observation validates the effectiveness of the developed shape stream module.
As deep learning models, one would like to know the computational costs of our proposed method and other semantic segmentation methods. Here, we summarize the computational costs in Table 3, including the number of model parameters, the number of floating operations and the time cost when performing the inference for a satellite image. We can see that the inference time costs of our model and deep learning baselines are all very short, and the test of each image can be finished within 100 ms. The observation suggests that the proposed model and other deep learning baselines are all very efficient for practical applications.

4. Conclusions

In this paper, we propose to detect the convection systems by deep semantic segmentation method. A novel approach Dugs-UNet is developed. In the approach, we introduce a shape stream module and a DUpsample operation into U-Net. Experimental results on FY-4A satellite observations demonstrated the effectiveness of the proposed Dugs-UNet, which outperforms conventional threshold-based methods and the state-of-the-art deep semantic segmentation baselines.

Author Contributions

Conceptualization, Y.L., X.S. and X.L.; methodology, Y.L., X.S. and X.L.; software, X.S. and Y.Z.; validation, X.S., Y.Z. and G.D.; formal analysis, Y.L., X.S. and X.L.; resources, F.S. and D.Q.; data curation, F.S. and D.Q.; writing—original draft preparation, Y.L. and X.S.; writing—review and editing, X.L.; visualization, X.S. and Y.Z.; supervision, F.S. and D.Q.; project administration, X.S.; funding acquisition, Y.L. and X.L. All authors have read and agreed to the published version of the manuscript.

Funding

The research was supported by Scientific Research Project of Shenzhen Polytechnic under Grant No. 6022310002K and the Shenzhen Science and Technology Program under Grant Nos. JCYJ20200109113014456, JCYJ20180507183823045 and JCYJ20210324120208022, and FengYun Application Pioneering Project under Grant FY-APP-ZX-2022.0220.

Institutional Review Board Statement

Not applicable.

Informed Consent Statement

Not applicable.

Data Availability Statement

The data presented in this study are available on request from the corresponding author. The data are not publicly available due to some commercial reasons.

Conflicts of Interest

The authors declare no conflicts of interest.

Abbreviations

The following abbreviations are used in this manuscript:
FY-4AFengyun 4A
AGRIAdvanced Geosynchronous Radiation Imager

References

  1. Readhead, A.C.S. Equipartition brightness temperature and the inverse Compton catastrophe. Astrophys. J. 1994, 426, 51–59. [Google Scholar] [CrossRef]
  2. Adler, B.; Kalthoff, N.; Gantner, L. Initiation of deep convection caused by land-surface inhomogeneities in West Africa: A modelled case study. Meteorol. Atmos. Phys. 2011, 112, 15–27. [Google Scholar] [CrossRef]
  3. Ceccarelli, S.; Guimares, E.P.; Weltzien, E. Selection methods Part 1: Organizational aspects of a plant breeding programme. In Plant Breeding and Farmer Participation; Publishing House: Rome, Italy, 2009; pp. 195–222. [Google Scholar]
  4. Ronneberger, O.; Fischer, P.; Brox, T. U-net: Convolutional networks for biomedical image segmentation. In Proceedings of the Medical Image Computing and Computer-Assisted Intervention—MICCAI 2015—18th International Conference, Munich, Germany, 5–9 October 2015; pp. 234–241. [Google Scholar]
  5. Badrinarayanan, V.; Kendall, A.; Cipolla, R. SegNet: A Deep Convolutional Encoder-Decoder Architecture for Image Segmentation. IEEE Trans. Pattern Anal. Mach. Intell. 2017, 39, 2481–2495. [Google Scholar] [CrossRef] [PubMed]
  6. Zhao, H.; Shi, J.; Qi, X.; Wang, X.; Jia, J. Pyramid Scene Parsing Network. In Proceedings of the 2017 IEEE Conference on Computer Vision and Pattern Recognition(CVPR), Honolulu, HI, USA, 21–26 July 2017; pp. 6230–6239. [Google Scholar]
  7. Chen, L.C.; Zhu, Y.; Papandreou, G.; Schroff, F.; Adam, H. Encoder-decoder with atrous separable convolution for semantic image segmentation. In Proceedings of the Computer Vision—ECCV 2018—15th European Conference, Munich, Germany, 8–14 September 2018; pp. 833–851. [Google Scholar]
  8. Takikawa, T.; Acuna, D.; Jampani, V.; Fidler, S. Gated-SCNN: Gated Shape CNNs for Semantic Segmentation. In Proceedings of the 2019 IEEE International Conference on Computer Vision (ICCV), Seoul, Republic of Korea, 27 October–2 November 2019; pp. 5228–5237. [Google Scholar]
  9. Tian, Z.; He, T.; Shen, C.; Yan, Y. Decoders Matter for Semantic Segmentation: Data-Dependent Decoding Enables Flexible Feature Aggregation. In Proceedings of the 2019 IEEE Conference on Computer Vision and Pattern Recognition(CVPR), Long Beach, CA, USA, 16–20 June 2019; pp. 3126–3135. [Google Scholar]
  10. Lin, T.Y.; Goyal, P.; Girshick, R.; He, K.; Dollar, P. Focal Loss for Dense Object Detection. In Proceedings of the 2017 IEEE International Conference on Computer Vision(ICCV), Venice, Italy, 22–29 October 2017; pp. 2999–3007. [Google Scholar]
Figure 1. The interface of convection cloud label tool. In the tool, one can first select a file fold and a satellite image, and then the main panel shows the image. By selecting a small rectangle, the panel on the right-hand side shows the corresponding radar image, visible channel image and brightness image, which helps to label the convective clouds.
Atmosphere 15 00243 g001
Figure 2. The structure of the proposed Dugs-UNet, which is composed of a U-Net backbone with an encoder and decoder, a shape stream module and a fusion module.
Atmosphere 15 00243 g002
Figure 3. The detailed structure of the gated convolution, which shows the operations involved in a gated convolution.
Atmosphere 15 00243 g003
Figure 4. The detailed architecture of the fusion module, which accounts for aggregating the shape and boundary features for segmentation.
Atmosphere 15 00243 g004
Figure 5. Illustration of the DUpsample operator with ratio 2.
Atmosphere 15 00243 g005
Figure 6. Visualized comparison of convection detection results in the north region. Green, blue and red colors denote the correct identification, missing identification and wrong identification, respectively. The left upper corner denotes an enlarge part of the orange rectangle part.
Atmosphere 15 00243 g006
Figure 7. Visualize comparison of convection detection results in the whole region. Green, blue and red color denotes the correct identification, missing identification and wrong identification, respectively. The left upper corner denotes an enlarge part of the orange rectangle part.
Atmosphere 15 00243 g007
Figure 8. Visualized comparison of convection detection results in the south region. Green, blue and red colors denote the correct identification, missing identification and wrong identification, respectively.
Atmosphere 15 00243 g008
Figure 9. An illustration of the edge prediction results of convective clouds by the proposed method.
Atmosphere 15 00243 g009
Table 1. The parameter settings of the encoder–decoder module.
StageEncoderLayerFilterStrideOutput SizeDecoderLayerFilterStrideOutput Size
OneInput_1   800 × 800 × 1Input_10   800 × 800 × 2
Output_1Conv13 × 3/161800 × 800 × 16     
Output_2Conv23 × 3/161800 × 800 × 16Output_28Temperature  800 × 800 × 2
Output_3MaxPool2 × 22400 × 400 × 16     
TwoInput_2   400 × 400 × 16Input_9   400 × 400 × 80
Output_4Conv33 × 3/321400 × 400 × 32Output_25Conv183 × 3/321400 × 400 × 32
Output_5Conv43 × 3/321400 × 400 × 32Output_26Conv193 × 3/321400 × 400 × 32
Output_6MaxPool2 × 22200 × 200 × 32Output_27DUpsample2 × 2/2 800 × 800 × 2
ThreeInput_3   200 × 200 × 32Input_8   200 × 200 × 128
Output_7Conv53 × 3/641200 × 200 × 64Output_21Conv153 × 3/641200 × 200 × 64
Output_8Conv63 × 3/641200 × 200 × 64Output_22Conv163 × 3/641200 × 200 × 64
Output_9MaxPool2 × 22100 × 100 × 64Output_23Upsample2 × 2 400 × 400 × 64
     Output_24Conv173 × 3/321400 × 400 × 32
FourInput_4   100 × 100 × 64Input_7   100 × 100 × 512
Output_10Conv73 × 3/1281100 × 100 × 128Output_17Conv123 × 3/1281100 × 100 × 128
Output_11Conv83 × 3/1281100 × 100 × 128Output_18Conv133 × 3/1281100 × 100 × 128
Output_12MaxPool2 × 2250 × 50 × 128Output_19Upsample2 × 2 200 × 200 × 128
     Output_20Conv143 × 3/641200 × 200 × 64
FiveInput_5   50 × 50 × 128Input_6   50 × 50 × 256
Output_13Conv93 × 3/256150 × 50 × 256Output_15Upsample2 × 2 100 × 100 × 256
Output_14Conv103 × 3/256150 × 50 × 256Output_16Conv113 × 3/1281100 × 100 × 128
Table 2. Performance of different models. Here, numbers with boldface denote the best performance in the column.
RegionModelPODFARCSIModelPrecisionRecallF1
Allthreshold = 210 K0.60220.03390.5897threshold = 210 K0.96610.60220.7419
threshold = 215 K0.82920.18470.6981threshold = 215 K0.81530.82920.8222
threshold = 220 K0.95060.40140.5806threshold = 220 K0.59860.95060.7347
SegNet0.87800.08700.8103SegNet0.91300.87800.8952
PSPNet0.83400.11720.7509PSPNet0.88280.83400.8577
DeepLab-v3+0.86020.10900.7784DeepLab-v3+0.89100.86020.8754
U-Net0.87310.06230.8252U-Net0.93770.87310.9042
Dugs-UNet w.o. S0.87550.06110.8283Dugs-UNet w.o. S0.93890.87550.9061
Dugs-UNet w.o. D0.88540.06570.8336Dugs-UNet w.o. D0.93430.88540.9092
Dugs-UNet0.90020.07860.8360Dugs-UNet0.92140.90020.9107
Norththreshold = 210 K0.08740.01820.0873threshold = 210 K0.98180.08740.1605
threshold = 215 K0.37660.59740.2416threshold = 215 K0.40260.37660.3892
threshold = 220 K0.77880.71980.2596threshold = 220 K0.28020.77880.4121
SegNet0.68690.25450.5582SegNet0.74550.68960.7165
PSPNet0.82090.37870.5472PSPNet0.62130.82090.7073
DeepLab-v3+0.72890.25250.5849DeepLab-v3+0.74750.72890.7381
U-Net0.75000.21910.6196U-Net0.78090.75000.7651
Dugs-UNet w.o. S0.81230.25510.6355Dugs-UNet w.o. S0.74490.81230.7772
Dugs-UNet w.o. D0.79310.20760.6567Dugs-UNet w.o. D0.79240.79310.7928
Dugs-UNet0.82400.21650.6711Dugs-UNet0.78350.82400.8032
Souththreshold = 210 K0.65790.03410.6430threshold = 210 K0.96590.65790.7827
threshold = 215 K0.87820.14400.7652threshold = 215 K0.85600.87820.8670
threshold = 220 K0.96920.33570.6506threshold = 220 K0.66430.96920.7883
SegNet0.85470.06840.8042SegNet0.93160.85470.8915
PSPNet0.83200.10170.7604PSPNet0.89830.83200.8639
DeepLab-v3+0.86650.08000.8058DeepLab-v3+0.92000.86650.8925
U-Net0.89220.05510.8481U-Net0.94490.89220.9178
Dugs-UNet w.o. S0.89180.04980.8520Dugs-UNet w.o. S0.95020.89180.9201
Dugs-UNet w.o. D0.90190.06150.8516Dugs-UNet w.o. D0.93850.90190.9198
Dugs-UNet0.92190.07270.8598Dugs-UNet0.92730.92190.9246
Table 3. Computational costs analysis and comparison of our method and deep learning baselines.
Number of ParametersNumber of Floating Operations (FLOPs)Inference Time for a Satellite Image
SegNet29.4 M1374.0G99.04 ms
PSPNet46.7 M232.0G47.93 ms
DeepLab-v3+59.2 M215.2G65.72 ms
U-Net13.4 M289.9G64.82 ms
Dugs-UNet2.7 M43.1G34.44 ms
Disclaimer/Publisher’s Note: The statements, opinions and data contained in all publications are solely those of the individual author(s) and contributor(s) and not of MDPI and/or the editor(s). MDPI and/or the editor(s) disclaim responsibility for any injury to people or property resulting from any ideas, methods, instructions or products referred to in the content.

