Article

Large Eddy Simulation of Flow Around Twin Tower Buildings in Tandem Arrangements with Upstream Corner Modification

1
School of Civil Engineering, Henan University of Technology, Zhengzhou 450001, China
2
College of Engineering, Changsha University of Science and Technology, Changsha 410114, China
3
School of Civil Engineering, Shijiazhuang Tiedao University, Shijiazhuang 050043, China
4
Shanghai Typhoon Institute of China Meteorological Administration, Shanghai 200030, China
*
Author to whom correspondence should be addressed.
Atmosphere 2024, 15(12), 1540; https://doi.org/10.3390/atmos15121540
Submission received: 28 October 2024 / Revised: 8 December 2024 / Accepted: 19 December 2024 / Published: 22 December 2024
(This article belongs to the Section Atmospheric Techniques, Instruments, and Modeling)

Abstract

:
The aerodynamic performance of twin tall buildings immersed in the atmospheric boundary layer was numerically investigated by adopting the spatial-averaged large eddy simulation (LES) method. This study focused on the effects of corner cutting and chamfering. The buildings were both square and sectional with a width-to-height ratio of 1:6, and were arranged in a tandem configuration with a spacing ratio of 2.0. The corner-cutting and chamfering measures were only applied to the upstream cylinder, with a corner modification rate of 10%. To generate the turbulent inflow boundary condition (IBC) for LES, steady-state equilibrium IBC expressions were introduced into the vortex method, which were implemented in the commercial code Ansys Fluent. The present simulation method and solution parameters were first verified by comparing the simulated wind field and the wind pressure distribution on a single tall building with those of the wind tunnel test. The influences of the corner-cutting and chamfering measures on the wind load of the tandem buildings were then comparatively studied concerning the statistical values of their aerodynamic force coefficients and wind pressure coefficients. The influence mechanism was analyzed based on the simulated time-averaged flow field and the instantaneous vortex structure around the buildings. The results indicated that upstream corner-cutting and chamfering measures can induce a diffusion angle shift in the separated shear flow from the leading edge of the upstream building, thus affecting the separation and reattachment of the separated upstream flow on the downstream building. Among the measures studied, upstream corner cutting is more effective in reducing wind pressure and aerodynamic force coefficients.

1. Introduction

Square cross-sections are widely used in engineering applications for tall buildings. Reducing wind loads and wind-induced vibration on tall buildings has also been of great interest to engineers and researchers to improve comfort and safety. Compared to structural stiffness or damping adjustment, aerodynamic measures can more effectively reduce structural wind loads and weaken the structural wind response by simply changing the configuration of the structure section, and thus they are currently the most widely used methods [1,2,3].
For individual tall, square cross-section buildings, experimental studies have been performed on the changes in wind load and aeroelastic responses with different aerodynamic measures, such as corner cutting, chamfering, rounding, and the setting of spoilers [4]. Among them, corner cutting and chamfering are the two most commonly used aerodynamic measures. By adopting an aeroelastic model and a high-frequency force balance wind tunnel test, the chamfering aerodynamic method with a 10% rate was found to have good performance in reducing the across-wind base bending moments of high rise buildings [5]. Moreover, corner cutting with a rate of 5–20% is capable of inhibiting aeroelastic responses of the building, while larger corner-cutting rates will weaken the inhibition effect [6]. A similar study also indicates that the 5% cutting corner rate can effectively inhibit the aeroelastic instability phenomenon of square-section high-rise buildings [7]. Compared to wind tunnel tests, CFD (Computational Fluid Dynamics) simulation has an advantage in mechanism analysis by flow field visualization and in its applicability to super-high buildings [8,9]. According to different Navier–Stokes (N-S) solutions, numerical simulations can be classified into the following three categories: the DNS (direct numerical simulation; i.e., time dependent N-S equations are directly solved) method, the time averaged RANS (Reynolds-averaged Navier–Stokes) method, and the spatial-averaged large eddy simulation (LES) method. Due to its ability to capture fluctuations in the flow field with acceptable computational cost, the LES method has been widely used to study the flow mechanism of wind effects on building structures [10,11]. By carrying out large eddy simulations of flows around a single square building with corner chamfering, it has been found that corner chamfering can induce notable changes in the near-wake flow structures of a square cross-section cylinders in both stationary and oscillating conditions [11,12].
Nowadays, groups of tall buildings are common in the central business districts of cities. Different from single tall buildings, non-negligible interference effects on wind loads and wind-induced vibrations exist for tall building groups [13,14]. The interference effect has a strong relationship with the complex flow fields around buildings, and it is prone to being severe for high-rise building groups in tandem arrangements [15,16]. The aerodynamic performance will undergo significant changes in the case that the spacing ratio exceeds a critical value. In addition, when the distance between the two adjacent buildings is small, the wind load and wind-induced response of the downstream building would be significantly influenced by the upstream one, due to the remarkable changes in the flow field (generally having a sheltering effect) [17,18]. Although previous studies can provide valuable guidance for the shape optimization of a single tall building, the performance of different aerodynamic measures on building groups remains to be verified. In addition, some studies on the effect of corner modification mainly focus on quasi-3D tandem buildings without considering the effect of inflow turbulence [3]. However, for building structures immersed in the atmospheric boundary layer (ABL), the inflow turbulence cannot be neglected, nor can the significant differences in flow patterns between the quasi-3D and 3D buildings [19,20]. Thus, the effects of corner-cutting and chamfering measures on the flow field around tandem-arranged 3D square-section tall buildings in ABL still require further investigation.
To study the effect of corner-cutting and chamfering on the aerodynamic performance of tall buildings, the flow around 3D square-section twin tower buildings in a tandem arrangement with a spacing ratio of 2.0 was numerically simulated using LES. The inflow turbulence for the LES was generated by combining the equilibrium inflow boundary condition (IBC) expressions with the vortex method. In the present study, corner-cutting and chamfering methods were considered only for the upstream building with a corner modification ratio of 10%. The mean and fluctuating wind pressure, along with the aerodynamic force coefficients were compared. The simulated flow fields were analyzed to investigate the underlying influence mechanism.

2. Numerical Simulation Method

2.1. Governing Equations

The basic idea of the LES method is to divide the turbulence eddies into small-scale eddies and large-scale ones; large-scale eddies are solved directly, while small-scale eddies are modeled. By spatially averaging of the incompressible time-dependent N-S equations, the governing equations for the LES method are as follows [21]:
u i ¯ x i = 0
u ¯ i t + u ¯ i u ¯ j x j = 1 ρ p ¯ x i + ν 2 u ¯ i x j x j τ i j x j
where ρ is the air density; v is the dynamic viscosity coefficient, which represents the spatially averaged filtered velocity; xi, xj are the spatial coordinate components (i, j = 1, 2, 3), which represent the horizontal x- and y-axis and vertical z-axis components, respectively; p ¯ is the spatially averaged filtered pressure; and τij is the sub-grid-scale stress, which is an unclosed term generated by spatial averaging of the N-S equations. The sub-grid stress τij needs to be modeled to close the spatially averaged N-S Equations (1) and (2). By introducing the Boussinesq assumption, the sub-grid-scale stress can be obtained using the following equation [22]:
τ i j 1 3 τ k k δ i j = 2 u t s i j ¯
where τkk is the isotropic part of the sub-grid stress and s i j ¯ is the solvable scale deformation rate tensor, with:
s i j ¯ = 1 2 ( u i ¯ x j + u j ¯ x i )
where ut is the sub-grid turbulent viscosity ratio. According to the solutions for ut, different sub-grid models have been proposed. For the standard Smagorinsky model, the sub-grid turbulence viscosity ratio is defined as follows:
u t = ρ L S 2 | S ¯ |
where | S ¯ | = 2 S ¯ i j S ¯ i j , where Ls is the sub-grid-scale hybrid length determined by:
L s = min ( κ d , C S V 1 / 3 )
where κ is the von Kármán constant, with a value of 0.42; d is the near-wall distance; V is the volume of the computational cell; and Cs is the Smagorinsky constant. In the standard Smagorinsky model, Cs is fixed with a default value of 0.1. By contrast, the value of Cs is determined dynamically for the dynamic Smarorinsky model with a corresponding value ranging from 0 to 0.23. Thus, the dynamic Smarorinsky model is more suitable for wind-engineering problems with complicated flow phenomena, such as flow impact, separation and reattachment.

2.2. Turbulent IBC Generation Method for LES

In order to study wind flow around building structures by using LES, the turbulent ABL should first be simulated. In the present study, the vortex method was combined with steady-state equilibrium IBC expressions, and was adopted to synthesize the inflow turbulence for LES. The vortex method was first proposed by Sergent [23]. The basic idea for the vortex method is to assume the flow field to be superimposed by eddy structures at different scales, and then the fluctuating velocities can be generated by the following formula [24]:
u ( x ) = 1 2 π i = 1 N 4 π S k ( x , y ) 3 N ( 2 ln ( 3 ) 3 ln ( 2 ) ) ( x i ¯ x ¯ ) × z ¯ | x ¯ x i ¯ | 2 ( 1 e x ¯ x i ¯ 2 2 σ 2 ) e x ¯ x i ¯ 2 2 σ 2
where N is the number of vortex points, and the value is set to 95 according to previous studies [24]; S is the area of the inlet boundary; k is the turbulent kinetic energy; x ¯ is the two-dimensional coordinate of each vortex; x i ¯ is the two-dimensional coordinate of each vortex center; z ¯ is the unit vector in the stream-wise direction; and σ is the characteristic scale of the vortex, which is can be defined by:
σ = c k 3 / 2 / 2 ε
where c = 0.16. In Equation (8), the expressions of the turbulent kinetic energy k and dissipation rate ɛ are those from the equilibrium IBC, as follows:
k ( z ) = 2 C 1 ln ( z + z 0 ) + C 2
ε ( z ) = C μ 1 / 2 k ( z ) u z
where C μ is a model constant with a value of 0.09, and C1 and C2 are two other model constants to be fitted for different approaching wind fields. The turbulent inflow IBC for LES are then obtained by superimposing the fluctuating velocities obtained in Equation (7) above and the mean wind profile defined by the log law as follows:
u ( z ) = u * κ ln z + z 0 z 0
where u* and z0 are the fitted friction velocity and rough height, respectively.

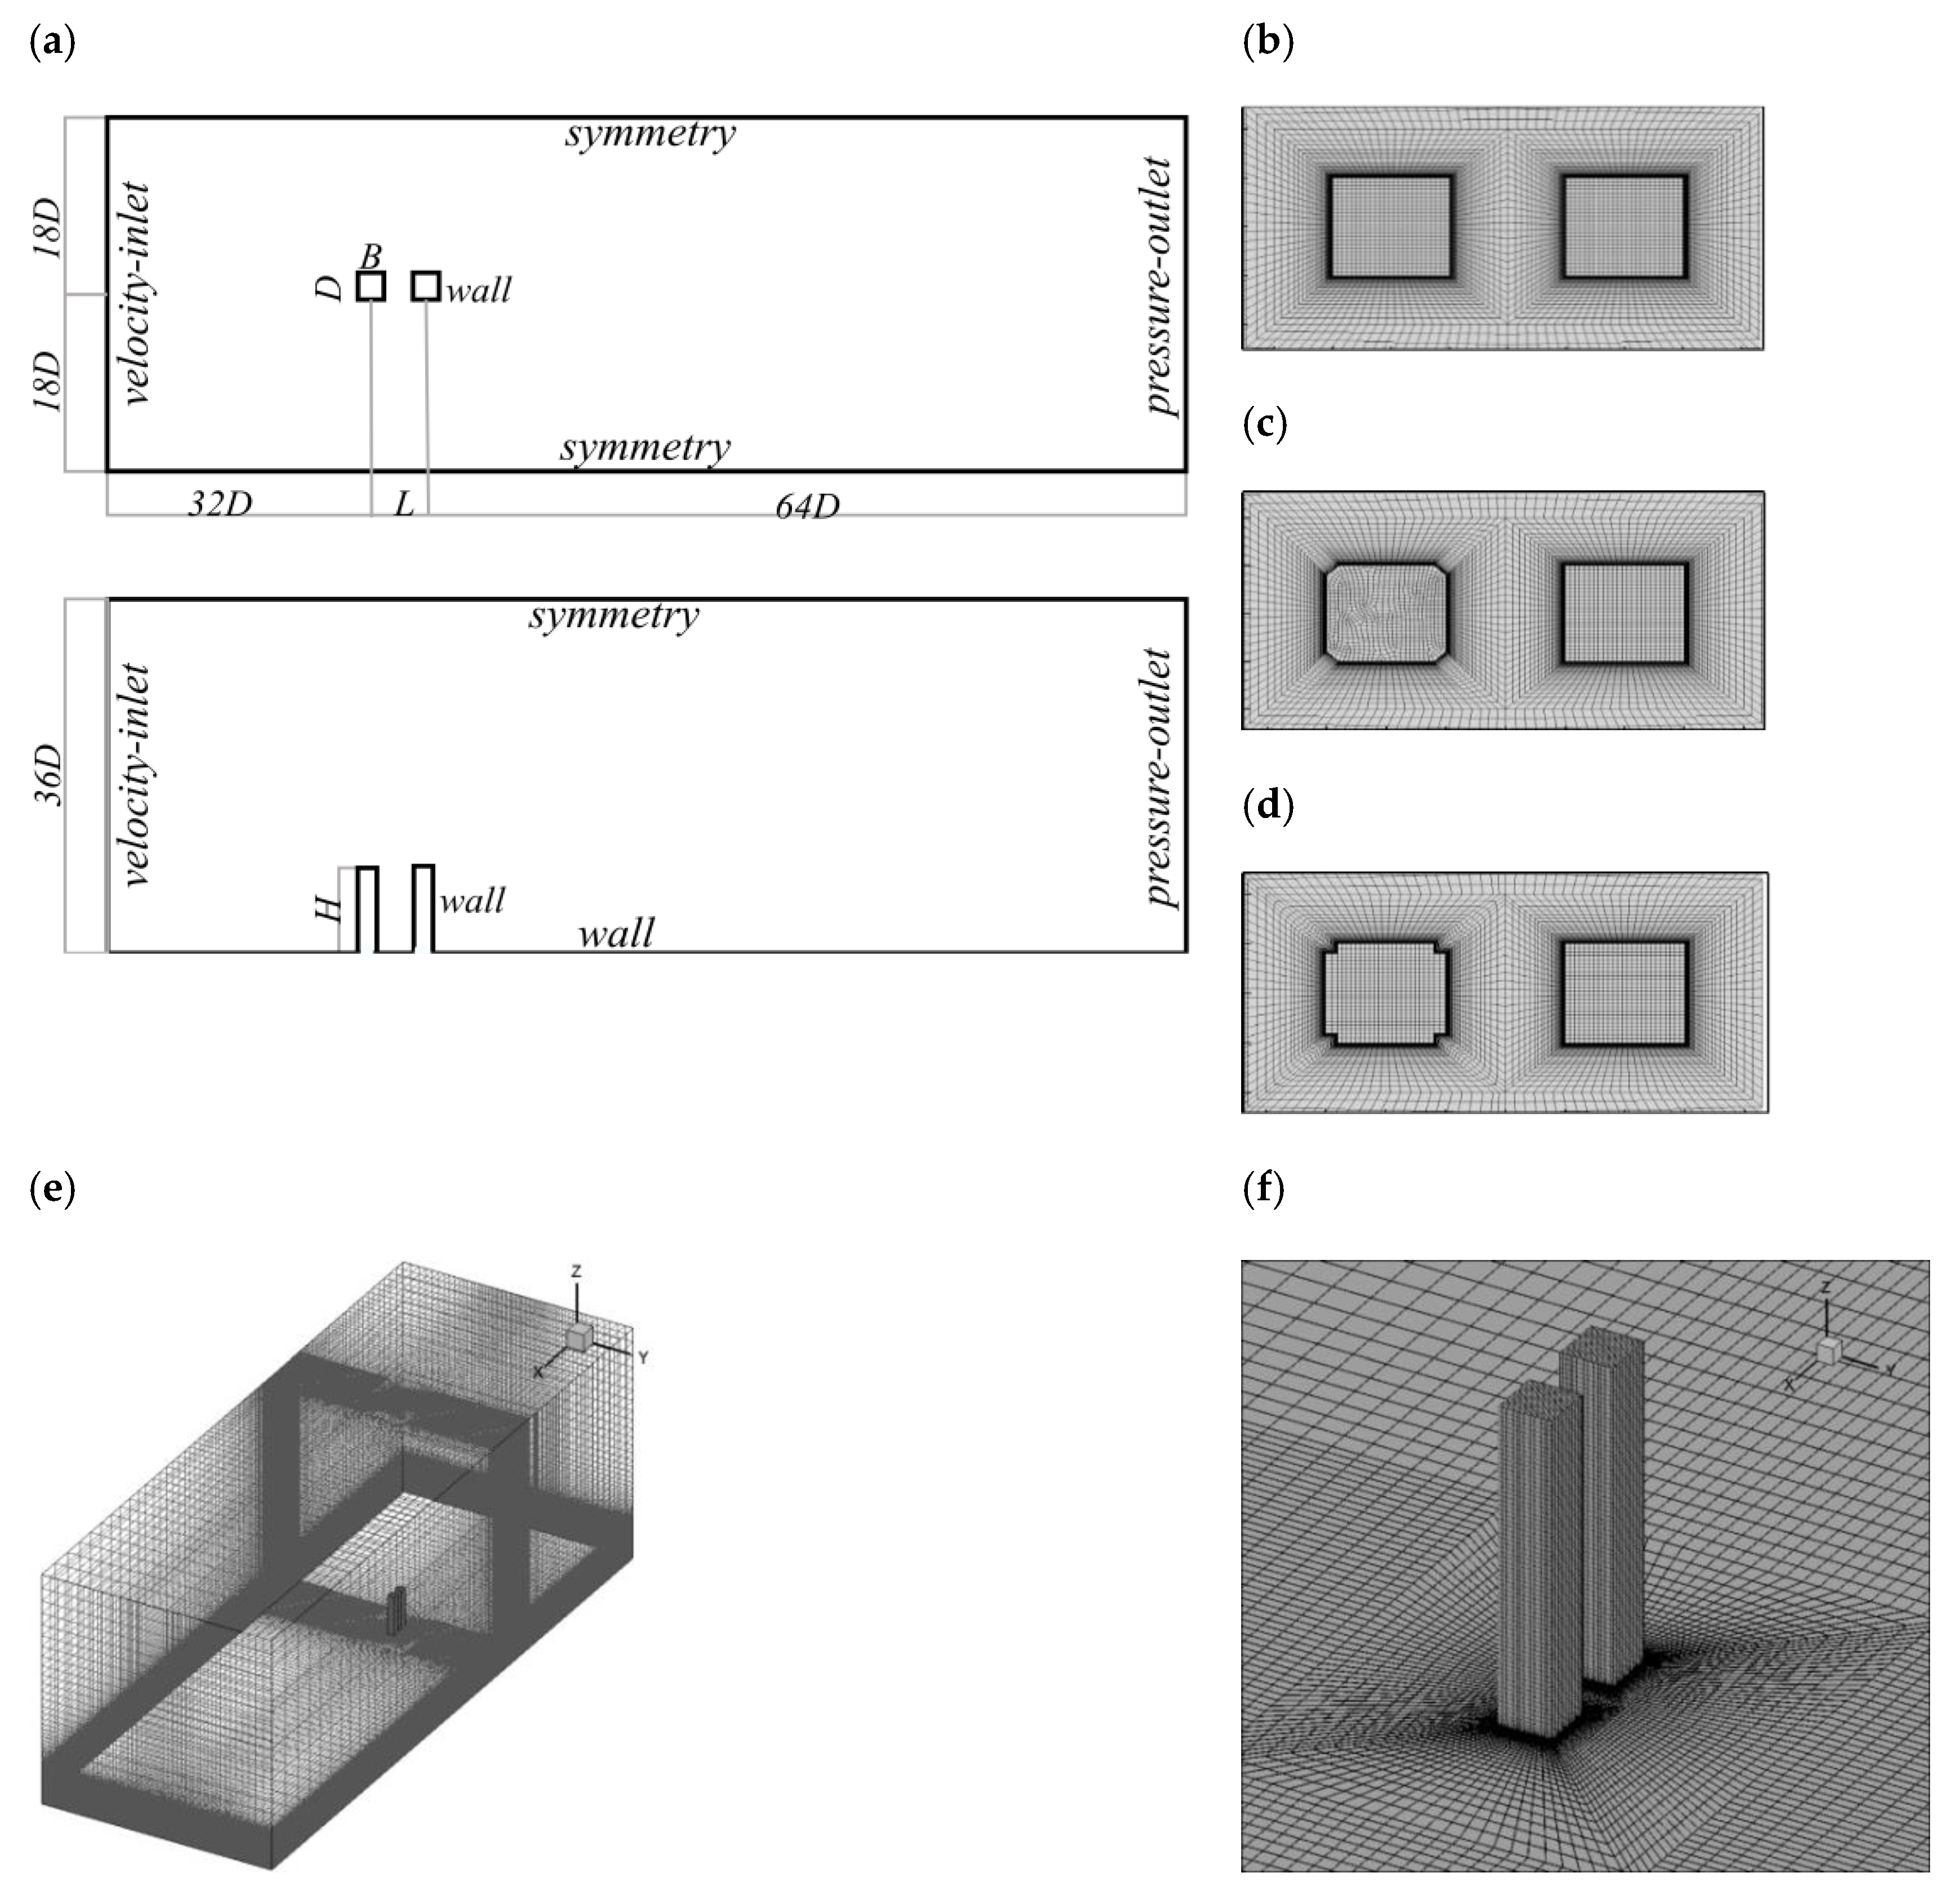
3. Modeling and Solution Parameter Settings

The present simulation method was first verified via comparison of the simulated wind pressure coefficients with the experimental data for a single square-section tall building with a width-to-height ratio of 1:6. The scale ratio was 1:500 for the rigid model wind tunnel test on the single tall building [25]. A similar scale ratio was adopted for the present simulation of flow around two tandemly arranged tall buildings with a spacing ratio of 2.0 (i.e., the ratio of the center distance L of the two buildings to the depth D of the building model). The breadth B and depth D were 0.1 m for both the single and tandem tall building models. The width-to-height ratio of the tandem buildings was also 1:6. In the present simulations, corner cutting or chamfering was only carried out for the upstream tall building. The corner modification ratio was set to be 10%, which was effective in reducing the wind effects on a single tall building in previous work [5]. The approaching wind direction was set to be along the tandem arranged tall buildings as shown in Figure 1.
The computational domain size was 32D + L + 64D (in the stream-wise direction) × 36D (in the span-wise direction) × 36D (in the vertical direction), as shown in Figure 1, where the boundary conditions are given. The value of the center distance was L = 0 for the single tall building simulation. The top boundary of the computation domain was set to 5H away from the building, according to the recommendation in the guidelines provided by the AIJ (Architectural Institute of Japan) [26] and COST Action 732(2005–2009) [27]. The distance between the building and the outflow boundary was set to 10.6H, which satisfied the minimum requirement (10H) in the AIJ guidelines. A nonuniform structured grid (Figure 1) was utilized to discretize the computational domain, in which the grid was refined near the wall boundary. Three kinds of meshes (namely M1, M2, and M3, following the case name suffix listed in Table 1) were considered to obtain the grid independence solution in the verification of the present simulation method. Details of the present grid scheme are summarized in Table 1, where y+ is a non-dimensional parameter that measures the distance from the first layer of the mesh to the wall boundary. In this study, in order to satisfy the requirement of the near-wall region mesh for LES to resolve the large velocity gradient within the boundary layer, the height of the first mesh layer (i.e., the minimum grid size in Table 1) was set to compare the effect of different y+ values on the simulation results.
Generally, a steady RANS calculation is recommended to be carried out to obtain the fully developed flow field as the initial flow field for LES to save on computational costs. In the present study, the realizable k-ε model was adopted in the RANS calculation, because it is applicable to a wide range of flow conditions, including boundary layer flow, external aerodynamics, etc. In addition, the equilibrium IBC expressions (i.e., Equations (9)–(11)) adopted are also compatible with the realizable k-ɛ turbulence model. The equilibrium IBC expressions are applied to the inlet panel by using the Ansys Fluent UDF (user defined function) programming. The pressure–velocity coupling was solved using the SIMPLEC algorithm. The residuals were set to 0.0005 for both the RANS and LES calculations. As for the time-dependent LES, the second-order implicit equation was adopted for the time-discretization. The time-step size was set to Δt = 0.0005 s, which satisfies the Courant–Friedrichs–Lewy criterion for the present LES calculation. The spatial discretization was the second-order bounded central differencing scheme. The dynamic Smagorinsky–Lilly model was adopted as the sub-grid model. The boundary condition settings are depicted in Figure 1. As illustrated in Section 2.2, inflow turbulence for the velocity–inlet boundary condition was generated by the vortex method combined with the steady-state equilibrium IBC expressions, where the parametric values for Equations (9)–(11) are listed in Table 2.

4. Results and Discussion

In this section, the presented simulation method was verified through comparisons of the simulated wind pressure coefficients of a single tall building and the approaching wind field with the corresponding experimental data. The effect of corner cutting and chamfering on the tandem arranged twin tower buildings were then investigated in the aspects of the wind pressure distribution and the aerodynamic force coefficients.
The wind pressure coefficient was de-dimensionalized using the following formula:
C P i = P i / 0.5 ρ U H 2
where Pi is the wind pressure at the measuring point i; ρ is the air density; and UH is the incoming wind speed at the model height H. The mean and fluctuating wind pressure coefficients Cpi,mean and Cpi,rms were represented by the mean and root mean square values of Cpi, respectively. The aerodynamic force acting on each layer along the building height can be obtained by integrating the wind pressure at the measurement point of each layer on the building surfaces. The layer drag coefficient CD(zi) and the layer lift coefficient CL(zi) can be obtained as follows:
C D ( z i ) = F D ( z i ) 0.5 ρ U H 2 A ( z i )
C L ( z i ) = F L ( z i ) 0.5 ρ U H 2 A ( z i )
where FD(zi) denotes the layer drag obtained from the wind pressure of layer i, FL(zi) denotes the layer lift obtained from the wind pressure of layer i, and A(zi) denotes the projected area of layer i on the windward side at a height of zi. The meanings corresponding to the abbreviations in the above equations are shown in Table 3.

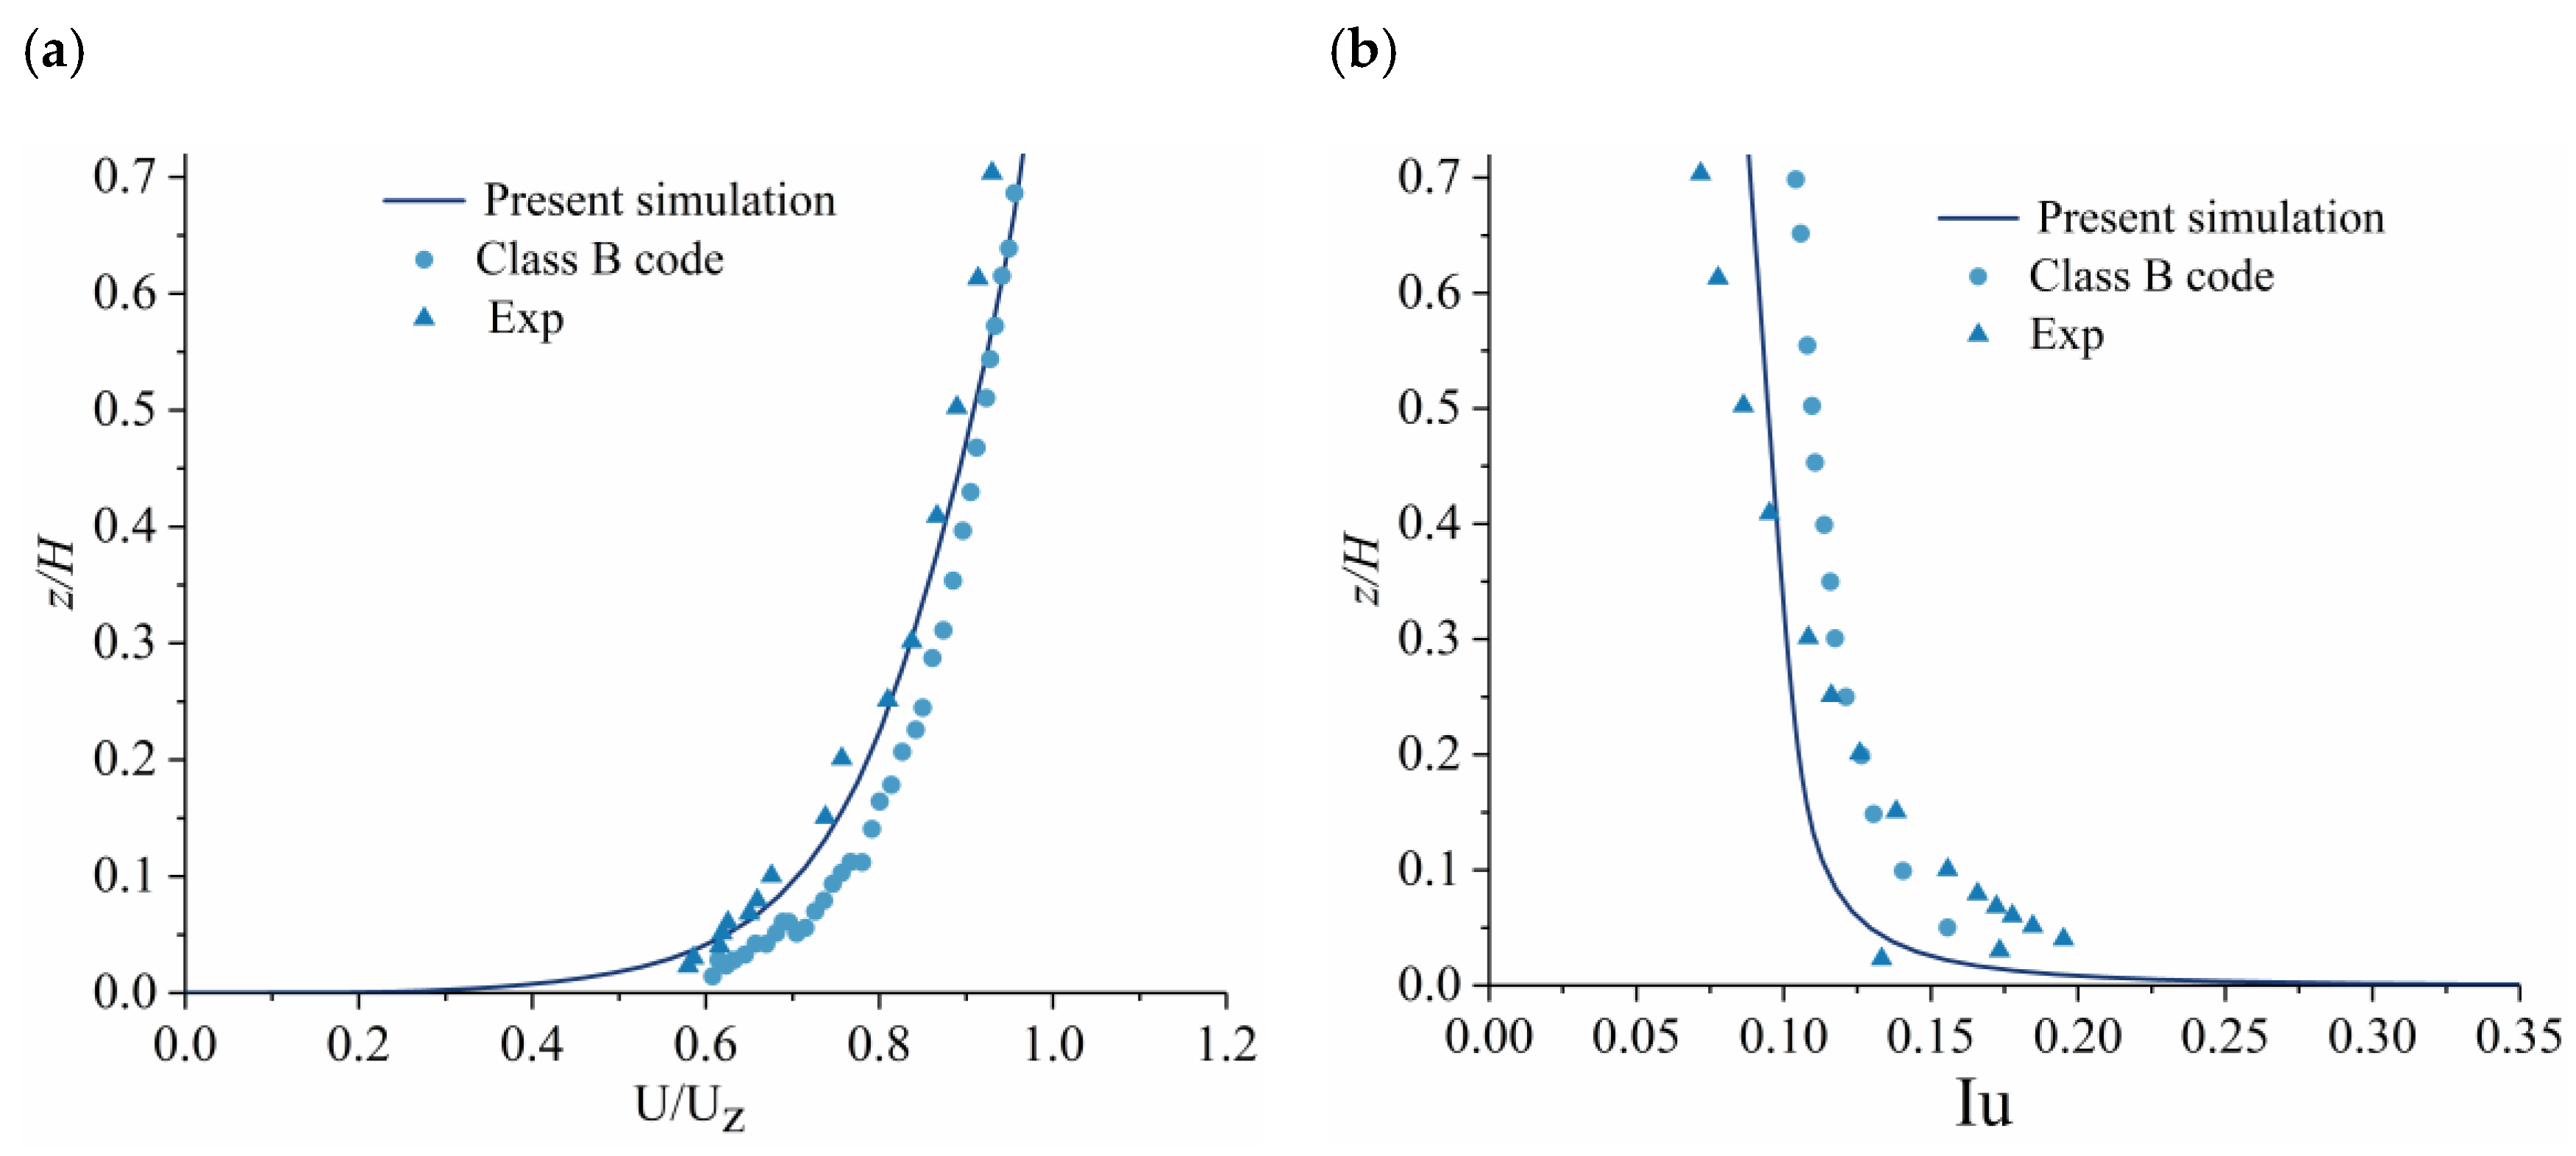
4.1. Validation of the Present Numerical Methods

The flow field around a single tall building contains all the flow phenomena, such as the impinging, the flow separation, and reattachment, for the twin tower building group. Thus, the accuracy of the present numerical method is merely verified by comparing the simulated wind pressure coefficients at 2/3H height and the simulated wind flow fields of the single square-section tall building model with the corresponding wind tunnel test data [25].
As for the numerical simulation method, mesh independence needs to be verified to ensure the reliability and accuracy of the simulation results, which refers to the fact that the simulation results do not vary much with different mesh densities. In the present study, three meshes described above were considered for the mesh independence verification. As shown in Figure 2, the simulation results for the three types of meshes are basically in accordance with the wind tunnel test values, indicating that the simulation results would not be affected by the meshes and met the requirements of the mesh-independence validation. In particular, both the mean and fluctuating wind pressures coefficients of Mesh 3 (a fine mesh with y+ less than 5.0) agree well with the experimental data. Therefore, the following study was based on the M3 scheme. Figure 3 presents a comparative analysis of the mean wind velocity and turbulence profile of Class B wind field for the standard tall building among the results of present numerical simulation, the wind tunnel test data and the Chinese Lode Code [28]. The mean wind velocity U(z) and turbulence intensity Iu (defined by I u = σ u / U ( z ) , where σ u is the r.m.s value of the stream-wise fluctuating velocity) of the measurement position that located at 5D in front of the square building are extracted from the recorded time histories of the simulated wind speeds. It can be observed from Figure 3 that the simulated wind profiles can reflect the variation trend of both the mean wind velocity and the turbulent intensity along with the height above the ground, despite some discrepancies for the turbulent intensity.

4.2. Wind Pressure Coefficients

Figure 4 illustrates the comparisons of the simulated mean and fluctuating wind pressure coefficients distributed at 2/3H height above the ground for the tandem square-section tall buildings. In general, the wind pressure distributions are basically consistent for the tandem tall buildings with and without considering corner modification to the upstream building. The difference mainly materializes around the corner zone with abrupt changes observed for both the mean and fluctuating wind pressure coefficients.
As for the mean wind pressure coefficients, the upstream building presents a positive value in the windward direction and negative values in the lateral and leeward directions, indicating that the flow separation and wake flow effect on the leeward side of the upstream building is manifested as wind suction. In addition, the negative pressure intensity on the leeward side of the upstream building is the largest for the standard tandem case, followed by the chamfering and cutting tandem cases.
The highest wind pressure and wind suction on the windward and leeward sides account for the largest mean drag coefficient for the upstream tall building in the standard tandem case. Specifically, there is a sudden change in the value of the mean wind pressure coefficient in the corner modification region of the upstream building for all three cases, where the large negative pressure values are Cp,mean = −1.8, −1.1, and −1.1 at the windward corner departure point (xp/D = 1.08) for the standard, chamfering, and cutting tandem cases, respectively. An abrupt change in the mean wind pressure coefficient (xp/D changes from 2.76 to 2.84, corresponding to a change in Cp,mean from −1.39 to −0.24) can also be observed for the upstream building of the chamfering tandem case, while it is not that remarkable for the other two cases. The above difference is due to the effect of corner modification on the flow field around the upstream building, which will be discussed in Section 4.4. The flow field difference can also be observed from the mean wind pressure distribution on the downstream building. There are remarkable reductions in the mean wind pressure coefficients on each surface of the downstream building in comparison with the upstream building. Significant differences occur at the windward side of the downstream building for all the three cases, among which the value of the cutting tandem case is the smallest, indicating the most remarkable influence on the flow field achieved by applying the corner-cutting method on the upstream building.
The fluctuating wind pressure coefficients, depicted in Figure 4b, present a similar phenomenon of abrupt changes in wind pressure coefficients in the corner modification regions of the upstream building. In the modified region of the leading edge corners of the upstream tall building (xp/D = 1.08), all the three cases show extreme values of fluctuating wind pressure coefficients, which are 0.38, 0.28, and 0.30 for the standard tandem, chamfering tandem and cutting tandem cases, respectively. As for the cutting tandem case, an extreme fluctuating wind pressure coefficient value could also be observed with Cp,rms = 0.50 at the leading edge corners (xp/D = 1.32), where extreme values for the negative mean wind pressure also exist. For the chamfering tandem case, two peak values of Cp,rms = 0.34 and 0.12 are found in the modified region of xp/D = 2.76 and 2.84, respectively, at the downstream corner of the upstream building. Similarly, the standard tandem case also presents a large value of 0.36 at xp/D = 3.0 for the upstream tall building. As for the fluctuating wind pressure coefficients of the downstream building without corner modification, the values of Cp,rms are all larger than those on the upstream building in the standard tandem case. Compared with the Cp,rms values of the upstream standard tall building, the Cp,rms values of the downstream tall buildings increased by 25.8%, 20.4%, and 7.8%, respectively. In addition, the Cp,rms values of the downstream buildings are also different for the three cases, where the smallest value occurs for the cutting tandem case. The above difference is because corner modification on the upstream building will affect the location of the flow separation point, the shear flow diffusion angle, and the flow reattachment, which will be further explained in the flow field analysis in the following section.

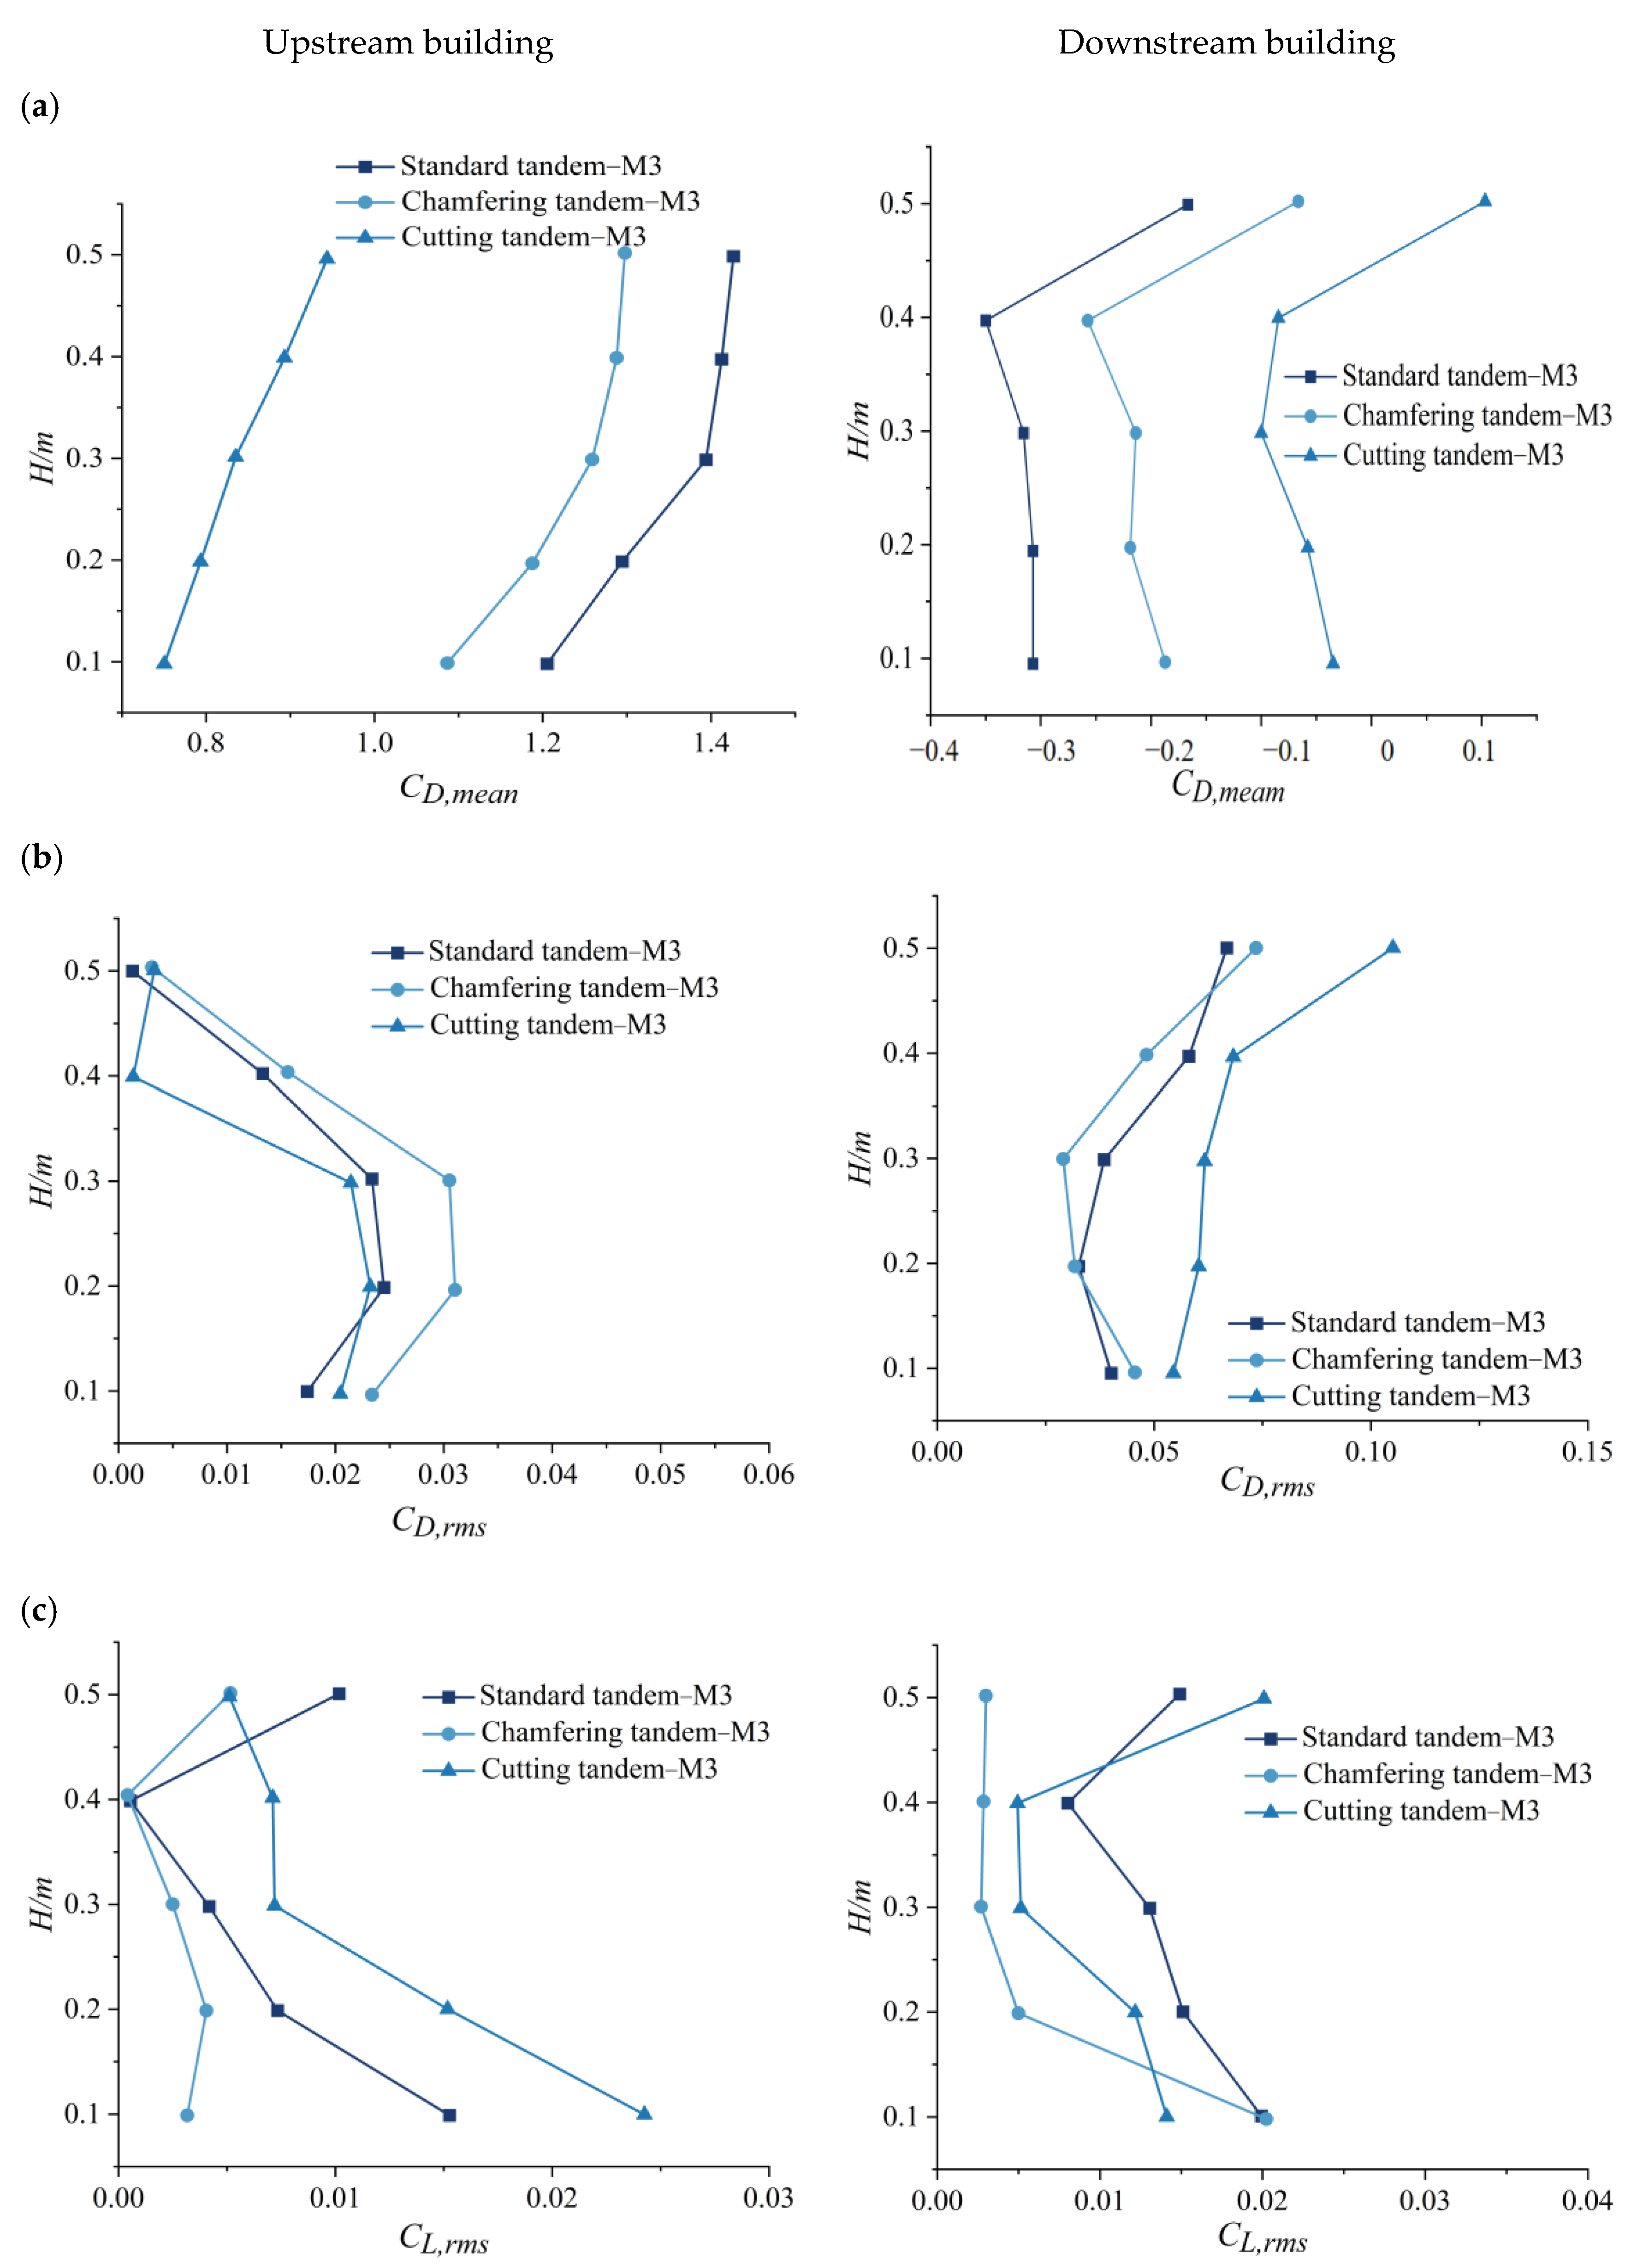
4.3. The Aerodynamic Force Coefficients

The aerodynamic force coefficients represent the overall wind effects on the building. In this section, variations in the statistical values of the aerodynamic force coefficients with height above the ground are compared to further study the influence of corner modification on the wind loads on the square-section tandem tall buildings. Figure 5 shows comparisons of the layer drag coefficient CD(zi) and the layer lift coefficient CL(zi), which are defined by Equations (13) and (14), respectively.
As can be seen from Figure 5a, the mean drag coefficients vary with the height above the ground for all three cases. A positive value of CD,mean is observed for the upstream building, while a negative value is seen for the downstream building. Among the three cases, the mean drag coefficients of the upstream building present the largest values with CD,mean = 1.3 ± 0.1 for the standard tandem case. The smallest CD,mean value occurs for the cutting tandem case with CD,mean = 0.85 ± 0.1, and the reduction compared to the standard tandem case reaches up to 0.45. Sheltered by the upstream building, the mean drag coefficients are negative values, while comparisons of the absolute values of CD,mean are similar to the upstream building for all three cases. As for the fluctuating drag coefficient, shown in Figure 5b, the difference is not as notable as the mean drag coefficient. However, the influence of corner modification can still be observed, especially for the cutting tandem case, which presents the smallest value of CD,rms for the upstream building while having the largest value for the downstream building. In addition, the most significant difference in the fluctuating drag coefficient occurs at the top region for the downstream building, where CD,rms = 0.10 for the cutting tandem case.
Due to the symmetry of the horizontal section and the incidence angle of the approaching wind, the mean lift coefficients are zero for the two buildings; thus, only the fluctuating lift coefficients are analyzed in this study. As shown in Figure 5c, the chamfering tandem case presents the lowest value (nearly zero) for the fluctuating lift coefficients for both the upstream and downstream buildings. The largest CL,rms values are seen in the cutting tandem case for the upstream building, while the largest value overall is still for the standard tandem case.

4.4. Flow Field Analysis

The advantage of CFD simulation is the capability of conducting wind load distribution analysis based on the simulated wind flow field around the buildings. In this section, the time-averaged flow field and the instantaneous vortex structure around the tower buildings are discussed.

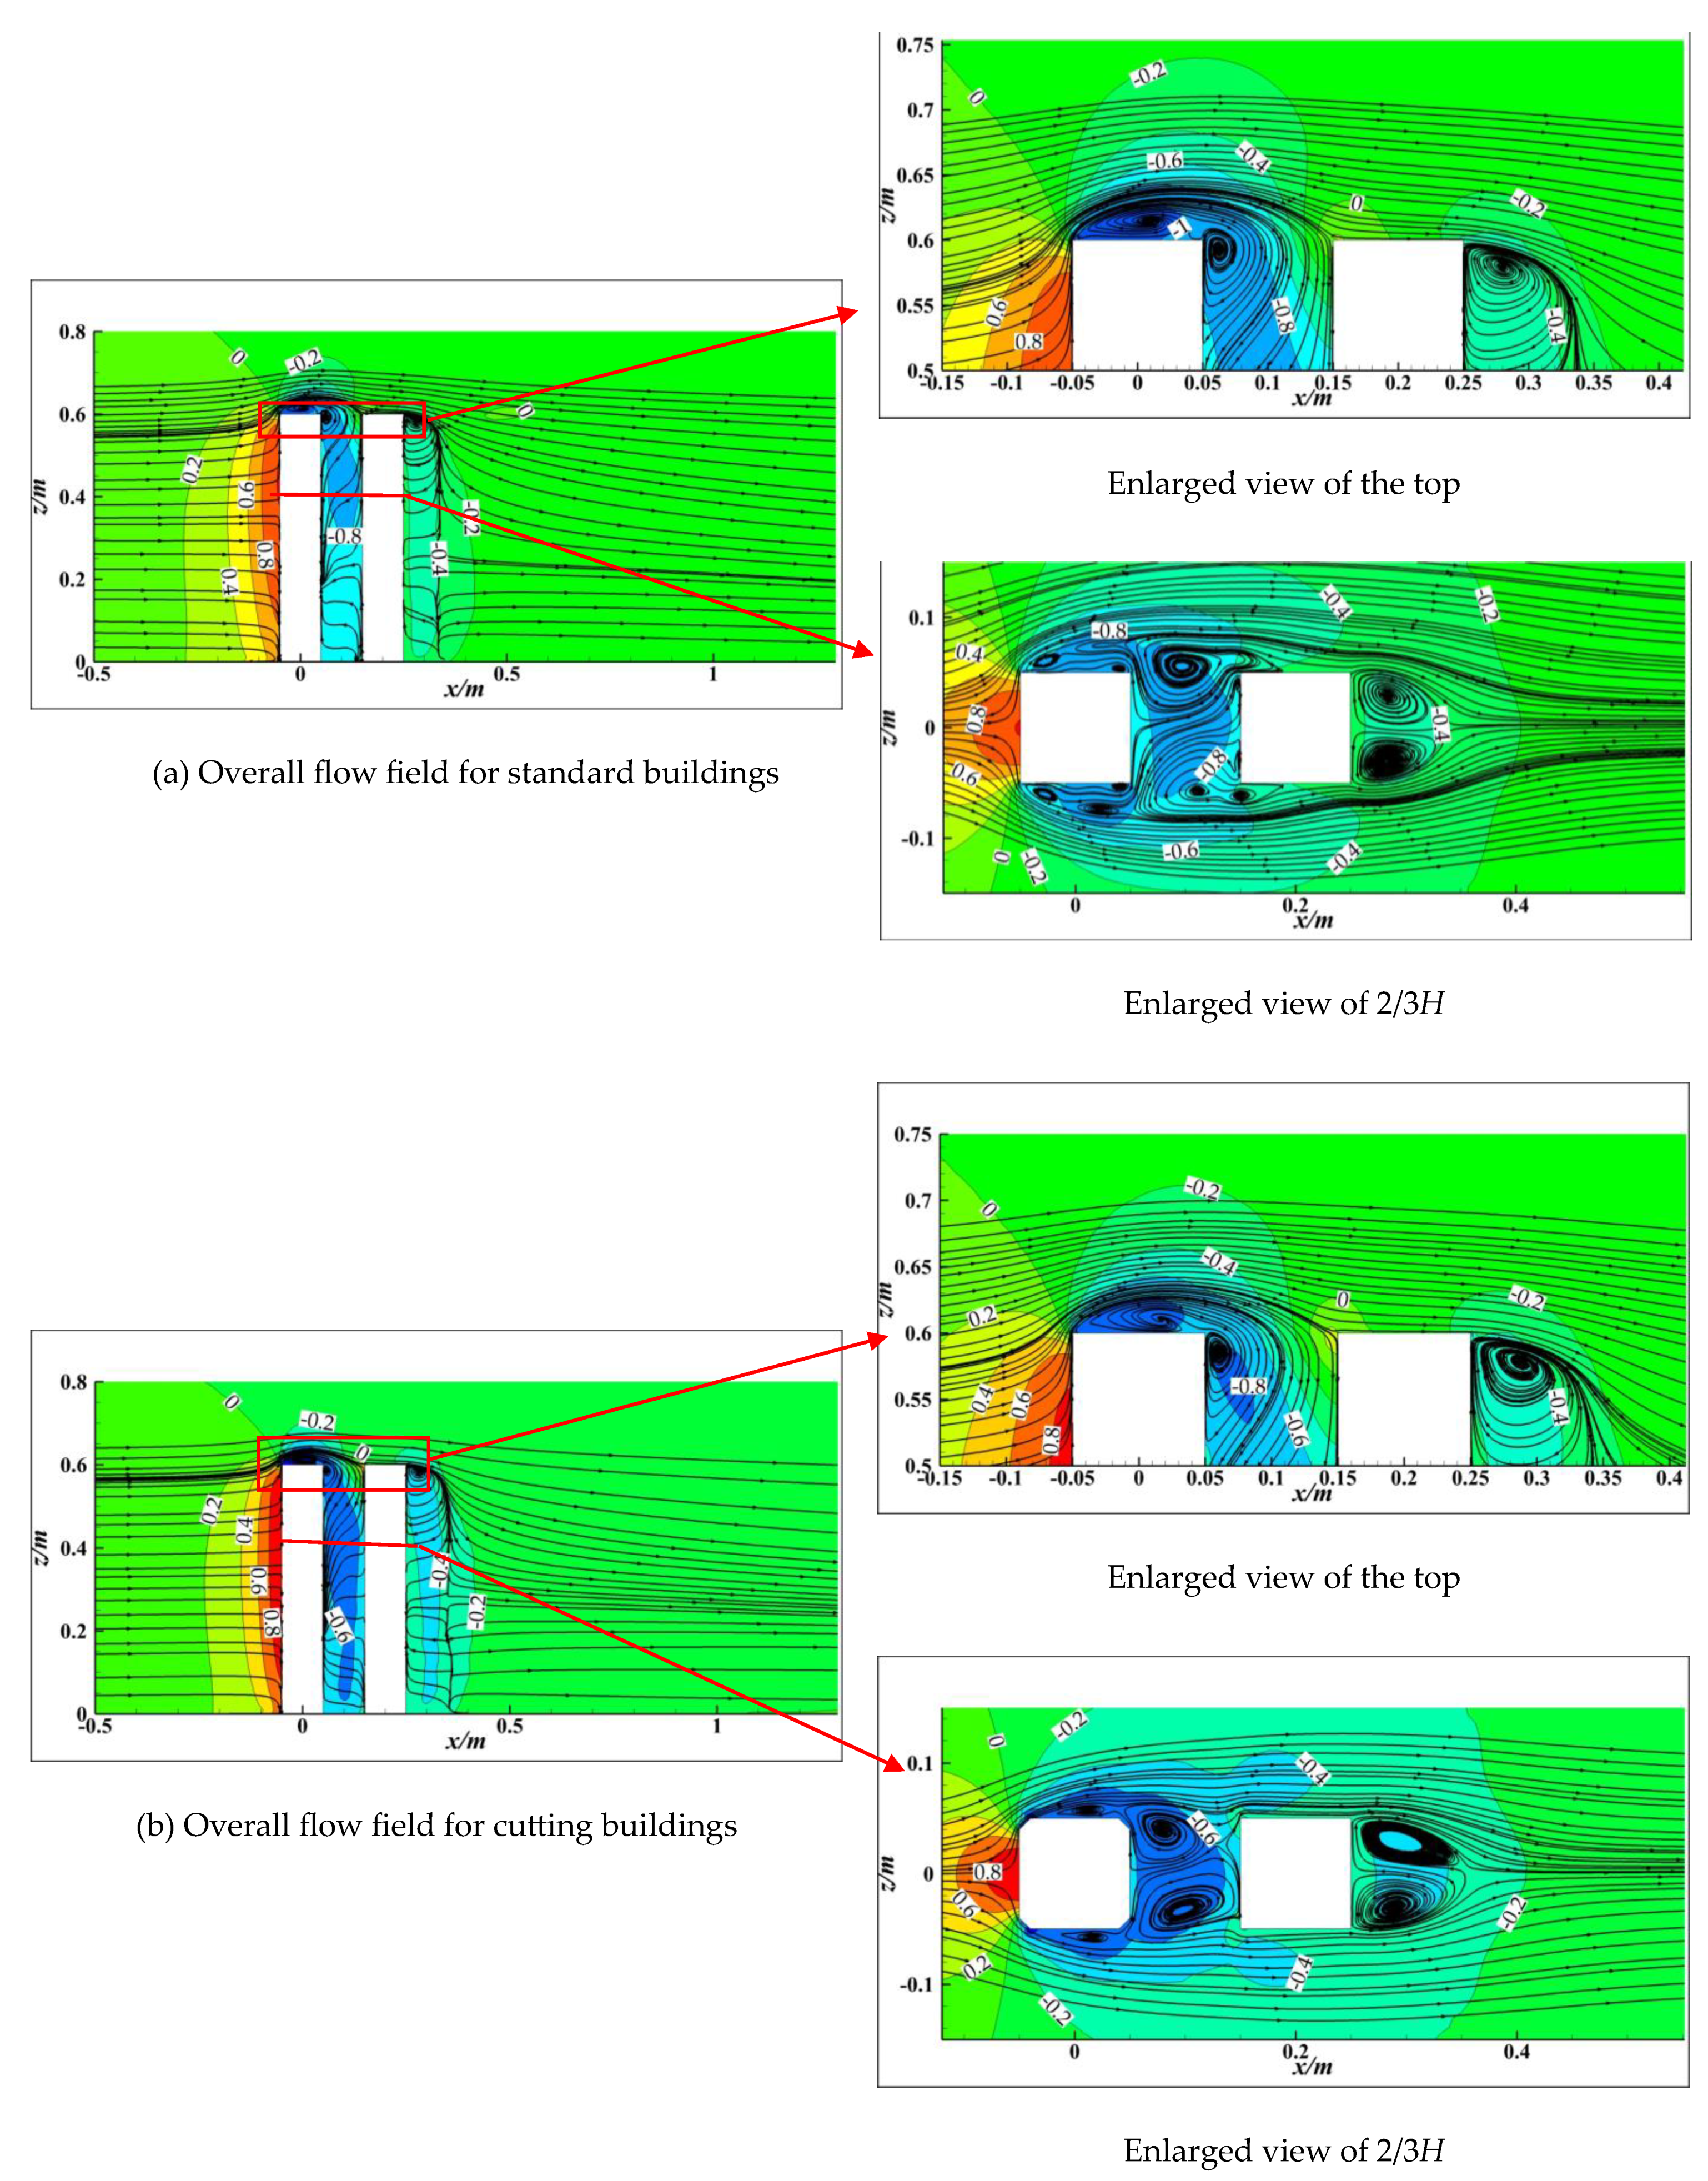
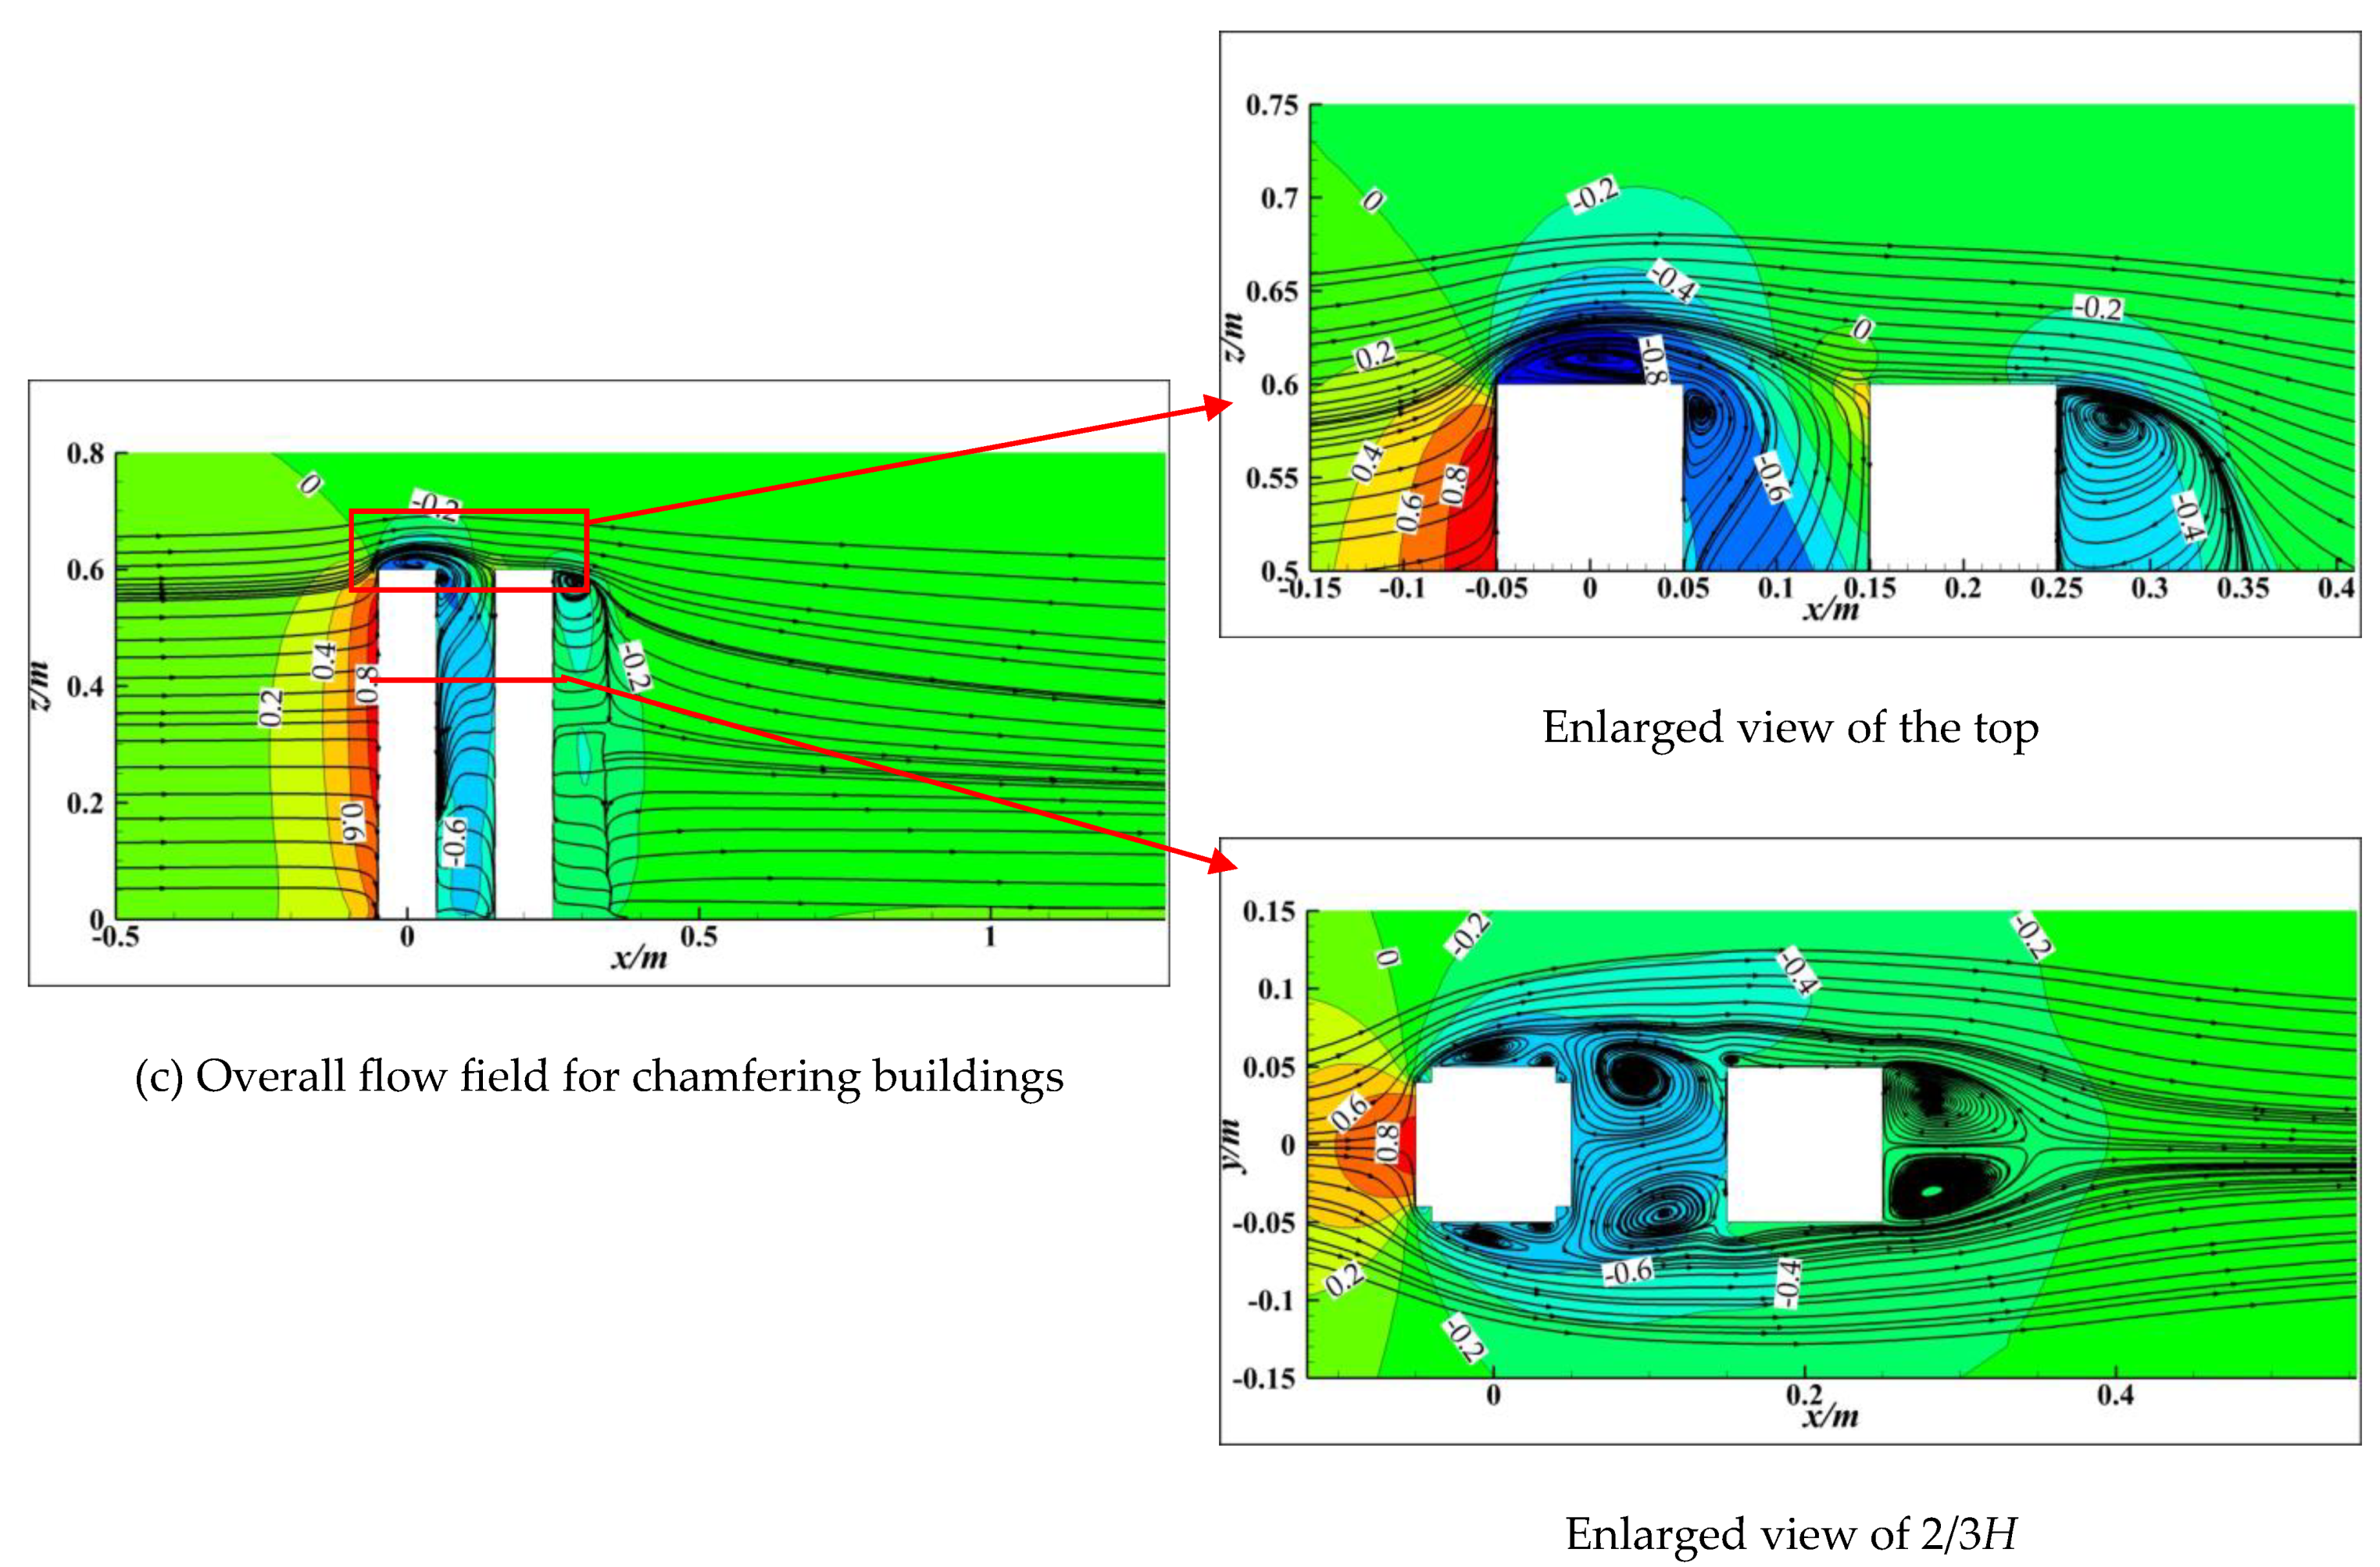
4.4.1. Time-Averaged Flow Field

Figure 6 depicts the time-averaged streamlines at the z = 2/3H height horizontal and y = 0 longitudinal sections for the above three cases. The time-averaged flow field for the three cases is basically consistent in the top region. This is because the approaching flow is mainly blocked by the windward surface under the present wind angle of attack, and corner modifications are performed only on the two vertical leading edges. As for the time-averaged flow field at the horizontal section of z = 2/3H, the flow separates at the upstream corners for all cases. However, the diffusion angle of the flow separated from the two vertical leading edges of the upstream building are significantly different. Specifically, the largest diffusion angle can be observed for the standard tandem case, while the smallest is found for the cutting tandem case. The reason for the diffusion angle difference is because it has the sharpest corner and correspondingly the strongest flow separation at the leading edges of the upstream building for the standard tandem case. As a result, the core of the separated flow becomes closer to the side surface of the upstream building with corner modification, which is especially remarkable for the cutting tandem case. Strong flow separation leads to notable wind suction, and thus the largest negative wind pressure coefficient appears at the side and leeward surface for the standard tandem case, while the smallest is observed in the cutting tandem case as shown in Figure 4.
Since the two buildings are adjacent to each other, the downstream building is basically immersed in the upstream building’s wake region, where two notable re-circulation zones exist. Affected by the re-circulation zones, negative wind pressure coefficients occur even on the windward surface of the downstream building (as shown in Figure 4a). Strong wind suction is accompanied by a large re-circulation zone. Due to the above diffusion angle difference, the re-circulation zone’s size, which can be reflected by the core spacing between the two re-circulation zones in the wake, are also different for the three cases. It can be observed from Figure 6 that the core spacing is 1.20D for the standard tandem case without corner modification. By contrast, the core spacing decreases to 0.80D and 0.88D for the cutting tandem and chamfering tandem cases, respectively. Therefore, the largest wind suction on the windward surface of the downstream building is observed for the standard tandem case, whereas the smallest value is for the cutting tandem case. Since there is no significant difference in the re-circulation zones in the downstream wake region, the largest and smallest values of the mean drag force coefficient (shown in Figure 5) appear for the standard tandem and cutting tandem cases, respectively.

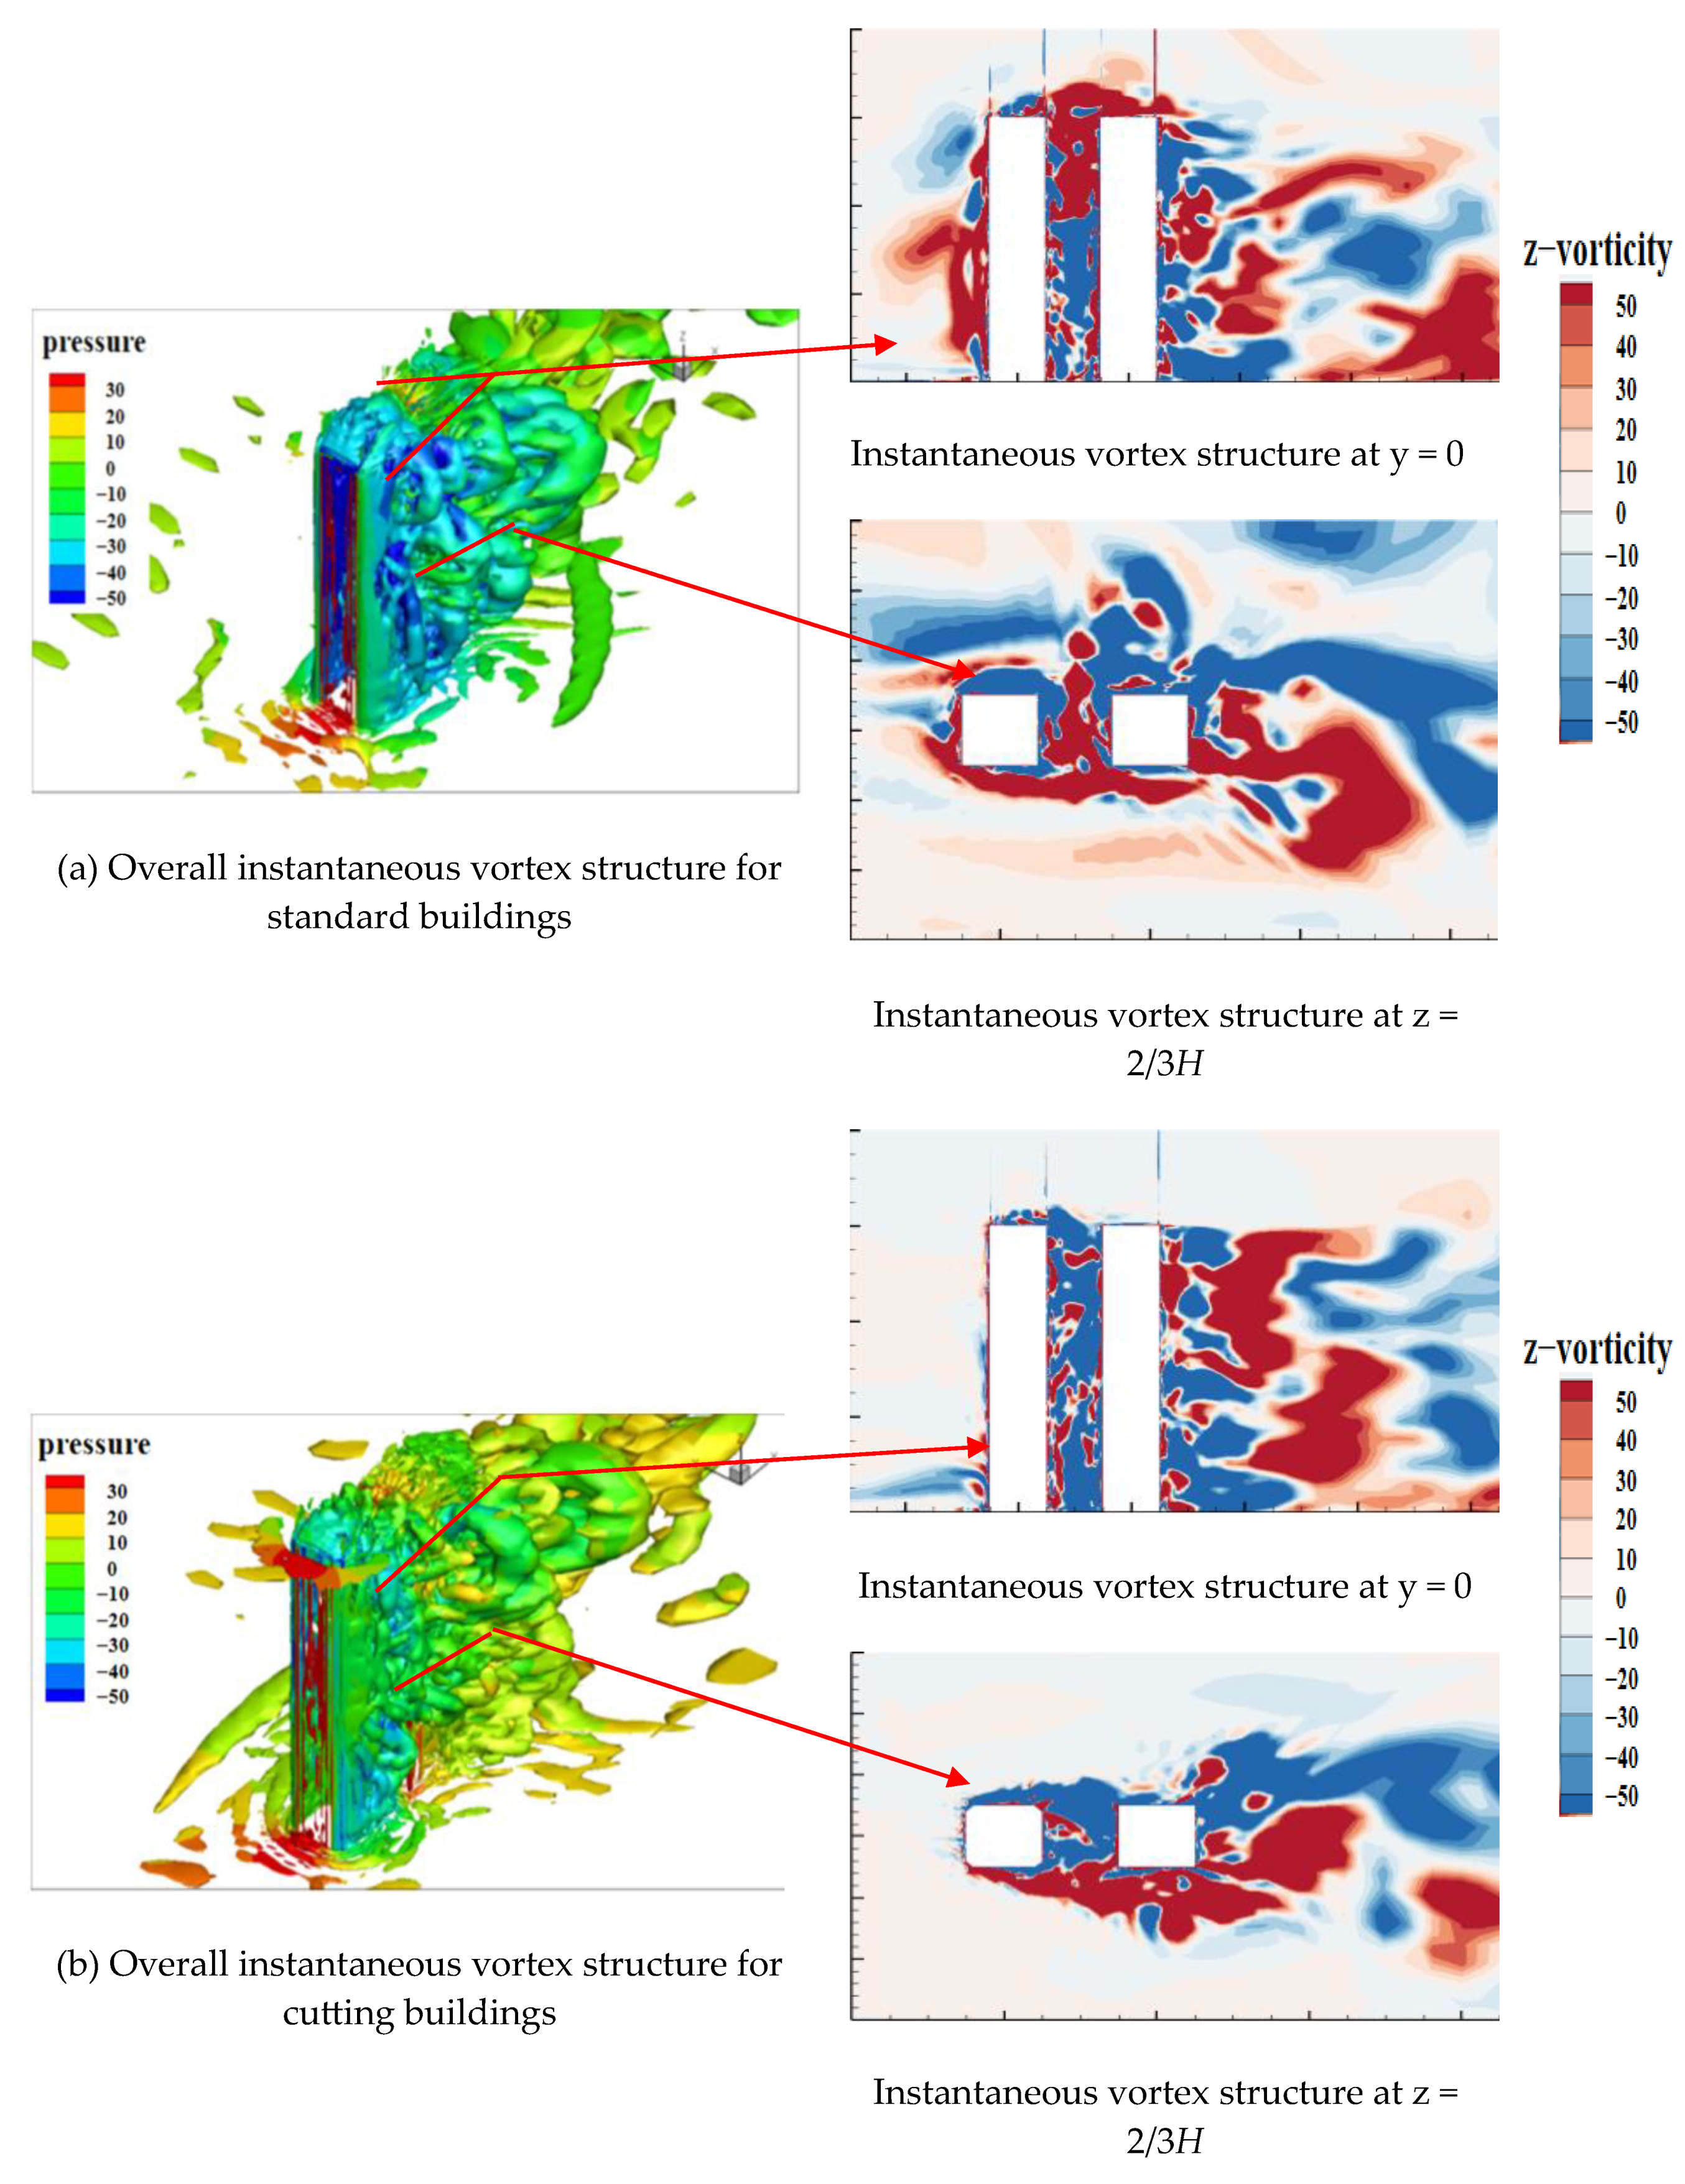
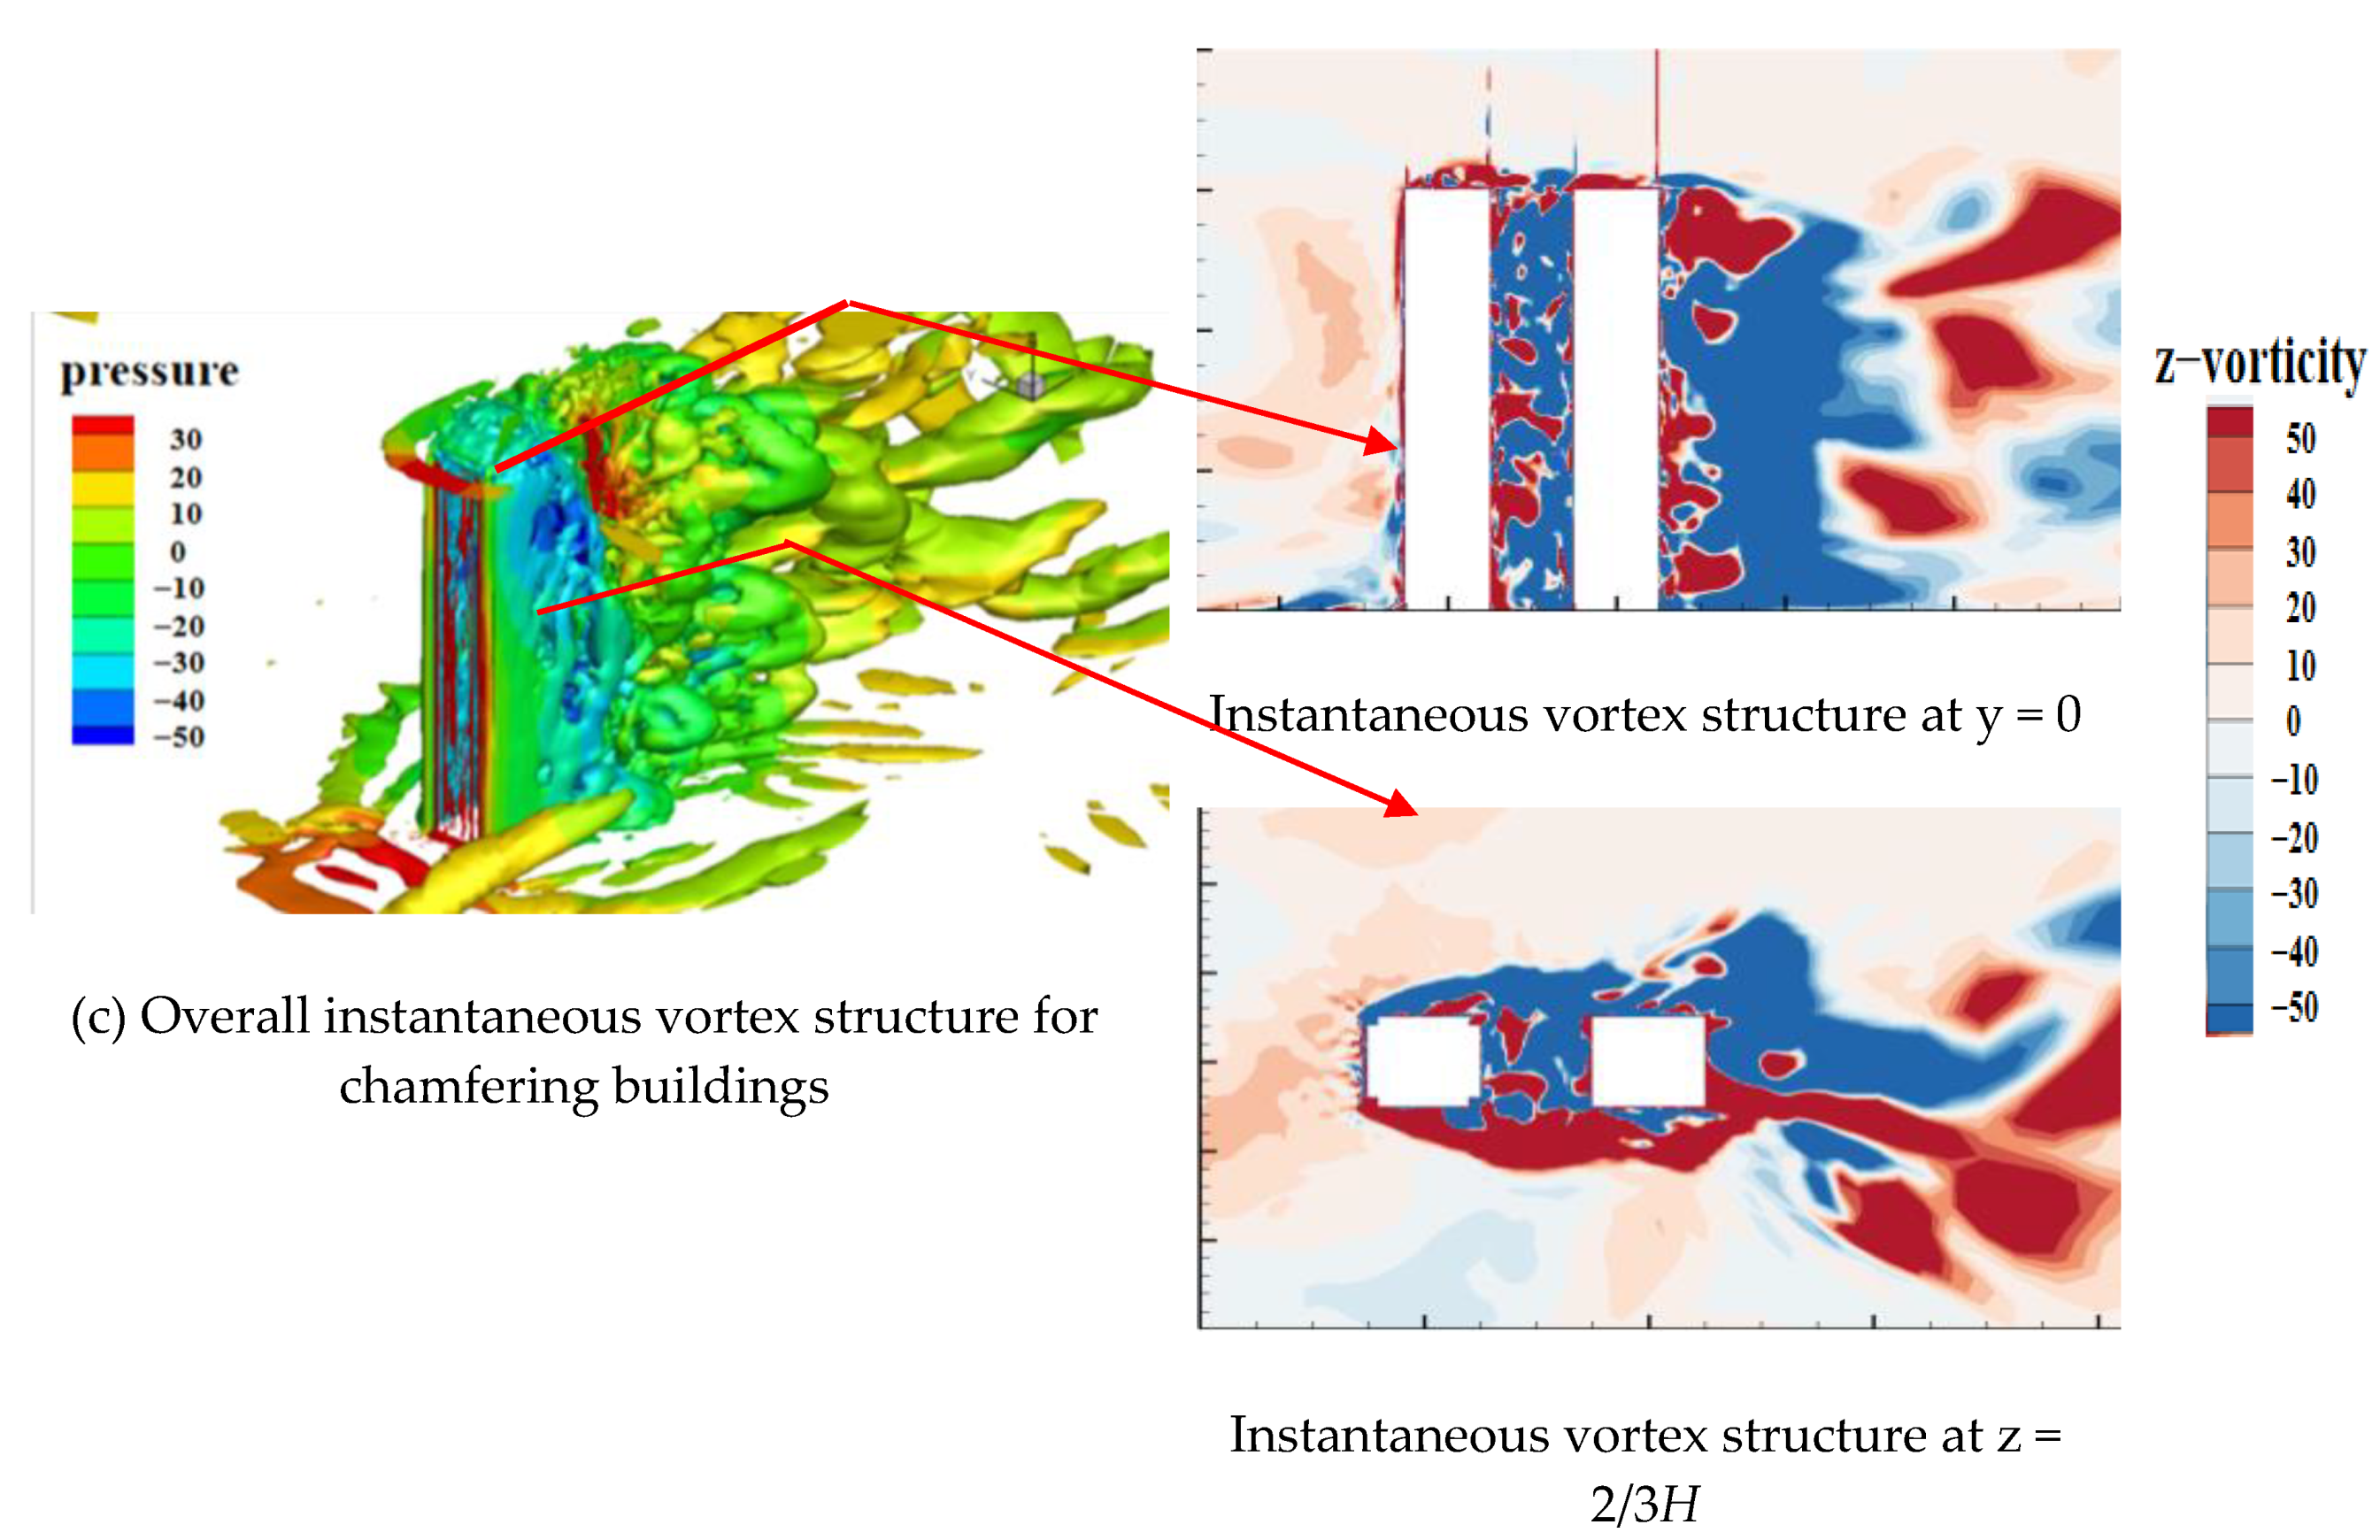
4.4.2. Instantaneous Vortex Structure

The instantaneous vortex around the tandem tall buildings is depicted in Figure 7, where the three-dimensional eddies are presented by the Q-criterion. The 3D vortex structure within the transient flow field is revealed through the extraction of the Q = 4(UH/B)2 iso-surface, where Q represents the second invariant of the velocity gradient tensor.
Q = 1 2 ( | | Ω | | 2 | | S | | 2 )
Specifically, Ω and S stand for the positive and antisymmetric components of the velocity gradient tensor, corresponding to local vortices and shear strain rates, respectively. In this study, the value of fixed Q is set to be 3000. In addition, the vortex structures are also illustrated for the z = 2/3H horizontal height and y = 0 longitudinal sections at the same time.
Figure 7 illustrates the presence of numerous eddies of varying scales, which collectively create a complex three-dimensional flow around the tall buildings. The strip eddy separates from the top of the windward surface of the upstream building. This eddy subsequently interacts with the separation eddies on the two side surfaces, resulting in the formation of a three-dimensional separating shear eddy. Due to the small spacing between the two buildings, the downstream building is almost totally covered by the separated eddies from the upstream building. In contrast with the standard tandem case, the separation eddies on the sides of the upstream building are closer to the building surfaces and accompanied by the generation of abundant small-scale eddies, when adopting corner modification on the upstream building. In addition, the separation eddies from the upstream building reattach at the downstream building, reducing not only the turbulent intensity of the flow but also increasing the concentration of the separation eddies around the downstream building for the cutting tandem and chamfering tandem cases. In the wake of the downstream building, there exists alternate vortex shedding for all three cases. Stronger regularity can be observed for the chamfering tandem case, while relatively complex vortex shedding is found for the cutting tandem case with more dispersed energy distribution and weaker fluctuating intensity. The configuration of the upstream building significantly influences the vortex distribution and the scale of eddies around the buildings, thereby affecting the wind pressure on both upstream and downstream buildings. Large-scale eddies, which carry more energy, tend to induce higher mean wind pressure. In contrast, small-scale eddies are more likely to generate substantial fluctuations in wind pressure. Consequently, the interaction between the eddy scales and the building’s aerodynamic configuration plays a crucial role in determining the wind pressure dynamics in the vicinity of the buildings.

5. Conclusions

(1)
Large eddy simulation was integrated with equilibrium IBC expressions to generate inflow turbulence models. This approach has been validated for its effectiveness in predicting the mean and fluctuating wind pressure coefficients on three-dimensional tall buildings immersed in the atmospheric boundary layer.
(2)
The variations in the wind pressure coefficient for tandem buildings, regardless of whether or not the upstream building has corner modifications, are generally similar. However, notable differences occur in the mean and fluctuating wind pressure coefficients, specifically at the regions where corner modifications are implemented. These corner modification measures are particularly effective at reducing the overall wind pressure around tall buildings, with the most significant impact being observed on the side and leeward surfaces. Among the various modification techniques, corner-cutting proves to be the most effective. Furthermore, corner cutting on the upstream building significantly reduces the drag coefficients for both the upstream and downstream buildings.
(3)
In the context of tandem tall buildings, the implementation of upstream corner cutting and chamfering measures plays a crucial role in influencing the shear flow diffusion angle at the upstream leading edges. These modifications significantly impact the separation and reattachment of the flow that has separated upstream, subsequently affecting the downstream tall building. The primary outcome of these influences is a reduction in wind pressure coefficients on the surfaces of the tall buildings, which consequently alters the aerodynamic coefficients. Notably, the upstream corner cutting measure proves to be more effective than chamfering in minimizing flow separation and reattachment, thereby further reducing the surface wind pressure.
In this study, the LES method was used to analyze the wind loads around different corner modifications made to tandem high-rise buildings, to explore the influence mechanism and to draw conclusions. However, some problems still persist that must be considered, which require further research for in-depth exploration. In comparison to the corner modification measures, the wind load of the twin tower buildings is sensitive to the spacing ratio between the two buildings, which affects the interference effect remarkably. In addition, wind-induced vibration related to comfort issues is important for high-rise buildings, and the influence of corner modification on the wind-induced vibration also needs to be clarified in further studies. In addition, with the rapid development of computational techniques, numerical simulation methods are becoming more commonly used for solving various wind field problems. Table 4 briefly summarizes the prevailing numerical simulation methods.

Author Contributions

Conceptualization, D.Z. and Y.Z.; methodology, D.Z.; software, X.W.; validation, X.W. and Y.Z.; formal analysis, X.W.; investigation, P.F.; resources, D.Z.; data curation, Y.Z.; writing—original draft preparation, X.W.; writing—review and editing, D.Z.; visualization, X.W.; supervision, W.M.; project administration, D.Z.; funding acquisition, D.Z. All authors have read and agreed to the published version of the manuscript.

Funding

This research was iointly funded by the National Natural Science Foundation of China (Grant Nos. 52278511 and 51408196) and the Young Backbone Teacher Cultivation Program of Henan University of Technology.

Institutional Review Board Statement

Not applicable.

Informed Consent Statement

Not applicable.

Data Availability Statement

The authors confirm that the data supporting the findings of this study are available within the article.

Conflicts of Interest

The authors declare no conflict of interest.

References

  1. Cooper, K.; Nakayama, M.; Sasaki, Y.; Fediw, A.; Resende-Ide, S.; Zan, S.J. Unsteady Aerodynamic force measurements on a super-tall building with a tapered cross section. J. Wind. Eng. Ind. Aerodyn. 1997, 72, 199–212. [Google Scholar] [CrossRef]
  2. Zhang, W.; Chen, X.; Yang, H.; Liang, H.; Wei, Y. Forced convection for flow across two tandem cylinders with rounded corners in a channel. Int. J. Heat Mass Transf. 2019, 130, 1053–1069. [Google Scholar] [CrossRef]
  3. Xiaoqing, D.; Xinxin, T.; Wenyong, M.; Erdong, L. Effects of rounded corner on aerodynamics of square cylinders and its flow mechanisms. Chin. J. Theor. Appl. Mech. 2018, 50, 1013–1023. [Google Scholar]
  4. Xie, J. Aerodynamic optimization of super-tall buildings and its effectiveness assessment. J. Wind. Eng. Ind. Aerodyn. 2014, 130, 88–98. [Google Scholar] [CrossRef]
  5. Gu, M.; Quan, Y. Across-wind loads of typical tall buildings. J. Wind. Eng. Ind. Aerodyn. 2004, 92, 1147–1165. [Google Scholar] [CrossRef]
  6. Hui-lan, C.; Yong, Q.; Ming, G. Effect of corner-cut and tapering on across-wind aerodynamic damping of square high-rise buildings. Eng. Mech. 2013, 30, 87–93,100. [Google Scholar]
  7. Kawai, H. Effect of corner modifications on aeroelastic instabilities of tall buildings. J. Wind. Eng. Ind. Aerodyn. 1998, 74, 719–729. [Google Scholar] [CrossRef]
  8. Wijesooriya, K.; Mohotti, D.; Lee, C.-K.; Mendis, P. A technical review of computational fluid dynamics (CFD) applications on wind design of tall buildings and structures: Past, present and future. J. Build. Eng. 2023, 74, 106828. [Google Scholar] [CrossRef]
  9. Feng, C.; Gu, M.; Zheng, D. Numerical simulation of wind effects on super high-rise buildings considering wind veering with height based on CFD. J. Fluids Struct. 2019, 91, 102715. [Google Scholar] [CrossRef]
  10. Cao, Y.; Tamura, T. Large-eddy simulations of flow past a square cylinder using structured and unstructured grids. Comput. Fluids 2016, 137, 36–54. [Google Scholar] [CrossRef]
  11. Lu, B.; Li, Q.; Wang, X.; Han, X.; He, J. Large eddy simulation of wind pressures on a 600-m-high skyscraper and comparison with field measurements during super myphoon mangkhut. J. Build. Eng. 2024, 92, 109750. [Google Scholar] [CrossRef]
  12. Hariprasad, C.; Ajith Kumar, R.; Dahl, J.; Sohn, C.H. Flow Structures around a Square Cylinder: Effect of Corner Chamfering. J. Aerosp. Eng. 2024, 37, 04024021. [Google Scholar] [CrossRef]
  13. Huang, G.; Fan, Y.; Chen, X.; Yang, X.; Li, Z. Predicting crosswind response of tall buildings: Base isolation and nonlinear aeroelastic effects. Eng. Struct. 2024, 305, 117722. [Google Scholar] [CrossRef]
  14. Jafari, M.; Alipour, A. Review of approaches, opportunities, and future directions for improving aerodynamics of tall buildings with smart facades. Sustain. Cities Soc. 2021, 72, 102979. [Google Scholar] [CrossRef]
  15. Qun, Y.; Huitao, Z.; Xiaobin, L. Study on fluctuating pressure distribution and aerodynamic force of flows around two square cylinders in tandem arrangement. Build. Struct. 2020, 50, 140–144. [Google Scholar]
  16. Liu, T.; Zhou, L.; Huang, D.; Zhang, H.; Wei, C. Aspect ratio and interference effects on flow over two rectangular cylinders in tandem arrangement. Ocean Eng. 2023, 271, 113731. [Google Scholar] [CrossRef]
  17. Xie, Z.; Gu, M. Wind-induced interference effects between two arbitrarily arranged prisms. Tumu Gongcheng Xuebao 2005, 38, 32–38. [Google Scholar]
  18. Shao, J.; Shu, C.; Liu, N.; Zhao, X. Numerical investigation of vortex induced rotation of two square cylinders in tandem arrangement. Ocean Eng. 2019, 171, 485–495. [Google Scholar] [CrossRef]
  19. Wang, H.-F. Three dimension characteristics of finite-length bluff body wake. J. Cent. South Univ. 2011, 42, 495–500. [Google Scholar]
  20. Wang, H.-F.; Yang, F.; Zou, C. Effects of boundary layer conditions on aerodynamic forces of a finite-length square prism. J. Vib. Shock 2016, 35, 39–46. [Google Scholar] [CrossRef]
  21. Du, X.; Shi, D.; Dong, H.; Liu, Y. Flow around square-like cylinders with corner and side modifications. J. Wind. Eng. Ind. Aerodyn. 2021, 215, 104686. [Google Scholar] [CrossRef]
  22. Zheng, D.-Q.; Gu, M.; Zhang, A.-S.; Zhang, J.-G. Large eddy simulation of flow around a single square building model with 1: 1: 6 shape. Zhendong Yu Chongji 2011, 30, 96–100. [Google Scholar]
  23. Mathey, F.; Cokljat, D.; Bertoglio, J.P.; Sergent, E. Assessment of the vortex method for large eddy simulation inlet conditions. Prog. Comput. Fluid Dyn. Int. J. 2006, 6, 58–67. [Google Scholar] [CrossRef]
  24. Li, L.; Zheng, D.; Chen, G.; Fang, P.; Ma, W.; Tang, S. Large eddy simulation of flow over a three-dimensional hill with different slope angles. Front. Earth Sci. 2023, 18, 98–111. [Google Scholar] [CrossRef]
  25. Zheng, D.Q.; Zhang, A.S.; Gu, M. Improvement of inflow boundary condition in large eddy simulation of flow around tall building. Eng. Appl. Comput. Fluid Mech. 2012, 6, 633–647. [Google Scholar] [CrossRef]
  26. Tominaga, Y.; Mochida, A.; Yoshie, R.; Kataoka, H.; Nozu, T.; Yoshikawa, M.; Shirasawa, T. AIJ guidelines for practical applications of CFD to pedestrian wind environment around buildings. J. Wind. Eng. Ind. Aerodyn. 2008, 96, 1749–1761. [Google Scholar] [CrossRef]
  27. Franke, J. The European Cost Action 732–quality assurance and improvement of micro-scale meteorological models. In Proceedings of the Seventh Asia-Pacific Conference on Wind Engineering, Taipei, Taiwan, 8–12 November 2009. [Google Scholar]
  28. GB 50009-2012; Load Code for the Design of Building Structures. China Architecture & Building Press: Beijing, China, 2012.
Figure 1. Computational domain and boundary condition settings (a); meshes for the standard (b), corner-cut (c), and chamfered tandem buildings (d); and mesh sketches of the domain (e) and the buildings (f).
Atmosphere 15 01540 g001
Figure 2. Comparisons of the simulated mean (a) and fluctuating (b) wind pressure coefficients with the experimental data for the single square tall building model.
Atmosphere 15 01540 g002
Figure 3. Comparisons of the simulated mean wind profile (a) and turbulent intensity profile (b) with the experimental wind profiles.
Atmosphere 15 01540 g003
Figure 4. Comparisons of the mean (a) and fluctuating (b) wind pressure coefficients of the upstream and downstream buildings at z = 2/3H for tandem tall buildings with and without corner modification.
Atmosphere 15 01540 g004
Figure 5. Comparisons of the mean drag coefficient (a), the fluctuating drag coefficient (b), and the fluctuating lift coefficient (c) for tandem tall buildings with and without corner modification.
Atmosphere 15 01540 g005
Figure 6. Comparisons of time-averaged flow field around standard (a), cutting (b), and chamfering (c) tandem tower buildings.
Atmosphere 15 01540 g006aAtmosphere 15 01540 g006b
Figure 7. Comparisons of the instantaneous vortex structure around the standard (a), cutting (b), and chamfering (c) tandem tower buildings.
Atmosphere 15 01540 g007aAtmosphere 15 01540 g007b
Table 1. Mesh details for the present numerical cases.
Case NameMinimum Grid SizeTotal Grid Numbersy+
Standard single-M10.005D1,580,000<30
Standard single-M20.001D1,680,000<15
Standard single-M30.0005D1,830,000<5
Standard tandem-M30.0005D2,290,000<5
Cutting tandem-M30.0005D2,290,000<5
Chamfering tandem-M30.0005D2,290,000<5
Table 2. Parametric values for the present turbulent IBC generation method for LES.
ParametersValues
Friction velocity u* (m/s)0.8
Roughness height z0 (m)0.05
Model constant C1−0.27
Model constant C23.16
Table 3. Abbreviations of terms.
AbbreviationCorresponding Physical Quantity
Piwind pressure
Cpi,meanmean wind pressure coefficient
Cpi,rmsfluctuating wind pressure coefficient
FD(zi)layer drag
CD(zi)layer drag coefficient
FL(zi)layer lift
CL(zi)layer lift coefficient
Table 4. Comparison of numerical simulation methods.
TechnologiesExplanationDisadvantages
DNSDirect Numerical Simulation:
This method does not do anything with the transient N-S equations, but solves them directly, so that the full flow field pulsation information can be obtained.
The method is limited to the study of low Reynolds number flows due to the large workload constraints.
RANSReynolds Averaged Navier–Stokes:
This method performs time-averaging of the transient N-S equation and solves the turbulence model for the unclosed terms appearing in the equations after time-averaging
The method does not yield fluctuating information on the surface of structures.
LESLarge Eddy Simulation:
Large energy-carrying eddies are solved directly by the instantaneous N-S equation, while small eddies with dissipative effects are solved by appropriate modeling.
The method is costly to compute and requires high mesh quality.
Disclaimer/Publisher’s Note: The statements, opinions and data contained in all publications are solely those of the individual author(s) and contributor(s) and not of MDPI and/or the editor(s). MDPI and/or the editor(s) disclaim responsibility for any injury to people or property resulting from any ideas, methods, instructions or products referred to in the content.

