Article

Satellite Signatures of Pre-Seismic Atmospheric Anomalies of 6 February 2023 Türkiye Earthquakes

ITC Department, National Institute of R&D for Optoelectronics, 409 Atomistilor Street, P.O. Box MG5, 077125 Magurele, Romania
*
Author to whom correspondence should be addressed.
Atmosphere 2024, 15(12), 1514; https://doi.org/10.3390/atmos15121514
Submission received: 6 November 2024 / Revised: 16 December 2024 / Accepted: 17 December 2024 / Published: 18 December 2024
(This article belongs to the Special Issue Ionospheric Sounding for Identification of Pre-seismic Activity)

Abstract

:
Time series satellite data, coupled with available ground-based observations, enable geophysicists to survey earthquake precursors in areas of strong geotectonic activity. This paper is focused on pre-seismic atmospheric disturbances resulting from the stress accumulated during the seismogenic process related to the 6 February 2023 Kahramanmaras doublet earthquake sequence in Türkiye. We investigated the pre- and post-seismic anomalies of multiple precursors of different spatiotemporal patterns from MODIS Terra/Aqua and NOAA-AVHRR satellite data (air temperature at 2 m height—AT, air relative humidity—RH, and air pressure—AP, surface outgoing long-wave radiation—OLR, and land surface temperature—LST). Pre-seismic recorded anomalies of AT within seven months and OLR within one month before the main shocks suggested the existence of the preparatory process of the Kahramanmaras doublet earthquake. The 8-Day LST_Day and LST_night data evidenced pre-seismic and post-seismic thermal anomalies for both the Pazarcik and Elbistan earthquakes. The results of this study highlight that the spatiotemporal evolution of earthquake precursors can be important information for updating the seismic hazard in geotectonic active areas.

1. Introduction

On 6 February 2023, Türkiye was hit by two destructive surface earthquakes: EQ1-Pazarcik, with a moment magnitude Mw = 7.8 at a depth of approximately 8.6 km, and EQ2-Elbistan Mw = 7.5, at a depth of approximately 7 km, located at about 90 km far of Pazarcik, which occurred along two separate branches of the East Anatolia Fault in the southeastern part at the northern border of Syria at a 9 h interval [1,2]. This doublet earthquake was followed by a large number of aftershocks and it is considered one of the worst natural disasters recorded in Türkiye during the last century in terms of loss of life (more than 50,000 deaths), with more than 130,000 injured people, and urban infrastructure (more than 210,000 destroyed or heavily damaged buildings). As a consequence, left lateral fault ruptures appeared along the East Anatolian Fault between Malatya and Hatay. The distance between these two cities is approximately 320 km [3,4]. Based on a comprehensive set of field and remote sensing observations before the 6 February 2023 earthquake sequence in Türkiye, the surface deformation caused by the underlying faults was observed; the rupture sequence started slowly on the Africa/Arabia plate boundary, propagating from the main Pazarcık and Karasu valley faults, and the Çardak–Sürgü fault, hitting the Arabia/Anatolia boundary, and activated the entire East Anatolian fault system, causing vast destruction [5,6]. Earthquakes (EQs) are recognized as the most devastating natural disasters, responsible for extensive damage to infrastructure and loss of lives. Before moderate and large earthquakes, as a result of energy release due to the accumulation of stress during the seismic preparation period around the epicenters, the Earth may send out precursory signals, mostly significant in the epicentral areas and close by, and their possible correlation with earthquake preparation phases is the basis of seismic hazard predictions [7,8,9,10]. While earthquake forecasting is a controversial issue, several research groups continue to study pre-earthquake signals of various types, such as atmospheric, ionospheric, and geomagnetic anomalies or variations in the emission of radon, nitrogen dioxide, methane, and other gases [11,12]. The early detection and monitoring of seismic precursors can help mitigate the impact and improve disaster response efforts using the time series satellite data. These signals may consist of local fields (atmospheric, electromagnetic, geomagnetic, geochemical), varying over a wide range of frequencies; form a variety of land surface, atmospheric, and ionospheric phenomena; and are associated with geodynamic processes and Earth’s crustal deformation of ground active faults (slip rates and geometry) and tectonic stress fields. Starting from the 1980s, thermal infrared (TIR) satellite remote sensing data were used for analysis of pre-seismic thermal anomalies. By continuous surveillance and monitoring of the geotectonic activity using remote sensing technologies in seismically active areas, we can advance the scientific understanding of pre-seismic multiparameter disturbances [13]. The use of pre-seismic anomalies in time series multisensor satellite remote sensing data continuously increased through the development of space-based remote sensing technologies that provide various geophysical parameters from the top of the atmosphere (TOA) to the Earth’s surface [14].
Satellite remote sensing techniques, both spaceborne and airborne, can bring a highly effective contribution. While thermal infrared imagery can be used for earthquake prediction, In-SAR (Interferometric Synthetic Aperture Radar) and GPS networking data are useful for measuring Earth’s surface deformation. Satellite remote sensing in visible wavelengths and LiDAR (Light Detection and Ranging) data can be used for obtaining damage information after earthquakes, especially in the response and recovery phases [15].
Besides geodetic measurements and field observations, which have limitations in completeness and quantity, numerical models can significantly improve the understanding of the driving physics of seismic cycles and increase the accuracy of seismic hazard assessment. Recently, many improvements have been achieved in the modeling and cross-validation of seismic hazards worldwide. Based on the new approaches that have been modeled, various geophysical, geochemical, and geodetical variables are linked with seismic cycles and crustal movements, considering the complex spatial and temporal distribution of earthquakes is in convergent.
During the earthquake preparation phase, pre-seismic signals may be monitored with multispectral and multitemporal satellites at an altitude above the epicentral region, measuring the data of land and ocean surface temperature and various geophysical changes. Some atmospheric precursors provided by satellite sensors can monitor the changes in the nitrogen dioxide (NO2), ozone (O3), carbon monoxide (CO), and aerosol concentrations, or Outgoing Longwave Radiation—OLR, latent surface heat flux—SLHF, air relative humidity—RH, land surface temperature—LST, air temperature—AT, and air pressure—AP associated with the main shock, which is related to lower atmospheric composition changes [16].
According to the literature in the field of seismic precursors, geospatial data in many studies worldwide were used for the characterization and mapping of geologic lineaments changes from different satellite sensors onboard at VIS wavelengths of Landsat, Sentinels [17]. The Global Earth Observation System of Systems (GEOSS) provides increased observations or revisits of Earth, especially on the coversphere, which acts as a very active layer of the lithosphere–coversphere–atmosphere–ionosphere coupling system (LCAIC). This model may explain the linkage between the buildup of tectonic stresses, migration of soil gases, fault activation, fluctuation of surface latent heat flux, atmospheric and ionospheric perturbations, and earthquake occurrence [18,19]. Currently, great uncertainty exists regarding the nature of the processes that could produce such signals, both inside the Earth’s crust and at the surface. Based on the seismic records in synergy with information provided by time series MODIS Terra/Aqua and NOAA AVHRR along with in situ meteorological parameters, this study used various procedures and methods to investigate the pre- and post-seismic anomalies of the 6 February 2023 earthquakes in the Kahramanmaras region of Türkiye. To obtain some insights into the complex phenomena of earthquake preparation, a systematic multi-precursors approach and the integrated analysis of ground geophysical and satellite data are needed to study the slow process of earthquake preparation. Based on local tectonic geology, hydrology, and meteorology, such findings support the LCAIC theory.

2. Materials and Methods

2.1. Earthquake Precursors

Currently, potential earthquake precursors can be considered abnormal changes in physical and chemical parameters in the different layers of the Earth, including the lithosphere, atmosphere, and ionosphere, before the occurrence of impending large earthquakes. Among the most important seismic precursors are (a) pre-seismic lithospheric changes (number and magnitude of foreshocks during the preparation phase, land surface temperature, crustal displacements, surface latent heat flux, Outgoing Longwave Radiation, surface water chlorophyll and phytoplankton, soil moisture, groundwater level changes); (b) lower atmosphere changes (meteorological parameters, atmospheric composition-radon, aerosols, water vapor, ozone, methane, SO2, NO2, CO2, CO), tectonic clouds, etc.; and (c) ionospheric anomalies observed in layers D, E, and F (total electron content, ion density and temperature, particle energy, potential gravity waves, scalar and vector quantities of the electromagnetic field in ULF, VLF, and HF).
The mechanical processes of earthquake preparation are sometimes accompanied by crustal deformations associated with complex short- or long-term atmospheric, surface, and fracto-emission signals (acoustic, electromagnetic, and neutron emissions) triggered by high-frequency pressure waves at the different scales, geologic lineaments, precursory phenomena, and associated sudden jump anomalies, fluctuation anomalies, and persistent anomalies of different geophysical/geochemical parameters [20,21,22,23]. Ground-level ozone peaks coincide with the time of earthquake generation. Aerosol optical depth (AOD) increases before the occurrence of the earthquake [24,25]. The increased crustal stress triggers the release of radioactive gases such as groundwater and ground-level radon levels [26]. Other gases such as methane, nitrogen dioxide, and sulfur dioxide, migrate to the Earth’s surface and increase before the occurrence of the earthquake. These gases seem to ionize air molecules on the surface of the Earth, increasing the air temperature at 2 m height (AT), the anomalous flow of outgoing long-wave radiation (OLR), and surface latent heat flux (SLHF), which can possibly be responsible for the anomalies in the atmosphere before the earthquakes. Short-term positive ionospheric anomalies in the total electron content (TEC) were reported before large earthquakes (23 min before the 6 February 2023 Kahramanmaras doublet earthquake sequence in Türkiye [27], 40 min before the 2011 Tohoku-oki earthquake in Japan [28], 37 min before the 2008 earthquake in Wenchuan, China), which are possibly attributed to micro-cracks underground immediately before the fault rupture [29]. In addition, some negative anomalies of the atmospheric electric field and positive anomalies of the geoelectric field before earthquakes were identified in seismic active areas [30]. Crustal deformation is responsible for a large variety of landforms at the Earth’s surface, whose size depends on the different processes and duration. Strong earthquakes of moment magnitude Mw ≥ 6.0 on the Richter scale may produce co- and post-seismic deformations like uplift and subsidence deformations, which can take place over periods of a few seconds to several days and produce fault scarps and surface displacement ranging from a few centimeters to several meters in magnitude [31]. Along active deformation geotectonic areas, earthquakes produce short-term and localized geomorphology changes, which may present additional hazards that may quantify the stress and strain accumulation as key controls for seismic hazard assessment [32]. Due to unusual changes in the entire physical and chemical environmental regimes in a geotectonic active area at a regional scale, a wide variety of phenomena preceding earthquake sequences lead to the main earthquake shock and continue for some time after it. The most important precursors, known as thermal anomalies, attributed to enhanced thermal infrared (TIR) emissions from the Earth’s surface preceding moderate and strong earthquakes are often perceivable by remote sensors. As a transient dynamic process, earthquake preparation can be surveyed and assessed in real time from geospatial time series datasets validated with in situ monitoring data. Advanced satellite multispectral sensors with high temporal and spatial resolutions from the new satellite constellations and available drones, together with sophisticated statistical techniques and semantic scene analysis, play increasing roles in surveying spatiotemporal variation in geophysical parameters in seismic active regions, improving seismic hazard assessment and post-earthquake damages analysis.
Also, previous studies have attempted to test the possible statistical significance between pre-seismic anomalies in various geophysical parameters worldwide.
This study is mainly focused on pre-seismic anomalies and satellite-derived in situ air meteorological variables, including air temperature (AT), air relative humidity (RH), air pressure (AP), and surface satellite-derived variables such as land surface temperature (LST) and Outgoing Longwave Radiation (OLR).

2.2. Study Area and Geotectonic Setting

Türkiye, located on the Anatolian plate, north of the Arabian plate where the Anatolian, African, and Arabian tectonic plates converge, is one of the most seismically active regions of the world and is dominated by collision tectonics. The high seismic hazard of this area is attributed to the movement of the Earth’s lithospheric plates, as the Arabian Plate is moving towards the Anatolian Plate in the northwest direction at a rate of 18 mm per year, while the Anatolian Plate moves along the two major strike-slip fault systems: the North Anatolian Fault Zone and the left-lateral strike-slip East Anatolian Fault [33,34,35]. The East Anatolian Fault placed along the eastern edge of the Anatolian Plateau from the Caucasus Mountains to the Mediterranean Sea is a major tectonic feature in Eastern Türkiye, at the boundary between the Anatolian Plate and the Arabian Plate. It is considered one of the most seismically active faults in Türkiye and is responsible for several previous destructive earthquakes of Mw ≥ 6.8m including the last earthquakes of 6 February 2023, EQ1-Pazarcik of Mw = 7.8 and EQ2-Elbistan of Mw = 7.5. The earthquake EQ1 occurred at the junction of the Amanos and Pazarcik segments of the East Anatolian Fault on the Kahramanmaras triple points of plate interaction. Figure 1 presents a map of Türkiye with the Kahramanmaras earthquake epicenters, main fault zones, plates, and their movement direction in and around Türkiye. It was estimated that the fault rupture length in the first earthquake exceeded 300 km and was roughly 100 km for the second earthquake [4,36,37,38,39].
The epicenter of the first earthquake was located at 37.220° N 37.019° E in the Pazarcık district, about 33 km southeast of Kahramanmaras province, resulting from strike-slip faulting at a shallow depth (~10 km) [1,2,3]. The epicenter of the second earthquake was located in the Elbistan district, at 38.016° N 37.206° E (95 km north-northeast from the first one) at a shallow depth (~7 km), with a strike-slip focal mechanism. If the first earthquake EQ1, which occurred in the Pazarcic area, had a major slip asperity approximately 100 km long and 70 km wide, with the vertical component of the surface deformation reaching 40–50 cm, then, for the second strong earthquake EQ2, which occurred in the Elbistan area to the northeast of the first earthquake ~9 h later, the main slip asperity was only around 50 km long and 30 km wide, but the displacements in the vertical plane (subsidence down to 80 cm on the north from the epicenter, and uplift of about 60 cm on the south from the epicenter) were very significant [40]. Also, the major faults, the North Anatolian Fault, which runs east–west through Northern Türkiye along the northern edge of the Anatolian Plateau from the Aegean Sea to the Caucasus Mountains, and the South Anatolian Fault along the southern coast of Türkiye are very active seismic zones and the source of several strong earthquakes recorded in the past.

2.3. Datasets

To analyze atmospheric anomalies and detect the pre-seismic activity of Kahramanmaras sequence EQs from 6 February 2023, remote sensing data from two different databases were used. To analyze the temporal pattern of the data, time series datasets were provided by the online database including NASA’s Goddard Earth Sciences Data and Information Services Center (GES DISC) through the Geospatial Interactive Online Visualization and Analysis Infrastructure (GIOVANNI) V4.28, available via its portal [41]. The available datasets include the daily time series of daily SLHF and OLR provided by the Atmospheric Infrared Sounder (AIRS) mission with a spatial resolution of 1°, provided by the Modern-Era Retrospective analysis for Research and Application, Version 2 (MERRA-2) with a spatial resolution of 0.5 × 0.625°, and daily time series of surface air temperature provided by the Global Land Data Assimilation System (GLDAS) model with a spatial resolution of 0.25° [42]. To explore the spatial variabilities of OLR, surface air temperature (AT), and air pressure (AP), daily anomaly composite datasets were collected from the Physical Sciences Laboratory-National Oceanic and Atmospheric Administration (PSL-NOAA) reanalysis center [43]. The NASA MODIS (Moderate Resolution Imaging Spectroradiometer) Terra/Aqua satellites collect remotely sensed diurnal and nocturnal land surface temperatures LST. Land surface temperature (LST) data for the Kahramanmaras region were provided by the Terra MODIS/VIIRS Land Products Global Subsetting Tool, including the ORNL DAAC, MOD11A2 LST_Day_1km and MOD11A2 LST_Night_1km time series data [44]. Climatological data were collected from MERRA-2 [45], ESA Copernicus [46] databases, and local meteorological stations.

2.4. Methodology

The selected multiple parameters were identified through statistical methods and analyzed over the epicentral area of the first and the second strong earthquakes recorded in Pazarcik and Elbistan areas of moment magnitudes Mw = 7.8 and 7.5 on the Richter scale, respectively. The Dobrovolsky or strain radius (R) can estimate the size of the earthquake preparation zone area [47,48], and its relation to the moment magnitude of the impending earthquake Mw is expressed through the following equation:
R = 10 0.43   M w
where R represents the earthquake stress radius expressed in km. For the first seismic event in Pazarcik, the stress radius was about 2259 km, while for the second earthquake, the stress radius was about 1679 km. Time series analysis of in situ and remote sensing-derived parameters AT, RH, AP, LST, and OLR considered possible earthquake precursors, aiming to detect anomalies in the spatiotemporal data. As a reference level, the following equation considers the upper and lower confidence limits: VUL = µ ± 2б, where µ is the mean of data and б is the standard deviation, which can be a candidate of the seismic-induced anomalies beyond an upper and lower bound and abnormal seismic precursors. Anomalies in these parameters were computed by removing the background profile for a non-seismic condition. The dependence between pairs of daily time series of meteorological variables in Pazarcik and Elbistan areas was quantified in this study by standard tools of statistical analysis, such as Spearman’s rank correlation coefficients and rank-correlation non-parametric tests. The normality of data was evaluated through Kolmogorov–Smirnov Tests of Normality for daily time series datasets. For the anomaly recognition criteria in the time series pattern analysis of satellite and in situ monitoring climate datasets related to the Kahramanmaraş earthquakes, different temporal and spatial windows were considered along with biases from seasonal and interannual variability. However, the temporal range of NOAA, MODIS Terra/Aqua and in situ data used for predicting impending earthquakes were from 200 days before the Kahramanmaras earthquakes until the day of the earthquake itself and 30 days after. Other different short temporal windows have also been analyzed. We considered that a longer anomaly window could capture more information on geophysical parameter variability, whereas irrelevant anomalies, occurring too far in time from the earthquake occurrence, cause higher uncertainties in seismic-related signals. The reference level of NOAA-recorded anomalies was determined using 1991–2020 climatology data. This article analyzed the possible precursors of the 6 February 2023 Türkiye earthquakes associated with changes in the statistics of physical fields, which may contain useful information about the preparation for the Kahramanmaras doublet seismic event. The approach in this study considered the changes in the atmospheric and coversphere geophysical parameters, which occur due to the activation of the time-varying processes that are linearly or non-linearly correlated to fractures of the lithospheric plates in a short or immediate period before the earthquakes. An integrated satellite and in situ dataset was established as the baseline for statistical analysis against various geophysical parameters and anomaly detection methods. As a result of this analysis, it was possible to identify the phenomena that arose before the recorded seismic events. These phenomena correspond to the statistics obtained for involved geophysical fields and are valid for large areas, extending up to thousands of kilometers from the focal points. During the last years, the use of satellite remote sensing time series data in statistical studies related to earthquake precursors has increased significantly.
This study used composite anomaly maps and statistical anomaly detection thresholds to examine precursory values in various time series datasets for possible seismic precursor detection. Currently, precursory parameters require long-term correlation analyses to robustly evaluate their performance capabilities and forecasting analysis. The main aim of this study was to find the anomaly variation in several parameters related to thermal channels before the Kahramanmaraş earthquakes to establish the hypothesis of a possible lithosphere–atmosphere coupling mechanism during pre-seismic conditions.

3. Results and Discussion

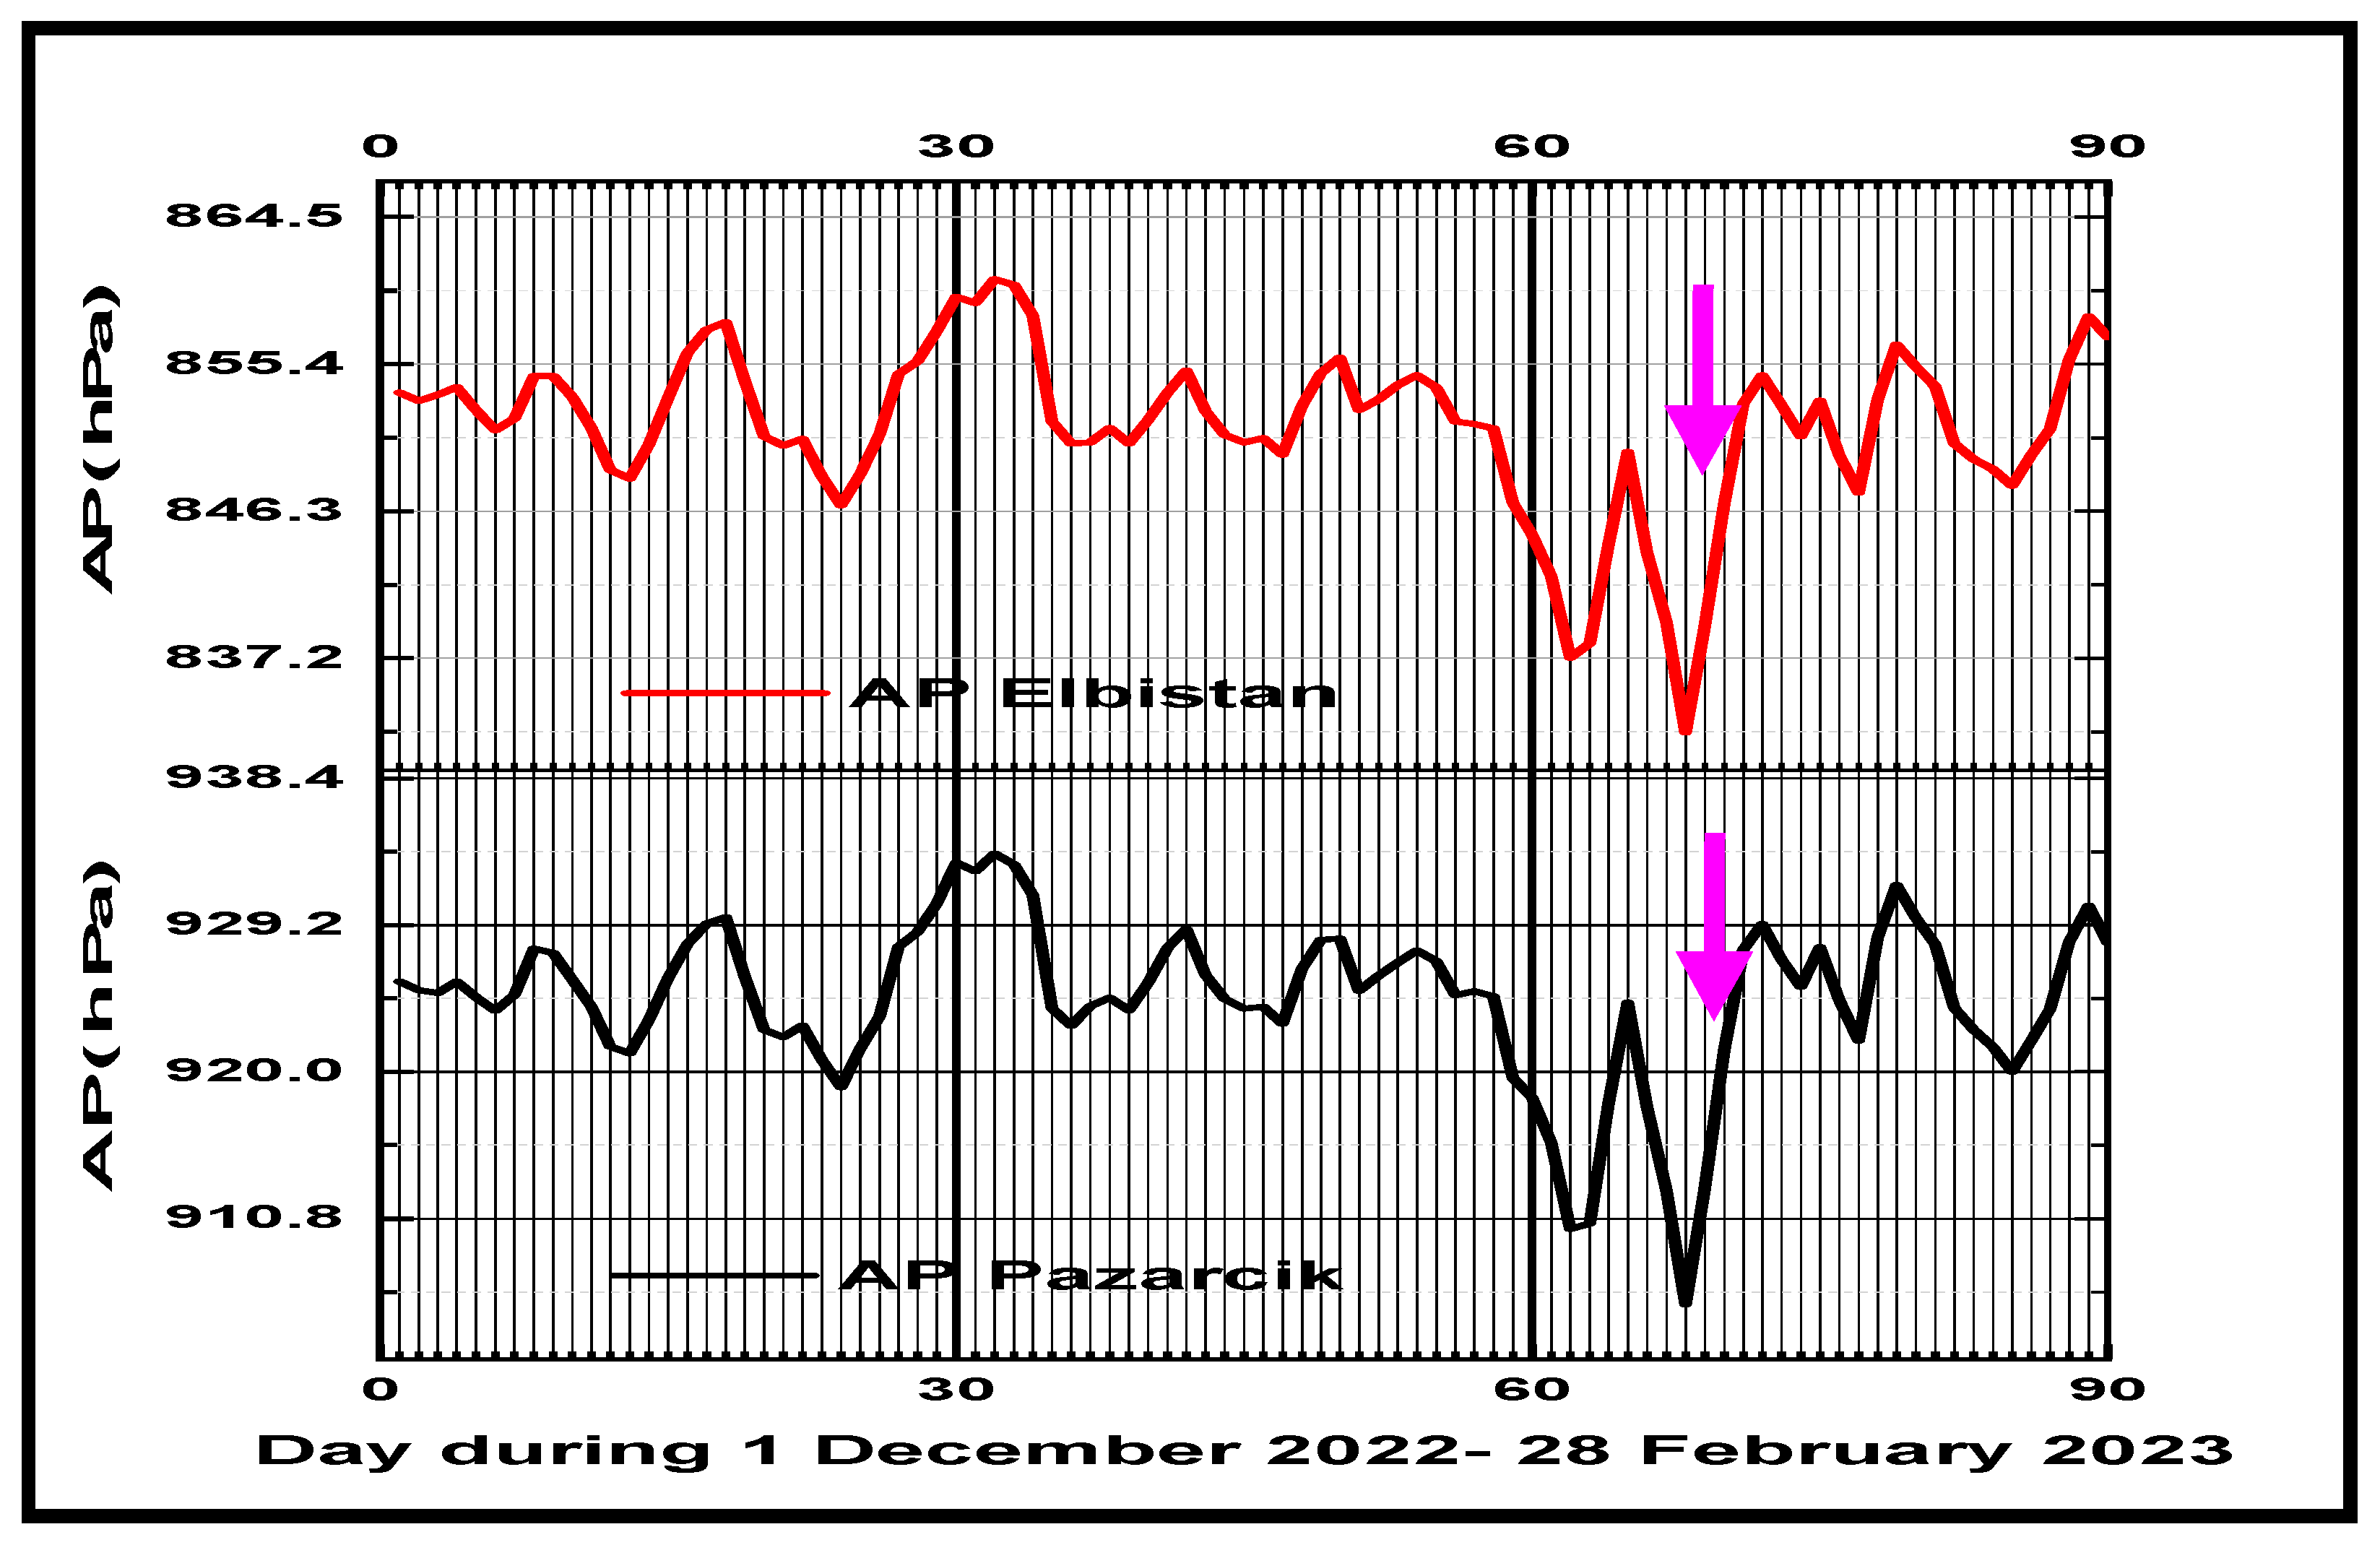
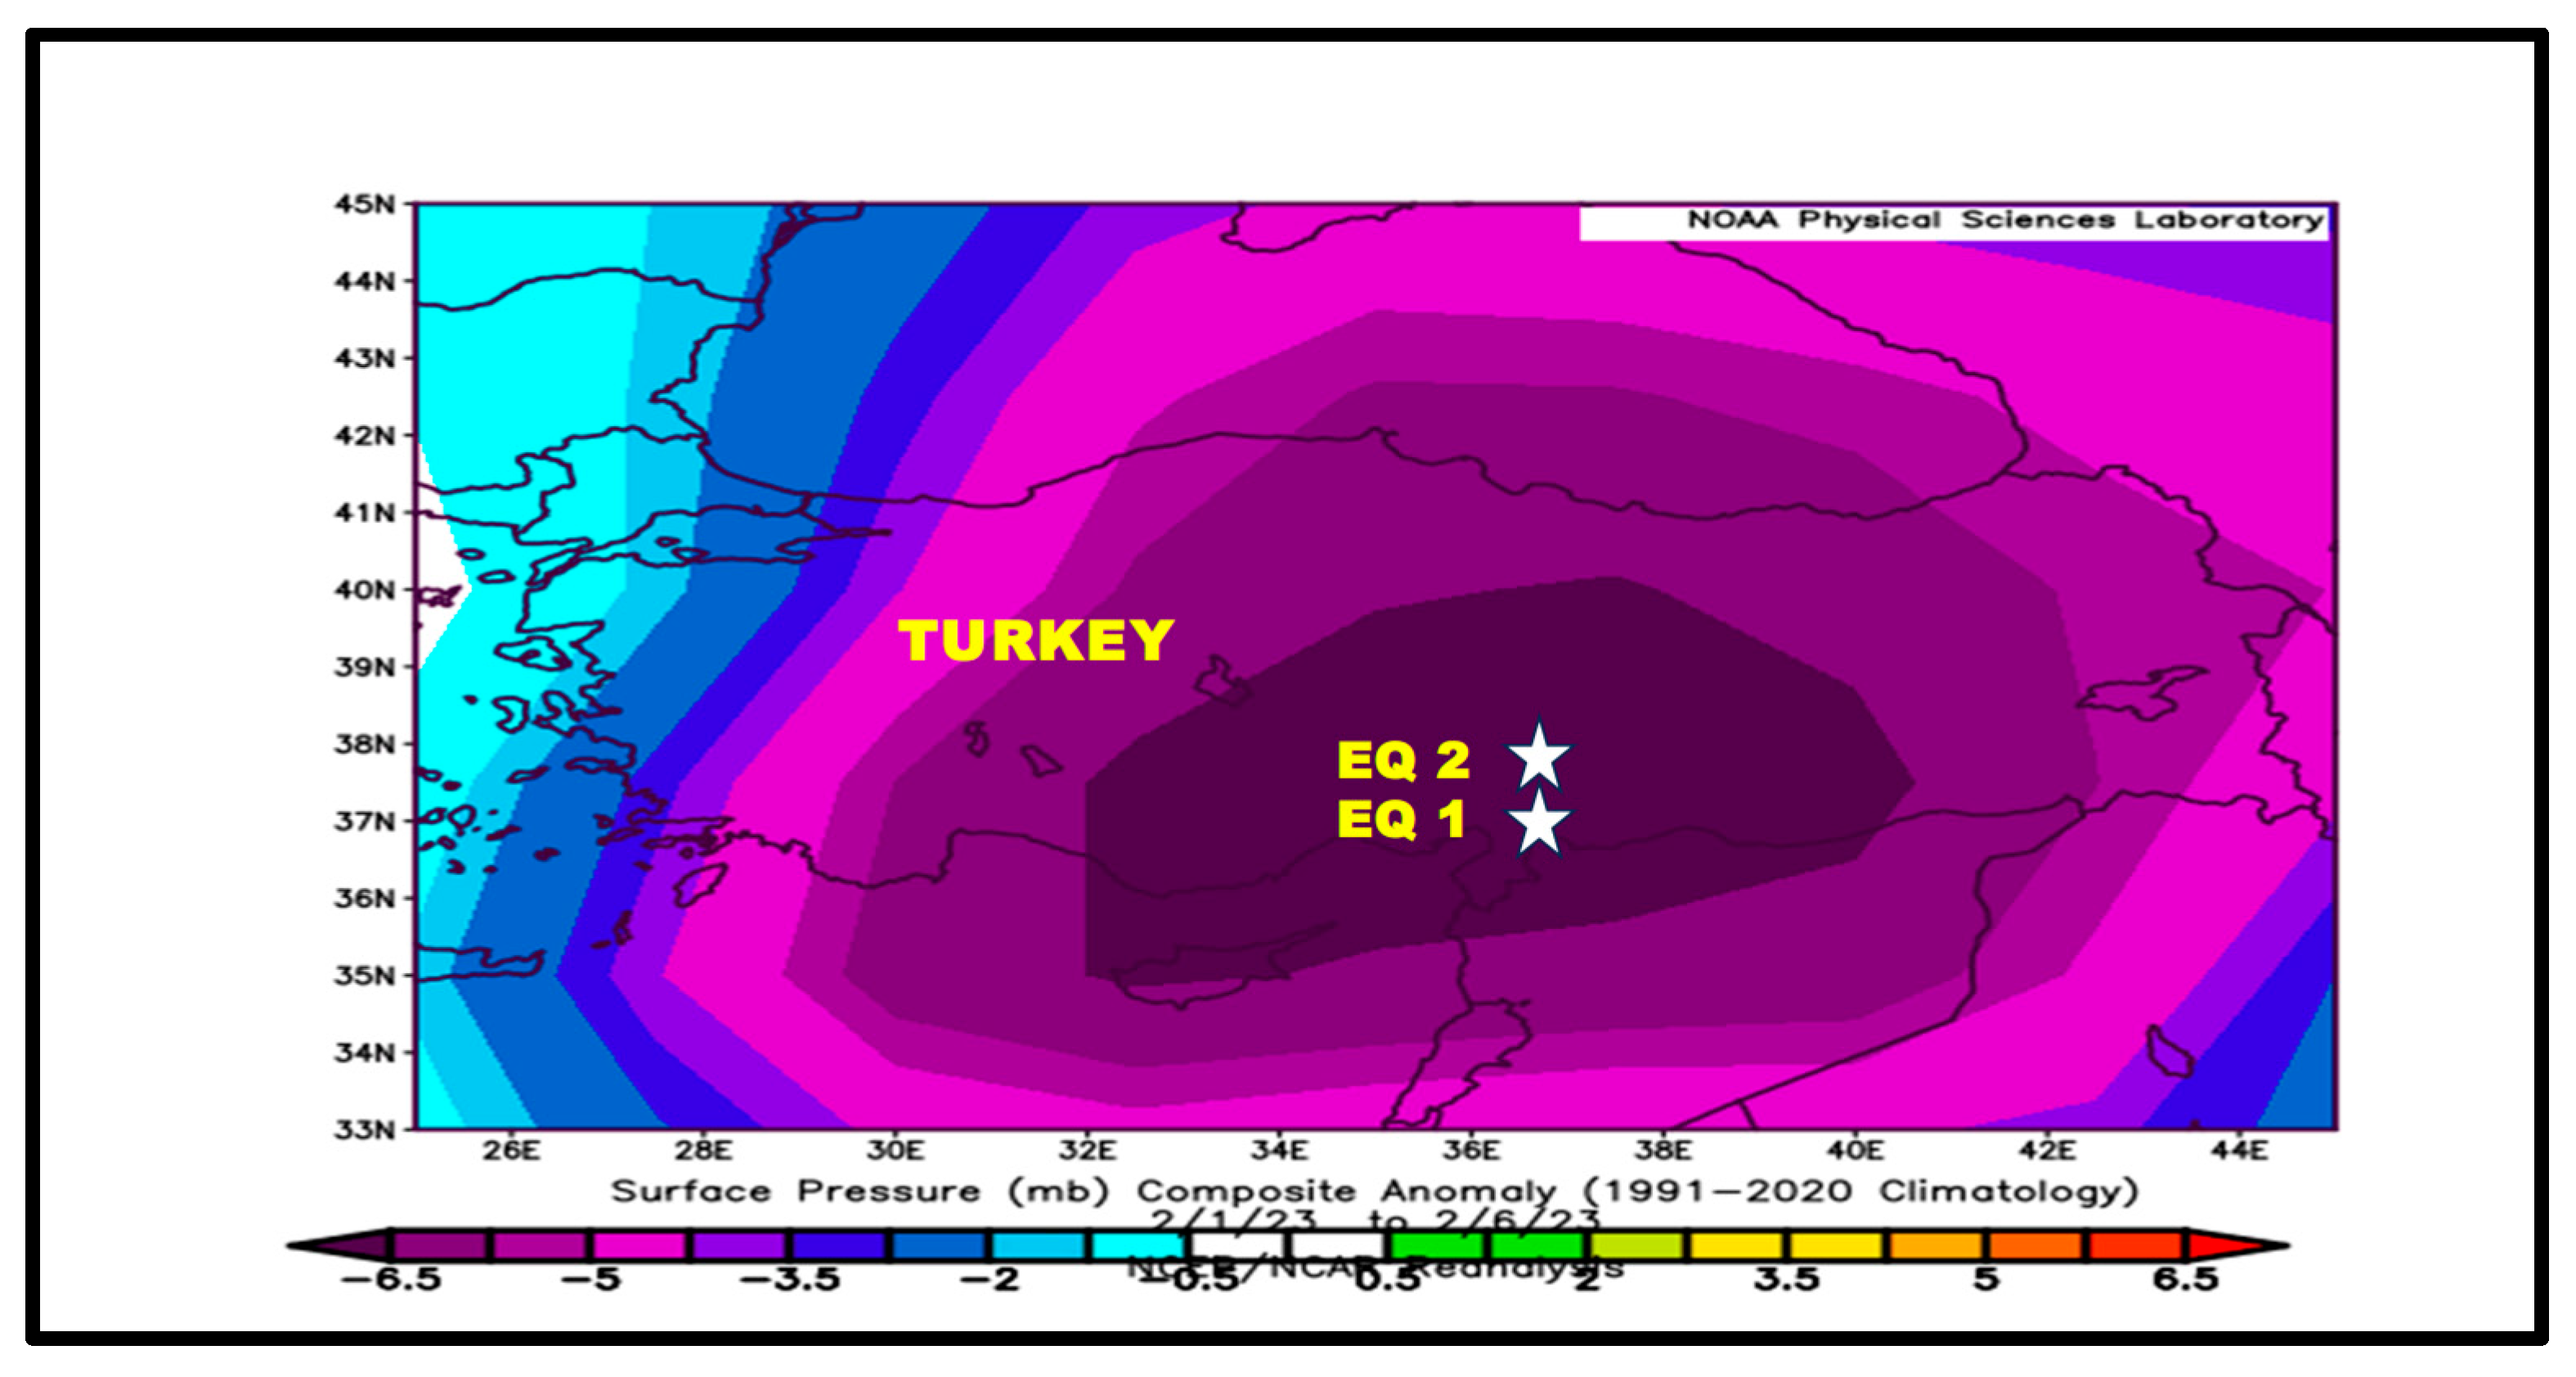
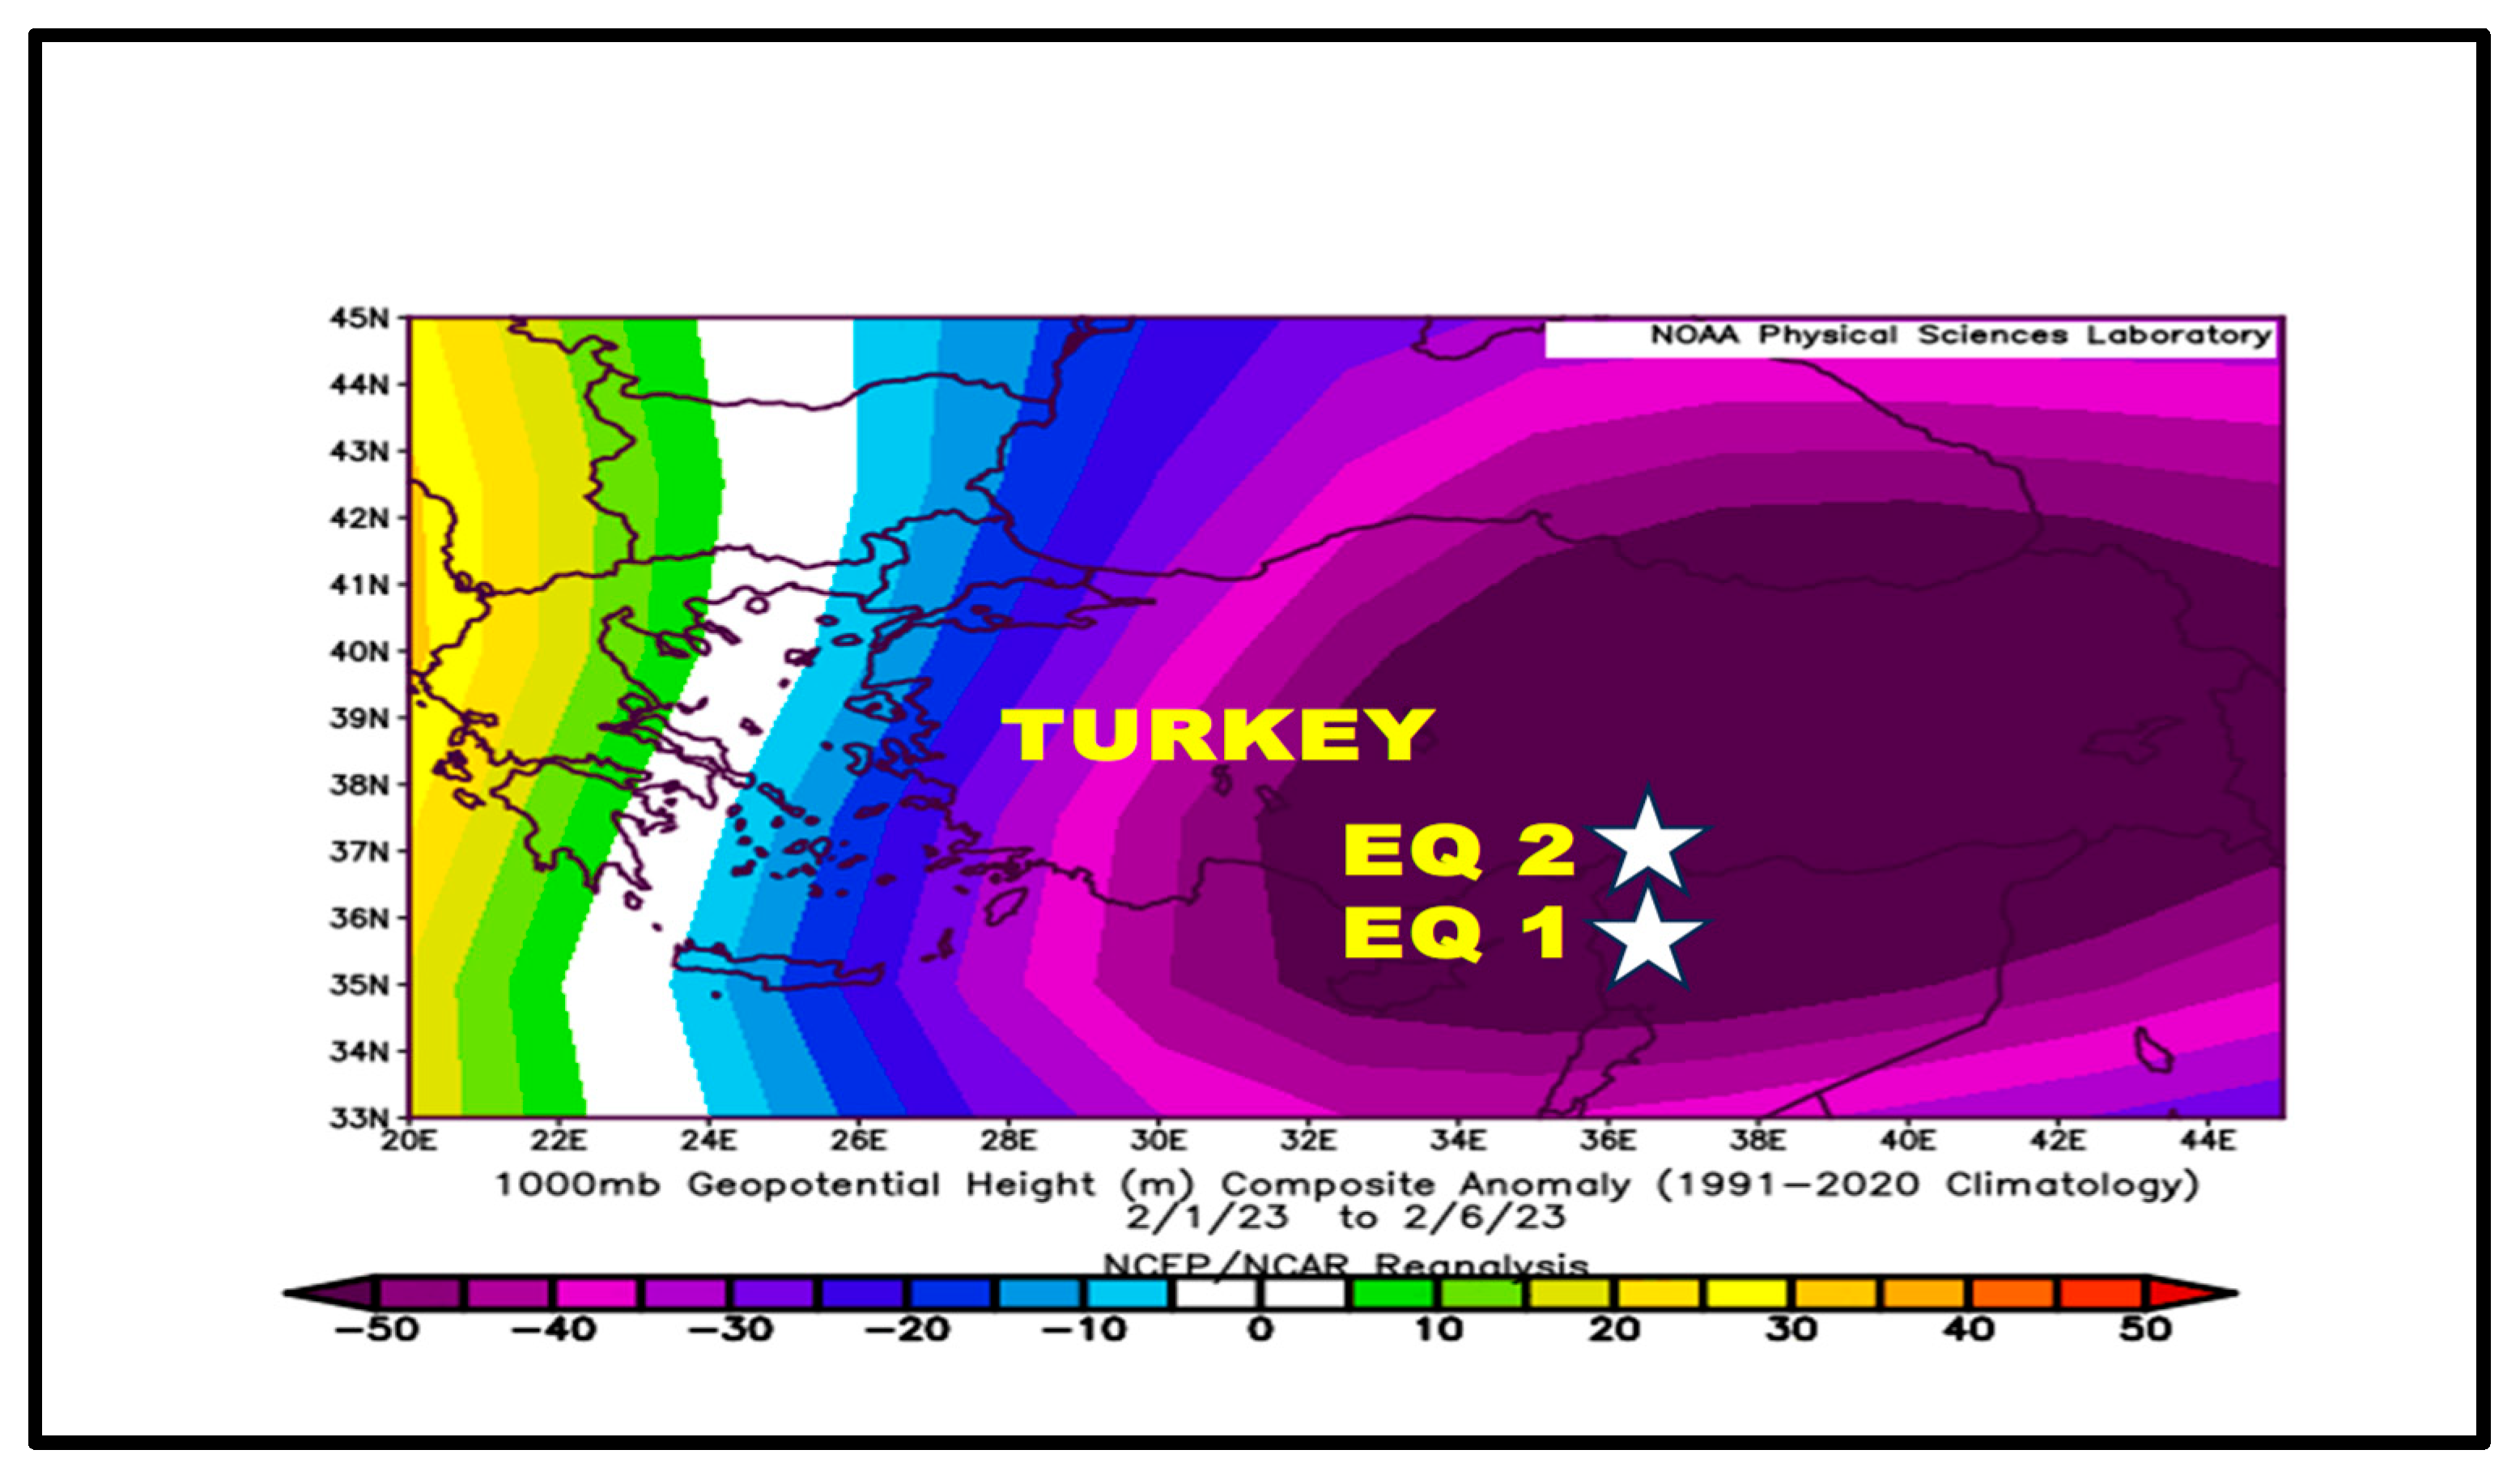
3.1. Climate Parameters Evolution

This study investigated the composite anomaly maps of the main surface air variables (temperature at 2 m height, relative humidity, and air pressure) before and after the Kahramanmaraş doublet earthquakes on 6 February 2023. From July 2022 to 6 February 2023, NOAA time series satellite data recorded a positive composite anomaly in air temperature at 2 m height AT relative to the 1991–2020 climatology, ranging from (1.5 to 2.7 °C) for the southeastern part of Türkiye, near the Kahramanmaraş region inside the Dobrovolsky area (Figure 2). This was not detected in the time series data during the previous 3 years under non-seismic conditions. However, anomalies in atmospheric parameters were computed by removing the background profile for a non-seismic condition. Such thermal anomalies have been reported before large earthquakes worldwide, including the 11 March 2011 Mw = 9.0 Tohoku earthquake [49]; the Crete earthquake on 27 September 2021 Mw = 6.0 at 6 km depth [50], the 8 September 2023 (Mw 6.8) Morocco earthquake [51]; the 31 March 2020 Mw 6.5 Idaho (USA) earthquake [52]; and the 14 August 2021 Mw 7.2 Haiti earthquake [53].
After the EQ1 (Pazarcik) and EQ2 (Elbistan) earthquakes, from 7 February 2023 to the end of February 2023, NOAA satellite data show a clear negative composite anomaly in AT (Figure 3).
An analysis of the meteorological data of the two consecutive earthquakes on 6 February 2023 in Türkiye shows similar trend patterns, with a sudden increase in air temperature at 2 m height (AT) and air relative humidity (RH) about 6 days before the main events and a sharp decrease after the main shocks until the middle of February 2023. Also, the scientific literature shows that RH can vary by dropping several days before the EQ1 and EQ2 and then increasing until the EQ [16,19]. These results were confirmed by both in situ monitoring data for AT (Figure 4) and RH (Figure 5). An opposite behavior was found for air RH, which presented a positive composite anomaly on the NOAA map for both the Pazarcik (EQ1) and Elbistan (EQ2) earthquakes (Figure 6). This study found a positive correlation between air relative humidity in the Pazarcik and Elbistan areas (Spearman’s rank correlation coefficient r = 0.80; p value < 0.01). During the December 2022–February 2023 period, the daily average air relative humidity (69.06 ± 12.85)% in the range of (39.59–95.86)% was recorded in the Pazarcik region (EQ1), and (73.81 ± 12.46)% in the range of (43.39–93.63)% was registered in the Elbistan area.
The affected areas within the Mediterranean region are characterized by a topography comprising mountains and valleys, with several cities, towns, and villages located within these valleys and sedimentary basins. The analyses conducted for the Pazarcik and Elbistan earthquakes have demonstrated that the local climate and geologic differences between the Pazarcık and Elbistan areas have been responsible for shaping the atmospheric response. Different local climate conditions in the Elbistan and Pazarcik areas range from cold and arid in the north to temperate in the south. There are differences in the local topography, geomorphology, soil properties, and fault geometry that may also influence these observations.
The differences between the values of AT and RH registered in the focal areas of each earthquake were attributed to the difference in the elevation levels of Pazarcik (750.39 m), which is located in a basin area, and Elbistan (1141 m), which is located in a mountain area. NOAA satellite data recorded the same trends in the RH atmospheric parameters. However, the drop in AT after the earthquakes was larger in the Elbistan area than in Pazarcik, explained by the mountain land morphology; the geotectonic active area is characterized by a topography comprising mountains and valleys.
Figure 6 presents the NOAA positive composite anomaly map of surface relative humidity before the Pazarcik (EQ1) and Elbistan (EQ2) earthquakes in Türkiye between 1 February and 6 February 2023 relative to the 1991–2020 climatology.
The temporal patterns of surface air pressure AP for Pazarcik and Elbistan earthquakes located at a straight-line distance of about 90 km, as shown in Figure 7, show the same trend, with a sudden decrease six days before 6 February 2023, followed by a significance increase three days before the seismic events, a sharp decrease until the day of the earthquakes, and a sharp increase after the earthquakes between 7 February and the end of February. NOAA satellite data illustrated the same evolution pattern, including a sharp negative composite anomaly in AP relative to the 1991–2020 climatology three days before the earthquakes. From July 2022 to 6 February 2023, NOAA time series satellite data recorded a positive composite anomaly in surface air pressure in the range of (0.5–1.5 hPa), which was followed by a negative anomaly in AP of 5.9 hPa six days before the earthquakes in the Pazarcik and Elbistan areas, as shown in Figure 8. A detailed analysis of the variability of the main meteorological parameters (atmospheric pressure, air temperature, relative humidity) showed a high atmospheric pressure anomaly caused by the ground motion pre-seismic preparation phase. Similar sequences in various surface atmospheric parameters, positive and negative fluctuations, were observed during the investigation of several other strong earthquakes in Türkiye [54] and the 6 February 2023 earthquake in Türkiye [55,56].
The NCEP/NCAR Reanalysis Intercomparison Tool provided useful information regarding the presence of anomalous synoptic cyclonic circulation, with upward airflows indicated by a significant negative anomaly (−50 m) in isobaric surface heights of geopotential at sea level (1000 mb) one week before the earthquakes over the Kahramanmaras region, as shown by the satellite maps in Figure 9. One day before the impending earthquakes, this anomaly was intensified (arriving at −100 m). Atmospheric anomalous cyclonic circulation identified in the Kahramanmaras region is the key driver of the variability of lower atmospheric meteorological parameters AT, RH, and AP, which could potentially trigger earthquakes in the Pazarcik and Elbistan areas.
The climate variables anomalies may be caused by tectonic stress changes associated with the main shock regions during the preparation period due to the deformation of rocks or the emission of gases like radon, methane, nitrogen dioxide, and carbon monoxide from the underground [57,58]. The intensity of atmospheric anomalies, which occur within minutes, hours, days, weeks, or months before the main shock, can vary in response to the earthquake’s magnitude, focal depth, or local geomorphology [59,60].

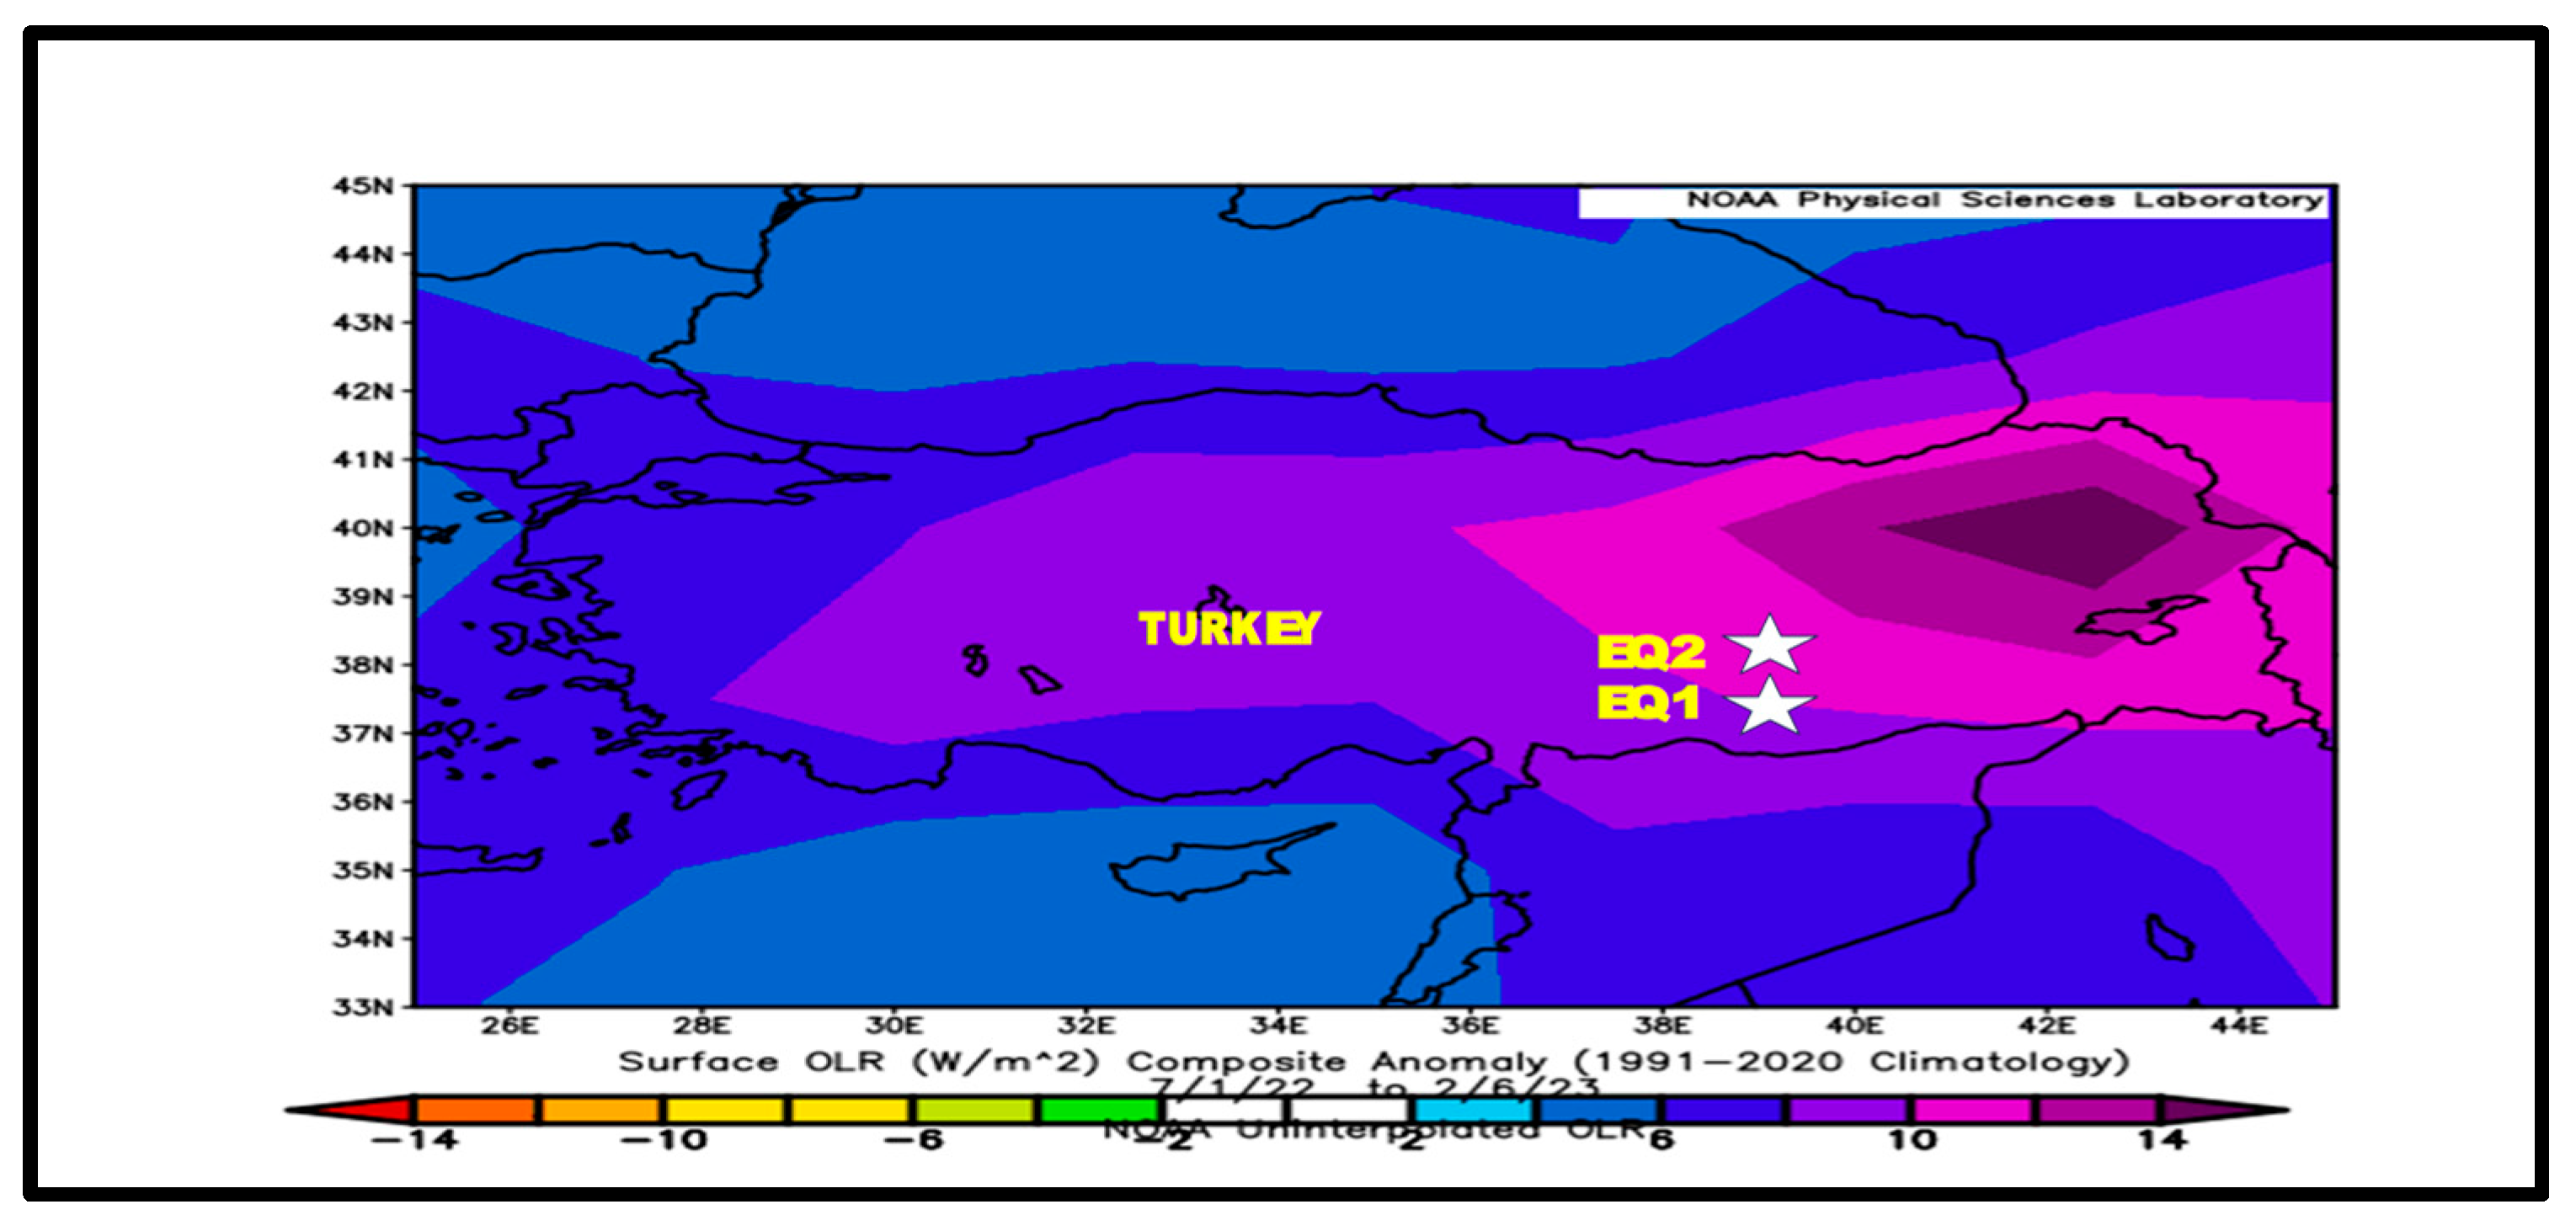
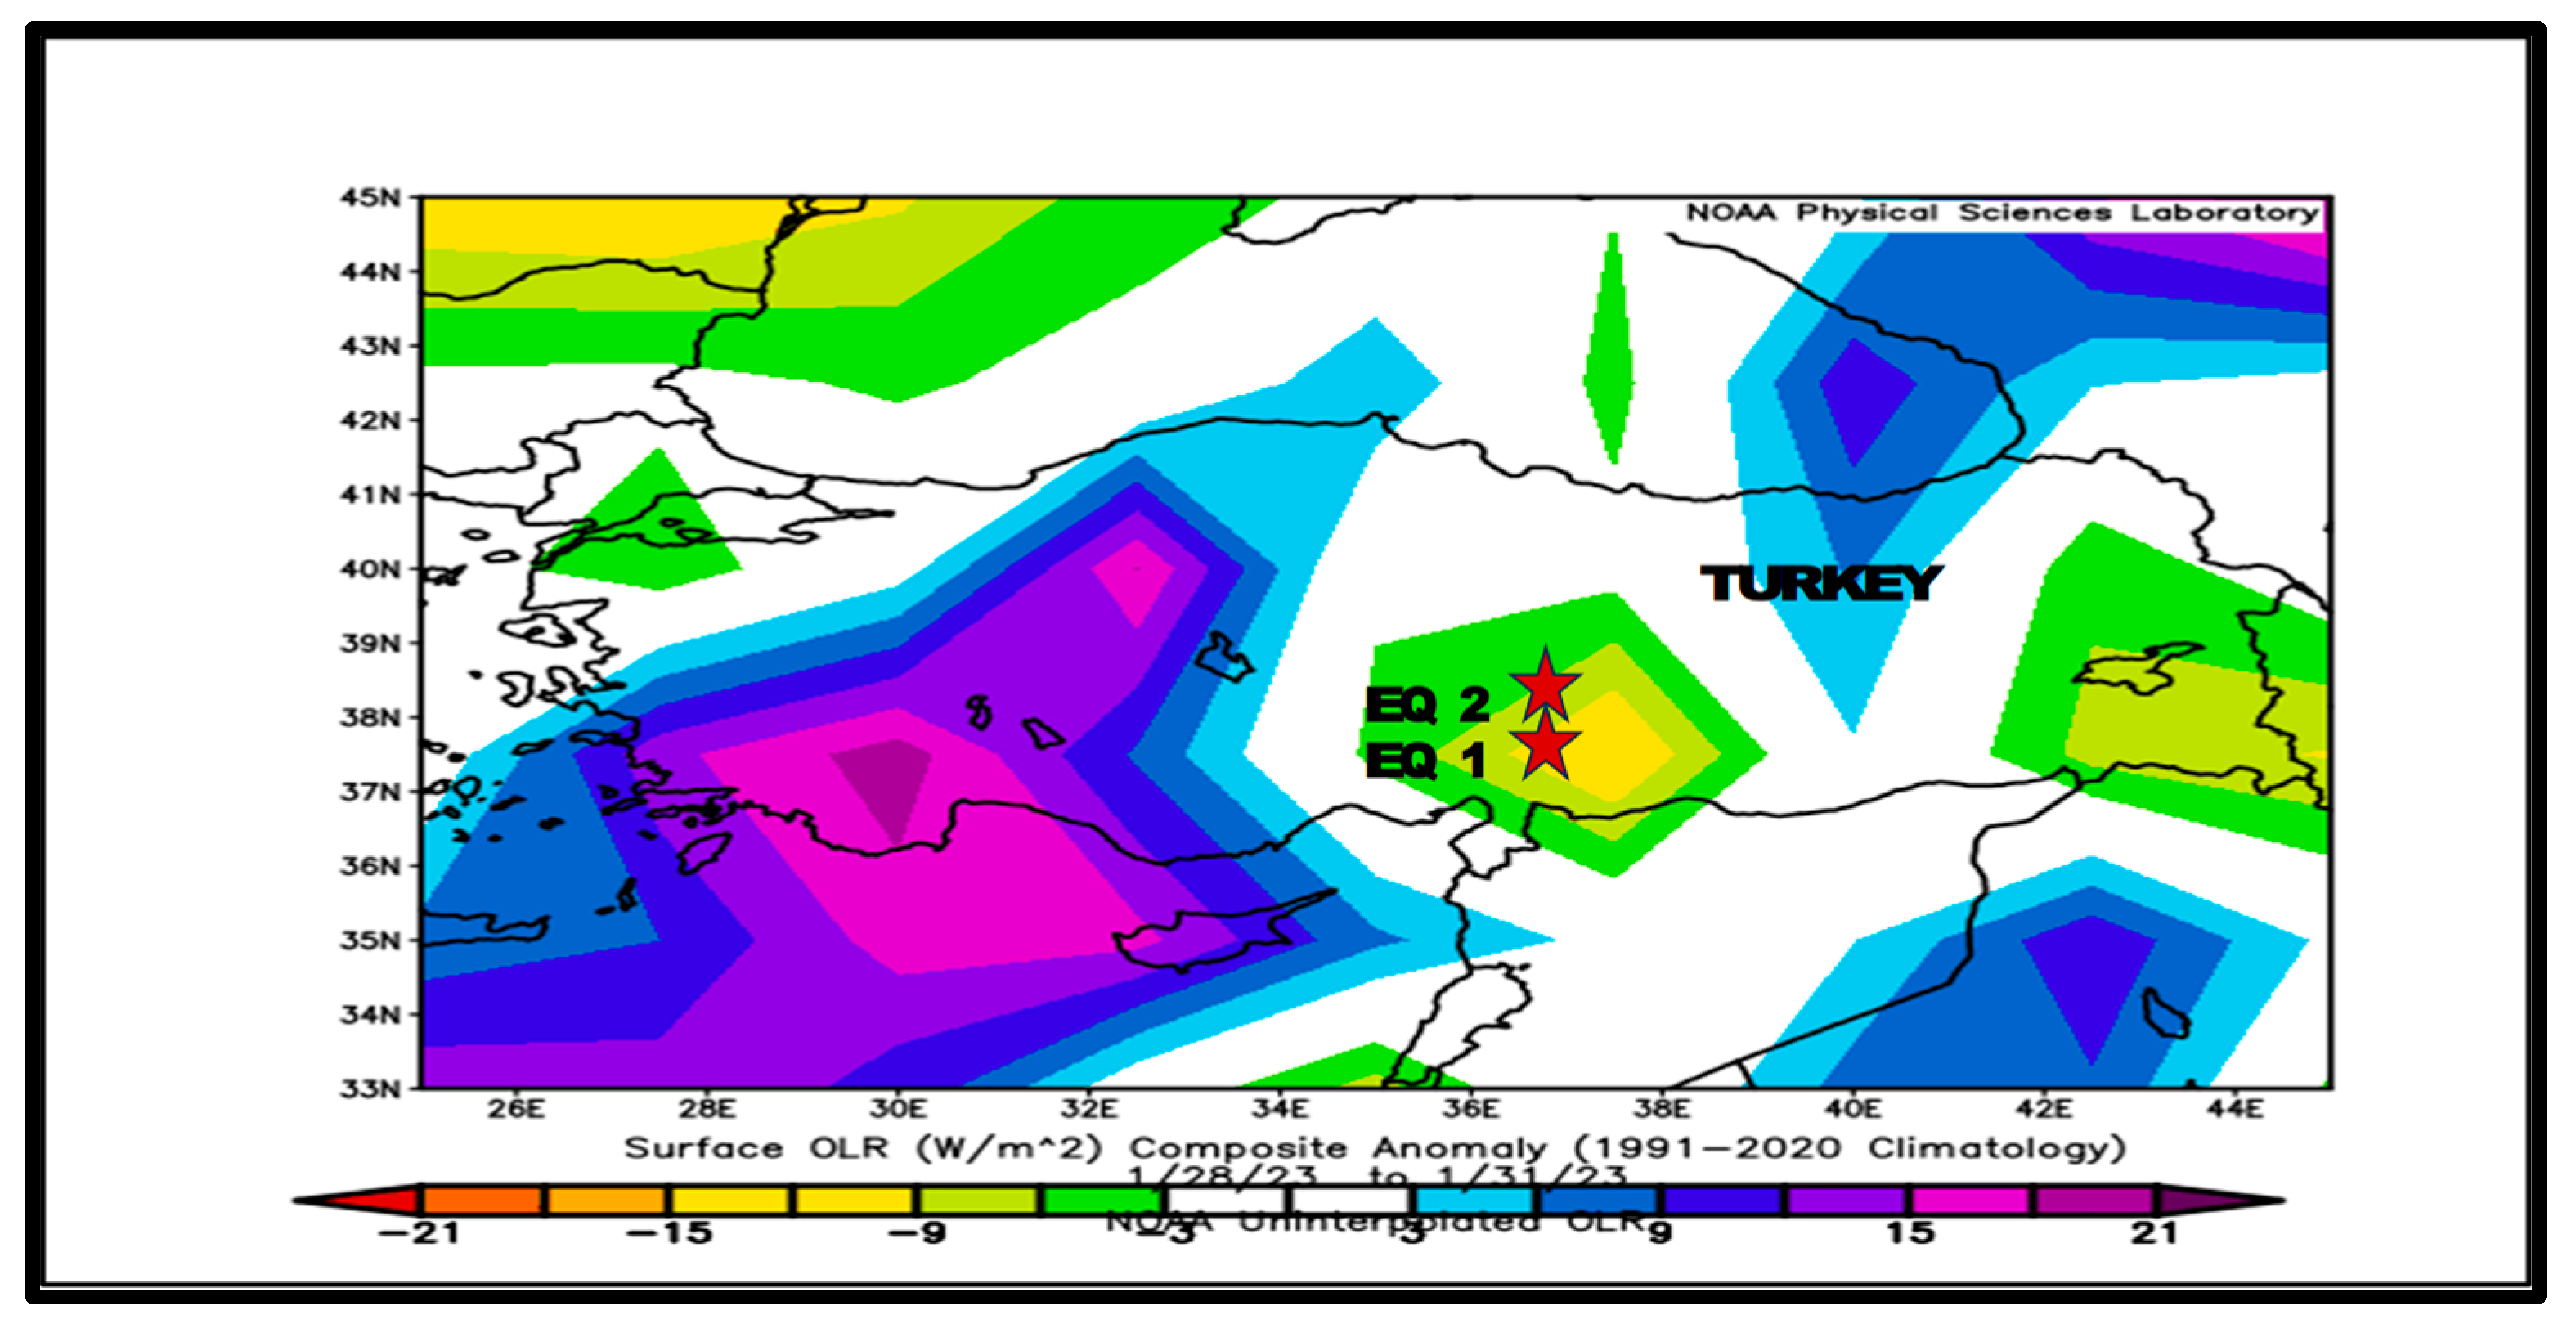
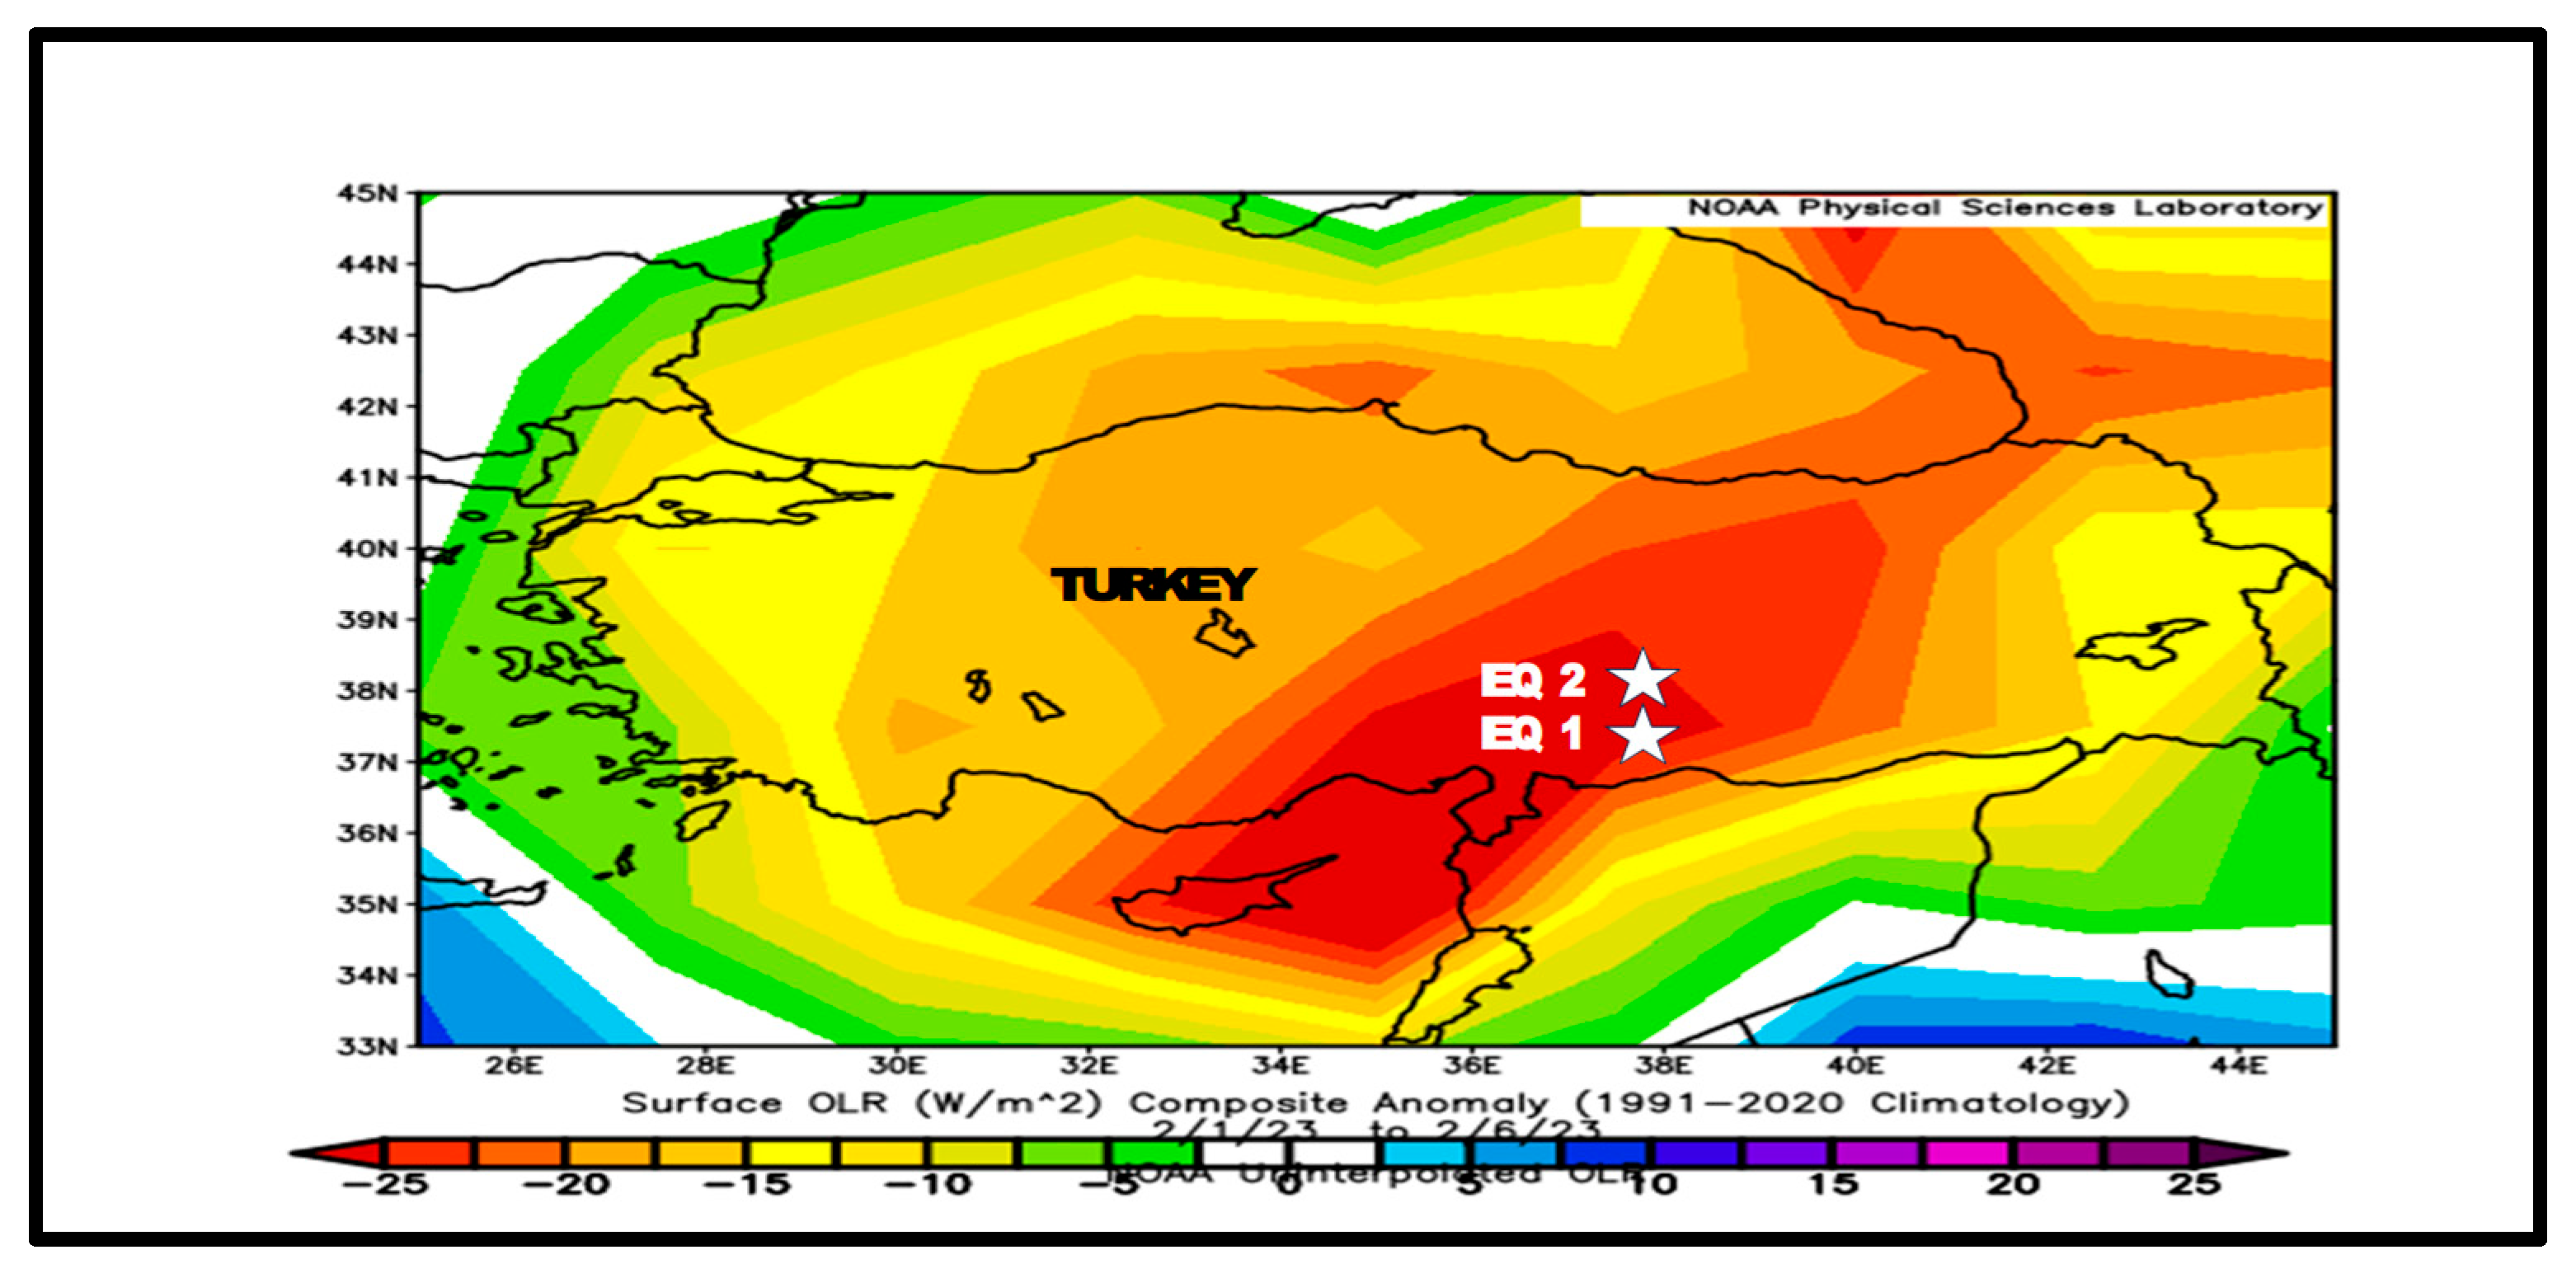
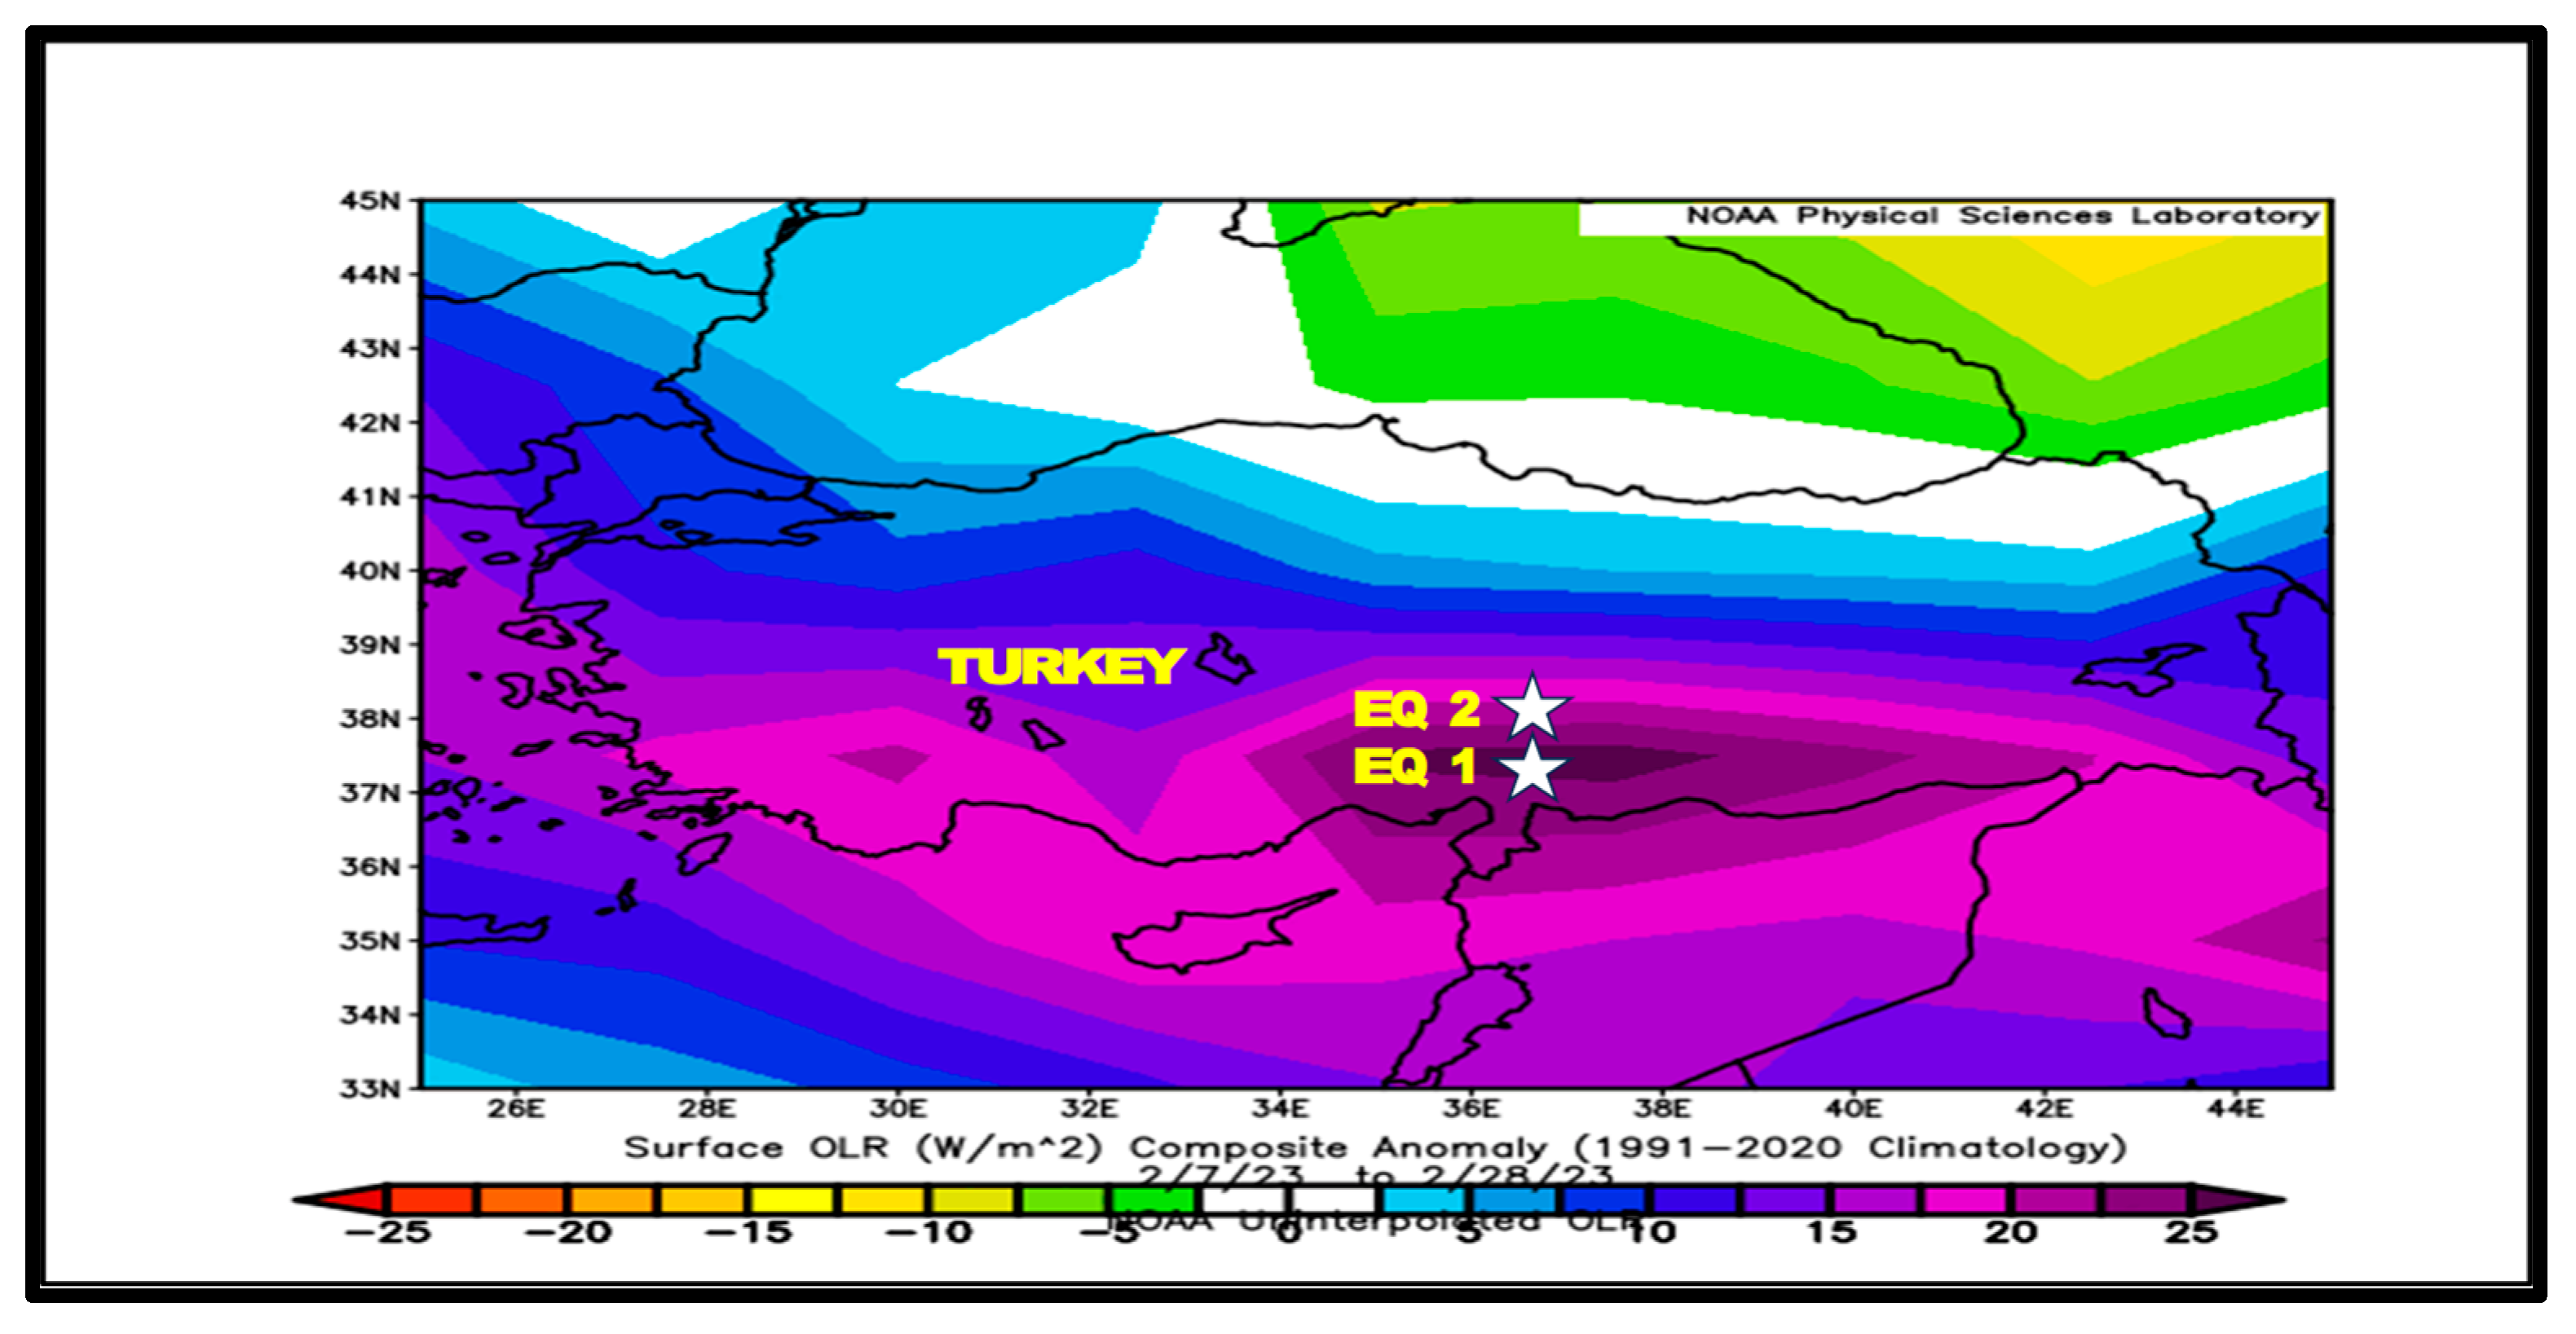
3.2. Temporal Pattern of Outgoing Long Wave Radiation (OLR)

Several studies report that earthquake preparation processes can start 1–30 days before the occurrence [61]. Among seismic precursors, the OLR measured from the surface to tropospheric heights (10–12 km) may show significant anomalies. Being the sum of thermal energies reflected from Earth and its atmosphere to space in the form of infrared radiation in the spectral range (4 μm–100 μm) at low energy, the latent heat release before strong earthquakes increases the overall energy budget of the lower atmosphere, which enhances the OLR flux (W/m2) measured at the topside of the atmosphere [62,63,64]. Spatial composite maps of the Outgoing Longwave Radiation (OLR) from the National Oceanic and Atmospheric Administration/National Center for Environmental Prediction (NOAA/NCEP) were investigated daily through temporal analysis to support the hypothesis of developing earthquake pre-signals through the atmosphere over the epicenter in the seismic preparation zone. Also, we retrieved OLR data for day and night from the GIOVANNI website to examine pre- and post-EQ anomalies over the Kahramanmaras seismic region. This study reports the observed anomalies in the satellite-derived OLR before the Kahramanmaras doublet earthquake sequence in Türkiye. From 1 July 2022 to 28 January 2023, a positive composite anomaly in the range of (11–15 W/m2) from the confidence bounds of the surface OLR related to the 1991–2020 climatology was recorded over the Black Sea and Türkiye epicentral areas of the EQ1 and EQ2 earthquakes (Figure 10). From 28 January 2023 to 31 January 2023, the OLR composite anomaly turned from positive values to negative (Figure 11) in the range of (−3 to −15 W/m2) related to the 1991–2020 climatology over areas of Türkiye, being more intense in the range of (−25 to −39 W/m2) before 6 February 2023 over the epicentral areas Pazarcik and Elbistan (Figure 12).
After 6 February 2023, starting from 7 February 2023 to the end of February 2023, NOAA satellites recorded positive composite anomaly in the surface OLR centered on the Pazarcik (EQ1) and Elbistan (EQ2) areas (Figure 13). As satellite time series data can monitor the surface OLR flux continuously, this parameter can be used effectively to identify the earthquake precursors for strong earthquakes. Several studies have reported EQ-associated anomalies in the Outgoing Longwave Radiation (OLR) in a window of 3–10 days before the main shock using different methods (e.g., statistical, wavelet transformation, deep learning, and Machine Learning (ML)-based neural networks). Such observations have been recorded in the case of the 14 August 2021 Mw 7.2 Haiti earthquake, where a sharp increase in the OLR occurred 3 days before the EQ [53], and in the case of the 25 June 2020 Mw 6.3 earthquake in the Hotan region of Xingjian in China [65].

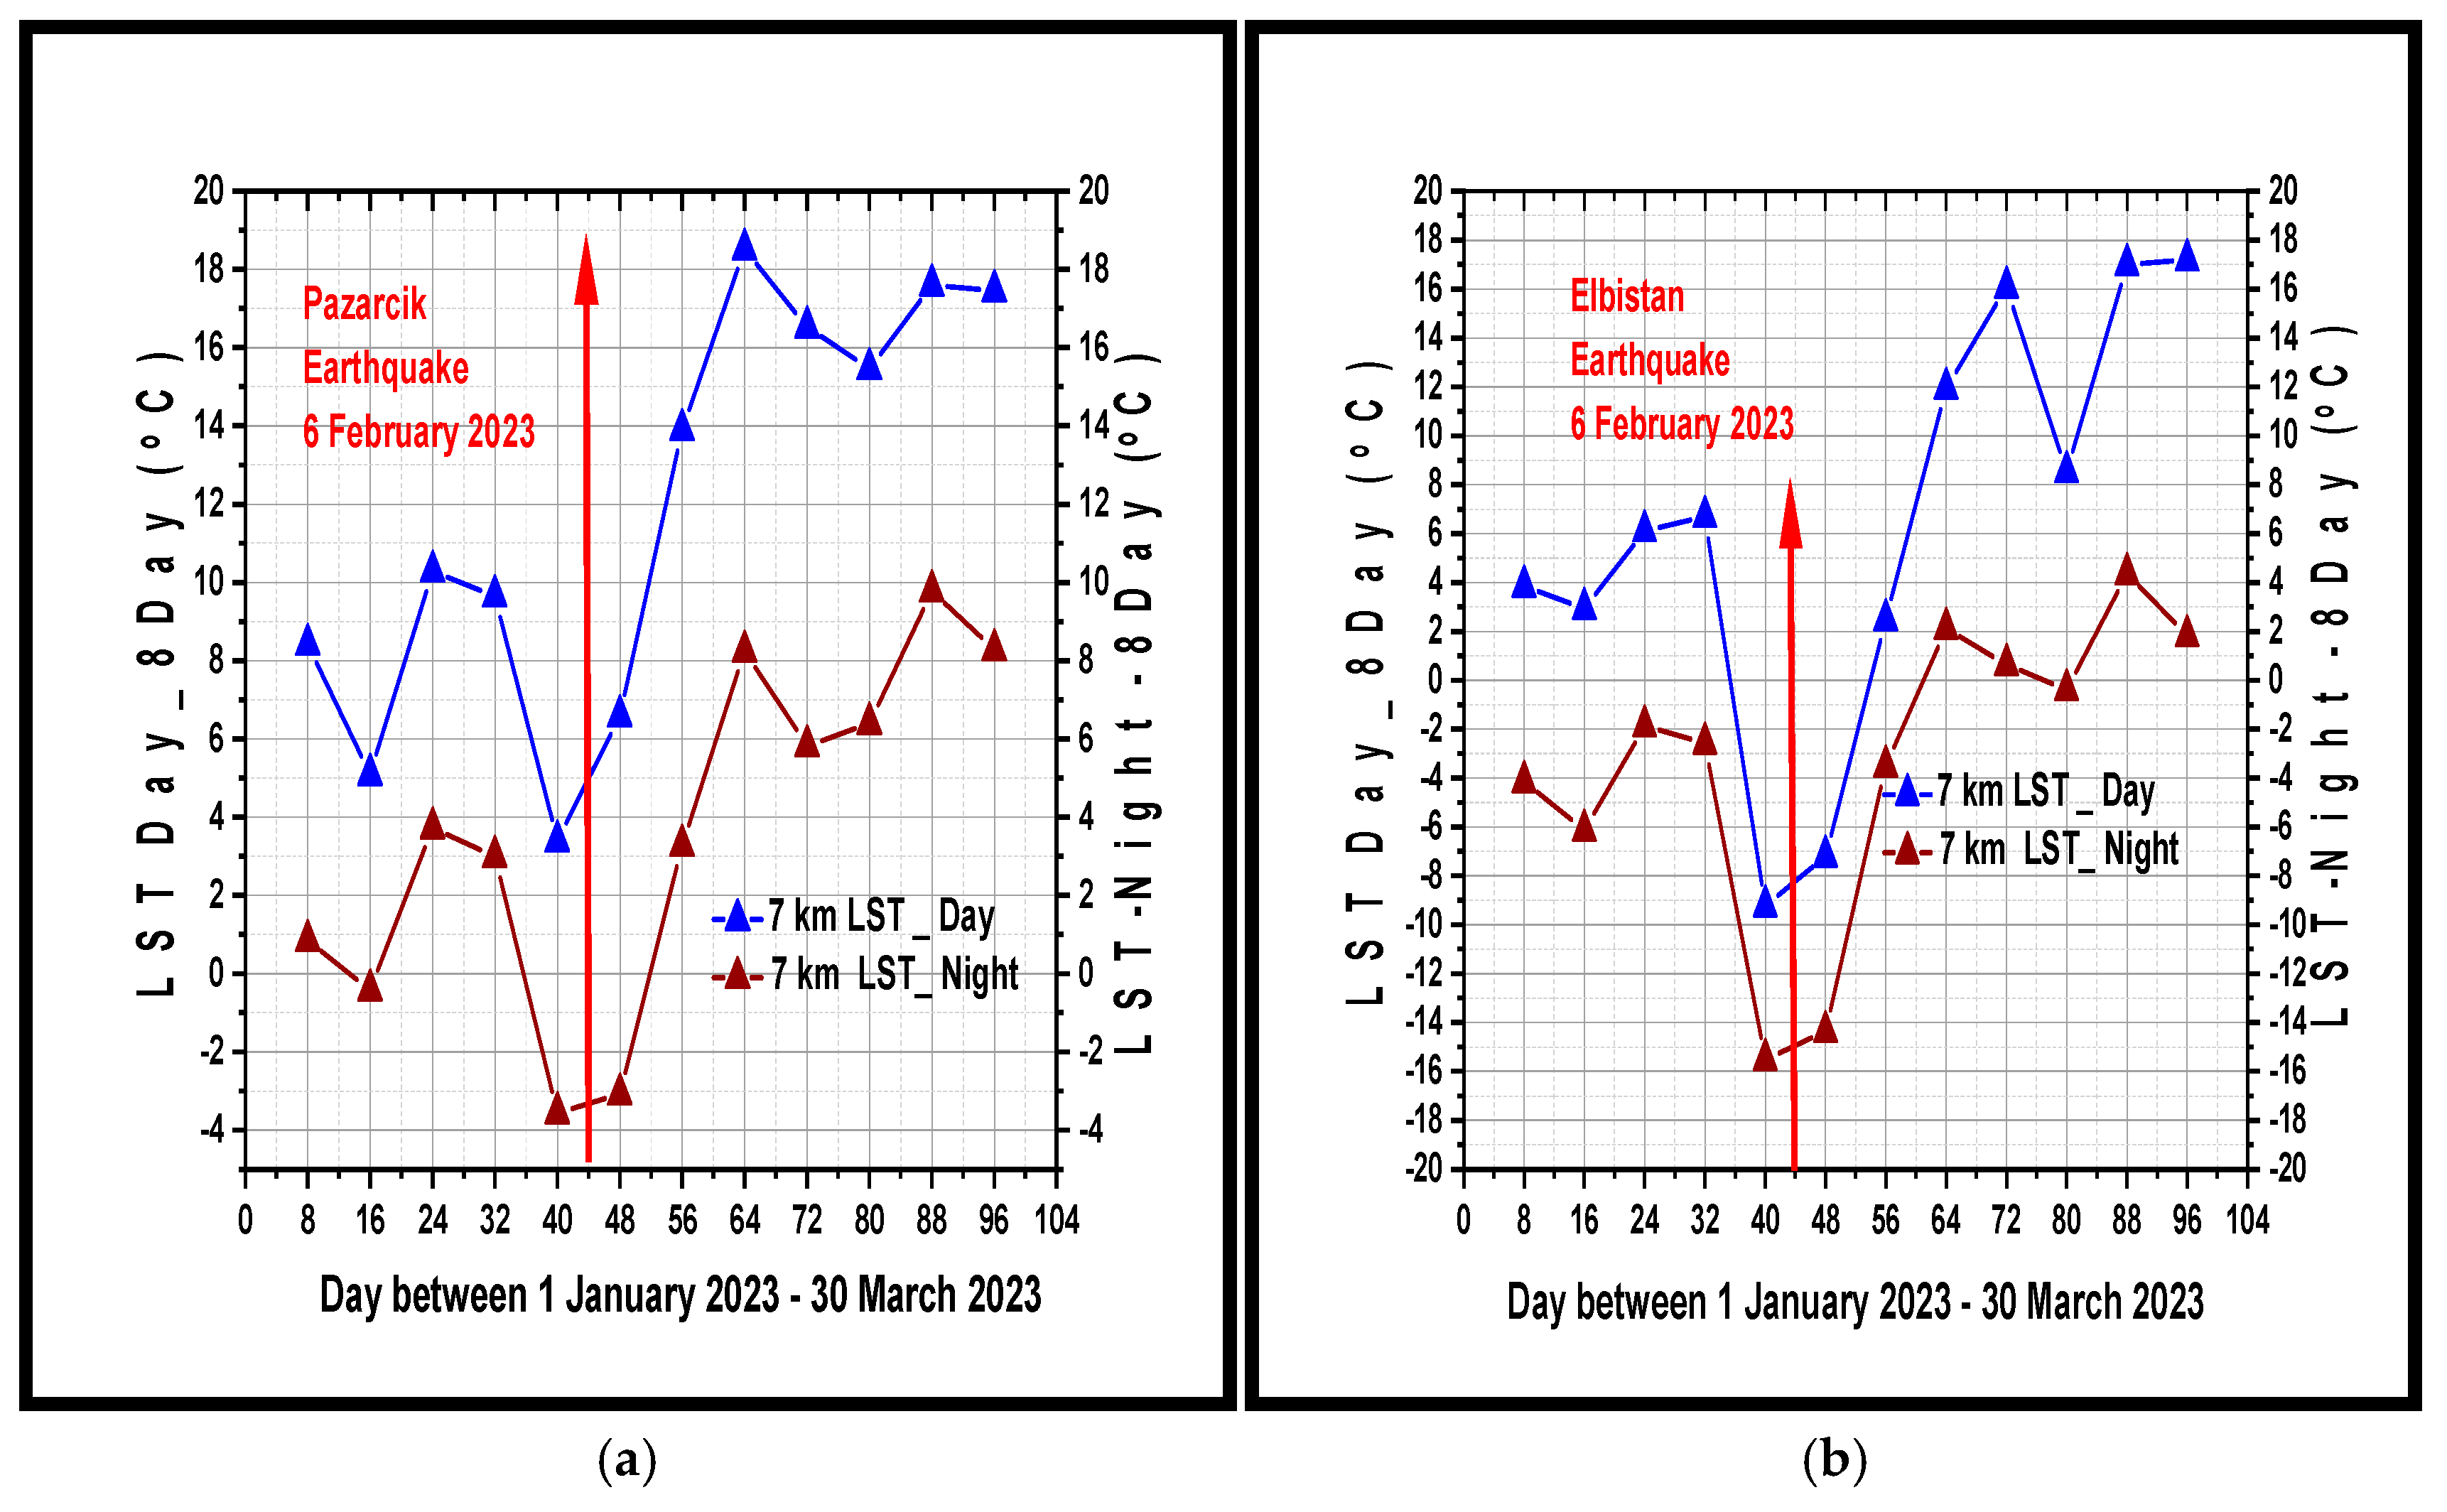
3.3. Land Surface Temperature (LST)

This study found anomalies in the satellite-derived land surface temperature (LST) before the Kahramanmaras doublet earthquake sequence in Türkiye. An accurate analysis conducted to examine the temporal distribution of the MODIS Terra 8-Day_LST values before and after the EQ1 and EQ2 seismic events around the earthquake epicenter at different distances showed the same behavior. The 8-Day LST_Day and LST_night recorded pre-seismic and post-seismic thermal anomalies for both the Pazarcik and Elbistan earthquakes. Figure 14a,b reveal a steady increase in both 8-Day LST_Day and LST_Night starting from 9 January 2023 to before the event, reaching a maximum on 25 January before a sudden decrease until 6 February 2023; this was followed by a sharp increase after the earthquake events until the end of March 2023 for both the Pazarcik and Elbistan earthquakes. After 10 February, the seismic activity decreased, but 8-Day LST_Day and LST_8 Night increased, probably attributed to continuing small tectonic activity in the Kahramanmaras region associated with fluid transfer from the depths. The scientific literature has reported similar results [30,52,53]. Detecting thermal anomalies before strong earthquakes is essential to understand and predict seismic events. Land surface temperature (LST) derived from the MODIS Terra/Aqua satellites shows the regional co-seismic temperature response attributed to the co-seismic unloading and tension over the Kahramanmaras region before both earthquakes.
The temporal pattern trend of LST can serve as pre-signal information associated with the seismicity of the Kahramanmaras area. Both EQ1 and EQ2 generated abnormalities in the LST, which are probably linked with the magnitude and focal depth of the impending shocks. The differences can be attributed to the local geomorphology and climate conditions. As observed in the LST anomalies, the pre-seismic anomalies occurred with more strength than the post-seismic thermal anomalies. Land surface temperature (LST) anomalies associated with tectonic plate movements have been reported before large earthquakes, and the relation between thermal anomalies and seismic activity has been established for several regions worldwide [66,67]. The LST shows an unusual variation beyond the defined bounds in the statistical analysis during the 10-day window before the seismic event. However, the earthquake (EQ) precursors derived from time series satellites or in situ data express an image of the pre-signal energy propagation from the lithosphere to the coversphere, atmosphere, and ionosphere. This paper analyzed the variations in multiple parameters, including AT, RH, AP, OLR, and LST, which were obtained from various satellites and ground stations related to the Kahramanmaras doublet earthquake sequence. All these parameters show an abnormal variation beyond the defined thresholds in the statistical analysis during different time windows before and after the seismic event due to the significant energy release during the earthquakes, which is in agreement with several previous findings [67,68,69,70,71]. The recorded difference in the amplitude of the meteorological parameters (AT, RH, AP) between the Pazarcik (basin point) and Elbistan (mountain point) earthquakes are attributed to the differences in the local geologic and climate conditions, but these are almost synchronous. Such differences have been observed for other large earthquakes worldwide [72,73]. All the detected possible precursors in this study may validate the lithosphere–coversphere–atmospheric coupling within the geotectonic active zone for future earthquakes in Türkiye [74,75,76].

4. Conclusions

The two strong earthquakes occurred in Türkiye on 6 February 2023, with magnitudes of M7.8 and M7.5, generating disturbances in the lower atmosphere. A complex analysis of the meteorological parameters’ variability (air temperature at 2 m height, air relative humidity, and air pressure) in the Kahramanmaras region evidenced anomalies caused by the ground motion of seismic waves, which may also be associated with the co-seismic changes.
The analysis of all the available time series data highlights a thermal build-up anomaly near the epicentral areas related to the Kahramanmaras earthquakes. From the above analysis, it may be concluded that the surface climate parameters, OLR, and LST anomalies are possible seismic precursors in earthquake forecasting that have reasonable accuracy regarding impending strong earthquakes. We analyzed pre- and post-seismic anomalies in AT, RH, AP, OLR, and LST parameters from the in situ and satellite remote sensing data provided by the National Oceanic and Atmospheric Administration, Physical Sciences Laboratory (NOAA-PSL) and Giovanni Platform. This study confirms the existence of these variables as possible seismic precursors for the large earthquakes on 6 February 2023 in Türkiye over the Pazarcik and Elbistan epicenters. Also, the findings of this study show that the recorded anomalies were evident for each earthquake in different time windows, occurring mostly between one week and a few days before and after the earthquakes. Also, this research suggests that AT, RH, AP, OLR, and LST can be used as reliable space-based precursors for earthquake forecasting in active geotectonic areas. Abnormal atmospheric cyclonic circulation was identified in the Kahramanmaras region one week before the main seismic shocks and significantly intensified one day before 6 February 2023. This may have been a key driver of the variability in the lower atmospheric meteorological parameters such as air temperature (AT), relative humidity (RH), and air pressure (AP), which potentially could have triggered earthquakes in the Pazarcık and Elbistan areas.
The seismic preparation period induces several anomalies of the in situ and satellite-recorded geophysical/geochemical parameters, known as seismic precursors, which have been observed not only on the surface of the Earth but also in the atmosphere from different satellites. The joint analysis of geospatial and in situ geophysical/geochemical information will reveal new insights in earthquake hazard assessment. Only short-term earthquake prediction is considered a useful and meaningful form for protecting human lives and social infrastructures. However, the study of earthquakes will probably increase due to global urbanization, as millions of people are exposed to earthquakes in geotectonic active areas.
This research highlighted the importance of using the synergy of multiple earthquake precursors through statistical approaches to support the understanding of lithosphere–coversphere–atmosphere–ionosphere coupling phenomena. These multi-precursor parameter irregularities can contribute to the physical understanding of coupling phenomena in the future to forecast earthquakes.

Author Contributions

M.Z.: Conceptualization; Methodology, Supervision, Review and Editing, Validation; D.S.: Data processing, Software. M.T.: Methodology, Writing. All authors have read and agreed to the published version of the manuscript.

Funding

This research received no external funding.

Institutional Review Board Statement

Not applicable.

Informed Consent Statement

Not applicable.

Data Availability Statement

The data presented in this study are available on request from the corresponding author due to privacy.

Acknowledgments

This study was supported by the Romanian Ministry of Research, Innovation and Digitalization by Research Development and Innovation Plan 2022–2027, CONTRACT PN 23 05 NUCLEU. We are very thankful to the NASA MERRA-2 derived AOD at 550 nm product provided by the Copernicus Atmosphere Monitoring Service (CAMS).

Conflicts of Interest

The authors declare no conflicts of interest.

References

  1. Yetkin, M.; Dedeoğlu, I.O.; Tunç, G. 6 February 2023, Kahramanmaraş twin earthquakes: Evaluation of ground motions and seismic performance of buildings for Elazığ, southEast of Türkiye. Soil Dyn. Earthq. Eng. 2024, 181, 108678. [Google Scholar] [CrossRef]
  2. U.S. Geological Survey. M 7.8–26 km ENE of Nurdağı, Türkiye. 2023. Available online: https://earthquake.usgs.gov/earthquakes/eventpage/us6000jllz/executive (accessed on 15 February 2023).
  3. U.S. Geological Survey. M 7.5–4 km SSE of Ekinözül, Türkiye. 2023. Available online: https://earthquake.usgs.gov/earthquakes/eventpage/us6000jlqa/executive (accessed on 15 February 2023).
  4. KOERI.Kandilli Observatory; Earthquake Research Institute. Boğaziçi University, Istanbul, Türkiye. Available online: http://www.koeri.boun.edu.tr (accessed on 10 March 2023).
  5. Meng, J.; Kusky, T.; Mooney, W.D.; Bozkurt, E.; Bodur, M.N.; Wang, L. Surface Deformations of the 6 February 2023 earthquake Sequence, Eastern Türkiye. Science 2024, 383, 298–305. [Google Scholar] [CrossRef] [PubMed]
  6. Provost, F.; Karabacak, V.; Malet, J.P.; Van der Woerd, J.; Meghraoui, M.; Masson, F.; Ferry, M.; Michéa, D.; Pointal, E. High-resolution co-seismic fault offsets of the 2023 Türkiye earthquake ruptures using satellite imagery. Sci Rep. 2024, 14, 6834. [Google Scholar] [CrossRef] [PubMed]
  7. DEMA. Earthquake Department of the Disaster and Emergency Management Presidency. Ankara, Türkiye. Available online: http://www.afad.gov.tr (accessed on 10 March 2023).
  8. Jordan, T.H.; Chen, Y.-T.; Gasparini, P.; Madariaga, R.; Main, I.; Marzocchi, W.; Papadopoulos, G.; Sobolev, G.; Yamaoka, K.; Zschau, J. OPERATIONAL earthquake FORECASTING. State of Knowledge and Guidelines for Utilization. Ann. Geophys. 2011, 54, 316–391. [Google Scholar] [CrossRef]
  9. Bormann, P. From earthquake Prediction Research to Time-Variable Seismic Hazard Assessment Applications. Pure Appl. Geophys. 2011, 168, 329–366. [Google Scholar] [CrossRef]
  10. Sornette, D.; Ouillon, G.; Mignan, A.; Freund, F. Preface to the Global earthquake Forecasting System (GEFS) special issue: Towards using non-seismic precursors for the prediction of large earthquakes. Eur. Phys. J. Spec. Top. 2021, 230, 1–5. [Google Scholar] [CrossRef]
  11. Tobita, T.; Kiyota, T.; Torisu, S.; Cinicioglu, O.; Tonuk, G.; Milev, N.; Contreras, J.; Contreras, O.; Shiga, M. Geotechnical damage survey report on 6 February 2023 Türkiye-Syria earthquake, Türkiye. Soils Found. 2024, 64, 101463. [Google Scholar] [CrossRef]
  12. Pulinets, S.; Budnikov, P.; Karelin, A.; Žalohar, J. Thermodynamic instability of the atmospheric boundary layer stimulated by tectonic and seismic activity. J. Atmos. Sol. Terr. Phys. 2023, 246, 106050. [Google Scholar] [CrossRef]
  13. Lu, K.; Hou, M.; Jiang, Z.; Wang, Q.; Sun, G.; Liu, J. Understanding earthquake from the Granular Physics Point of View-Causesof earthquake, earthquake Precursors and Predictions. Int. J. Mod. Phys. B 2018, 32, 1850081. [Google Scholar] [CrossRef]
  14. Xiong, P.; Shen, X.H.; Bi, Y.X.; Kang, C.L.; Chen, L.Z.; Jing, F.; Chen, Y. Study of Outgoing Longwave Radiation Anomalies Associated with Haiti Earth quake. Nat. Hazards Earth Syst. Sci. 2010, 10, 2169–2178. [Google Scholar] [CrossRef]
  15. Sun, R.; Wang, J.; Cheng, Q.; Mao, Y.; Ochieng, W.Y. A New IMU-Aided Multiple GNSS Fault Detection and Exclusion Algorithm for Integrated Navigation in Urban Environments. GPS Solut. 2021, 25, 147. [Google Scholar] [CrossRef]
  16. Jiao, Z.; Shan, X. Pre-Seismic Temporal Integrated Anomalies from Multiparametric Remote Sensing Data. Remote Sens. 2022, 14, 2343. [Google Scholar] [CrossRef]
  17. Pulinets, S.; Ouzounov, D. Lithosphere–Atmosphere–Ionosphere Coupling (LAIC) Model—An Unified Concept for Earth quake Precursors Validation. J. Asian Earth Sci. 2011, 41, 371–382. [Google Scholar] [CrossRef]
  18. Dong, W.; Yang, Y.; Qu, J.; Xiao, S.; Li, Y. Local Information-Enhanced Graph-Transformer for Hyperspectral Image Change Detection with Limited Training Samples. IEEE Trans. Geosci. Remote Sens. 2023, 61, 5509814. [Google Scholar] [CrossRef]
  19. Wu, L.; Qin, K.; Liu, S. GEOSS-Based Thermal Parameters Analysis for earthquake Anomaly Recognition. Proc. IEEE 2012, 100, 2891–2907. [Google Scholar] [CrossRef]
  20. Vesnin, A.; Yasyukevich, Y.; Perevalova, N.; Senturk, E. Ionospheric Response to the 6 February 2023 Türkiye–Syria Earth quake. Remote Sens. 2023, 15, 2336. [Google Scholar] [CrossRef]
  21. Bari Jahed, A.; Aydan, Ö.; Ito, T.; Iwata, N. Evaluation of crustal deformation and associated strong motions induced by the 2022 Paktika earthquake, Afghanistan. Earthq. Sci. 2024, 37, 546–557. [Google Scholar] [CrossRef]
  22. Ranjan, P.; Konstantinou, K.I. Local earthquake tomography of the Aegean crust: Implications for active deformation, large earthquakes, and arc volcanism. Tectonophysics 2024, 880, 230331. [Google Scholar] [CrossRef]
  23. Şahin, U.A.; Kaynak, B. Questioning whether there was a short-term interaction between the 6 February 2023 earthquakes and air quality parameters in Türkiye. Chemosphere 2024, 347, 140616. [Google Scholar] [CrossRef]
  24. Kutoglu, H.; Ghasempour, F.; Sekertekin, F. Investigation of Possible MODIS AOD Anomalies as earthquake Precursors for Global earthquakes. Adv. Space Res. 2021, 68, 3531–3545. [Google Scholar] [CrossRef]
  25. Varotsos, C.A.; Efstathiou, M.N.; Cracknell, A.P. On the association of aerosol optical depth and total ozone fluctuations with recent earthquakes in Greece. Acta Geophys. 2017, 65, 659–665. [Google Scholar] [CrossRef]
  26. Zoran, M.; Savastru, R.; Savastru, D. Ground based 222 Radon observations in Bucharest, Romania and their application to geophysics. J. Radioanal. Nucl. Chem. 2012, 293, 877–888. [Google Scholar] [CrossRef]
  27. Muafiry, I.N.; Meilano, I.; Wijaya, D.D.; Sentürk, E.; Heki, K. Ionospheric changes immediately before the 2023 February Kahramanmaras earthquakes, Türkiye. Adv. Space Res. 2024. [Google Scholar] [CrossRef]
  28. Heki, K. Ionospheric electron enhancement preceding the 2011 Tohoku-oki earthquake. Geophys. Res. Lett. 2011, 38, L17312. [Google Scholar] [CrossRef]
  29. Heki, K.; Nakatani, M.; Zhan, W. Ionospheric changes immediately before the 2008 Wenchuan earthquake. Adv. Space Res. 2024, 73, 4539–4545. [Google Scholar] [CrossRef]
  30. Su, J.; Chen, H. Study on the mechanism of atmospheric electric field anomalies before earthquakes. Results Geophys. Sci. 2023, 15, 100060. [Google Scholar] [CrossRef]
  31. Wang, T.; Zhu, S.N.; Yang, C.S.; Wei, Y.J.; Zhao, C.Y.; Hou, H.C. Co- and Post-seismic Deformation Mechanisms of the 2020 Mw6.0 Jiashi earthquake in Xinjiang (China), Revealed by Sentinel-1 InSAR Observations. Front. Environ. Sci. 2022, 10, 933200. [Google Scholar] [CrossRef]
  32. Colonna, R.; Filizzola, C.; Genzano, N.; Lisi, M.; Tramutoli, V. Optimal Setting of earthquake-Related Ionospheric TEC (Total Electron Content) Anomalies Detection Methods: Long-Term Validation over the Italian Region. Geosciences 2023, 13, 150. [Google Scholar] [CrossRef]
  33. Fraser, J.; Vanneste, K.; Ferrari, H. Recent behavior of the North Anatolian Fault: Insights from an integrated paleoseismological data set. J. Geophys. Res. 2010, 115, B09316. [Google Scholar] [CrossRef]
  34. Sengor, A.; Tuysuz, O.; Imren, C.; Sakinc, M.; Eyidogan, H.; Gorur, N.; Le Pichon, X.; Rangin, C. The North Anatolian Fault: A new look. Annu. Rev. Earth Panet. Sci. 2005, 33, 37–112. [Google Scholar] [CrossRef]
  35. Gomez, F.; Cochran, W.J.; Yassminh, R.; Jaafar, R.; Reilinger, R.; Floyd, M.; King, R.W.; Barazangi, M. Fragmentation of the Sinai Plate indicated by spatial variation in present-day slip rate along the Dead Sea Fault System. Geophys. J. Int. 2020, 221, 1913–1940. [Google Scholar] [CrossRef]
  36. Goldberg, D.E.; Taymaz, T.; Reitman, N.G.; Hatem, A.E.; Yolsal-Çevikbilen, S.; Barnhart, W.D.; Serkan Irmak, T.; Wald, D.J.; Öcalan, T.; Altuntaş, C.; et al. Rapid characterization of the February 2023 Kahramanmaraş, Türkiye, earthquake sequence. Seism. Rec. 2023, 3, 156–167. [Google Scholar] [CrossRef]
  37. Delph, J.R.; Darin, M.H.; Whitney, D.L.; Cosca, M.A.; Teyssier, C.; Kaymakci, N.; Eken, T.; Reid, M.R.; Beck, S.L. Deep Lithospheric Controls on Surface Deformation and Seismicity around the East Anatolian Fault Zone and A3 Triple Junction. GSA Today 2024, 34, 4–12. [Google Scholar] [CrossRef]
  38. Özbey, V.; Sengör, A.M.C.; Henry, P.; Özeren, M.S.; Haines, A.J.; Klein, E.C.; Tarı, E.; Zabcı, C.; Chousianitis, K.; Güvercin, S.E.; et al. Kinematics of the Kahramanmaraş triple junction and of Cyprus: Evidence of shear partitioning. BSGF Earth Sci. Bullet. 2024, 195, 15. [Google Scholar] [CrossRef]
  39. Tan, O. Long-term aftershock properties of the catastrophic 6 February 2023 kahramanmaraş (Türkiye) earthquake sequence. Acta Geophy. 2024, 1–18. [Google Scholar] [CrossRef]
  40. Maletckii, B.; Astafyeva, E.; Sanchez, S.A.; De Paula, E.R. The 6 February 2023 Turkiye earthquake Sequence as Detected in the Ionosphere. J. Geophys. Res. Space Phys. 2023, 128, e2023JA031663. [Google Scholar] [CrossRef]
  41. GIOVANNI. Geospatial Interactive Online Visualization and Analysis Infrastructure GIOVANNI. 2024. Available online: https://giovanni.gsfc.nasa.gov/giovanni (accessed on 20 September 2024).
  42. MERRA. 2024. Available online: http://www.soda-pro.com/web-services/meteo-data/merra (accessed on 25 September 2024).
  43. NOAA. Physical Sciences Laboratory. 2024. Available online: Phttps://psl.noaa.gov/data/composites/day/ (accessed on 20 September 2024).
  44. MODIS. 2024. Available online: https://modis.ornl.gov/data.html (accessed on 12 September 2024).
  45. Wan, Z.; Hook, S.; Hulley, G. MOD11A2 MODIS/Aqua Land Surface Temperature/Emissivity 8-Day L3 Global 1 km SIN Grid V061: NASA EOSDIS Land Processes DAAC; NASA EOSDIS Land Processes Distributed Active Archive Center: Sioux Falls, SC, USA, 2021. [Google Scholar] [CrossRef]
  46. Copernicus. 2024. Available online: https://cds.climate.copernicus.eu/ (accessed on 20 September 2024).
  47. Dobrovolsky, I.P.; Zubkov, S.I.; Miachkin, V.I. Estimation of the size of earthquake preparation zones. Pure Appl. Geophys. 1979, 117, 1025–1044. [Google Scholar] [CrossRef]
  48. Bowman, D.D.; Ouillon, G.; Sammis, C.G.; Sornette, A.; Sornette, D. An Observational Test of the Critical earthquake Concept. J. Geophys. Res. 1998, 103, 359372–359424. [Google Scholar] [CrossRef]
  49. Zoran, M. MODIS and NOAA-AVHRR land surface temperature data detect a thermal anomaly preceding the 11 March 2011 Tohoku earthquake. Int. J. Remote Sens. 2012, 33, 6805–6817. [Google Scholar] [CrossRef]
  50. Ghosh, S.; Sasmal, S.; Maity, S.K.; Potirakis, S.M.; Hayakawa, M. Thermal Anomalies Observed during the CreteEarthquake on 27 September 2021. Geosciences 2024, 14, 73. [Google Scholar] [CrossRef]
  51. Haider, S.F.; Shah, M.; Alarifi, N.S.; Abukhadra, M.R. The 2023 Mw 6.8 Morocco earthquake induced atmospheric and ionospheric anomalies. J. Atmos. Sol. Terr. Phys. 2024, 262, 106323. [Google Scholar] [CrossRef]
  52. Qasim, M.; Shah, M.; Shahzad, R.; Jamjareegulgarn, P. Atmospheric precursors from multiple satellites associated with the 2020 Mw 6.5 Idaho (USA) earthquake. Adv. Space Res. 2024, 73, 106323. [Google Scholar] [CrossRef]
  53. Khan, M.M.; Ghaffar, B.; Shahzad, R.; Khan, M.R.; Shah, M.; Amin, A.H.; Ali, R. Atmospheric anomalies associated with the 2021 M w 7.2 Haiti earthquake using machine learning from multiple satellites. Sustainability 2022, 14, 14782. [Google Scholar] [CrossRef]
  54. Filizzola, C.; Corrado, A.; Genzano, N.; Lisi, M.; Pergola, N.; Colonna, R.; Tramutoli, V. RST Analysis of Anomalous TIR Sequences in Relation with earthquakes Occurred in Türkiye in the Period 2004–2015. Remote Sens. 2022, 14, 381. [Google Scholar] [CrossRef]
  55. Haider, S.F.; Shah, M.; Li, B.; Jamjareegulgarn, P.; de Oliveira-Junior, J.F.; Zhou, C. Synchronized and Co-Located Ionospheric and Atmospheric Anomalies Associated with the 2023 Mw 7.8 Türkiye earthquake. Remote Sens. 2024, 16, 222. [Google Scholar] [CrossRef]
  56. Akhoondzadeh, M.; Marchetti, D. Study of the Preparation Phase of Türkiye’s Powerful earthquake (6 February 2023) by a Geophysical MultiParametric Fuzzy Inference System. Remote Sens. 2023, 15, 2224. [Google Scholar] [CrossRef]
  57. Pulinets, S.; Budnikov, P. Atmosphere critical processes sensing with ACP. Atmosphere 2022, 13, 1920. [Google Scholar] [CrossRef]
  58. Szakács, A. Precursor-Based earthquake Prediction Research: Proposal for a Paradigm-Shifting Strategy. Front. Earth Sci. 2021, 8, 548398. [Google Scholar] [CrossRef]
  59. De Santis, A.; Cianchini, G.; Marchetti, D.; Piscini, A. A Multiparametric Approach to Study the Preparation Phase of the 2019 M7.1 Ridgecrest (California, United States) earthquake. Front. Earth Sci. 2020, 8, 540398. [Google Scholar] [CrossRef]
  60. Martinelli, G.; Peresan, A.; Li, Y. Editorial: Achievements and New Frontiers in Research Oriented to earthquake Forecasting. Front. Earth Sci. 2021, 9, 793911. [Google Scholar] [CrossRef]
  61. Guo, A.; Jiang, N.; Xu, Y.; Xu, T.; Wu, Y.; Li, S.; Gao, Z. Co-seismic characterization analysis in PWV and land-atmospheric observations associated with Luding Ms 6.8 earthquake occurrence in China on 5 September 2022. Geomat. Nat. Hazards Risk 2023, 14, 2279494. [Google Scholar] [CrossRef]
  62. Satti, M.S.; Ehsan, M.; Abbas, A.; Shah, M.; de Oliveira-Júnior, J.F.; Naqvi, N.A. Atmospheric and Ionospheric Precursors Associated with Mw ≥ 6.5 earthquakes 8 from Multiple Satellites. J. Atmos. Sol. Terr. Phys. 2022, 227, 105802. [Google Scholar] [CrossRef]
  63. Shah, M.; Calabia, A.; Tariq, M.A.; Ahmed, J.; Ahmed, A. Possible ionosphere and atmosphere precursory analysis related to Mw >6.0 earthquakes in Japan. Remote Sens. Environ. 2020, 239, 111620. [Google Scholar] [CrossRef]
  64. Venkatanathan, N.; Kaarthick, B.; Priyadharshini, C. OLR Anomalies Prior to Big earthquakes (Mw > 6.0)—A Case Study on earthquakes of India’s Neighboring Region Occurred during the Year 2012. New Concepts Glob. Tecton. 2013, 1, 34–44. [Google Scholar]
  65. Shah, M.; Draz, M.U.; Saleem, T.A. Comprehensive Study on the synchronized Outgoing Longwave Radiation and Relative Humidity Anomalies related to global Mw ≥ 6.5 earthquakes. Nat. Hazards 2023, 7, 24–46. [Google Scholar] [CrossRef]
  66. Hameed, A.; Shah, M.; Ghaffar, B.; Riaz, S.; Jamjareegulgarn, P.; Alarifi, N.S.; Abukhadra, M.R. Possible atmospheric-ionospheric precursors of the 2020 Hotan China earthquake from various satellites. Adv. Space Res. 2024, 74, 3326–3343. [Google Scholar] [CrossRef]
  67. Mahmood, I.; Iqbal, M.F.; Shahzad, M.I.; Qaiser, S. Investigation of Atmospheric Anomalies Associated with Kashmir and Awaran earthquakes. J. Atmos. Sol. Terr. Phys. 2017, 154, 75–85. [Google Scholar] [CrossRef]
  68. Nikulin, S.; Sergieieva, K.; Korobko, O.; Kashtan, V. Using the Contrast Boundary Concentration of LST for the earthquake Approach Assessment in Türkiye, 6–8 February 2023. Earth 2024, 5, 388–403. [Google Scholar] [CrossRef]
  69. Simha, C.P.; Natarajan, V.; Dumka, R.; Rao, K.M. Spatial and temporal behaviour of Ionospheric VTEC and Atmospheric parameters before New Zealand earthquake on 13 November 2016 (M 7.8). J. Appl. Geophys. 2023, 212, 104989. [Google Scholar] [CrossRef]
  70. Dal Zilio, L.; Ampuero, J.P. earthquake doublet in Türkiye and Syria. Commun. Earth Environ. 2023, 4, 71. [Google Scholar] [CrossRef]
  71. Draz, M.U.; Shah, M.; Jamjareegulgarn, P.; Shahzad, R.; Hasan, A.M.; Ghamry, N.A. Deep machine learning based possible atmospheric and ionospheric precursors of the 2021 Mw 7.1 Japan earthquake. Remote Sens. 2023, 15, 1904. [Google Scholar] [CrossRef]
  72. Jing, F.; Zhang, L.; Singh, R.P.; Chauhan, A.; Jiang, M. Quasi-coseismic variations and geosphere coupling associated with the strong 2023 Türkiye earthquakes. Sci. Total Environ. 2024, 907, 167963. [Google Scholar] [CrossRef] [PubMed]
  73. Khan, S.; Shah, M.; Jamjareegulgarn, P.; Alarifi, N.S.; Abukhadra, M.R.; Khan, M. Remotely sensed atmospheric anomalies of the 2022 Mw 7.0 Bantay, Philippines Earthquake. Adv. Space Res. 2024, in press. [Google Scholar] [CrossRef]
  74. Freund, F.T. Pre-Earthquake signals: Underlying physical processes. J. Asian Earth Sci. 2011, 41, 383–400. [Google Scholar] [CrossRef]
  75. Pulinets, S.; Ouzounov, D.; Karelin, A.; Boyarchuk, K. Earthquake Precursors in the Atmosphere and Ionosphere: New Concepts; Springer: Berlin/Heidelberg, Germany, 2022. [Google Scholar] [CrossRef]
  76. Pulinets, S.A.; Dunajecka, M.A. Specific variations of air temperature and relative humidity around the time of Michoacan earthquake M8.1 19 September 1985 as a possible indicator of interaction between tectonic plates. Tectonophysics 2007, 431, 221–230. [Google Scholar] [CrossRef]
Figure 1. Kahramanmaras earthquakes epicenters (red stars), main fault zones, plates, impacted area (dash box), and their movement direction (yellow arrows) in and around Türkiye.
Atmosphere 15 01514 g001
Figure 2. NOAA positive composite anomaly map of air temperature at 2 m height AT for Pazarcik (EQ1) and Elbistan (EQ2) earthquakes in Türkiye between July 2022 and 6 February 2023. (Red stars represent focal points of the earthquakes).
Atmosphere 15 01514 g002
Figure 3. NOAA negative composite anomaly map of air temperature at 2 m height AT after Pazarcik (EQ1) and Elbistan (EQ2) earthquakes in Türkiye during 7 February 2023 and 15 February 2023 (white stars represent focal points).
Atmosphere 15 01514 g003
Figure 4. Temporal patterns of air temperature at 2 m height AT for Pazarcik and Elbistan earthquakes (The pink arrow represents the day when the EQ1 and EQ2 happened).
Atmosphere 15 01514 g004
Figure 5. Temporal patterns of air relative humidity RH for EQ1 (Pazarcik) and EQ2 (Elbistan) earthquakes. (The pink arrow represents the day when the EQ1 and EQ2 happened).
Atmosphere 15 01514 g005
Figure 6. NOAA positive composite anomaly map of surface air relative humidity for Pazarcik (EQ1) and Elbistan (EQ2) earthquakes in Türkiye between 1 February and 6 February 2023.
Atmosphere 15 01514 g006
Figure 7. Temporal patterns of surface air pressure for Pazarcik and Elbistan earthquakes. (The pink arrows represent the day when the EQ1 and EQ2 occurred).
Atmosphere 15 01514 g007
Figure 8. NOAA negative composite anomaly map of surface air pressure AP during pre-earthquake period 1 February–6 February 2023 over Pazarcik (EQ1) and Elbistan (EQ2) areas in Türkiye.
Atmosphere 15 01514 g008
Figure 9. NOAA negative composite anomaly map of surface geopotential map over Türkiye and Pazarcik (EQ1) and Elbistan (EQ2) areas between 1 February 2023 and 6 February 2023.
Atmosphere 15 01514 g009
Figure 10. NOAA positive composite anomaly map of surface OLR over Türkiye and Pazarcik (EQ1) and Elbistan (EQ2) areas between 1 July 2022 and 6 February 2023.
Atmosphere 15 01514 g010
Figure 11. NOAA negative composite anomaly map of surface OLR centered on Pazarcik (EQ1) and Elbistan (EQ2) areas between 28 January 2023 and 31 January 2023.
Atmosphere 15 01514 g011
Figure 12. NOAA negative composite anomaly map of surface OLR centered on Pazarcik (EQ1) and Elbistan (EQ2) areas between 1 February 2023 and 6 February 2023.
Atmosphere 15 01514 g012
Figure 13. NOAA positive composite anomaly map of surface OLR centered on Pazarcik (EQ1) and Elbistan (EQ2) areas between 7 February 2023 and 28 February 2023.
Atmosphere 15 01514 g013
Figure 14. LST MODIS/Terra_8 Day_Night variation for the period 1 January to 30 March 2023 for two test areas: (a) EQ1 centered on Pazarcik with 7 km radius; (b) EQ2 centered on Elbistan with 7 km radius.
Atmosphere 15 01514 g014
Disclaimer/Publisher’s Note: The statements, opinions and data contained in all publications are solely those of the individual author(s) and contributor(s) and not of MDPI and/or the editor(s). MDPI and/or the editor(s) disclaim responsibility for any injury to people or property resulting from any ideas, methods, instructions or products referred to in the content.

