Abstract
In this study, the spatial–temporal characteristics of AOD in the Yellow River Basin (YRB) and urban agglomerations within the basin were analyzed at a 1 km scale from 2011 to 2020 based on the MCD19A2 AOD dataset. This study shows the following: (1) From 2011 to 2020, the AOD value of the YRB showed a declining trend, with 96.011% of the zones experiencing a decrease in AOD. The spatial distribution of AOD displayed a pattern of high in the east, low in the west, high in the south, and low in the north. The rate of decline showed a distribution pattern of fast in the southeast and slow in the northwest. (2) The AOD in the YRB showed similar characteristics in different seasons: the south and east were consistently higher than the north and west. The seasonal AOD values in the YRB showed the following pattern: summer > spring > autumn > winter. The AOD values of urban agglomeration were basically larger in spring and summer. (3) The SDE and mean center of the yearly AOD were located in the southeast and Shanxi Province, with the movement from southeast to northwest. It can be divided into three stages based on the movement trajectory: northeast–southwest round-trip movement (2011–2014), one-way movement to the northwest (2014–2018), and southeast–northwest round-trip movement (2018–2020).
1. Introduction
Aerosols are defined as solid or liquid particles that are suspended within the Earth’s atmosphere, typically ranging from 0.001 to 100 μm in size [1]. The complex interactions of aerosol particles with solar radiation have been recognized for their importance in climate dynamics and radiation balance [2]. This aspect represents one of the most unclear variables in the context of climate variation. The physical and optical characteristics of aerosols are subject to temporal variations due to processes such as hygroscopy, condensation, and gas-to-particle conversion [3]. The complex nature of aerosol characterization, coupled with the scarcity of reliable measurements, contributes to considerable uncertainties in assessing their underlying effects on climate. A regionally focused knowledge of aerosol properties, along with its spatial–temporal distribution, is crucial for precisely reckoning the impacts of aerosols on both the environment and human health [4]. As a fundamental optical property of aerosols, aerosol optical depth (AOD) is the vertical integral of the extinction coefficient, which quantifies the attenuation of light by aerosols [5]. AOD measurements can serve as an indicator of atmospheric levels to a certain extent [6].
AOD measurements are mainly carried out by ground stations or satellite remote sensing. The Aerosol Robotic Network (AERONET) provides a ground-based AOD that has clearly enhanced the study of aerosol impacts, coordinated by the National Aeronautics and Space Administration (NASA) [7]. However, there are deficiencies in spatial coverage, which make it difficult to realize large-area continuum observations [8]. However, remote sensing satellite measurements of AOD fill this gap to a large extent. Numerous studies have utilized satellite data to discuss the spatial–temporal distribution and evolutionary characteristics of AOD across various regions. The Moderate Resolution Imaging Spectroradiometer (MODIS), one of the most widely employed sensors, offers a satellite-based daily AOD characterized by a high spectral resolution and global coverage [4]. For example, Yuan et al. [9] confirmed the good accuracy of the MOD04_3K and analyzed the spatial–temporal variations in AOD in Hangzhou. Wang et al. [10] used MYD08_M3 to reveal the AOD characteristics in Central Asia over years, seasons, and months. AOD reanalysis data generated by assimilating a variety of data, including MODIS, are even available and have been used in spatial–temporal analysis [11].
The Multi-Angle Implementation of Atmospheric Correction (MAIAC) algorithm [12] provides a 1 km resolution AOD retrieval that was found to perform well globally over South America [13], South Asia [14], and Europe [15,16]. This demonstrates its wide availability in different regions. For the past few years, industrial activity and urbanization have increased significantly, driven by rapid economic development. Notable instances of regional haze pollution have been documented in some locations, including the Beijing–Tianjin–Hebei city cluster, the Pearl River Delta, the northwestern region of China, and the Yangtze River Delta. In conjunction with these events, corresponding aerosol studies have also been conducted [17,18,19,20]. These studies demonstrated the complexity and severity of aerosols in watersheds as well as in economically developed regions. Therefore, aerosol studies in such study areas are urgent and important for the improvement of the atmospheric environment. The Yellow River Basin (YRB) has special geographical conditions. This paper focuses instead on a very important watershed in China, the YRB, and its urban agglomerations. Based on the MAIAC AOD, the YRB and its urban agglomerations were selected as the study area to discuss the different temporal–spatial patterns of AOD and to analyze the regional aerosol features. Such insights are crucial for enhancing air pollution monitoring and assessment, as well as informing environmental policy formulation.
2. Materials and Methods
2.1. Study Area
The Yellow River (YR), China’s second-longest river, spans 5464 km from 30° N to 42° N and 95° E to 120° E [21] (Figure 1). It has various geomorphic types [22]. The YRB plays a critical role in China’s ecological security and serves as a vital hub for civil activities and financial development [23]. It is a crucial and strategic element in the national development and social modernization of China [24,25]. The YRB has a continental climate, with a semihumid, semiarid, and arid climate from the southeast to northwest. The annual range of temperature is more than 20 °C, with an average annual rainfall within 200–600 mm [26]. The region has a high intensity, wide range, and a long history. To provide a clear direction for high-quality development in the current and future periods, the Chinese State Council has made and released the Outline of Ecological Protection and High-Quality Development of the YRB [27].
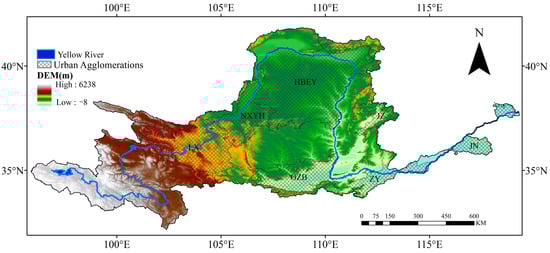
Figure 1.
Overview of the study areas (seven major urban agglomerations in the YRB: Lanzhou—Xining (LX), Ningxia along the YR (NXYH), Hubao Eyu (HBEY), Guanzhong Basin (GZB), Jinzhong (JZ), central plains (ZY), and Jinan metropolitan area (JN)).
2.2. MCD19A2 AOD
NASA has developed the Multi-Angle Implementation of Atmospheric Correction (MAIAC) algorithm for the retrieval of atmospheric AOD [28]. This algorithm represents a sophisticated approach that integrates time series analysis with both pixel-based and image-based processing techniques, thereby enhancing the precision of cloud detection, aerosol retrieval, and atmospheric corrections [29]. The MCD19A2 product, part of the MODIS C6 aerosol dataset released by NASA, includes AOD measurements at 550 nm, asymmetry factors, and other relevant parameters [30]. MCD19A2 data, which encompass the years 2011 to 2020, were selected to generate 550 nm AOD for aerosol studies. The batch processing of band extraction, reprojection, and mosaic was completed by IDL code programming to obtain the AOD daily mean data of WGS84 projection. The IDL code was also applied to calculate the average values for each quarter and year. Among them, according to the meteorological division standard, March to May was classified as spring, June to August as summer, September to November as autumn, and December to February as winter.
2.3. Methods
2.3.1. Theil–Sen Slope
The Theil–Sen slope represents a robust non-parametric approach to statistical trend analysis [31,32]. It was employed for the purpose of analyzing the AOD trend, which was calculated as follows:
In the formula, i and j represent the years. SAOD denotes the Theil–Sen Median; AODi and AODj represent the value of AOD in the i and j year; AOD exhibits an increasing trend when SAOD > 0; otherwise, it shows a decreasing trend.
2.3.2. Mann–Kendall Test
The Mann–Kendall (MK) test does not assume that measurements adhere to a normal distribution and it is robust against missing values and outliers. It is a non-parametric statistical test that measures the significance of a trend [33,34]. This study used the MK test to assess the significance level of the AOD trend.
In the formula, a and b represent the years. AODa and AODb are pixel values of the a and b year; denotes the length of the AOD time series (the years from 2011 to 2020); and sgn() denotes a symbolic function, which is calculated by the following formula:
The test statistic Z is used for trend testing and is calculated as follows:
For the significance level a, when || > it indicates that there is a distinct rising or descending trend. || is larger than or equal to 2.58 and 1.96 when the significance test’s confidence levels are 99% and 95%, respectively.
2.3.3. Standard Deviation Ellipse (SDE)
The standard deviation ellipse (SDE) is a statistical technique for quantifying the concentration of unit locations on a spatial map [35]. The SDE describes the distribution of temporally and spatially significant situations, and quantitatively identifies the development direction of the dominant trend of activity. In this study, we employed the AOD dataset for the YRB from 2011 to 2020, utilizing the evolution of the SDE to analyze the AOD trend and to determine the direction of AOD development.
3. Results
3.1. Interannual Variation in AOD in the YRB
The value of AOD in the YRB fluctuated between 0.232 and 0.300 from 2011 to 2020, with an average of 0.252 (Figure 2a and Table 1). During the ten-year period, AOD showed a general decline trend, with a linear downward trend slope of −0.0071. Before 2016, its spiral downward shape was obvious. While the AOD values had occasional ups and downs after 2016, the AOD values remained consistently below the ten-year average. Over time, the AOD gradually stabilized at around 0.232, which is 0.02 below the average AOD level. The number of years in which the AOD was up or down was about the same. However, all of the rising years had increases of less than 5%, while all of the falling years had increases of more than 5%. The year with the largest decline was 2012. Compared to 2011, the AOD value in 2012 decreased by 0.036 with 11.856%.
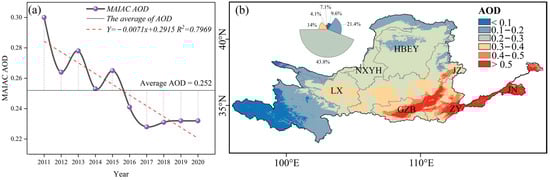
Figure 2.
(a) Interannual variation and (b) spatial pattern of AOD in the YRB.

Table 1.
Yearly AOD values and changes from 2011 to 2020 in the YRB.
In terms of spatial distribution, AOD as a whole performed a distribution of high in the east and low in the west (Figure 2b). Among them, the areas with high AOD values (AOD > 0.5) and low AOD values (AOD < 0.1) occupied 7.509% and 9.578% of the whole basin. The low AOD values were dominantly focused in the upper part of the basin, and high AOD values were focused in the southeastern part of the basin. There were also high values concentrated in the southern part of the YRB, connecting the JZ and GZB. Therefore, the distribution of low values in the north and high values in the south of the YR Basin was also shown in the area of 105°–115° E.
The spatial trend of AOD in the YRB basically showed a decline, with the total percentage of declining areas reaching 96.011% (Figure 3a). The rate of decline showed a distribution pattern of fast in the southeast and slow in the northwest. Among them, the proportion of regions with a rate of decline of more than 3% reached 3.684%, with the most pronounced downward trend in the southeastern location. The upward trend was sporadic in the western and northern parts of the YRB, accounting for only 3.989% of the area. The MK test of the trend in Figure 3b revealed that more than half of the region passed the test of significance and the trend values were distributed between −0.103 and 0.068. Within the spatial range that passed the test, the AOD trend values were concentrated between −0.0075 and 0, showing a mildly decreasing response.
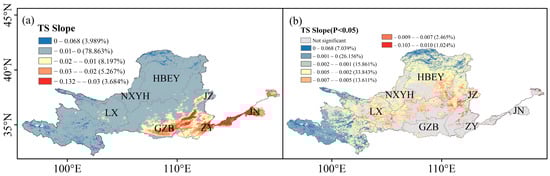
Figure 3.
(a) Rate of change in annual AOD, and (b) rate of change in AOD for an MK significance greater than 95% from 2011 to 2020 in the YRB.
3.2. Quarterly Comparison of AOD Among the YRB Urban Agglomerations
The AOD within the YRB showed relatively similar characteristics in different seasons in that the south and east were higher than the north and west (Figure 4). This was basically similar to the ten-year average distribution of AOD. As a whole, AOD values were significantly higher in spring and summer than in autumn and winter. Among them, high and higher AOD values (AOD > 0.3) were clearly most widely distributed in spring, covering almost all areas east of 102°E and south of 38° N. The areas with low AOD values (AOD < 0.1) were almost identical in all seasons. There were comparative fluctuations in AOD values in all regions between seasons. For example, AOD values in NXYH and HBEY fluctuated mainly between 0.1 and 0.4, LX fluctuated mainly between 0.1 and 0.5, GZB and JZ fluctuated mainly between 0.2 and 2, and ZY and JN stayed in the range of 0.4–2.
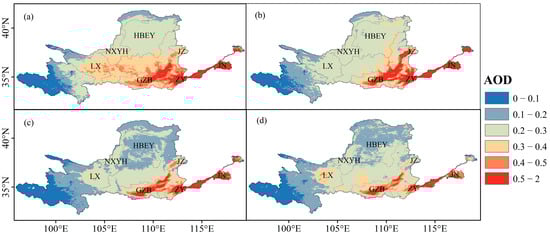
Figure 4.
Comparison of AOD distribution in the YRB in (a) spring, (b) summer, (c) autumn, and (d) winter.
Through Figure 5, it was found that the YRB quarterly AOD values showed the following pattern: summer > spring > autumn > winter. Among them, the AOD value of the YRB in summer was greater than 0.4, and the other seasons were between 0.3 and 0.4. This was due to the fact that it became evident that the AOD values of JN and ZY were markedly higher than those of the other seasons, thereby making considerable contributions to the summer AOD of the YRB. Overall, observation of the distribution of AOD in urban agglomerations revealed that GZB, JN, and ZY were basically always higher than the quarterly average of the YRB in all seasons. The exception was that the mean AOD of GZB was slightly lower than the YRB in the summer. Nevertheless, its maximum and minimum values were similar to the other quarters, and even the maximum value was the highest of the four quarters. The combination of its value and normal distribution also showed that more values were concentrated at the lower end of the scale, resulting in a lower AOD value for GZB than the YRB during the summer. The different seasonal AOD for individual city agglomerations revealed that spring and summer AOD values were greater than autumn and winter for each city agglomerations, except for LX. The LX quarterly AOD values showed that spring and winter were greater than summer and autumn, and summer and autumn AOD values were more similar and clustered.
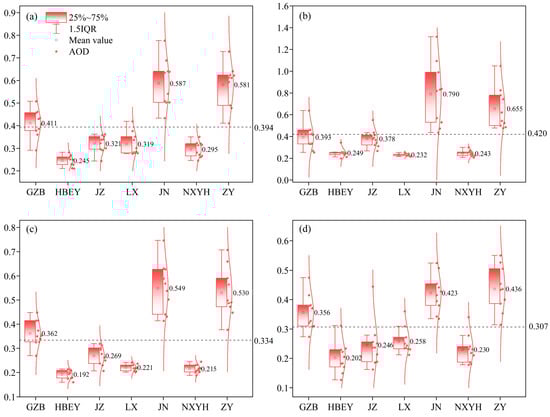
Figure 5.
Differences in quarterly AOD among urban agglomerations in the YRB in (a) spring, (b) summer, (c) autumn, and (d) winter.
3.3. AOD Offset Trajectory of the YRB Urban Agglomerations
The distribution of the SDE and mean center of annual AOD in the YRB from 2011 to 2020 were calculated (Figure 6 and Table 2). Overall, the 10 SDEs and mean center were in the southeast. The length of the long axis of the SDE was about three times that of the short axis, indicating a more obvious directional feature. θ fluctuated from 90.727° N to 91.128° N, indicating that the variation in θ was relatively small. At the same time, θ varied within a small range from year to year (usually within 0.1°). This suggests that the direction of the SDE was relatively stable and did not rotate drastically. The mean center of the annual AOD was geographically dispersed in the Shanxi Province, at 36.208° N–36.330°N, 110.979° E–111.601° E. From Figure 6a,e, it can be seen that the mean center moves to the northwest. However, there were some twists and turns in the middle of the movement, rather than always going in one direction. We divided the trajectory of the mean center into three stages for this: northeast–southwest round-trip movement (2011–2014), one-way movement to the northwest (2014–2018), and southeast–northwest round-trip movement (2018–2020).
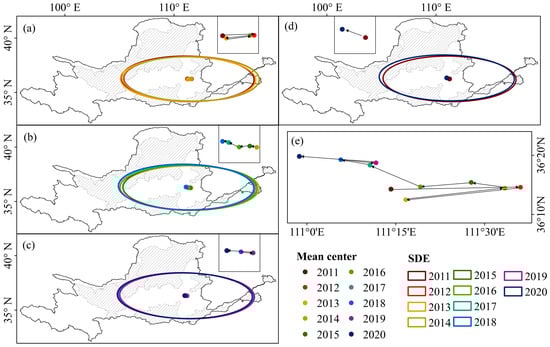
Figure 6.
Changes in the SDE and mean center of AOD in the YRB urban agglomeration from 2011 to 2020 ((a) from 2011 to 2014; (b) from 2014 to 2018; (c) from 2018 to 2020; (d) from 2011 to 2020; and (e) from 2011 to 2020).
Table 2.
SDE parameters of AOD in the YRB urban agglomeration from 2011 to 2020.
4. Discussion
Through Figure 2, it was found that the AOD values in the YRB indicated a declining trend from 2011 to 2020. This displays that the aerosol level in the YRB decreased during the period, and the atmospheric environment was significantly improved. During this period, the aerosol level fluctuated due to the effect of various factors such as anthropogenic activities, extreme climate, natural disasters, and so on [36,37,38]. However, with national policies and human endeavors, the magnitude of change in declining years was much greater than in rising years [39]. The AOD in recent years was stable at about 0.232, which was 0.068 lower than that in 2011, with a decrease of 22.7%. This demonstrates the tremendous progress that has been made in air quality management at the YRB. Especially in 2012, the AOD decreased significantly. This is unanimous with the consequences found by Zhao et al. [40]. This may be related to the implementation and full compliance with the 2012 emission standard in China. This standard directly decreased the emission of particulate matter and precursors such as SO2 and NOx [41]. The AOD in the YRB showed a distribution model of high in the west and low in the east, and a pattern of low in the north and high in the south within the middle region. This distribution pattern was the opposite of the DEM demonstrated in Figure 1 [42]. Anthropogenic habitation and activities also tend to be accompanied by flatter terrain and nearby water sources, which influence aerosols. The distribution of AOD in the lower YR region is a good illustration because of its proximity to water sources, flat terrain, large population, and dense distribution of urban agglomerations, making it one of the most polluted and aerosol-rich zones in China [43,44].
The spatial trend of AOD in the YRB basically showed a decline. Figure 3a was basically opposite to Figure 2b in the spatial distribution pattern, and the original high and low AOD values affected the subsequent development trend of AOD to a certain extent. For example, due to its favorable geographical environment, people in the southeast region invested in a lot of agricultural and industrial activities in the early period [45,46], with a lot of aerosols and precursor emissions [37], and the level of AOD was high. Our country has taken strong and effective measures for the areas with high AOD values, which have led to a decrease. Therefore, the spatial pattern of the trend of AOD showed a fast rate of decline in the southeast and a slow rate in the northwest.
The spatial feature of AOD in each season revealed that the AOD in the YRB showed the following characteristics: the south and east were higher than the north and west (Figure 4). Influenced by anthropogenic activities, its seasonal distribution was consistent with the ten-year average distribution of AOD [47]. However, there were still some differences between seasons. Spring and summer were influenced by the natural environment, with increased temperatures and precipitation. Aerosols increased in content due to their hygroscopic nature. Li et al. [48] showed that North China belongs to one of the regions where aerosol hygroscopic growth has the greatest impact on AOD in East Asia. The washing effect of rainwater and the wind cleaned the aerosols to some extent, resulting in a slightly lower AOD in parts of the summer than in the spring [49]. By autumn and winter, there was a significant and substantial decrease in AOD. However, the east-central part of GZB, ZY, JN, and the intermediate regions of GZB, ZY, and JZ consistently maintained high AOD values. The reason for this was that these regions were anthropogenically intensive and frequently active in the whole China region [47]. Combined with their coastal location, JN’s AOD values were also highly influenced by marine aerosols. Among them, the AOD values in the JN and ZY are relatively high, ranging from 0.4 to 2. This may be due to the large urban populations, relatively developed economies, and high aerosol emissions, as most areas of ZY and all of JN are located in the North China Plain [50]. It is close to the Beijing–Tianjin–Hebei city cluster. The Beijing–Tianjin–Hebei city cluster is one of the regions in China with the most severe pollution and highest aerosol content [51]. In addition, the topography significantly affects the distribution characteristics of AOD in the JN. The JN region features a typical basin topography, surrounded by mountains on three sides, which impedes the diffusion of pollutants and results in the accumulation of particulate matter [52]. Therefore, consistently high AOD values were maintained. Comparatively speaking, the region to the northwest was less populated, with fewer natural and anthropogenic activities and relatively less aerosol content. Especially in the westernmost part of the basin, the region was located in the eastern part of the Tibetan Plateau. The site had cold mountains and a clean atmosphere, accompanied by low aerosol levels [53].
YRB seasonal AOD values showed the characteristics of summer > spring > autumn > winter (Figure 5). The main contributing urban agglomerations were JN and ZY. The JZ was in the west of Shandong Province and near the Bohai Sea. The study by Xue et al. [5] showed that the quarterly AOD in most prefecture-level cities in Shandong Province was characterized by summer > spring > autumn > winter due to climate and anthropogenic activities. ZY was primarily situated in the north of Henan Province. The hot and humid climatic conditions result in enhanced convection, which promotes the accumulation of pollution in areas with a low topography [54]. As a major agricultural province, agricultural activities in summer released dust and smoke, which increased aerosol [55]. This caused higher AOD values at the YRB in the summer. The multi-quarter AOD values for urban agglomerations revealed similarities between quarters. Over the four quarters, three major urban agglomerations (GZB, JN, and ZY) had higher quarterly AOD averages than the YRB. Among them, the average AOD of GZB was slightly lower than that of the YRB in summer. Since precipitation was generally higher in summer than in spring, precipitation can effectively remove aerosol particles from the atmosphere and reduce the AOD value [56]. A comparison of the different seasonal AOD values for individual city agglomerations revealed that due to the characteristics of the YRB, the spring and summer AOD values were greater than those in autumn and winter for each city agglomeration. However, the LX quarterly AOD values showed greater values in the spring and winter than in the summer and autumn. LX’s topography made it susceptible to dusty weather, and it lacked effective precipitation flushing action due to less rain and snow in winter. AOD levels were raised over the winter, as a result of increasing pollutant emissions by coal fired during the heating season [57].
The distribution of the SDE and the mean center were both found to be concentrated in the southeastern location of the YRB (Figure 6). This was closely related to the high aerosol status of the southeastern urban agglomeration reflected in Figure 5. Meanwhile, the ellipse showed an almost complete east–west direction and a flat and long shape, both of which were related to the narrow and long shape of the YRB itself. Meanwhile, due to the shape of the YRB and the distribution of the AOD, θ was maintained at about 90° (close to due east). The movement of the mean center revealed that the fluctuation was only within Shanxi Province, but eventually moved to the northwest. The seemingly haphazard movement of the SDE and the mean center exhibited a very considerable regularity, by which we divided it into three stages.
In the first stage (Figure 6a), Shanxi Province and Shaanxi Province were the provinces where important resource-based cities were clustered in China due to their unique geographical locations and industrial and agricultural environments [58,59]. Before 2014, China was undergoing an accelerated phase of industrialization, with fossil fuel combustion and construction dust from the secondary sector contributing to elevated AOD values [59,60,61]. As a result, this stage was repeatedly pulled between the two main provinces, presenting a northeast–southwest round-trip movement. In the second stage (Figure 6b), China emphasized industrial transformation and restructuring. The implementation of a series of policies led to significant improvements in the atmospheric environment in industrial cities [62]. Since then, the AOD has moved towards the geometric center of the seven city agglomerations. During this period, China had pursued a strong local policy to promote the northwest. For example, the study by Wang et al. [63] also showed a gradual movement of pollution in the central part of the Inner Mongolia Autonomous Region towards the northwest. Thus, this stage presented a one-way movement to the northwest. During the third stage (Figure 6c), its overall direction of movement remained unchanged to the northwest. The quantity of clean days decreased and the quantity of moderately polluted days increased in Shandong Province in 2019 [64], leading to a shift of the AOD center to the southeast in that year. Subsequently, Shandong Province has taken measures to address pollution from heavy industry, which has led to some reduction in pollution [65,66]. As a result, the final stage showed a southeast–northwest round-trip movement.
5. Conclusions
In this study, the AOD values in the YRB decreased between 2011 and 2020, with a marked improvement in the atmospheric conditions. The AOD in the YRB showed a spatial distribution pattern in the south and east that was higher than in the north and west, which was negatively correlated with the DEM distribution. The speed of AOD decline in the YRB was opposite to the spatial distribution, as a result of the influence of the original AOD values and national policies. Therefore, the spatial pattern of the AOD trend showed a fast decline in the southeast and a slow decline in the northwest.
The seasonal AOD distribution showed the characteristics, which was basically consistent with the average distribution. The calculation found that the seasonal AOD values of the YRB were summer > spring > autumn > winter. The average quarterly AOD values of the three major city agglomerations (GZB, JN, and ZY) were higher than that of the YRB in all seasons. In addition, the different seasonal AOD of individual agglomerations indicated that the quarterly AOD of each city agglomeration was greater in spring and summer.
The SDE and mean center of the annual AOD of the urban agglomerations in the YRB were distributed in the southeast, with the mean center concentrated in Shanxi Province. The movement through the SDE and mean center indicated that the annual AOD eventually moved to the northwest. According to its regularity, we divided it into three stages: northeast–southwest round-trip movement (2011–2014), one-way movement to the northwest (2014–2018), and southeast–northwest round-trip movement (2018–2020).
Author Contributions
Conceptualization, Y.Z. and Q.T.; methodology, Y.Z. and Q.T.; software, Q.T. and Y.Z.; validation, Y.Z.; formal analysis, Q.T.; investigation, Q.T.; resources, Q.T.; data curation, Q.T.; writing—original draft preparation, Y.Z. and Q.T; writing—review and editing, Q.T., Q.Y. and T.L.; visualization, Z.H. and Y.Z. Supervision, Q.T.; project administration, Q.T.; funding acquisition, Q.T., Q.Y. and T.L. All authors have read and agreed to the published version of the manuscript.
Funding
This research was funded by the National Natural Science Foundation of China (31800367) and the Natural Foundation of Shandong Province of China (ZR2021MD090 and ZR2017MD017).
Institutional Review Board Statement
Not applicable.
Informed Consent Statement
Not applicable.
Data Availability Statement
Datasets analyzed during the current study mainly include MCD19A2 and GMTED. The MCD19A2 dataset is available at the National Aeronautics and Space Administration (NASA) Goddard Space Flight Center (https://earthdata.nasa.gov/, accessed on 7 June 2022). GMTED in 2010 is available in the USGS and the NGA of the United States National Geological and Geographic Information Service (https://topotools.cr.usgs.gov/gmted_viewer/viewer.htm, accessed on 15 October 2023).
Acknowledgments
We would like to thank the NASA Earth data website (https://search.earthdata.nasa.gov/search, accessed on 7 June 2022) for providing MODIS aerosol products.
Conflicts of Interest
The authors declare no conflicts of interest.
References
- Baltensperger, U.; Prévôt, A.S.H. Chemical analysis of atmospheric aerosols. Anal. Bioanal. Chem. 2008, 390, 277–280. [Google Scholar] [CrossRef] [PubMed][Green Version]
- Nizar, S.; Dodamani, B.M. Spatiotemporal distribution of aerosols over the Indian subcontinent and its dependence on prevailing meteorological conditions. Air Qual. Atmos. Health 2019, 12, 503–517. [Google Scholar] [CrossRef]
- Lushnikov, A.A.; Zagaynov, V.A.; Lyubovtseva, Y.S. Formation of Aerosols in the Atmosphere. In The Atmosphere and Ionosphere: Dynamics, Processes and Monitoring; Bychkov, V., Golubkov, G., Nikitin, A., Eds.; Springer: Dordrecht, The Netherlands, 2010; pp. 69–95. [Google Scholar] [CrossRef]
- Luo, Y.; Zheng, X.; Zhao, T.; Chen, J. A climatology of aerosol optical depth over China from recent 10 years of MODIS remote sensing data. Int. J. Climatol. 2014, 34, 863–870. [Google Scholar] [CrossRef]
- Xue, R.; Ai, B.; Lin, Y.; Pang, B.; Shang, H. Spatial and Temporal Distribution of Aerosol Optical Depth and Its Relationship with Urbanization in Shandong Province. Atmosphere 2019, 10, 110. [Google Scholar] [CrossRef]
- Li, J.; He, Q.; Ge, X.; abbas, A. Spatiotemporal distribution of aerosols over the Tibet Plateau and Tarim Basin (1980–2020). J. Clean. Prod. 2022, 374, 133958. [Google Scholar] [CrossRef]
- Holben, B.N.; Eck, T.F.; Slutsker, I.; Tanré, D.; Buis, J.P.; Setzer, A.; Vermote, E.; Reagan, J.A.; Kaufman, Y.J.; Nakajima, T.; et al. AERONET—A Federated Instrument Network and Data Archive for Aerosol Characterization. Remote Sens. Environ. 1998, 66, 1–16. [Google Scholar] [CrossRef]
- Okpalaonwuka, C.; Olusegun, C.F.; Olusola, A.; Ogunjo, S. Validation of MODIS AOD retrievals in West Africa: A comparison with AERONET observations. Air Qual. Atmos. Health 2023, 16, 2085–2094. [Google Scholar] [CrossRef]
- Yuan, X.; Xia, Y.; He, J.; Cheng, M.; Qi, B.; Yu, Z.; Wang, B. Study on Accuracy Evaluation of MODIS AOD Products and Spatio-Temporal Distribution Characteristics of AOD in Hangzhou. Sustainability 2023, 15, 10171. [Google Scholar] [CrossRef]
- Wang, D.; Zhang, F.; Yang, S.; Xia, N.; Ariken, M. Exploring the spatial-temporal characteristics of the aerosol optical depth (AOD) in Central Asia based on the moderate resolution imaging spectroradiometer (MODIS). Environ. Monit. Assess. 2020, 192, 383. [Google Scholar] [CrossRef]
- Yousefi, R.; Wang, F.; Ge, Q.; Shaheen, A. Long-term aerosol optical depth trend over Iran and identification of dominant aerosol types. Sci. Total Environ. 2020, 722, 137906. [Google Scholar] [CrossRef]
- Lyapustin, A.; Wang, Y.; Korkin, S.; Huang, D. MODIS Collection 6 MAIAC algorithm. Atmos. Meas. Tech. 2018, 11, 5741–5765. [Google Scholar] [CrossRef]
- Martins, V.S.; Lyapustin, A.; de Carvalho, L.A.S.; Barbosa, C.C.F.; Novo, E.M.L.M. Validation of high-resolution MAIAC aerosol product over South America. J. Geophys. Res. Atmos. 2017, 122, 7537–7559. [Google Scholar] [CrossRef]
- Mhawish, A.; Banerjee, T.; Sorek-Hamer, M.; Lyapustin, A.; Broday, D.M.; Chatfield, R. Comparison and evaluation of MODIS Multi-angle Implementation of Atmospheric Correction (MAIAC) aerosol product over South Asia. Remote Sens. Environ. 2019, 224, 12–28. [Google Scholar] [CrossRef]
- Stafoggia, M.; Schwartz, J.; Badaloni, C.; Bellander, T.; Alessandrini, E.; Cattani, G.; de’ Donato, F.; Gaeta, A.; Leone, G.; Lyapustin, A.; et al. Estimation of daily PM10 concentrations in Italy (2006–2012) using finely resolved satellite data, land use variables and meteorology. Environ. Int. 2017, 99, 234–244. [Google Scholar] [CrossRef]
- Zhdanova, E.Y.; Chubarova, N.Y.; Lyapustin, A.I. Assessment of urban aerosol pollution over the Moscow megacity by the MAIAC aerosol product. Atmos. Meas. Tech. 2020, 13, 877–891. [Google Scholar] [CrossRef]
- Liu, Y.; Zhang, S.; Fan, Q.; Wu, D.; Chan, P.; Wang, X.; Fan, S.; Feng, Y.; Hong, Y. Accessing the Impact of Sea-Salt Emissions on Aerosol Chemical Formation and Deposition over Pearl River Delta, China. Aerosol Air Qual. Res. 2015, 15, 2232–2245. [Google Scholar] [CrossRef]
- Shen, X.J.; Sun, J.Y.; Zhang, X.Y.; Zhang, Y.M.; Zhang, L.; Che, H.C.; Ma, Q.L.; Yu, X.M.; Yue, Y.; Zhang, Y.W. Characterization of submicron aerosols and effect on visibility during a severe haze-fog episode in Yangtze River Delta, China. Atmos. Environ. 2015, 120, 307–316. [Google Scholar] [CrossRef]
- Shen, X.L.; Dang, T.G.; Liu, J. Summary of Beijing-Tianjin-Hebei Haze Causes and Solutions Research. Adv. Mater. Res. 2014, 1010–1012, 639–644. [Google Scholar] [CrossRef]
- Gao, Y.; Zhang, M.; Liu, Z.; Wang, L.; Wang, P.; Xia, X.; Tao, M.; Zhu, L. Modeling the feedback between aerosol and meteorological variables in the atmospheric boundary layer during a severe fog–haze event over the North China Plain. Atmos. Chem. Phys. 2015, 15, 4279–4295. [Google Scholar] [CrossRef]
- Gu, T.; Guan, X.; Huang, J.; Shen, X.; Huang, X.; Zhang, G.; Han, D.; Fu, L.; Nie, J. The turning of ecological change in the Yellow River Basin. Hydrol. Process. 2023, 37, e15055. [Google Scholar] [CrossRef]
- Hu, Z.-Y.; Wu, Y.-H.; Wu, F.-C.; Ma, S.-D. The Number of Independent Kruppa Constraints from N Images. J. Comput. Sci. Technol. 2006, 21, 209–217. [Google Scholar] [CrossRef]
- Sun, Z.-L.; Sun, L.-Q.; Wang, B. Microplastic Pollution in the Yellow River Basin: Current Status and Control Strategy. Water Air Soil Pollut. 2023, 234, 30. [Google Scholar] [CrossRef]
- Lu, D.; Sun, D. Development and management tasks of the Yellow River Basin:A preliminary understanding and suggestion. Acta Geogr. Sin. 2019, 74, 2431–2436. [Google Scholar] [CrossRef]
- Zhang, S.; Zhang, G.; Ju, H. The spatial pattern and influencing factors of tourism development in the Yellow River Basin of China. PLoS ONE 2020, 15, e0242029. [Google Scholar] [CrossRef]
- Dai, Q.; Cui, C.-F.; Wang, S. Spatiotemporal variation and sustainability of NDVI in the Yellow River basin. Irrig. Drain. 2022, 71, 1304–1318. [Google Scholar] [CrossRef]
- Li, J.; Sun, W.; Li, M.; Linlin, M. Coupling coordination degree of production, living and ecological spaces and its influencing factors in the Yellow River Basin. J. Clean. Prod. 2021, 298, 126803. [Google Scholar] [CrossRef]
- Meng, H.; Bai, G.; Wang, L. Analysis of the spatial and temporal distribution characteristics of AOD in typical industrial cities in northwest China and the influence of meteorological factors. Atmos. Pollut. Res. 2024, 15, 101957. [Google Scholar] [CrossRef]
- Lu, Z.; Chen, Y.; Zhao, C. Motion Segmentation Based on Pixel Distribution Learning on Unseen Videos. Smart Multimed. 2022, 13497, 309–321. [Google Scholar] [CrossRef]
- Jia, C.; Sun, L.; Zhang, X.; Wang, Y. Verification of Mcd19a2 Data and Study of Aerosol Characteristics in Beijing-Tianjin-Hebei Region. ISPRS Ann. Photogramm. Remote Sens. Spatial Inf. Sci. 2020, V-3-2020, 675–679. [Google Scholar] [CrossRef]
- Theil, H. A rank-invariant method of linear and polynomial regression analysis. Indag. Math. 1950, 12, 173. [Google Scholar]
- Sen, P.K. Estimates of the Regression Coefficient Based on Kendall’s Tau. J. Am. Stat. Assoc. 1968, 63, 1379–1389. [Google Scholar] [CrossRef]
- Mann, H.B. Nonparametric tests against trend. Econom. J. Econom. Soc. 1945, 13, 245–259. [Google Scholar] [CrossRef]
- Kendall, M.G. Rank Correlation Methods; Charles Griffin & Co., Ltd.: London, UK, 1948. [Google Scholar]
- Lefever, D.W. Measuring geographic concentration by means of the standard deviational ellipse. Am. J. Sociol. 1926, 32, 88–94. [Google Scholar] [CrossRef]
- Bai, B.; Zhang, Q.; Tan, D.; Huang, P.; Yin, F. Responses of the Optical Properties and Distribution of Aerosols to the Summer Monsoon in the Main Climate Zones of China. Atmosphere 2021, 12, 482. [Google Scholar] [CrossRef]
- Yong, J.; Xie, Y.; Guo, H.; Li, Y.; Sun, S. Unraveling the influence of biogenic volatile organic compounds and their constituents on ozone and SOA formation within the Yellow River Basin, China. Chemosphere 2024, 353, 141549. [Google Scholar] [CrossRef]
- Wang, Z.; Xue, L.; Liu, J.; Ding, K.; Lou, S.; Ding, A.; Wang, J.; Huang, X. Roles of Atmospheric Aerosols in Extreme Meteorological Events: A Systematic Review. Curr. Pollut. Rep. 2022, 8, 177–188. [Google Scholar] [CrossRef]
- Han, L.; Han, M.; Wang, Y.; Wang, H.; Niu, J. Spatial and temporal characteristic of PM2.5 and influence factors in the Yellow River Basin. Front. Public Health 2024, 12, 1403414. [Google Scholar] [CrossRef]
- Zhao, H.; Liu, Y.; Gu, T.; Zheng, H.; Wang, Z.; Yang, D. Identifying Spatiotemporal Heterogeneity of PM2.5 Concentrations and the Key Influencing Factors in the Middle and Lower Reaches of the Yellow River. Remote Sens. 2022, 14, 2643. [Google Scholar] [CrossRef]
- Che, H.; Gui, K.; Xia, X.; Wang, Y.; Holben, B.N.; Goloub, P.; Cuevas-Agulló, E.; Wang, H.; Zheng, Y.; Zhao, H.; et al. Large contribution of meteorological factors to inter-decadal changes in regional aerosol optical depth. Atmos. Chem. Phys. 2019, 19, 10497–10523. [Google Scholar] [CrossRef]
- Collaud Coen, M.; Andrews, E.; Aliaga, D.; Andrade, M.; Angelov, H.; Bukowiecki, N.; Ealo, M.; Fialho, P.; Flentje, H.; Hallar, A.G.; et al. Identification of topographic features influencing aerosol observations at high altitude stations. Atmos. Chem. Phys. 2018, 18, 12289–12313. [Google Scholar] [CrossRef]
- Tang, G.; Zhu, X.; Hu, B.; Xin, J.; Wang, L.; Münkel, C.; Mao, G.; Wang, Y. Impact of emission controls on air quality in Beijing during APEC 2014: Lidar ceilometer observations. Atmos. Chem. Phys. 2015, 15, 12667–12680. [Google Scholar] [CrossRef]
- Wang, Y.; Chen, L.; Li, S.; Wang, X.; Yu, C.; Si, Y.; Zhang, Z. Interference of Heavy Aerosol Loading on the VIIRS Aerosol Optical Depth (AOD) Retrieval Algorithm. Remote Sens. 2017, 9, 397. [Google Scholar] [CrossRef]
- Zeduo, Z.; Wei, Z.; Mou, Y.; Zhiqiang, L.; Daxiang, G.; Kadun, T. Evolutionary relationship between the PM2.5 concentration and urbanization in the Yellow River Ecological and Economic Zone. Environ. Sustain. Indic. 2022, 16, 100198. [Google Scholar] [CrossRef]
- Liu, J.; Shi, T.; Huang, L. A Study on the Impact of Industrial Restructuring on Carbon Dioxide Emissions and Scenario Simulation in the Yellow River Basin. Water 2022, 14, 3833. [Google Scholar] [CrossRef]
- Sogacheva, L.; Rodriguez, E.; Kolmonen, P.; Virtanen, T.H.; Saponaro, G.; de Leeuw, G.; Georgoulias, A.K.; Alexandri, G.; Kourtidis, K.; van der A, R.J. Spatial and seasonal variations of aerosols over China from two decades of multi-satellite observations—Part 2: AOD time series for 1995–2017 combined from ATSR ADV and MODIS C6.1 and AOD tendency estimations. Atmos. Chem. Phys. 2018, 18, 16631–16652. [Google Scholar] [CrossRef]
- Li, J.; Han, Z.; Zhang, R. Influence of aerosol hygroscopic growth parameterization on aerosol optical depth and direct radiative forcing over East Asia. Atmos. Res. 2014, 140–141, 14–27. [Google Scholar] [CrossRef]
- de Leeuw, G.; Kang, H.; Fan, C.; Li, Z.; Fang, C.; Zhang, Y. Meteorological and anthropogenic contributions to changes in the Aerosol Optical Depth (AOD) over China during the last decade. Atmos. Environ. 2023, 301, 119676. [Google Scholar] [CrossRef]
- Che, H.; Xia, X.; Zhu, J.; Li, Z.; Dubovik, O.; Holben, B.; Goloub, P.; Chen, H.; Estelles, V.; Cuevas-Agulló, E.; et al. Column aerosol optical properties and aerosol radiative forcing during a serious haze-fog month over North China Plain in 2013 based on ground-based sunphotometer measurements. Atmos. Chem. Phys. 2014, 14, 2125–2138. [Google Scholar] [CrossRef]
- Zhang, M.; Liu, J.; Bilal, M.; Zhang, C.; Zhao, F.; Xie, X.; Khedher, K.M. Optical and Physical Characteristics of the Lowest Aerosol Layers over the Yellow River Basin. Atmosphere 2019, 10, 638. [Google Scholar] [CrossRef]
- Zheng, Y.; Wang, X.; Zhang, X.; Hu, G. Multi-spatiotemporal patterns of aerosol optical depth and influencing factors during 2000–2020 from two spatial perspectives: The entire Yellow River Basin region and its urban agglomerations. Int. J. Appl. Earth Obs. Geoinf. 2022, 106, 102643. [Google Scholar] [CrossRef]
- Zhang, Z.; Zhang, M.; Bilal, M.; Su, B.; Zhang, C.; Guo, L. Comparison of MODIS- and CALIPSO-Derived Temporal Aerosol Optical Depth over Yellow River Basin (China) from 2007 to 2015. Earth Syst. Environ. 2020, 4, 535–550. [Google Scholar] [CrossRef]
- de Leeuw, G.; Fan, C.; Li, Z.; Dong, J.; Li, Y.; Ou, Y.; Zhu, S. Spatiotemporal variation and provincial scale differences of the AOD across China during 2000–2021. Atmos. Pollut. Res. 2022, 13, 101359. [Google Scholar] [CrossRef]
- Li, H.; Han, Z.; Cheng, T.; Du, H.; Kong, L.; Chen, J.; Zhang, R.; Wang, W. Agricultural fire impacts on the air quality of Shanghai during summer harvesttime. Aerosol Air Qual. Res. 2010, 10, 95–101. [Google Scholar] [CrossRef]
- Xu, Y.; Ying, Q.; Hu, J.; Gao, Y.; Yang, Y.; Wang, D.; Zhang, H. Spatial and temporal variations in criteria air pollutants in three typical terrain regions in Shaanxi, China, during 2015. Air Qual. Atmos. Health 2018, 11, 95–109. [Google Scholar] [CrossRef]
- Xu, Y.; Hu, J.; Ying, Q.; Hao, H.; Wang, D.; Zhang, H. Current and future emissions of primary pollutants from coal-fired power plants in Shaanxi, China. Sci. Total Environ. 2017, 595, 505–514. [Google Scholar] [CrossRef]
- Du, W.; Chen, Y.; Shen, G.; Wang, W.; Zhuo, S.; Huang, Y.; Pan, X.; Tao, S. Winter air pollution by and inhalation exposure to nitrated and oxygenated PAHs in rural Shanxi, north China. Atmos. Environ. 2018, 187, 210–217. [Google Scholar] [CrossRef]
- Wang, J.; Li, X. Influence of industrial sustainability transition on air quality in a typical resource-exhausted city. Heliyon 2024, 10, e25138. [Google Scholar] [CrossRef]
- Dong, Z.; Yu, X.; Li, X.; Dai, J. Analysis of variation trends and causes of aerosol optical depth in Shaanxi Province using MODIS data. Chin. Sci. Bull. 2013, 58, 4486–4496. [Google Scholar] [CrossRef]
- Chen, S.; Zhang, Y.; Zhang, Y.; Liu, Z. The relationship between industrial restructuring and China’s regional haze pollution: A spatial spillover perspective. J. Clean. Prod. 2019, 239, 115808. [Google Scholar] [CrossRef]
- Bai, X.; Tian, H.; Liu, X.; Wu, B.; Liu, S.; Hao, Y.; Luo, L.; Liu, W.; Zhao, S.; Lin, S.; et al. Spatial-temporal variation characteristics of air pollution and apportionment of contributions by different sources in Shanxi province of China. Atmos. Environ. 2021, 244, 117926. [Google Scholar] [CrossRef]
- Wang, J.; Liu, D.; Xu, X.; Ma, J.; Han, L. Analysis of the temporal and spatial pattern of air pollution and the heterogeneity of its influencing factors in central Inner Mongolia from 2016 to 2018. Front. Environ. Sci. 2022, 10, 893437. [Google Scholar] [CrossRef]
- Zhao, N.; Wang, G.; Li, G.; Lang, J. Trends in air pollutant concentrations and the impact of meteorology in Shandong Province, coastal China, during 2013–2019. Aerosol Air Qual. Res. 2021, 21, 200545. [Google Scholar] [CrossRef]
- Wang, X.; Zhao, W.; Zhang, T.; Qiu, Y.; Ma, P.; Li, L.; Wang, L.; Wang, M.; Zheng, D.; Zhao, W. Analysis of the Characteristics of Ozone Pollution in the North China Plain from 2016 to 2020. Atmosphere 2022, 13, 715. [Google Scholar] [CrossRef]
- Wang, D.; Li, X.; Duan, X.; Yang, H.; Zhang, B. Exploring the spatiotemporal patterns of county-scale PM2.5 drivers in Shandong Province from 2000 to 2020. PLoS ONE 2024, 19, e0310190. [Google Scholar] [CrossRef] [PubMed]
Disclaimer/Publisher’s Note: The statements, opinions and data contained in all publications are solely those of the individual author(s) and contributor(s) and not of MDPI and/or the editor(s). MDPI and/or the editor(s) disclaim responsibility for any injury to people or property resulting from any ideas, methods, instructions or products referred to in the content. |
© 2024 by the authors. Licensee MDPI, Basel, Switzerland. This article is an open access article distributed under the terms and conditions of the Creative Commons Attribution (CC BY) license (https://creativecommons.org/licenses/by/4.0/).