Abstract
Carbonyl compounds are important oxygenated volatile organic compounds (VOCs) that play significant roles in the formation of ozone (O3) and atmospheric chemistry. This study presents comprehensive field observations of carbonyl compounds during an unusual wintertime ozone pollution event at a suburban site in Guangzhou, South China, from 19 to 28 December 2020. The aim was to investigate the characteristics and sources of carbonyls, as well as their contributions to O3 formation. Formaldehyde, acetone, and acetaldehyde were the most abundant carbonyls detected, with average concentrations of 7.11 ± 1.80, 5.21 ± 1.13, and 3.00 ± 0.94 ppbv, respectively, on pollution days, significantly higher than those of 2.57 ± 1.12, 2.73 ± 0.88, and 1.10 ± 0.48 ppbv, respectively, on nonpollution days. The Frame for 0-D Atmospheric Modeling (F0AM) box model simulations revealed that local production accounted for 62–88% of observed O3 concentrations during the pollution days. The calculated ozone formation potentials (OFPs) for various precursors (carbonyls and VOCs) indicated that carbonyl compounds contributed 32.87% of the total OFPs on nonpollution days and 36.71% on pollution days, respectively. Formaldehyde, acetaldehyde, and methylglyoxal were identified as the most reactive carbonyls, and formaldehyde ranked top in OFPs, and it alone contributed 15.92% of total OFPs on nonpollution days and 18.10% of total OFPs on pollution days, respectively. The calculation of relative incremental reactivity (RIR) indicates that ozone sensitivity was a VOC-limited regime, and carbonyls showed greater RIRs than other groups of VOCs. The model simulation showed that secondary formation has a significant impact on formaldehyde production, which is primarily controlled by alkenes and biogenic VOCs. The characteristic ratios and backward trajectory analysis also indicated the indispensable impacts of local primary sources (like industrial emissions and vehicle emissions) and regional sources (like biomass burning) through transportation. This study highlights the important roles of carbonyls, particularly formaldehyde, in forming ozone pollution in megacities like the Pearl River Delta region.
1. Introduction
Carbonyl compounds are crucial subsets of atmospheric volatile organic compounds (VOCs) known for their high reactivities. Owing to their significant involvement in atmospheric photochemistry, carbonyl compounds are critical for understanding the formation of secondary pollutants such as ozone (O3) and the atmospheric oxidative capacity in the troposphere [1]. Moreover, elevated levels of carbonyl compounds pose substantial health risks. For example, formaldehyde (HCHO) and acetaldehyde (CH3CHO) are classified as toxic by the US Environmental Protection Agency (EPA) because of their respiratory irritant properties and potential carcinogenic and teratogenic effects [2,3]. Given their importance in atmospheric chemistry and public health, carbonyl compounds have long been a focal point in atmospheric research.
Extensive research has been conducted on atmospheric carbonyl compounds, with numerous studies reporting their concentration levels and compositions across various regions worldwide [4,5,6,7]. Many studies have focused on source apportionment in polluted areas. For example, Chai et al. [8] used a multiple linear regression to identify the sources of carbonyl compounds in Beijing’s ambient air and reported that secondary formation accounted for 41%, 25%, 36%, and 30% of formaldehyde, acetaldehyde, propionaldehyde, and acetone, respectively. Similarly, Huang et al. [9] employed a method considering photochemical aging for the source apportionment of carbonyl compounds in Beijing and Shenzhen during the summer, revealing that biogenic and secondary sources were major contributors to carbonyls, highlighting the importance of biogenic sources. However, most previous studies have concentrated on monocarbonyl compounds with low carbon numbers, whereas studies evaluating the concentrations, characteristics, and sources of highly reactive dicarbonyl compounds, such as glyoxal and methylglyoxal, are limited. To fully understand the causes of regional carbonyl pollution, further studies are needed to assess the source contributions of a broader range of carbonyl compounds.
In recent decades, severe O3 pollution events have become increasingly common in China due to rapid urbanization and economic development [10,11,12]. Numerous studies have explored the relationships between ozone precursors and ozone formation through observations and observation-based models (OBMs) [13,14,15]. However, these studies have focused predominantly on VOCs, with the specific contribution of carbonyl compounds to O3 formation receiving limited attention and insufficient observations. Nevertheless, previous research that combined observational data with simulations has preliminarily highlighted the critical role of carbonyl compounds in O3 formation [13,16]. Atmospheric carbonyl compounds originate from both primary emissions and secondary formation. Primary emissions are directly released into the atmosphere from human activities such as vehicular exhaust [17,18], industrial emissions [19,20], and cooking fumes [21], as well as from natural sources [22,23] and biomass burning [24,25]. Secondary formation involves the oxidation of VOCs in the atmosphere [13,15]. The interplay between these primary emissions and secondary processes leads to a complex mix of carbonyl compounds in the ambient atmosphere. Consequently, accurate source analysis of carbonyl compounds is essential for developing effective control strategies to mitigate photochemical pollution.
Guangzhou, with a population exceeding 10 million in South China, is one of the country’s largest industrial cities, and is experiencing rapid economic growth, leading to frequent O3 pollution events in recent years [26,27]. In response to an O3 pollution event at the end of 2020, this study investigated the concentrations and characteristics of carbonyl compounds at the Huadu site in suburban Guangzhou. This research specifically aims to differentiate the primary emissions and secondary formations of carbonyl compounds and assess their contributions to O3 production via the F0AM box model. This information will enhance the understanding of atmospheric carbonyl compounds and support the development of strategies to improve urban air quality.
2. Materials and Methods
2.1. Sampling Site
A sampling campaign was conducted from December 19 to 28, 2020, at a local governmental air quality monitoring station (23.39° N, 113.22° E) on the rooftop of a teaching building inside the campus of the Huadu Vocational and Technical School in the northern part of Guangzhou, the capital city of Guangdong Province (Figure 1). This suburban site is approximately 15 m above ground level in a residential/commercial area without large-scale industrial activities in the neighborhood [28].
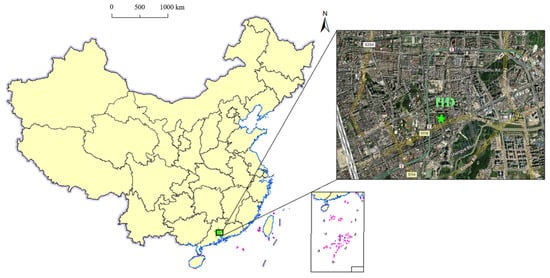
Figure 1.
Location of the observation site (green star).
2.2. Sample Collection and Analysis
2,4-Dinitrophenylhydrazine (DNPH) solid-phase extraction cartridges (Sep-Pak DNPH-Silica Cartridge, Waters, Milford, MA, USA) were used to collect carbonyl compounds in ambient air at 2 h intervals from 6:00 to 22:00 each day at a flow rate of 1.5 L min−1. During sampling, the air stream was passed through an O3 scrubber filled with potassium iodide (KI) to eliminate O3 before entering the DNPH cartridge. In total, 80 samples were collected during the campaign. After sampling, each DNPH cartridge was wrapped in aluminum foil, placed in Teflon bags, and stored in a refrigerator at 4 °C until analysis. The sample pretreatment and analysis procedures are described in detail in our previous studies [17,29,30]. In brief, the hydrazones formed by the derivatization of carbonyls were eluted with 2.0 mL of ACN (Merck kGaA, Darmstadt, Germany), and then the extracts were analyzed via an HPLC system (HP1200, Agilent Technologies, Santa Clara, CA, USA). A 10 μL aliquot was injected into the HPLC system with the following analysis conditions: an Agilent SB-C18 reversed-phase column (250 mm × 4.6 mm × 5 μm); a mobile phase of acetonitrile and water in a gradient sequence of 60% to 65% acetonitrile over 25 min, 65% to 100% acetonitrile over 3 min, 100% to 60% acetonitrile over 8 min, and 60% acetonitrile over 7 min; a flow rate of 0.8 mL/min; and a UV detector with detection at 360 nm for monocarbonyl compounds and 420 nm for dicarbonyl compounds.
To show a full picture of ozone formation, VOC samples were also collected via stainless steel canisters and used as data comparison to highlight the role of carbonyl compounds in ozone pollution. Air samples were drawn into pre-evacuated canisters through a flow controller (Part No. 39-RS-3, Entech Instruments Inc., Simi Valley, CA, USA). One-hour samples were collected at time intervals of 6:00–7:00, 8:00–9:00, 10:00–11:00, 12:00–13:00, 13:00–14:00, 14:00–15:00, 16:00–17:00, 18:00–19:00, and 19:00–20:00 each day. In total, 90 VOC samples were collected during the campaign. The canister samples were analyzed in the laboratory via a preconcentrator (Model 7100 preconcentrator; Entech Instruments Inc., CA, USA) coupled with a gas chromatography–mass selective detector/flame ionization detector/electron capture detector system (Agilent 5973N GC-MSD/FID/ECD, Agilent Technologies, Santa Clara, CA, USA) [31,32].
Real-time concentrations of air pollutants, including O3, NO-NO2-NOx, CO, SO2, PM2.5, and PM10, and meteorological parameters, including temperature, relative humidity, wind speed, and wind direction, were obtained from governmental air quality monitoring stations at the same site.
2.3. Quality Assurance and Quality Control
Before the sampling of carbonyls, the collection efficiency of DNPH cartridges was tested by passing standard gases of formaldehyde and acetaldehyde (both exceeding 50 μg m−3) through two DNPH cartridges connected in series at a rate of 2 L min−1 for 2 h. The concentrations of carbonyl compounds detected in the second-stage DNPH cartridge were not significantly different from those in the blank samples, indicating a collection efficiency of nearly 100% without any breakthrough. Prior to sampling, the sampling flow rate was calibrated via a soap film flowmeter (Gilian Gilibrator-2, Sensidyne, St. Petersburg, FL, USA). Two composite stock standard solutions and two single standard solutions were used to prepare the calibration standards for the monocarbonyls (as DNPH derivatives), including Mix 1 (100 μg mL−1 in ACN, ChemService, West Chester, PA, USA), Mix 2 (100 μg mL−1 in ACN, ChemService, USA), a 2-butanone-DNPH derivative (100 μg mL−1 in ACN, Sigma–Aldrich, St. Louis, MO, USA), and a methacrolein-DNPH derivative (100 μg mL−1 in ACN, Sigma–Aldrich, USA). The concentrations of monocarbonyl-DNPH derivatives in the standard solutions ranged from 0.05 μg mL−1 to 20.0 μg mL−1. For calibration standards of the dicarbonyls (DNPH derivative), glyoxal and methylglyoxal (Mix 3, 1000 μg mL−1 in ACN, AccuStandard, New Haven, CT, USA) were mixed with 200 μg mL−1 DNPH under weakly acid conditions. The mixed mixture was then left at room temperature for at least 6 h to ensure the complete derivatization of glyoxal and methylglyoxal by DNPH. After dilution, standard solutions with dicarbonyl concentrations ranging from 0.05 μg mL−1 to 4.0 μg mL−1 were obtained. Calibration curves were obtained by running the calibration standards with the HPLC system in the same way as the cartridge extracts and then linearly correlating the responses (peak areas) with the amounts of carbonyls (R2 > 0.995). The method detection limits (MDLs) were determined by repeatedly analyzing the lowest concentration standard samples seven times (the specific MDL values are shown in Table 1).

Table 1.
Average concentrations (in ppbv) and MDL (in pptv) of major carbonyls measured during the campaign.
For VOC samples, target compounds were quantified by an external calibration method. The calibration standards were prepared by dynamically diluting the Photochemical Assessment Monitoring Station (PAMS) standard mixture (57 NMHCs) (100 ppbv, Spectra Gases Inc., Branchburg, NJ, USA) and TO-14 standard mixture (39 compounds) (Spectra Gases Inc., Branchburg, NJ, USA) to 0.5, 1, 5, 15, and 30 ppbv. The calibration curves were obtained by running the five diluted standards plus humidified zero air the same way as the field samples. The linear correlation coefficients (r2) of standard curves were all greater than 0.99. The analytical system was challenged daily with a one-point (typically 1 ppbv) calibration before running air samples. If the response was beyond ±10% of the initial calibration curve, recalibration was performed. The method detection limits (MDLs) for the target VOC species ranged from 0.001 to 0.064 (ppbv) [31,32].
2.4. Backward Trajectory Analysis
The Hybrid Single Particle Lagrangian Integrated Trajectory (HYSPLIT) model (https://www.arl.noaa.gov/hysplit/; accessed on 8 July 2024), developed by the National Oceanic and Atmospheric Administration (NOAA) Air Resources Laboratory (ARL), was applied to track air mass transport history [33]. The 48 hr air mass backward trajectories arriving at 500 m above ground level were computed in 1 h intervals beginning at 0:00 local time during each sampling day. Meteorological data were sourced from the Global Data Assimilation System of the National Meteorological Center. Trajectory calculation, clustering, and statistical analysis were performed via the TrajStat plugin in MeteoInfoMap software (v3.6) [33].
2.5. Frame for 0-D Atmospheric Modeling (F0AM)
F0AM is a MATLAB-based platform designed for the simulation of atmospheric chemical systems. This platform integrates observational constraints and model settings, enabling simulations of photochemical reaction mechanisms, Lagrangian plume models, and solar activity cycles in both steady-state and time-dependent scenarios [34]. In this study, we employed the F0AM model to simulate O3 and formaldehyde formation during the observation period [35,36].
During the model simulation process, the input data include the concentrations (Conc, ppbv) of O3, SO2, CO, NO, NO2, CH4, NMHCs, and carbonyls, and meteorological data of boundary layer height (BLH, m), relative humidity (RH, %), temperature (T, K), and pressure (P, bar). For the offline observations of NMHCs and carbonyls, missing daytime values were interpolated linearly, while night-time values were uniformly assigned as the average of the daytime observations. The model’s start time was set to 00:00 local time, and the simulation ran for 3 days to ensure that unconstrained atmospheric components (e.g., OH, HO2, and RO2 radicals) reached steady-state concentrations. The results from the third day were used for further data analysis. The latest version of the Master Chemical Mechanism (MCM v3.3.1, https://mcm.york.ac.uk/MCM/atchemonline/intro; accessed on 5 June 2024) was selected as the core chemical module for the model.
2.6. Relative Incremental Reactivity (RIR)
The RIR values of O3 precursors, which are defined as the ratios of the decrease in the O3 production rate to the decrease in precursor concentrations, can be estimated via an observation-based model (OBM), like the F0AM model, without detailed knowledge of these emissions, to assess the sensitivity of O3 photochemical production in an area [37,38]. The RIR of O3 for species X, , can be calculated as follows:
where X represents the relevant precursor (i.e., carbonyls, NMHCs, or NOx); S(X) signifies the observed concentrations of species X; ΔS(X) is the change in the concentration of X caused by a hypothetical change in S(X) (here, we adopt 20% S(X) as ΔS(X)); and is defined as the O3 formation potential from 07:00 to 19:00, which is the net amount of O3 production and NO consumed during the evaluation period, and can be obtained from the output of the F0AM model [35].
The RIR approach has also been widely applied in previous studies to explore the important precursors of formaldehyde secondary formation [13,15]. Similarly, the RIR values of HCHO precursors () can be calculated as follows:
where X represents the relevant HCHO precursor (such as alkenes, aromatics); S(X) signifies the observed concentrations of species X; ΔS(X) is the change in the concentration of X caused by a hypothetical change in S(X) (here, we adopt 20% S(X) as ΔS(X)); and is defined as the HCHO formation potential from 07:00 to 19:00, since the secondary formation of formaldehyde is driven by the photochemical oxidation of precursors under sunlight in the daytime. In this study, is the net amount of HCHO produced and consumed during the evaluation period, and can be obtained from the output of the F0AM model.
2.7. Calculation of O3 Formation Potential (OFP)
The OFP of species i can be calculated as follows:
where is the concentration of species i in the air (ppbv), MWi is the molecular weight of species i (g/mol), is the molecular weight of O3 (48.00 g/mol), and is the maximum incremental reactivity of species i (g O3/g VOC), which can be obtained from Carter [39,40].
3. Results and Discussion
3.1. Overview
Figure 2 shows the time series of major pollutants and meteorological parameters during the campaign. An air pollution event occurred on December 27 and 28, during which 1 h O3 concentrations exceeded 160 μg m−3, and PM2.5 and PM10 concentrations surpassed 35 μg m−3 and 75 μg m−3, respectively. The levels of NO, NO2, and CO were also markedly greater during the pollution event than during the other sampling days. Consequently, this period is designated “pollution days”, whereas the period from December 19 to December 26 is referred to as the “nonpollution days”. On nonpollution days, the concentration levels of carbonyl compounds exhibited relatively stable diurnal variation, with lower overall concentrations. In contrast, on pollution days, the concentrations of carbonyls significantly increased, especially that of formaldehyde, acetaldehyde, and acetone. Similarly, VOCs, the other O3 precursors, also showed noticeable increases during pollution days, especially of alkanes and aromatics.
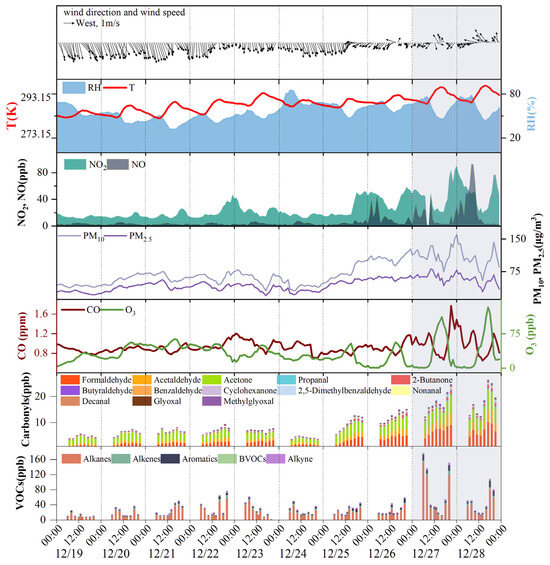
Figure 2.
Time series of meteorological parameters and major pollutants during the sampling period, with shaded areas indicating the pollution days.
Meteorological conditions could influence the pollutant concentrations observed at the receptor site [41,42,43]. On pollution days, the average values of wind speed, temperature, and relative humidity were 0.8 ± 0.3 m/s, 294.4 ± 3.1 K, and 61.5 ± 10.9%, respectively, whereas, on nonpollution days, these values were significantly different, at 1.2 ± 0.5 m/s, 288.5 ± 3.5 K, and 54.7 ± 11.0%, respectively. That is, the pollution days were characterized by significantly higher temperatures, higher relative humidity, lower wind speeds, and a shift in the wind direction from north/northwest to northeast/southeast, all of which facilitated pollutant accumulation [41,42,43]. The poor atmospheric dispersion conditions could induce higher concentrations of carbonyls and other pollutants during pollution days.
3.2. Temporal Variations of Carbonyl Compounds
Table 1 lists the concentrations of major carbonyls measured during the campaign. The average concentration of carbonyls measured throughout the sampling period was 9.58 ± 5.43 ppbv, and formaldehyde, acetone, and acetaldehyde were the most abundant compounds with average concentrations of 3.48 ± 2.23, 3.23 ± 1.36, and 1.48 ± 0.97 ppbv, respectively. These levels are comparable to previous measurements in other cities in China and around the world (Table 2). It was obvious that all the carbonyl compounds (except 2,5-dimethylbenzaldehyde and decanal) showed higher concentrations on pollution days than those on nonpollution days (Table 1). As a result, the total concentration of carbonyls on pollution days was 2.46 times that on nonpollution days. In particular, the concentrations of formaldehyde, acetone, and acetaldehyde rose significantly from 2.57 ± 1.12, 2.73 ± 0.88 and 1.10 ± 0.48 ppbv on nonpollution days, respectively, to 7.11 ± 1.80, 5.21 ± 1.13, and 3.00 ± 0.94 ppbv on pollution days, respectively.

Table 2.
Concentrations (in ppbv) of formaldehyde, acetaldehyde, and acetone from this study in comparison with those previously reported.
Figure 3 compares the diurnal variations in the concentrations of major carbonyl compounds during nonpollution and pollution days. During nonpollution days, the concentration of formaldehyde increased steadily from 6:00 to 14:00 and then remained at elevated levels until 20:00–22:00. Similar diurnal variations were also observed for acetaldehyde, acetone, and methylglyoxal. It is commonly recognized that photochemical production is an important source of formaldehyde and other carbonyls [13]. As simulated by the F0AM model (Section 3.4.1), the production rate of formaldehyde increased quickly after sunrise and peaked at noon (12:00–14:00), which could induce the rising concentrations observed from 6:00 to 14:00. The stable concentrations in the afternoon may result from a balance between production rate and loss rate. At night, the secondary formation of formaldehyde is normally negligible. However, formaldehyde concentrations at night were comparable with those at noon during nonpollution days. Yang et al. [6] also reported high levels of night-time carbonyls at a rural site in North China and attributed it to regional transport. In previous studies, the ratio of m,p-xylene to ethylbenzene (X/E) has been widely applied to estimate the photochemical age of air masses, and a lower X/E ratio indicates a higher photochemical age [53]. In this study, the averaged X/E ratio was 1.92 at night during nonpollution days, which was lower than that during pollution days (2.96) in Guangzhou (this study) and measurements in Xi’an (~3) [54] and Shanghai (~2.7) [55]. This indicated that air masses at night transported a longer distance and were more aged during nonpollution days. Therefore, the undiminished levels of formaldehyde at night would be influenced by regional transport during nonpollution days.
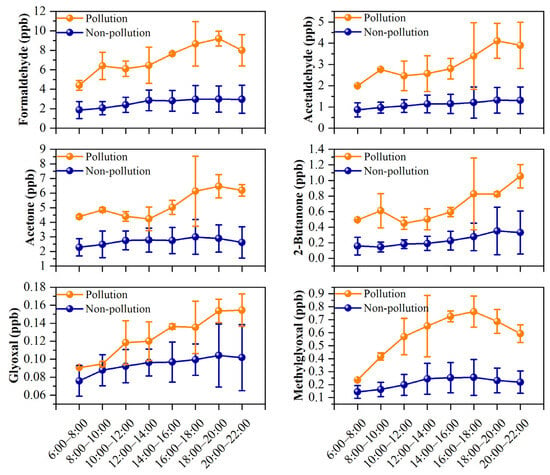
Figure 3.
Diurnal variations of major carbonyls during pollution days and nonpollution days.
Different from nonpollution days, the concentrations of these carbonyls exhibited a consistent increase in concentration throughout the day and peaked at approximately 18:00–20:00, then decreased at night. This trend was consistent with the diurnal variation of secondary formations. As shown in Section 3.4.1, the photochemical production rate of formaldehyde was higher than the loss rate of formaldehyde during the whole daytime from sunrise to sunset, which resulted in the accumulation of formaldehyde from secondary formation, even in the afternoon. In addition, increased primary emissions may also lead to an increased concentration of formaldehyde during pollution days, which are further investigated in Section 3.4.2. For 2-butanone and glyoxal, their concentrations showed similar diurnal variations during pollution days and nonpollution days, which gradually increased throughout the day, reaching a peak between 18:00 and 20:00. Previous studies have identified vehicle emissions as significant sources of 2-butanone and glyoxal [29,56,57]. The observed peak at 18:00–20:00 coincided with evening rush hours, suggesting the effect of vehicle emissions at the suburban site of Guangzhou.
Differently to carbonyls, the diurnal variations of VOCs (except biogenic VOCs) generally showed higher concentrations in the morning and at night, whereas they showed lower concentrations in the afternoon (Figure 1). Several factors could influence their diurnal variations [14,16]: the increased vehicle emissions could lead to higher concentrations during rush hours, the higher BLH and faster photochemical reactions could lead to lower concentrations at noon, and the lower BLH and weaker photochemical reactions could lead to the higher concentrations at night. Biogenic VOCs showed higher mixing ratios in the afternoon and lower mixing ratios in the morning and at night, which were consistent with the variations in plant emissions affected by light and temperature [4].
3.3. Impact of Carbonyls on Ozone Formation
The OFP method was applied to assess the contributions of carbonyl compounds to O3 formation. As illustrated in Figure 4, carbonyl compounds contributed the most to the total OFP values on both nonpollution (32.87%) and pollution days (36.71%), which were higher than the other O3 precursors, i.e., alkanes, alkenes, aromatics, and biogenic VOCs (BVOCs). Among the ninety individual compounds detected, formaldehyde showed the highest OFP values and contributed up to 15.92% and 18.10% of total OFP values during nonpollution days and pollution days, respectively. Acetaldehyde and methylglyoxal were also among the top ten compounds that had the highest OFP values, with contributions of 6.91% and 5.16% during nonpollution days, respectively, and 7.75% and 6.00% during pollution days, respectively (Figure 5). Benzaldehyde exhibited a negative OFP value (−0.08 ppb and −0.26 ppb) in this study because of its negative MIR value (−0.67 g O3/g VOCs) [40], which was also reported in previous studies [6].
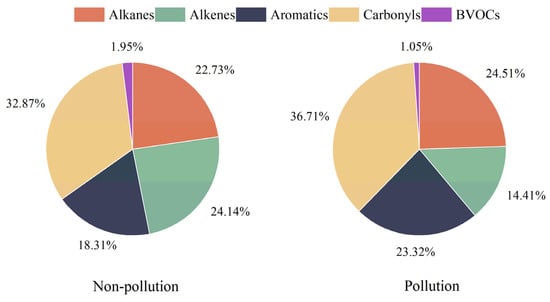
Figure 4.
The contributions of different VOC groups to ozone formation potential (OFP) during the nonpollution and pollution days.
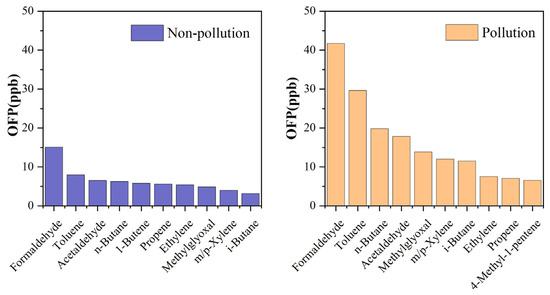
Figure 5.
Carbonyls and NMHC compounds with the top 10 OFP values during nonpollution and pollution days.
Figure 6 shows the simulation results of O3 during the sampling time (6:00–22:00). The level of O3 in the daytime is more interesting, since O3, as a secondary pollutant, is formed from various precursors (including carbonyls) via photochemical reactions. As illustrated in Figure 6, good agreements were found between the observed O3 concentrations and the simulated O3 concentrations in most sampling days, suggesting that the F0AM model effectively elucidates the process of ozone generation. Since the photochemical production of ozone at night was not available in the model simulation, the observed O3 peaks at night indicated the existence of O3 from regional transport. If we consider the simulated O3 concentrations as the local production of O3, and the difference between observed and simulated O3 concentrations as O3 from regional transport or regional backgrounds, the results suggest that approximately 62–88% and 54–100% of ozone was generated locally, respectively, whereas 12–38% and 0–46% of ozone was attributed to regional transport or background during pollution and nonpollution days, respectively.
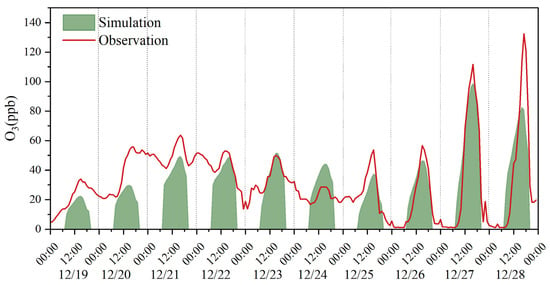
Figure 6.
Model simulation of O3 formation.
To identify the key O3 precursors, the RIR values of various O3 precursors, including carbonyls, NMHCs, and NOx, were calculated via the F0AM model and summarized in Figure 7. Throughout the sampling period, carbonyls and NMHCs showed positive RIR values, whereas NOx showed negative RIR values, indicating that O3 sensitivity was in the VOC-limited regime at the suburban site of Guangzhou. This is consistent with the other O3 formation sensitivity tests in Guangzhou conducted previously [58,59]. As shown in Figure 7, the RIR values of carbonyl compounds were significantly greater than those of NMHCs, including alkenes, BVOCs, aromatics, and alkanes. Therefore, both the OFP approach and the RIR approach highlighted the critical role of carbonyl compounds in O3 formation, especially formaldehyde.
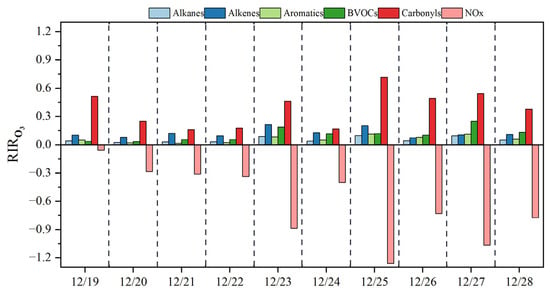
Figure 7.
Calculated RIRs for ozone formation from precursors (carbonyls, NMHCs, and NOx).
3.4. Source Implications on Carbonyls
3.4.1. Secondary Formation of Formaldehyde
Since formaldehyde was found to be the largest contributor to carbonyl concentrations and O3 formations at the sampling site, and secondary formation is commonly recognized as an important source of formaldehyde [13], we further investigated the photochemical production of formaldehyde via the F0AM model. As illustrated in Figure 8, the simulated formaldehyde concentrations were generally lower than the observed concentrations from December 25th to 28th, indicating an additional source other than secondary formation. Generally, the secondary formation could contribute 49–100% and 76–79% of formaldehyde observed at the sampling site during nonpollution days and pollution days, respectively.
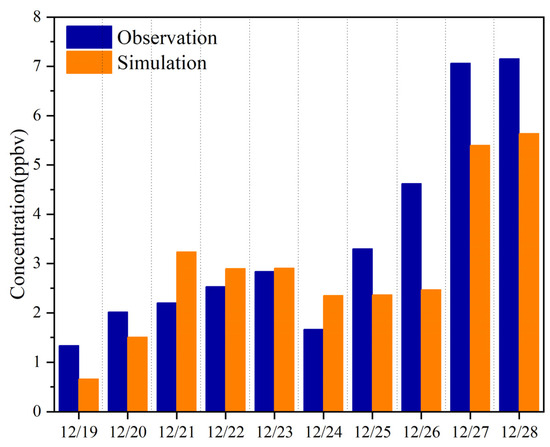
Figure 8.
Observed and simulated concentrations of formaldehyde during the sampling period.
In the MCM v3.3.1, the chemical mechanism used in the F0AM model, formaldehyde formation can be categorized into five major types of reactions, including RO + O2, O3 + VOCs, OH + VOCs, OVOC photolysis, and radical propagation reactions [13]. Based on the model simulation, the production and loss rates of formaldehyde were calculated for these reaction paths during nonpollution days (Figure 9a) and pollution days (Figure 9b). It was obvious that the RO + O2 reactions (including the CH3O + O2 reaction and the other RO + O2 reaction) were the most significant pathways to formaldehyde formation on both nonpollution days and pollution days. The CH3O + O2 reaction contributed up to 38.0% and 60.1% of formaldehyde production, respectively, whereas the other RO + O2 reaction contributed 55.2% and 34.7% on the nonpollution and pollution days, respectively. For the loss paths, the simulated loss rates of formaldehyde were driven primarily by its photolysis and reactions with OH radicals (Figure 9).
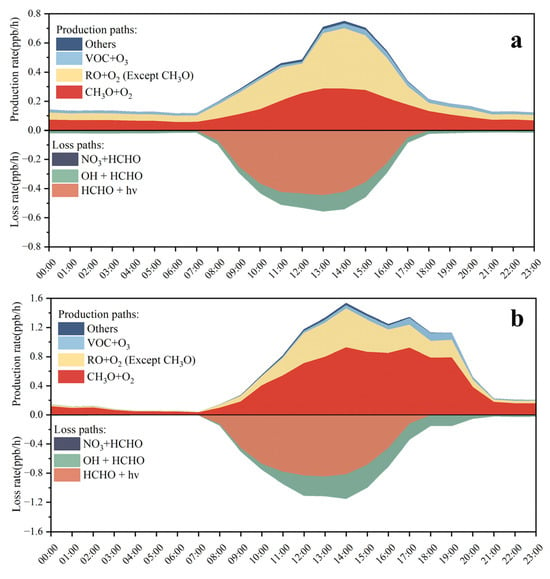
Figure 9.
Model-simulated production rate (P (HCHO)) and loss rate (L (HCHO)) of formaldehyde through different reaction pathways during nonpollution days (a) and pollution days (b).
The RIR values of formaldehyde precursors were also simulated to evaluate the controlling factors of formaldehyde secondary formation. Following the previous study [60], the measured NMHC compounds were classified into five main groups: alkenes, aromatics, biogenic hydrocarbons (BHCs, including isoprene, α-pinene, and β-pinene), alkanes with four or more carbons (C4HC), and low-reactivity hydrocarbons (LRHC, including acetylene, ethane, and propane). As shown in Figure 10, alkenes had the highest RIR values of formaldehyde, followed by BHCs, which was consistent with previous studies [13,60,61]. Although the observed concentrations of alkenes and BHCs were 1–2 orders of magnitude lower than those of alkanes and aromatics, the dominant roles of alkenes and BHCs in the production of formaldehyde should not be overlooked. In addition, the RIR value of aromatics followed that of alkenes and BVOCs, suggesting that aromatics are also important precursors of formaldehyde. For the RIR values of individual compounds (Figure 11), trans-2-butene, isoprene, and propylene had the highest RIR values during the pollution days, suggesting that the secondary formation of formaldehyde at the sampling site was mainly due to the photochemical oxidation of these three VOCs.
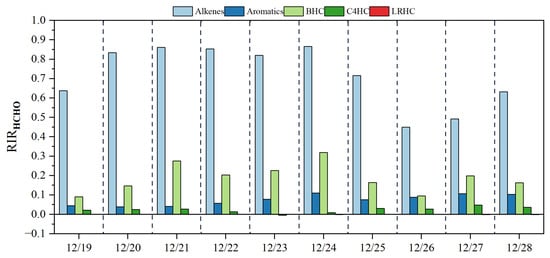
Figure 10.
The calculated RIRs of the five major HC groups for the formation of formaldehyde.
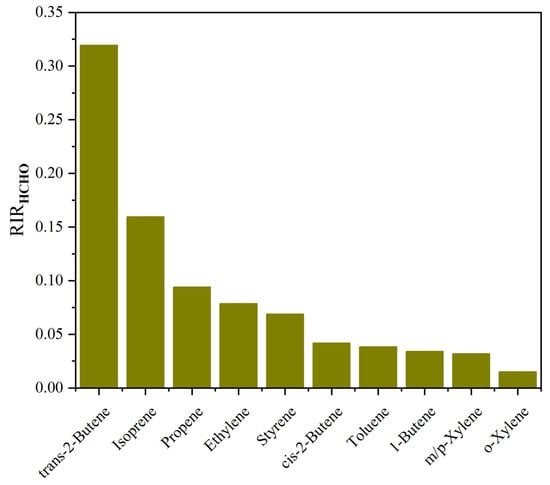
Figure 11.
Model-calculated RIRs of the individual top 10 NMHC species for the formation of formaldehyde during pollution days.
3.4.2. Characteristic Ratios
The characteristic ratios of formaldehyde to acetaldehyde (F/A) and acetaldehyde to propanal (A/P) are widely applied to identify the main sources of carbonyls [30,62]. It was reported that the F/A ratio usually varied from 1 to 2 in urban areas to about 10 in forested areas [30,63,64]. Therefore, a higher F/A ratio indicates the significant influence of biogenic sources on carbonyl compounds. In this study, good correlations between formaldehyde and acetaldehyde were observed during pollution days (r2 = 0.89, p < 0.01) and nonpollution days (r2 = 0.95, p < 0.01) (Figure 12a) with slopes of 1.70 and 2.20, respectively. The F/A ratios in this study were markedly lower than those reported in forested regions [65], and were analogous to those reported in urban atmospheres (Table 2). These results indicated that carbonyls at the sampling site were more largely influenced by anthropogenic sources than biogenic sources, especially during pollution days. Similarly, acetaldehyde and propanal also showed significant correlations (r2 > 0.9, p < 0.01) (Figure 12b). The A/P ratio was 7.61 during nonpollution days and 7.01 during pollution days, respectively. Since propanal is usually associated only with anthropogenic emissions [66], the lower A/P ratio during pollution days also suggested the increased influence from anthropogenic sources.
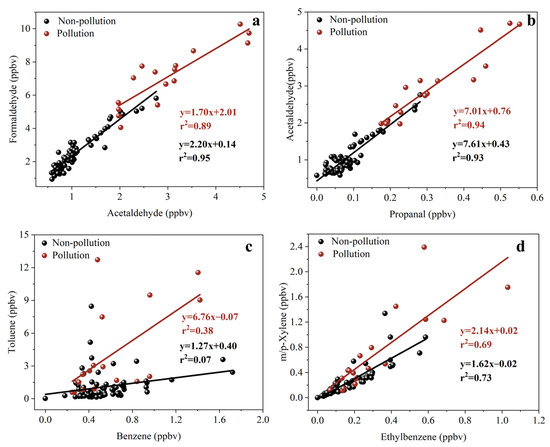
Figure 12.
Correlation analysis of formaldehyde to acetaldehyde (a), acetaldehyde to propanal (b), toluene to benzene (c), and m,p-xylene to ethylbenzene (d) during nonpollution days and pollution days.
Previous studies have reported the co-emission of carbonyls and VOCs from some sources, such as vehicle emissions, industrial processes, and biomass burning [17,18,19]. Therefore, the ratio of toluene to benzene (T/B) was used to identify their possible anthropogenic sources [67,68,69]. Under normal circumstances, T/B < 2 indicates that the pollutants in the area are significantly influenced by vehicle exhaust emissions [70,71]. The larger the T/B value is, the smaller the influence of vehicles and the larger the influence of other VOC sources [72,73]. T/B > 2 indicates that there are other sources in addition to vehicle exhaust, and when T/B reaches 10 or higher, it indicates the presence of strong industrial emission sources, since toluene is used as a solvent in many industrial applications [74,75]. As shown in Figure 12c, weak correlations were found between toluene and benzene in this study, suggesting the complex sources there. During pollution days, the T/B ratio was averaged as 6.44 ± 5.99 and the highest ratio even reached 26.50, indicating a greater contribution from industrial activities during pollution days. Previous studies [19,76,77,78] have reported the detection of carbonyl compounds in emission characteristics of industrial sources, such as petrochemical industry, chemical industry, and power plants. Therefore, the increased industrial emissions could induce high concentrations of carbonyls during pollution days. During nonpollution days, the T/B ratios were mostly close to the typical ratio of vehicle emission (~2), suggesting the significant influence of vehicle emissions. Moreover, some scatters in Figure 12c also showed high ratios of T/B as high as 19.96, suggesting occasional input by industrial emissions during nonpollution days.
As mentioned in Section 3.2, the ratio of m,p-xylene to ethylbenzene (X/E) is widely applied to estimate the photochemical age of air masses, and a lower X/E ratio indicates a higher photochemical age [53]. The good correlations between m,p-xylene and ethylbenzene (Figure 12d) suggested the reasonable use of the X/E ratio in this study. The X/E ratio during nonpollution days (1.62) was lower than that during pollution days (2.14) and in fresh source emissions (>2) [73]. This indicated that air masses during nonpollution days were largely influenced by regional sources after a longer transportation, whereas air masses during pollution days were more influenced by local sources with lower ages.
3.4.3. Back Trajectories Analysis
The 48 hr backward trajectory clustering revealed that the air masses arriving at the sampling site during nonpollution days could be classified into five clusters (Figure 13a). Cluster 1 originated in Chenzhou, Hunan Province, passed through Ganzhou, Jiangxi Province, circled around Qingyuan, and finally arrived at Huadu. Cluster 2 originated in Tongling, Anhui Province, passed through Nanchang, Jinggangshan, and Ganzhou in Jiangxi Province, and passed through Qingyuan to Huadu. Cluster 3 originated in Wenzhou, Zhejiang Province, along the southeast coastal line, and passed through Fuzhou, Putian, Quanzhou, and industrial regions such as Shantou, Huizhou, and Dongguan before reaching Huadu. Cluster 4 originated in Nanchang, Jiangxi Province, and traversed the region via Ganzhou and Heyuan to Huadu. Cluster 5 originated in Heyuan, Guangdong Province, and subsequently traversed Huadu. Clusters 2, 4, and 5 each contributed more than 20% to the total air masses, together accounting for nearly 75% of the total air masses. These clusters predominantly originated from relatively clean regions.
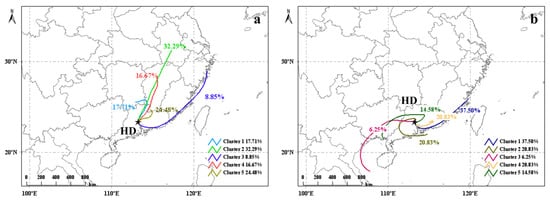
Figure 13.
Mean 48 h back trajectories of clusters at the Huadu site (black star) during nonpollution days (a) and pollution days (b).
During pollution days, the air masses arriving at the sampling were also classified into five clusters (Figure 13b): Cluster 1 originated in Fuzhou, Fujian Province, along the southeast coastal line, and passed through Putian, Quanzhou, Zhangzhou, and industrial regions such as Shantou, Jieyang, Huizhou, and Dongguan before reaching Huadu. Cluster 2 originated near the Hong Kong–Macau border, passing through Yangjiang, Wuzhou, and Qingyuan to Huadu. Cluster 3 originated over the South China Sea, and passed through Nanning and Wuzhou in Guangxi Province before reaching Huadu. Cluster 4 originated in Heyuan, passing through Huizhou and Dongguan to Huadu. Cluster 5 originated in Beihai, Guangxi Province, passing through Guigang, Hezhou, and Shaoguan to Huadu. The spatial patterns of VOCs emissions showed that industrial emissions were distributed primarily over the central Guangzhou–Foshan–Dongguan–Shenzhen metropolitan areas, especially in the Dongguan area [79]. Compared with nonpollution days, the contribution of the air mass from the southeast coast to the total air masses increased significantly from 8.85% to 37.5%, with this air mass originating from regions with more industrial activities. Air masses significantly contributing to pollution days (clusters 2 and 4) also originated from industrialized areas in the Pearl River Delta. The influx of air masses from the southeastern coastline may serve as a significant contributor to pollutant levels during polluted days, underscoring the role of regional transportation in shaping the overall atmospheric composition.
A fire hotspot map generated from satellite remote sensing data with active fire points and their density in the atmospheric environment can be used to demonstrate the influence of biomass burning on air pollution [80,81]. Biomass burning releases large amounts of pollutants such as VOCs and OVOCs [24,25,82,83], which contribute significantly to carbonyls through photooxidation. As shown in Figure 14, the back trajectories and fire hotspot maps for each day during the sampling period indicate that air masses arriving at the sampling site from December 19 to 26 did not pass through many fire hotspots, whereas on pollution days (December 27–28), air masses passed through numerous fire hotspots before reaching the sampling point. This phenomenon, combined with the significant increase in NOx, CO, and combustion-related NMHCs (such as alkenes and benzene), indicated that biomass burning would also be an important contributor to elevated carbonyl concentrations during the pollution process.
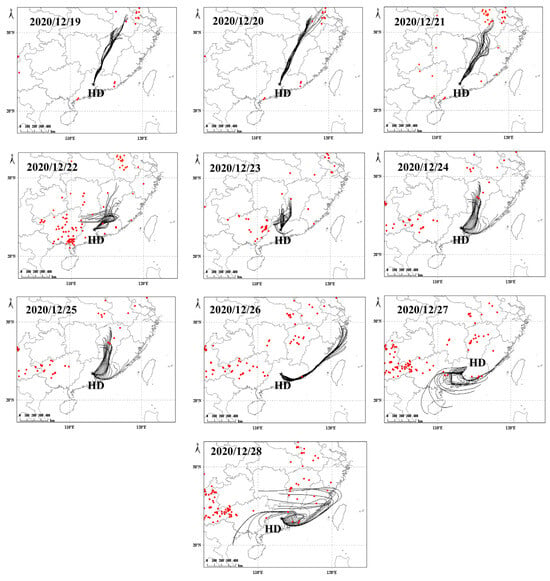
Figure 14.
Backward trajectory and fire hotspot map within 48 h during the sampling period from 19 to 28 December 2020 (24 trajectories per day) at the Huadu site (black star).
4. Conclusions
From 19 to 28 December 2020, a comprehensive field observation campaign was conducted at a suburban site in the Huadu District of Guangzhou. The concentration, characteristics, and sources of carbonyl compounds in this region were analyzed. The F0AM model was employed to simulate the secondary formation of O3 and formaldehyde, as well as to assess the sensitivity of O3 and formaldehyde formation to various precursors. Additionally, the contributions of different compounds to O3 formation were calculated based on OFP. The results indicated that formaldehyde, acetone, and acetaldehyde were the three most abundant carbonyl compounds both on pollution days and nonpollution days. The average concentrations were 2.57 ± 1.12, 2.73 ± 0.88, and 1.10 ± 0.48 ppbv on nonpollution days and 7.11 ± 1.80, 5.21 ± 1.13, and 3.00 ± 0.94 ppbv on pollution days, respectively. O3 simulations based on the F0AM model indicated that approximately 62–88% and 54–100% of ozone was generated locally during pollution and nonpollution days, respectively, whereas 12–38% and 0–46% of ozone was attributed to regional transport or background during pollution and nonpollution days, respectively. The RIR and OFP approaches revealed that carbonyl compounds play crucial roles in O3 formation, with formaldehyde, acetaldehyde, and methylglyoxal identified as the most significant reactive carbonyls. Consequently, future O3 pollution control strategies should prioritize these three compounds. The simulation of formaldehyde revealed that secondary formation could contribute 49–100% and 76–79% of formaldehyde observed at the sampling site during the nonpollution days and pollution days, respectively. The RIR values indicated that the formation of formaldehyde was governed mainly by alkenes and BHCs throughout the sampling period. Moreover, the characteristic ratios and backward trajectory analysis confirmed that carbonyl concentrations at the sampling site were also indispensable and impacted by local primary sources (like industrial emissions and vehicle emissions) and regional sources (like biomass burning) through transportation. In summary, this study highlights the impact of carbonyl compounds on photochemical pollution in suburban areas of Guangzhou and highlights the influence of secondary formation and primary emissions on formaldehyde. Given the limited understanding of carbonyl compound pollution in China, further research on these pollutants in the affected regions of the country is recommended.
Author Contributions
Writing—original draft, A.G.; Formal analysis, A.G.; Methodology, A.G., Z.W., S.X. and X.H.; Data curation, A.G. and W.S.; Funding acquisition, X.W. and Y.Z.; Writing—review and editing, X.W., Z.Z. and Y.Z. All authors have read and agreed to the published version of the manuscript.
Funding
National Natural Science Foundation of China (42321003), Guangdong Foundation for Program of Science and Technology Research (2023B0303000007/2023B1212060049), and Guangzhou Municipal Science and Technology Bureau (202206010057).
Institutional Review Board Statement
Not applicable.
Informed Consent Statement
Not applicable.
Data Availability Statement
The data presented in this study are available on request from the corresponding author. The data are not publicly available due to the internal policy of the university.
Conflicts of Interest
The authors declare no conflicts of interest.
References
- Atkinson, R. Atmospheric chemistry of VOCs and NOx. Atmos. Environ. 2000, 34, 2063–2101. [Google Scholar] [CrossRef]
- World Health Organization. Regional Office for Europe. Air quality guidelines for Europe, 2nd ed.; World Health Organization. Regional Office for Europe: Copenhagen, Denmark, 2000. [Google Scholar]
- Zhang, L.P.; Steinmaus, C.; Eastmond, D.A.; Xin, X.K.; Smith, M.T. Formaldehyde exposure and leukemia: A new meta-analysis and potential mechanisms. Mutat. Res. 2009, 681, 150–168. [Google Scholar] [CrossRef] [PubMed]
- Villanueva, F.; Tapia, A.; Notario, A.; Albaladejo, J.; Martínez, E. Ambient levels and temporal trends of VOCs, including carbonyl compounds, and ozone at Cabaneros National Park border, Spain. Atmos. Environ. 2014, 85, 256–265. [Google Scholar] [CrossRef]
- da Silva, D.B.N.; Martins, E.M.; Corrêa, S.M. Role of carbonyls and aromatics in the formation of tropospheric ozone in Rio de Janeiro, Brazil. Environ. Monit. Assess. 2016, 188, 289. [Google Scholar] [CrossRef]
- Yang, X.; Xue, L.K.; Yao, L.; Li, Q.Y.; Wen, L.; Zhu, Y.H.; Chen, T.S.; Wang, X.F.; Yang, L.X.; Wang, T.; et al. Carbonyl compounds at Mount Tai in the North China Plain: Characteristics, sources, and effects on ozone formation. Atmos. Res. 2017, 196, 53–61. [Google Scholar] [CrossRef]
- Yang, X.; Zhang, G.; Hu, S.H.; Wang, J.H.; Zhang, P.C.; Zhong, X.L.; Song, H.Y. Summertime carbonyl compounds in an urban area in the North China Plain: Identification of sources, key precursors and their contribution to O3 formation. Environ. Pollut. 2023, 331, 121908. [Google Scholar] [CrossRef]
- Chai, W.X.; Wang, M.; Li, J.Y.; Tang, G.G.; Zhang, G.H.; Chen, W.T. Pollution characteristics, sources, and photochemical roles of ambient carbonyl compounds in summer of Beijing, China. Environ. Pollut. 2023, 336, 122403. [Google Scholar] [CrossRef]
- Huang, X.F.; Zhang, B.; Xia, S.Y.; Han, Y.; Wang, C.; Yu, G.H.; Feng, N. Sources of oxygenated volatile organic compounds (OVOCs) in urban atmospheres in North and South China. Environ. Pollut. 2020, 261, 114152. [Google Scholar] [CrossRef]
- Zhang, Y.N.; Xue, L.K.; Li, H.Y.; Chen, T.S.; Mu, J.S.; Dong, C.; Sun, L.; Liu, H.D.; Zhao, Y.; Wu, D.; et al. Source apportionment of regional ozone pollution observed at Mount Tai, North China: Application of lagrangian photochemical trajectory model and implications for control policy. J. Geophys. Res.-Atmos. 2021, 126, e2020JD033519. [Google Scholar] [CrossRef]
- Chen, G.J.; Ji, X.T.; Chen, J.S.; Xu, L.L.; Hu, B.Y.; Lin, Z.Y.; Fan, X.L.; Li, M.R.; Hong, Y.W.; Chen, J.F. Photochemical pollution during summertime in a coastal city of Southeast China: Ozone formation and influencing factors. Atmos. Res. 2024, 301, 107270. [Google Scholar] [CrossRef]
- Wang, F.L.; Ho, S.S.H.; Man, C.L.; Qu, L.L.; Wang, Z.; Ning, Z.; Ho, K.F. Characteristics and sources of oxygenated VOCs in Hong Kong: Implications for ozone formation. Sci. Total Environ. 2024, 912, 169156. [Google Scholar] [CrossRef] [PubMed]
- Yang, X.; Xue, L.K.; Wang, T.; Wang, X.F.; Gao, J.; Lee, S.C.; Blake, D.R.; Chai, F.H.; Wang, W.X. Observations and explicit Modeling of summertime carbonyl formation in Beijing: Identification of key precursor species and their impact on atmospheric oxidation chemistry. J. Geophys. Res. -Atmos. 2018, 123, 1426–1440. [Google Scholar] [CrossRef]
- Qin, J.J.; Wang, X.B.; Yang, Y.R.; Qin, Y.Y.; Shi, S.X.; Xu, P.H.; Chen, R.Z.; Zhou, X.M.; Tan, J.H.; Wang, X.M. Source apportionment of VOCs in a typical medium-sized city in North China Plain and implications on control policy. J. Environ. Sci. 2021, 107, 26–37. [Google Scholar] [CrossRef]
- Chen, T.S.; Zheng, P.G.; Zhang, Y.N.; Dong, C.; Han, G.X.; Li, H.; Yang, X.; Liu, Y.H.; Sun, J.J.; Li, H.Y.; et al. Characteristics and formation mechanisms of atmospheric carbonyls in an oilfield region of northern China. Atmos. Environ. 2022, 274, 118958. [Google Scholar] [CrossRef]
- Liu, C.T.; Zhang, C.L.; Liu, J.F.; Liu, P.F.; Mu, Y.J. Characteristics and sources of volatile organic compounds during summertime in Tai’an, China. Atmos. Pollut. Res. 2022, 13, 101340. [Google Scholar] [CrossRef]
- Wu, Z.F.; Zhang, Y.L.; Pei, C.L.; Huang, Z.Z.; Wang, Y.J.; Chen, Y.N.; Yan, J.H.; Huang, X.Q.; Xiao, S.X.; Luo, S.L.; et al. Real-world emissions of carbonyls from vehicles in an urban tunnel in South China. Atmos. Environ. 2021, 258, 118491. [Google Scholar] [CrossRef]
- Wang, Y.F.; Cui, J.; Qiao, X.Q.; Sun, M.; Zhang, J.B. Real-world emission characteristics of carbonyl compounds from on-road vehicles in Beijing and Zhengzhou, China. Sci. Total Environ. 2024, 916, 170135. [Google Scholar] [CrossRef]
- Kim, K.-H.; Hong, Y.-J.; Pal, R.; Jeon, E.-C.; Koo, Y.-S.; Sunwoo, Y. Investigation of carbonyl compounds in air from various industrial emission sources. Chemosphere 2008, 70, 807–820. [Google Scholar] [CrossRef]
- Wang, M.; Chen, W.T.; Shao, M.; Lu, S.H.; Zeng, L.M.; Hu, M. Investigation of carbonyl compound sources at a rural site in the Yangtze River Delta region of China. J. Environ. Sci. 2015, 28, 128–136. [Google Scholar] [CrossRef]
- Zhang, J.F.; Smith, K.R. Emissions of carbonyl compounds from various cookstoves in China. Environ. Sci. Technol. 1999, 33, 2311–2320. [Google Scholar] [CrossRef]
- Rottenberger, S.; Kuhn, U.; Wolf, A.; Schebeske, G.; Oliva, S.T.; Tavares, T.M.; Kesselmeier, J. Exchange of short-chain aldehydes between Amazonian vegetation and the atmosphere. Ecol. Appl. 2004, 14, S247–S262. [Google Scholar] [CrossRef]
- Seco, R.; Penuelas, J.; Filella, I. Short-chain oxygenated VOCs: Emission and uptake by plants and atmospheric sources, sinks, and concentrations. Atmos. Environ. 2007, 41, 2477–2499. [Google Scholar] [CrossRef]
- Zarzana, K.J.; Min, K.-E.; Washenfelder, R.A.; Kaiser, J.; Krawiec-Thayer, M.; Peischl, J.; Neuman, J.A.; Nowak, J.B.; Wagner, N.L.; Dube, W.P.; et al. Emissions of Glyoxal and Other Carbonyl Compounds from Agricultural Biomass Burning Plumes Sampled by Aircraft. Environ. Sci. Technol. 2017, 51, 11761–11770. [Google Scholar] [CrossRef] [PubMed]
- Cheng, P.H.; Liu, Z.Y.; Feng, Y.L.; Han, Y.; Peng, Y.; Cai, J.J.; Chen, Y.J. Emission characteristics and formation pathways of carbonyl compounds from the combustion of biomass and their cellulose, hemicellulose, and lignin at different temperatures and oxygen concentrations. Atmos. Environ. 2022, 291, 119387. [Google Scholar] [CrossRef]
- Shen, J.; Zhang, Y.H.; Wang, X.S.; Li, J.F.; Chen, H.; Liu, R.; Zhong, L.J.; Jiang, M.; Yue, D.L.; Chen, D.H.; et al. An ozone episode over the Pearl River Delta in October 2008. Atmos. Environ. 2015, 122, 852–863. [Google Scholar] [CrossRef]
- Wang, X.Q.; Zhang, T.S.; Xiang, Y.; Lv, L.H.; Fan, G.Q.; Ou, J.P. Investigation of atmospheric ozone during summer and autumn in Guangdong Province with a lidar network. Sci. Total Environ. 2021, 751, 141740. [Google Scholar] [CrossRef]
- Wang, J.; Zhang, Y.L.; Xiao, S.X.; Wu, Z.F.; Wang, X.M. Ozone formation at a suburban site in the Pearl River Delta Region, China: Role of biogenic volatile organic compounds. Atmosphere 2023, 14, 609. [Google Scholar] [CrossRef]
- Feng, Y.L.; Wen, S.; Chen, Y.J.; Wang, X.M.; Lü, H.X.; Bi, X.H.; Sheng, G.Y.; Fu, J.M. Ambient levels of carbonyl compounds and their sources in Guangzhou, China. Atmos. Environ. 2005, 39, 1789–1800. [Google Scholar] [CrossRef]
- Feng, Y.L.; Wen, S.; Wang, X.M.; Sheng, G.Y.; He, Q.S.; Tang, J.H.; Fu, J.M. Indoor and outdoor carbonyl compounds in the hotel ballrooms in Guangzhou, China. Atmos. Environ. 2004, 38, 103–112. [Google Scholar] [CrossRef]
- Zhang, Y.L.; Wang, X.M.; Barletta, B.; Simpson, I.J.; Blake, D.R.; Fu, X.X.; Zhang, Z.; He, Q.F.; Liu, T.Y.; Zhao, X.Y.; et al. Source attributions of hazardous aromatic hydrocarbons in urban, suburban and rural areas in the Pearl River Delta (PRD) region. J. Hazard. Mater. 2013, 250, 403–411. [Google Scholar] [CrossRef]
- Yang, W.Q.; Zhang, Y.L.; Wang, X.M.; Li, S.; Zhu, M.; Yu, Q.Q.; Li, G.H.; Huang, Z.H.; Zhang, H.N.; Wu, Z.F.; et al. Volatile organic compounds at a rural site in Beijing: Influence of temporary emission control and wintertime heating. Atmos. Chem. Phys. 2018, 18, 12663–12682. [Google Scholar] [CrossRef]
- Qin, J.J.; Zhou, X.M.; Yang, Y.R.; Tan, J.H.; Zhang, K.; Duan, J.C.; Li, Y.; Hu, J.N.; Chen, R.Z.; He, K.B. Chemical characteristics of atmospheric carbonyls over the South China Sea: Influence of continental outflow. Atmos. Environ. 2019, 208, 141–149. [Google Scholar] [CrossRef]
- Wolfe, G.M.; Marvin, M.R.; Roberts, S.J.; Travis, K.R.; Liao, J. The Framework for 0-D Atmospheric Modeling (F0AM) v3.1. Geosci. Model Dev. 2016, 9, 3309–3319. [Google Scholar] [CrossRef]
- Wang, J.; Zhang, Y.L.; Wu, Z.F.; Luo, S.L.; Song, W.; Wang, X.M. Ozone episodes during and after the 2018 Chinese National Day holidays in Guangzhou: Implications for the control of precursor VOCs. J. Environ. Sci. 2022, 114, 322–333. [Google Scholar] [CrossRef]
- Wang, J.; Zhang, Y.L.; Zhao, W.X.; Wu, Z.F.; Luo, S.L.; Zhang, H.N.; Zhou, H.S.; Song, W.; Zhang, W.J.; Wang, X.M. Observationally constrained modeling of peroxy radical during an ozone episode in the Pearl River Delta Region, China. J. Geophys. Res. -Atmos. 2023, 128, e2022JD038279. [Google Scholar] [CrossRef]
- Carter, W.P.L.; Atkinson, R. Computer modeling study of incremental hydrocarbon reactivity. Environ. Sci. Technol. 1989, 23, 864–880. [Google Scholar] [CrossRef]
- Cardelino, C.A.; Chameides, W.L. An observation-based model for analyzing ozone precursor relationships in the urban atmosphere. J. Air Waste Manag. Assoc. 1995, 45, 161–180. [Google Scholar] [CrossRef]
- Carter, W.P.L. Development of ozone reactivity scales for volatile organic-compounds. J. Air Waste Manag. Assoc. 1994, 44, 881–899. [Google Scholar] [CrossRef]
- Carter, W.P.L. Updated maximum incremental reactivity scale and hydrocarbon bin reactivities for regulatory applications. Calif. Air Resour. Board Contract 2010, 1, 07–339. [Google Scholar]
- Amnuaylojaroen, T.; Kaewkanchanawong, P.; Panpeng, P. Distribution and meteorological control of PM2.5 and its effect on visibility in Northern Thailand. Atmosphere 2023, 14, 538. [Google Scholar] [CrossRef]
- Duo, B.; Cui, L.; Wang, Z.Z.; Li, R.; Zhang, L.W.; Fu, H.B.; Chen, J.M.; Zhang, H.F.; Qiong, A. Observations of atmospheric pollutants at Lhasa during 2014–2015: Pollution status and the influence of meteorological factors. J. Environ. Sci. 2018, 63, 28–42. [Google Scholar] [CrossRef] [PubMed]
- Yang, Y.; Zhou, Y.; Wang, H.L.; Li, M.Y.; Li, H.M.; Wang, P.Y.; Yue, X.; Li, K.; Zhu, J.; Liao, H. Meteorological characteristics of extreme ozone pollution events in China and their future predictions. Atmos. Chem. Phys. 2024, 24, 1177–1191. [Google Scholar] [CrossRef]
- Bao, J.M.; Li, H.; Wu, Z.H.; Zhang, X.; Zhang, H.; Li, Y.F.; Qian, J.; Chen, J.H.; Deng, L.Q. Atmospheric carbonyls in a heavy ozone pollution episode at a metropolis in Southwest China: Characteristics, health risk assessment, sources analysis. J. Environ. Sci. 2022, 113, 40–54. [Google Scholar] [CrossRef] [PubMed]
- Ling, Z.H.; Guo, H.; Chen, G.X.; Lam, S.H.M.; Fan, S.J. Formaldehyde and Acetaldehyde at Different Elevations in Mountainous Areas in Hong Kong. Aerosol Air Qual. Res. 2016, 16, 1868–1878. [Google Scholar] [CrossRef]
- Lui, K.H.; Ho, S.S.H.; Louie, P.K.K.; Chan, C.S.; Lee, S.C.; Hu, D.; Chan, P.W.; Lee, J.C.W.; Ho, K.F. Seasonal behavior of carbonyls and source characterization of formaldehyde (HCHO) in ambient air. Atmos. Environ. 2017, 152, 51–60. [Google Scholar] [CrossRef]
- Yuan, B.; Chen, W.T.; Shao, M.; Wang, M.; Lu, S.H.; Wang, B.; Liu, Y.; Chang, C.-C.; Wang, B.G. Measurements of ambient hydrocarbons and carbonyls in the Pearl River Delta (PRD), China. Atmos. Res. 2012, 116, 93–104. [Google Scholar] [CrossRef]
- Wang, J.H.; Sun, S.Y.; Zhang, C.X.; Xue, C.Y.; Liu, P.F.; Zhang, C.L.; Mu, Y.J.; Wu, H.; Wang, D.F.; Chen, H.; et al. The pollution levels, variation characteristics, sources and implications of atmospheric carbonyls in a typical rural area of North China Plain during winter. J. Environ. Sci. 2020, 95, 256–265. [Google Scholar] [CrossRef]
- Ochs, S.d.M.; Albuquerque, F.C.; Massa, M.C.G.P.; Pereira Netto, A.D. Evaluation of C1–C13 carbonyl compounds by RRLC-UV in the atmosphere of Niterói City, Brazil. Atmos. Environ. 2011, 45, 5183–5190. [Google Scholar] [CrossRef]
- Delikhoon, M.; Fazlzadeh, M.; Sorooshian, A.; Baghani, A.N.; Golaki, M.; Ashournejad, Q.; Barkhordari, A. Characteristics and health effects of formaldehyde and acetaldehyde in an urban area in Iran. Environ. Pollut. 2018, 242, 938–951. [Google Scholar] [CrossRef]
- Cerón, R.M.; Cerón, J.G.; Muriel, M. Diurnal and seasonal trends in carbonyl levels in a semi-urban coastal site in the Gulf of Campeche, Mexico. Atmos. Environ. 2007, 41, 63–71. [Google Scholar] [CrossRef]
- Okada, Y.; Nakagoshi, A.; Tsurukawa, M.; Matsumura, C.; Eiho, J.; Nakano, T. Environmental risk assessment and concentration trend of atmospheric volatile organic compounds in Hyogo Prefecture, Japan. Environ. Sci. Pollut. Res. 2012, 19, 201–213. [Google Scholar] [CrossRef] [PubMed]
- Zhang, J.; Wang, T.; Chameides, W.L.; Cardelino, C.; Blake, D.R.; Streets, D.G. Source characteristics of volatile organic compounds during high ozone episodes in Hong Kong, Southern China. Atmos. Chem. Phys. 2008, 8, 4983–4996. [Google Scholar] [CrossRef]
- Song, M.D.; Li, X.; Yang, S.D.; Yu, X.N.; Zhou, S.X.; Yang, Y.M.; Chen, S.Y.; Dong, H.B.; Liao, K.R.; Chen, Q.; et al. Spatiotemporal variation, sources, and secondary transformation potential of volatile organic compounds in Xi’an, China. Atmos. Chem. Phys. 2021, 21, 4939–4958. [Google Scholar] [CrossRef]
- Wang, S.Y.; Zhao, Y.L.; Han, Y.; Li, R.; Fu, H.B.; Gao, S.; Duan, Y.S.; Zhang, L.W.; Chen, J.M. Spatiotemporal variation, source and secondary transformation potential of volatile organic compounds (VOCs) during the winter days in Shanghai, China. Atmos. Environ. 2022, 286, 119203. [Google Scholar] [CrossRef]
- Schauer, J.J.; Kleeman, M.J.; Cass, G.R.; Simoneit, B.R.T. Measurement of emissions from air pollution sources. 5. C1-C32 organic compounds from gasoline-powered motor vehicles. Environ. Sci. Technol. 2002, 36, 1169–1180. [Google Scholar] [CrossRef]
- Zhang, Y.L.; Wang, X.M.; Zhang, Z.; Lü, S.J.; Shao, M.; Lee, F.S.C.; Yu, J.Z. Species profiles and normalized reactivity of volatile organic compounds from gasoline evaporation in China. Atmos. Environ. 2013, 79, 110–118. [Google Scholar] [CrossRef]
- Zhang, Y.H.; Su, H.; Zhong, L.J.; Cheng, Y.F.; Zeng, L.M.; Wang, X.S.; Xiang, Y.R.; Wang, J.L.; Gao, D.F.; Shao, M.; et al. Regional ozone pollution and observation-based approach for analyzing ozone-precursor relationship during the PRIDE-PRD2004 campaign. Atmos. Environ. 2008, 42, 6203–6218. [Google Scholar] [CrossRef]
- Pan, W.J.; Gong, S.L.; Lu, K.D.; Zhang, L.; Xie, S.D.; Liu, Y.H.; Ke, H.B.; Zhang, X.L.; Zhang, Y.H. Multi-scale analysis of the impacts of meteorology and emissions on PM2.5 and O3 trends at various regions in China from 2013 to 2020 3. Mechanism assessment of O3 trends by a model. Sci. Total Environ. 2023, 857, 159592. [Google Scholar] [CrossRef]
- Xue, L.K.; Wang, T.; Gao, J.; Ding, A.J.; Zhou, X.H.; Blake, D.R.; Wang, X.F.; Saunders, S.M.; Fan, S.J.; Zuo, H.C.; et al. Ground-level ozone in four Chinese cities: Precursors, regional transport and heterogeneous processes. Atmos. Chem. Phys. 2014, 14, 13175–13188. [Google Scholar] [CrossRef]
- Zeng, P.; Lyu, X.P.; Guo, H.; Cheng, H.R.; Wang, Z.W.; Liu, X.F.; Zhang, W.H. Spatial variation of sources and photochemistry of formaldehyde in Wuhan, Central China. Atmos. Environ. 2019, 214, 116826. [Google Scholar] [CrossRef]
- Dai, W.T.; Ho, S.S.H.; Ho, K.F.; Liu, W.D.; Cao, J.J.; Lee, S.C. Seasonal and diurnal variations of mono- and di-carbonyls in Xi’an, China. Atmos. Res. 2012, 113, 102–112. [Google Scholar] [CrossRef]
- Shepson, P.B.; Hastie, D.R.; Schiff, H.I.; Polizzi, M.; Bottenheim, J.W.; Anlauf, K.; Mackay, G.I.; Karecki, D.R. Atmospheric concentrations and temporal variations of C1 C3 carbonyl compounds at two rural sites in central Ontario. Atmospheric Environment. Part A. Gen. Top. 1991, 25, 2001–2015. [Google Scholar] [CrossRef]
- Grosjean, D. Atmospheric concentrations and temporal variations of C1 C3 carbonyl compounds at two rural sites in central Ontario. Atmospheric Environment. Part A. Gen. Top. 1992, 26, 349–351. [Google Scholar] [CrossRef]
- Jacob, D.J.; Wofsy, S.C. Photochemistry of biogenic emissions over the Amazon forest. J. Geophys. Res. -Atmospheres. 1988, 93, 1477–1486. [Google Scholar] [CrossRef]
- Anderson, L.G.; Lanning, J.A.; Barrell, R.; Miyagishima, J.; Jones, R.H.; Wolfe, P. Sources and sinks of formaldehyde and acetaldehyde: An analysis of Denver’s ambient concentration data. Atmos. Environ. 1996, 30, 2113–2123. [Google Scholar] [CrossRef]
- Zhang, Y.L.; Wang, X.M.; Blake, D.R.; Li, L.F.; Zhang, Z.; Wang, S.Y.; Guo, H.; Lee, F.S.C.; Gao, B.; Chan, L.Y.; et al. Aromatic hydrocarbons as ozone precursors before and after outbreak of the 2008 financial crisis in the Pearl River Delta region, south China. J. Geophys. Res. -Atmos. 2012, 117, D15306. [Google Scholar] [CrossRef]
- Zhang, Z.; Wang, X.M.; Zhang, Y.L.; Lü, S.J.; Huang, Z.H.; Huang, X.Y.; Wang, Y.S. Ambient air benzene at background sites in China’s most developed coastal regions: Exposure levels, source implications and health risks. Sci. Total Environ. 2015, 511, 792–800. [Google Scholar] [CrossRef]
- Niu, Z.C.; Zhang, H.; Xu, Y.; Liao, X.; Xu, L.; Chen, J.S. Pollution characteristics of volatile organic compounds in the atmosphere of Haicang District in Xiamen City, Southeast China. J. Environ. Monit. 2012, 14, 1145–1152. [Google Scholar] [CrossRef]
- Wang, X.M.; Sheng, G.Y.; Fu, J.M.; Chan, C.Y.; Lee, S.C.; Chan, L.Y.; Wang, Z.S. Urban roadside aromatic hydrocarbons in three cities of the Pearl River Delta, People’s Republic of China. Atmos. Environ. 2002, 36, 5141–5148. [Google Scholar] [CrossRef]
- Zhang, Y.L.; Yang, W.Q.; Simpson, I.; Huang, X.Y.; Yu, J.Z.; Huang, Z.H.; Wang, Z.Y.; Zhang, Z.; Liu, D.; Huang, Z.Z.; et al. Decadal changes in emissions of volatile organic compounds (VOCs) from on-road vehicles with intensified automobile pollution control: Case study in a busy urban tunnel in south China. Environ. Pollut. 2018, 233, 806–819. [Google Scholar] [CrossRef]
- Barletta, B.; Meinardi, S.; Sherwood Rowland, F.; Chan, C.-Y.; Wang, X.; Zou, S.; Yin Chan, L.; Blake, D.R. Volatile organic compounds in 43 Chinese cities. Atmos. Environ. 2005, 39, 5979–5990. [Google Scholar] [CrossRef]
- Zhang, Z.; Zhang, Y.L.; Wang, X.M.; Lü, S.J.; Huang, Z.H.; Huang, X.Y.; Yang, W.Q.; Wang, Y.S.; Zhang, Q. Spatiotemporal patterns and source implications of aromatic hydrocarbons at six rural sites across China’s developed coastal regions. J. Geophys. Res. -Atmos. 2016, 121, 6669–6687. [Google Scholar] [CrossRef]
- Barletta, B.; Meinardi, S.; Simpson, I.J.; Zou, S.; Sherwood Rowland, F.; Blake, D.R. Ambient mixing ratios of nonmethane hydrocarbons (NMHCs) in two major urban centers of the Pearl River Delta (PRD) region: Guangzhou and Dongguan. Atmos. Environ. 2008, 42, 4393–4408. [Google Scholar] [CrossRef]
- Kumar, A.; Singh, D.; Kumar, K.; Singh, B.B.; Jain, V.K. Distribution of VOCs in urban and rural atmospheres of subtropical India: Temporal variation, source attribution, ratios, OFP and risk assessment. Sci. Total Environ. 2018, 613–614, 492–501. [Google Scholar] [CrossRef]
- Wang, W.J.; Yan, Y.Z.; Fang, H.; Li, J.; Zha, S.P.; Wu, T. Volatile organic compound emissions from typical industries: Implications for the importance of oxygenated volatile organic compounds. Atmos. Pollut. Res. 2023, 14, 101640. [Google Scholar] [CrossRef]
- Mo, Z.W.; Shao, M.; Lu, S.H. Compilation of a source profile database for hydrocarbon and OVOC emissions in China. Atmos. Environ. 2016, 143, 209–217. [Google Scholar] [CrossRef]
- Ou, J.M.; Zheng, J.Y.; Li, R.R.; Huang, X.B.; Zhong, Z.M.; Zhong, L.J.; Lin, H. Speciated OVOC and VOC emission inventories and their implications for reactivity-based ozone control strategy in the Pearl River Delta region, China. Sci. Total Environ. 2015, 530–531, 393–402. [Google Scholar] [CrossRef]
- Zheng, J.Y.; Shao, M.; Che, W.W.; Zhang, L.J.; Zhong, L.J.; Zhang, Y.H.; Streets, D. Speciated VOC Emission Inventory and Spatial Patterns of Ozone Formation Potential in the Pearl River Delta, China. Environ. Sci. Technol. 2009, 43, 8580–8586. [Google Scholar] [CrossRef]
- Giglio, L.; Csiszar, I.; Justice, C.O. Global distribution and seasonality of active fires as observed with the Terra and Aqua Moderate Resolution Imaging Spectroradiometer (MODIS) sensors. J. Geophys. Res.-Atmos. 2006, 111, G02016. [Google Scholar] [CrossRef]
- Van der Werf, G.R.; Randerson, J.T.; Giglio, L.; Gobron, N.; Dolman, A.J. Climate controls on the variability of fires in the tropics and subtropics. Glob. Biogeochem. Cycles 2008, 22, GB3028. [Google Scholar] [CrossRef]
- Crutzen, P.J.; Andreae, M.O. Biomass burning in the tropics: Impact on atmospheric chemistry and biogeochemical cycles. Science 1990, 250, 1669–1678. [Google Scholar] [CrossRef]
- Andreae, M.O. Emission of trace gases and aerosols from biomass burning—An updated assessment. Atmos. Chem. Phys. 2019, 19, 8523–8546. [Google Scholar] [CrossRef]
Disclaimer/Publisher’s Note: The statements, opinions and data contained in all publications are solely those of the individual author(s) and contributor(s) and not of MDPI and/or the editor(s). MDPI and/or the editor(s) disclaim responsibility for any injury to people or property resulting from any ideas, methods, instructions or products referred to in the content. |
© 2024 by the authors. Licensee MDPI, Basel, Switzerland. This article is an open access article distributed under the terms and conditions of the Creative Commons Attribution (CC BY) license (https://creativecommons.org/licenses/by/4.0/).